Article

Assessment of Ecological Assets for Sustainable Regional Development: A Case Study of Deqing County, China

1
School of Geographical Science, Nanjing Normal University, Nanjing 210023, China
2
Jiangsu Center for Collaborative Innovation in Geographical Information Resource Development and Application, Nanjing 210023, China
3
Key Laboratory of Virtual Geographic Environment (Nanjing Normal University), Ministry of Education, Nanjing 210023, China
4
Key Laboratory of Beibu Gulf Environmental Change and Resources Utilization under Ministry of Education, Guangxi Teachers Education University, 175 Mingxiudonglu Road, Nanning 530001, China
*
Authors to whom correspondence should be addressed.
Sustainability 2017, 9(6), 939; https://doi.org/10.3390/su9060939
Submission received: 8 April 2017 / Revised: 29 April 2017 / Accepted: 30 May 2017 / Published: 2 June 2017
(This article belongs to the Section Environmental Sustainability and Applications)

Abstract

:
Sustainable development has become a main concern of governments at a variety of levels. Assessing ecological assets, which is significant for the sustainability of human society, plays an important role in measuring the performance of local governments. Using Deqing County in Zhejiang Province as a case study, this paper adapts a county-level indicator assessment of ecological assets and quantifies these indicators using high-resolution data sets. The resulting value of ecological assets in Deqing County accounts for 24.85% of its GDP, which is much higher than other published case studies across China. Through contrasting per capita valuation of ecological assets and per capita enterprise taxation at township level, this paper has classified all townships into four categories, each of which has varied implications for the local development strategy from the perspective of sustainability. This study implies that the integration of the valuation of ecological assets into the measurement of political performance at the lowest township level enables the provision of quantitative evidence to enhance sustainable development at local (county) level.

1. Introduction

In the past few decades, China has experienced unprecedented urbanization. It is predicted that urban populations in China will increase to over 1 billion inhabitants and there will be 8 megacities, each with a total population of over 10 million, by 2025 [1]. China’s total GDP has increased from 364.52 billion yuan RenMinBi (RMB) in 1990 to 40.12 trillion yuan RMB in 2010, its GDP per capita also increased from 381 yuan RMB in 1990 to 29,992 yuan RMB in 2010 [2]. China, as the fastest developing country, is a resource-demanding economy. The total energy consumption was 3.25 billion tonnes of standard coal in 2010, which was 6-fold higher than the 0.57 billion tonnes in 1978 [3]. The per capita arable land resource in China is 734 m2 in 2010, which is about 40% of the world’s average value [2]. However, the rapid transition from rural to urban has led to massive environmental degradation (e.g., soil erosion, desertification and air/water pollution) and ecological disruption (e.g., extensive losses of arable and wet land, reduction in biodiversity and water quality deterioration) [4]. Sustainable development has become a main concern of governments at a variety of levels, such as how to achieve higher economic development at a lower resource and environment costs at province, county and city levels, which have promoted the introduction of the concepts of Eco-province, Eco-county, Eco-city and related standards [1]. As early as 1995, the State Environmental Planning Agency (SEPA) issued “Guidelines for Building National Eco-Demonstration Communities (1996–2050)”, within which the concept of “Eco-community” was first officially proposed. An example hierarchical structure of administrative units in China as shown in Figure 1 includes province, county and town/townships. County, as a basic spatial statistical unit for reporting social and economic achievements, is a crucial administrative unit for policy-making. For example, Dong et al. (2015) argued that development integrating tourism together with concerns about sustainability and conservation of ethnic cultures is the best approach to sustainable development of Shangri-La County [5]. In other case studies, Eco-tourism, an environmentally friendly tourism, has been increasingly integrated into policy making of sustainable development [6,7,8] from township, city to European level (e.g., [9,10,11]). Xie et al. (2015) have highlighted the importance of protecting ecological land and assessed the ecological importance at a county level [12]. Town or township, as the lowest administrative unit in rural China, is responsible for implementing sustainable development policies from county government. As a result, it is imperative to assess the effects of these policy practices at town/township level from the perspective of sustainable development [13]. The sustainability at the county level includes requirements for both the balance between economic development and ecological environment protection and the spatial equality between the towns and townships. The latter (spatial inequality) has been mostly studied above county level [14], and rarely at township level. The role of town and township in the county development has been highlighted in many studies. For example, using case studies from English towns, Courtney et al. (2007) argued that towns are a sub-pole of growth in local rural economic development while conserving the environmental assets of open countryside [15]. Analysis of these two aspects of sustainability at township level enables an assessment of the regional sustainable development strategies at county level.
Hundreds of indicators and indices have been suggested for measuring sustainable development, e.g., green GDP [16]. Among these indicators, ecological assets have become one of the crucial elements of sustainable development particularly in rural areas. However, views on the definition of ecological assets are not completely consistent, as a comprehensive literature (both international and domestic) review in ecological assets highlighted [17]. All ecosystem resources, including social, economic and natural resources, should be classified into the category of complex ecological assets, in which natural ecological assets consist of five components: land, water, atmosphere, living creatures, and mineral resources [18]. Ecological assets are considered to be a key factor for leading a healthy and prosperous life, and they are significant for the sustainability of human society. The Thirteenth Five-Year Plan for National Economic and Social Development of the People’s Republic of China issued on March 2016 put forward some important development strategies to scientifically plan the spatial pattern of the construction of villages and small towns, farmland protection, village distribution, and ecological conservation [19]. Considering the above-mentioned challenges, this paper is focused on integration of ecological assets valuation with political performance measurement as the main research question is how to reasonably assess the regional sustainable development at a county level. After this introduction, section Two describes the study area and methods of assessing sustainable development at county level including the indicator system of ecological assets valuation and measurement of political performance at township level. Section Three presents analytical results. Section Four provides the general conclusions and implications of the research.

2. Material and Methods
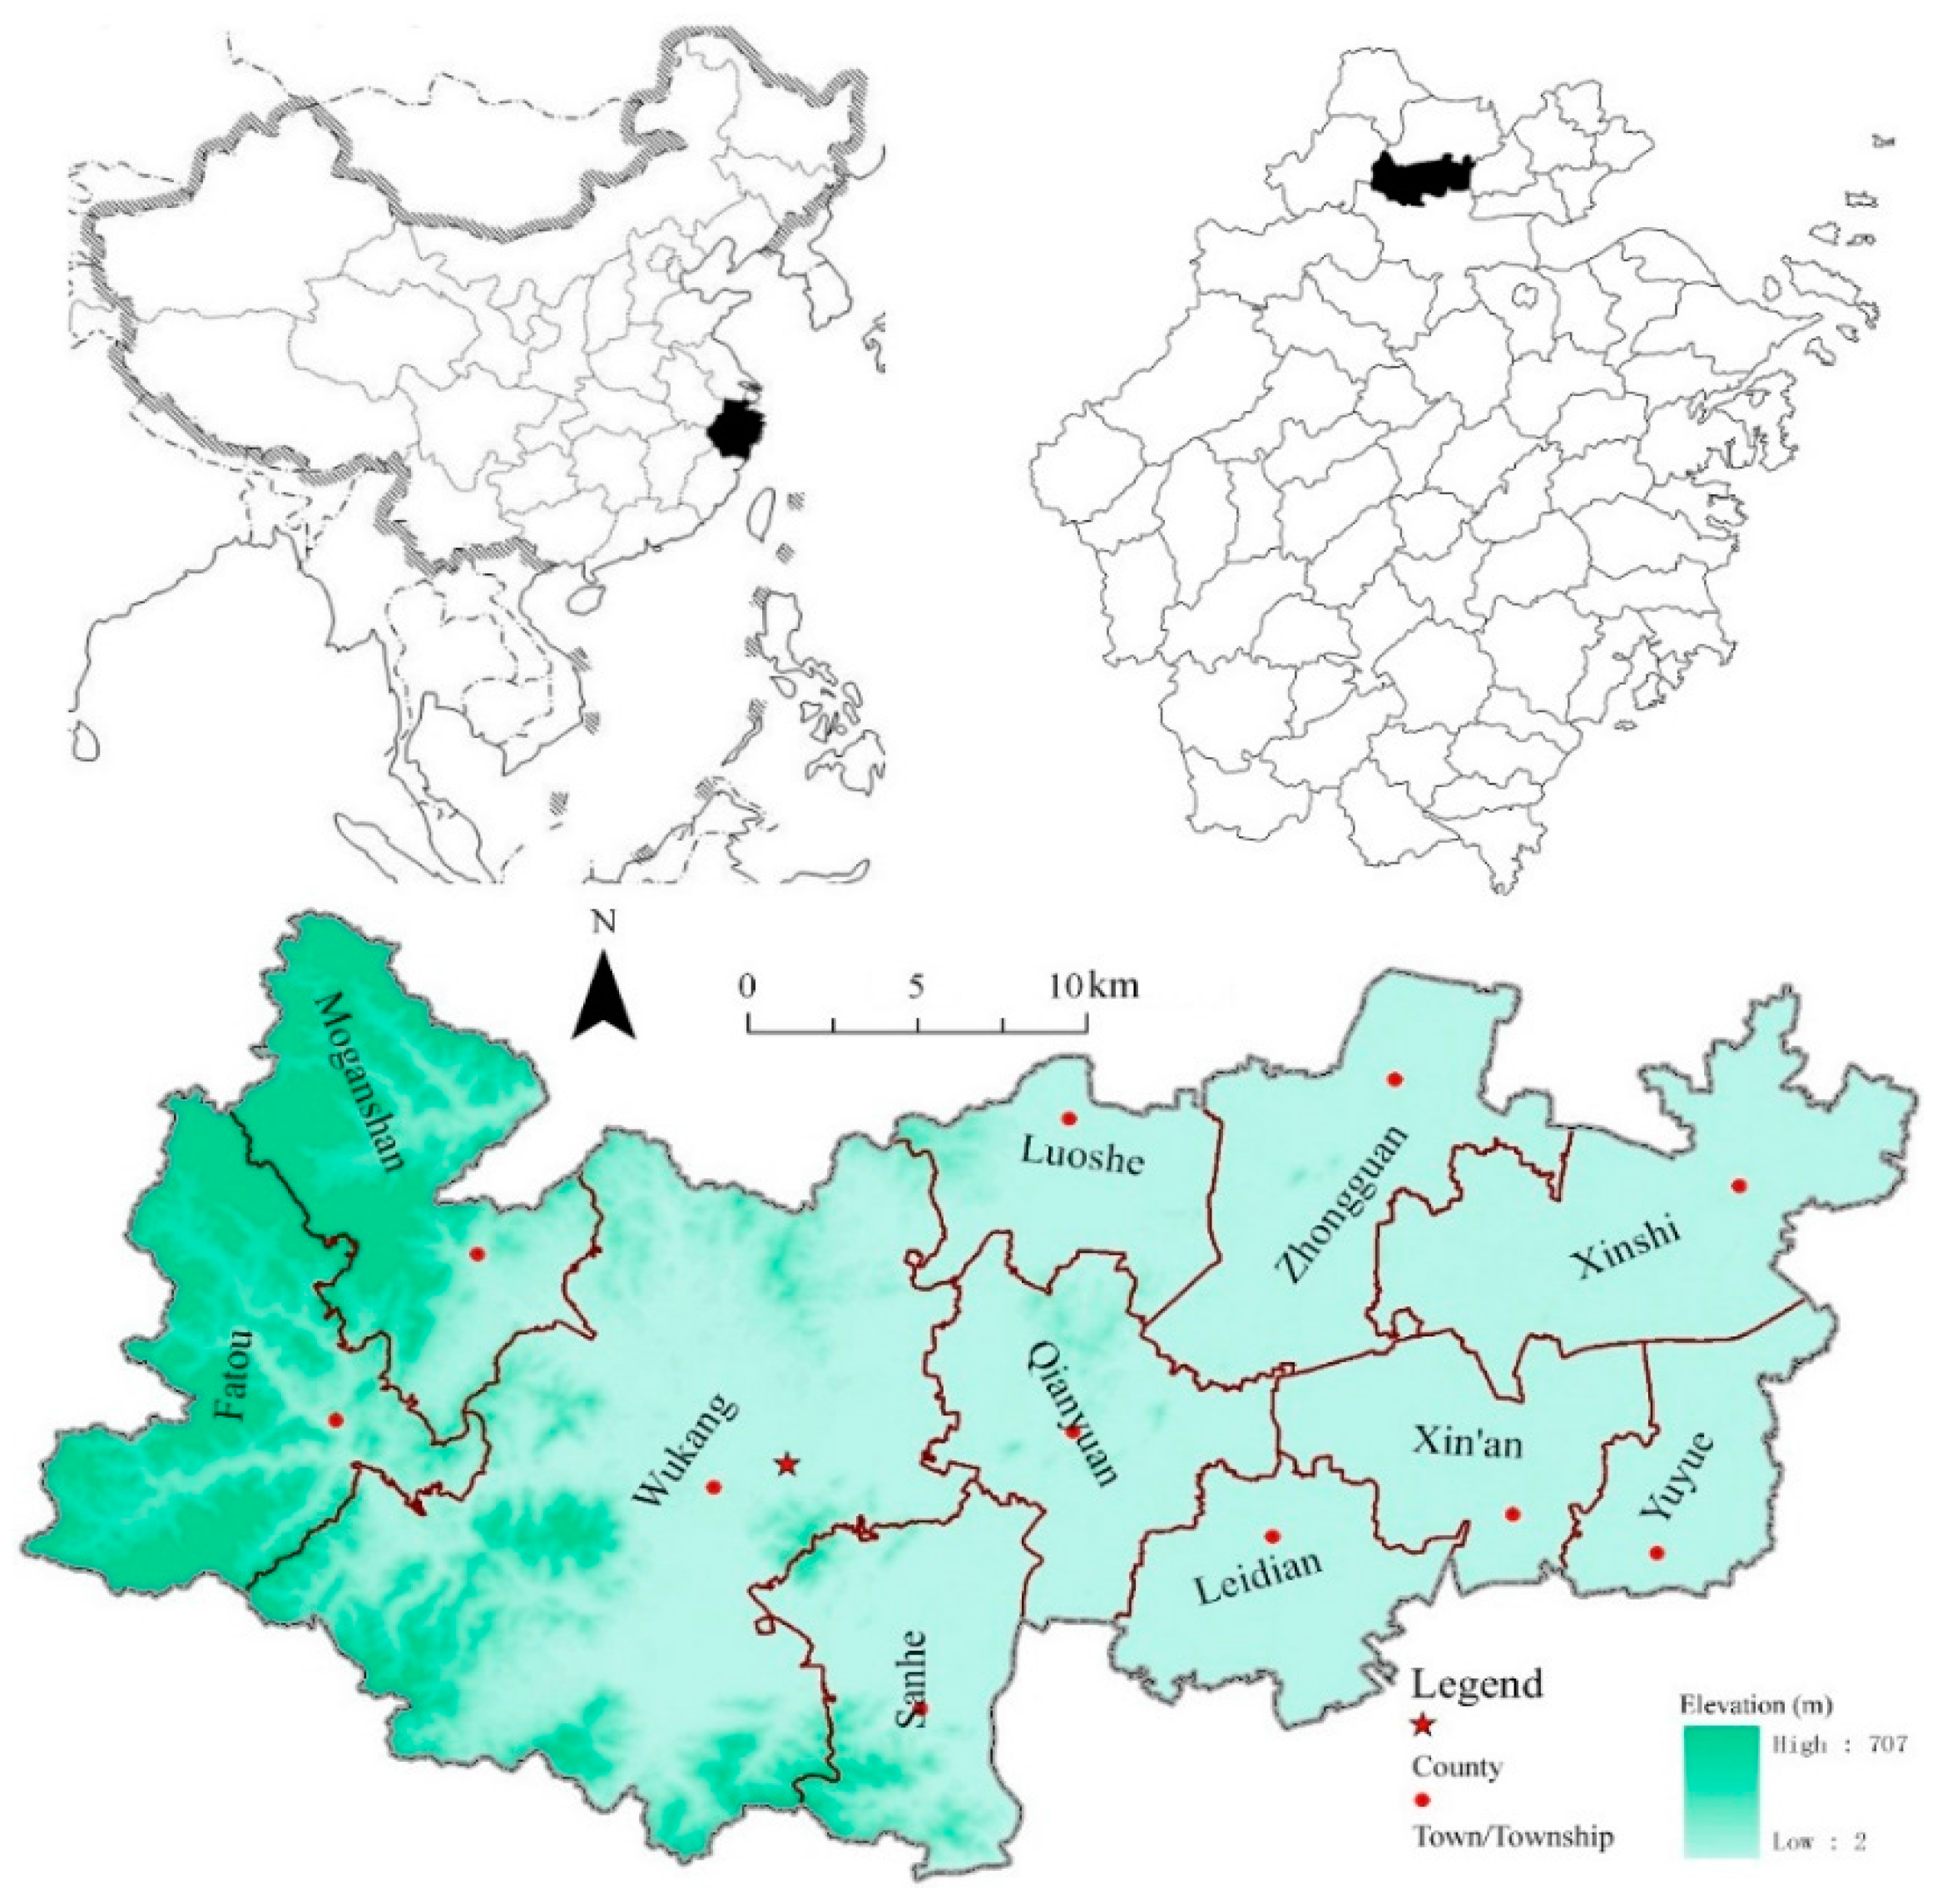
2.1. Study Area

Deqing County is situated in the North of coastal province, Zhejiang, in the West of Yangtze Delta (Figure 1), between latitude 30°261′–30°421′N and longitude 119°451′–120°211′E. Its topography is dominated by hilly areas in the West with the highest elevation at 707 m and a low altitude plateau in the East (Figure 1), with a total area of 935.9 km2. This county is located in a well-developed region, with a total population of 492,000 of which 50.03% (246,000) are urban populations [20]. The county is comprised of 11 towns and townships, and its capital (or county government) is located in Wukang Town and its local economic output value is 30.626 billion Yuan RMB in 2015 [20,21].

2.2. Data Sets

Several data sets covering Deqing County have been collected for this project. The Landsat-8 TM imagery was downloaded from the Scientific Data Center of Yangtze River Delta (http://nnu.geodata.cn:8008/) [22], which is freely accessible to the public. Meteorological data was provided by the Deqing Meteorological Bureau. The administrative boundary of Deqing County, Digital Elevation Model (DEM) and land cover data, were obtained through the first geographical survey [21] by Zhejiang Provincial Bureau of Surveying and Mapping. These geographical data sets including the above-mentioned Meteorological data, DEM, and land cover data, which are not freely available even to academics, were authorized to use through project-based agreement with these data providers. An integrated GIS database was developed in ArcGIS 10.4.1 (ESRI, Redlands, CA, USA), with the Beijing 1954 projection system. GIS raster data was uniformly converted to a 50 m × 50 m grid. Image analysis was applied to calculate the Normalized Difference Vegetation Index (NDVI). DEM was then used for calculating slope and orientation. Statistical data was mainly collated from the Statistical Yearbook of Deqing County in 2015 [20].

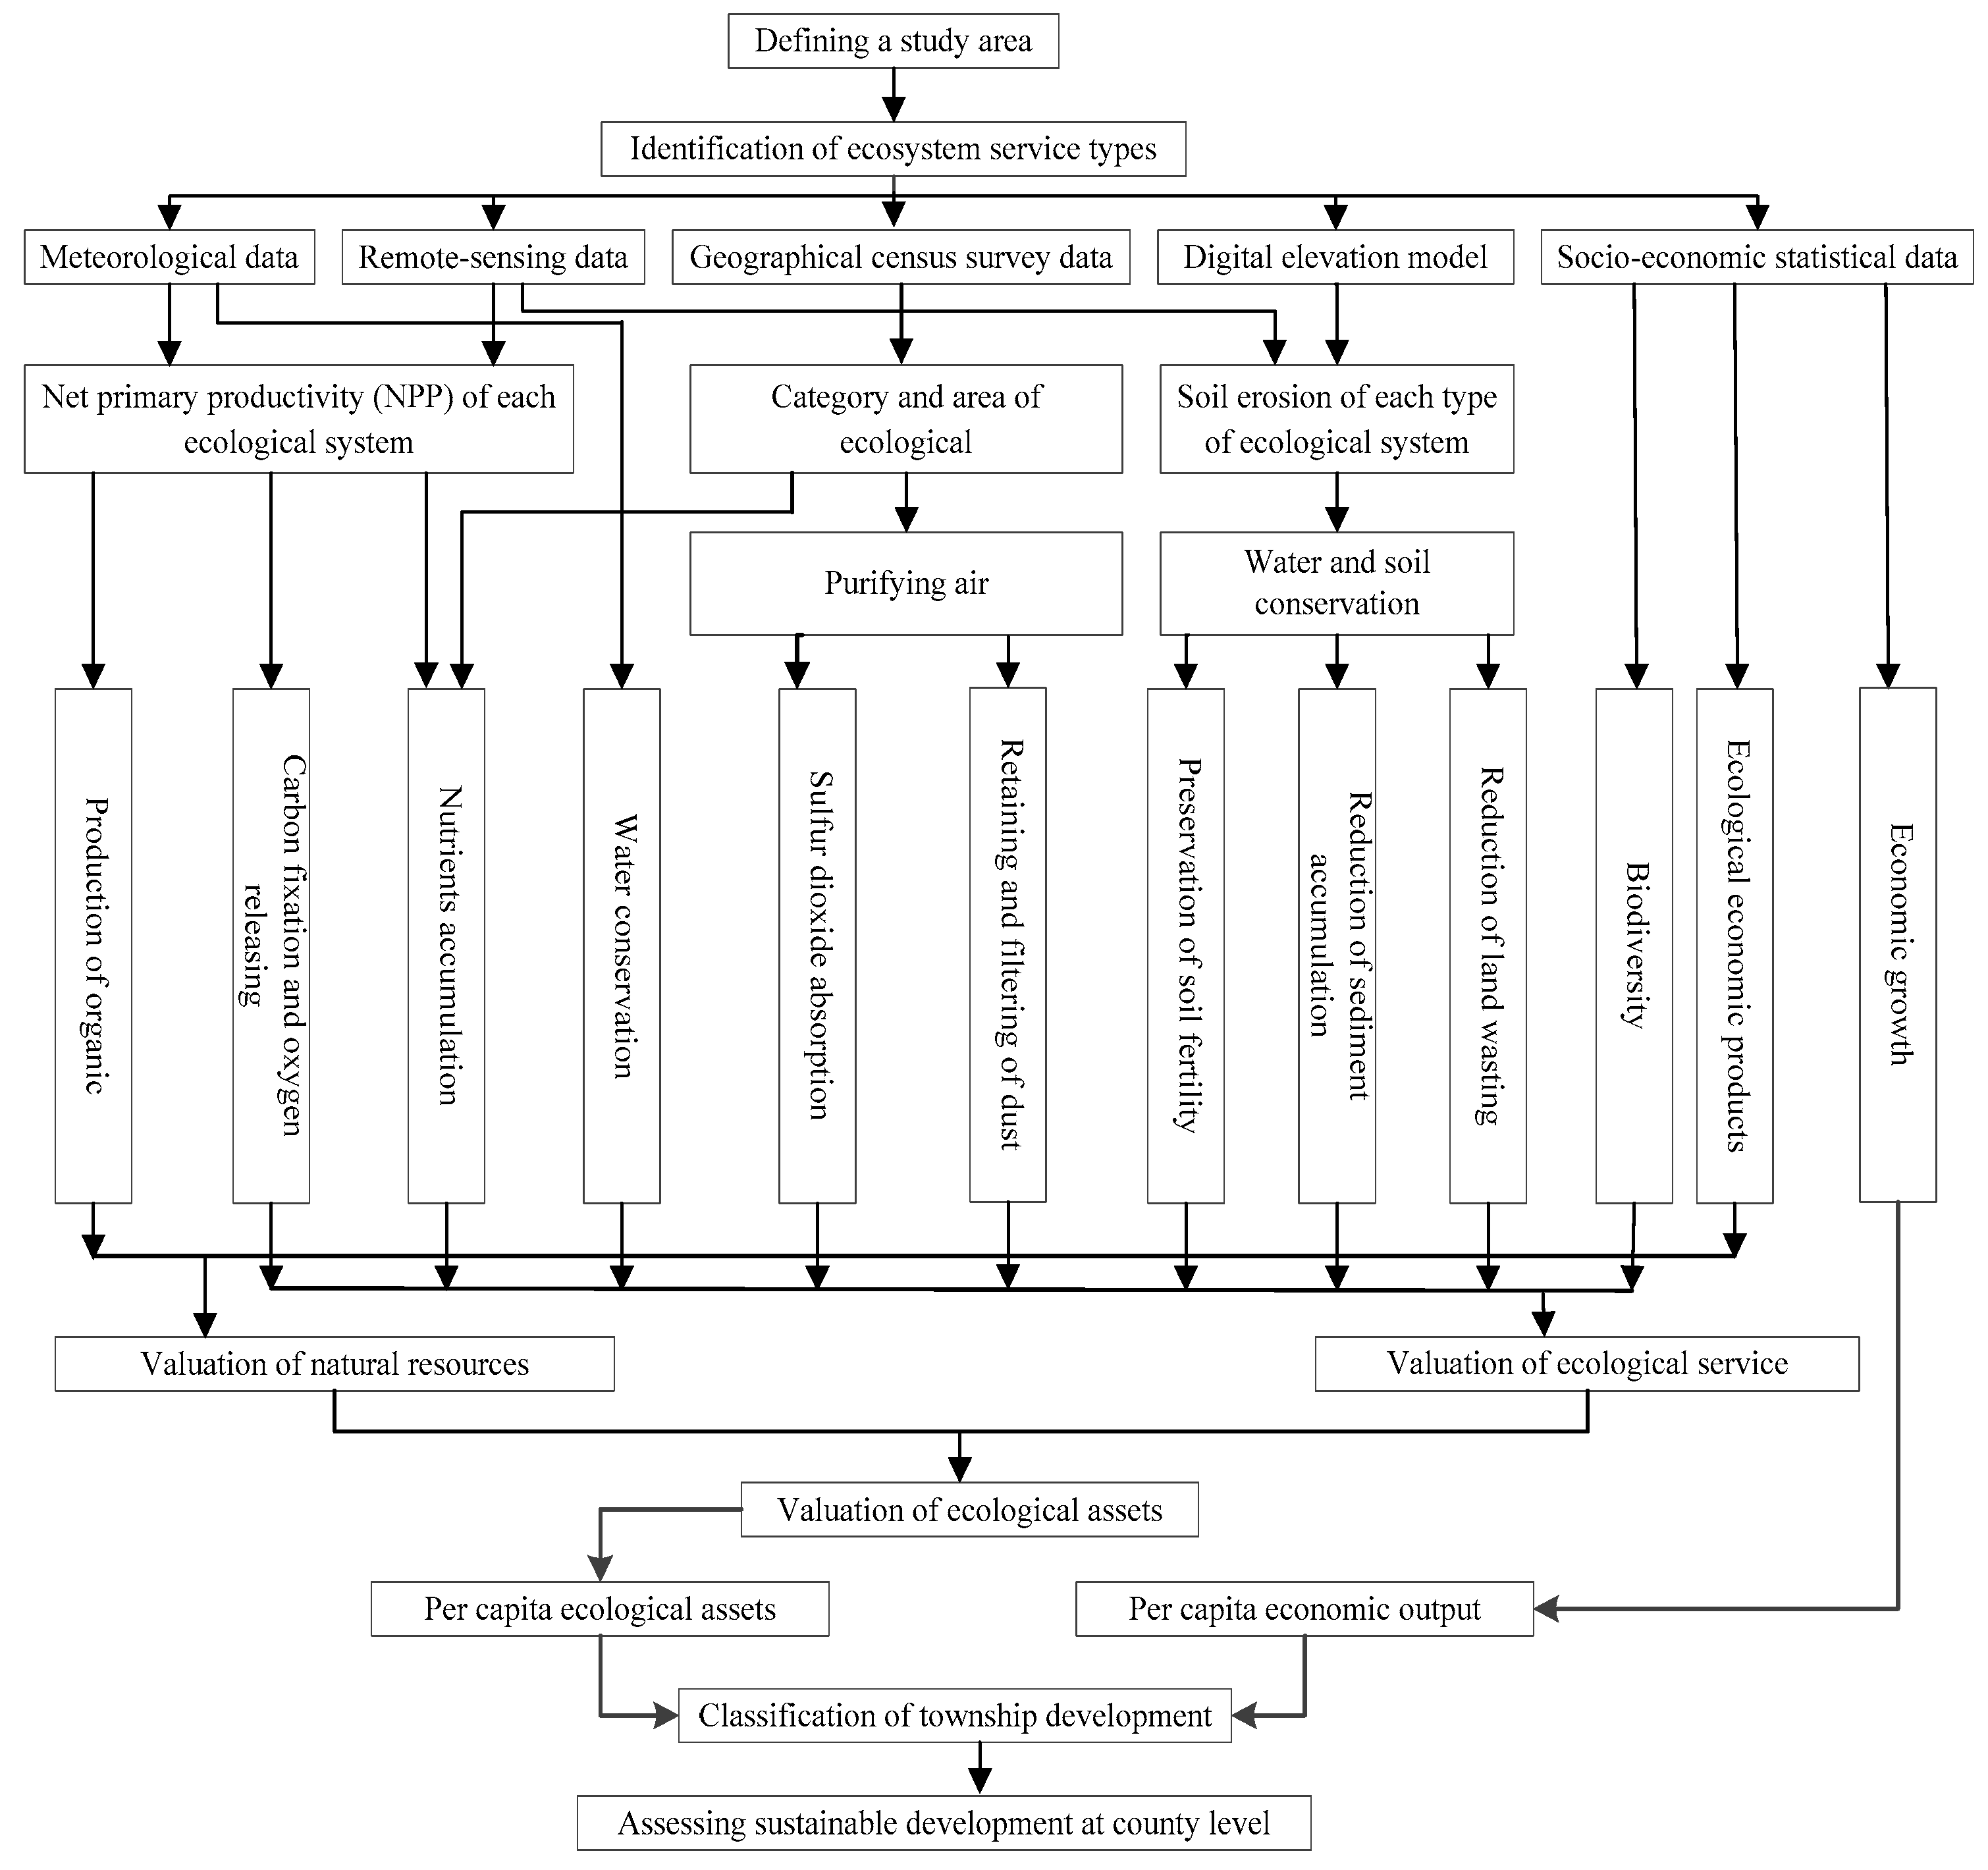
2.3. County-Level Indicators for Valuation of Ecological Assets

Ecosystem services and functions do not necessarily follow a one-to-one relationship, because one ecological function can provide two or more services [23]; for example, local farming not only produces economic crops, but also preserves or conserves water and soil. Therefore, this paper adapted a set of indicators shown in Table 1 for valuing ecological assets based on the classification system of ecosystem service functions proposed in [24], based on which a methodological diagram for assessing sustainable county development is shown in Figure 2 using the remote sensing, GIS and statistical data [24,25]. In Figure 2, the values of ecological assets are classified into two categories: value of natural resource and value of ecosystem service. The former is a direct service and the latter an indirect service. The summarized ecological asset value at pixel level will be aggregated to town or township, which can be contrasted with the economic output value (e.g., GDP). The classification of towns and townships based on both the per capita ecological asset and per capita GDP enables to assess the sustainable regional development at county level. The detailed process is described in the next sub-sections.

2.4. The valuation of Produced Organic Material

Vegetation can directly absorb and convert the solar energy and produce organic materials. Therefore, the net primary productivity (NPP) is an important measure reflecting the production of organic materials and it indicates the total amount of organic materials produced by the plants within a certain period. The formula of calculating the value of produced organic material of ecological systems is listed as follows (Equations (1) and (2)) [26]:
V n = V n ( x )
V n ( x ) = N P P ( x ) × T ( x )
where V n ( x ) is the value (Yuan) of organic material produced at the pixel location x in each year. N P P ( x ) indicates the organic material produced at the pixel location x in each year (g C). T ( x ) is the value of organic material per unit at the pixel location x (Yuan·g−1 C) (as 320 Yuan/t in accordance with the average price in the spring season of 2007 [27]. V n is the value of yearly produced organic materials in the region. N P P ( x ) is calculated by using the Carnegie-Ames-Stanford Approach (CASA) model of solar energy utilization adapted by Zhu [28]. The value estimation method is the market valuation method, which measures the economic benefits or economic losses resulting from the changes in environmental quality.

2.5. The Valuation of Releasing Oxygen and Storing Carbon

During the photosynthesis of plants, the plants use 28.3 kJ solar energy to absorb 264 g CO2 and 108 g water and produce 180 g glucose and 193 g oxygen, and then the 180 g glucose will be converted to 162 g polysaccharide (cellulose or starch); while the respiratory action is the opposite of photosynthesis [29].
C O 2   ( 264   g ) + H 2 O O 2 ( 103   g ) + glucose   ( 180   g ) polysaccharide   ( 162   g )
In accordance with the photosynthetic equation (Equation (3)), the plants can absorb approximately 1.63 g CO2 and release approximately 1.2 g O2 when accumulating up to 1 g dry matters [30]. 1 g dry matter can be converted to 0.45 g C [31]. According to the proportional relationship between the production of above-mentioned matters and carbon fixation and oxygen releasing, the amount of carbon fixation and oxygen releasing can be determined based on the net primary productivity (NPP). The tax rate price of carbon adopts the Swedish parameter that is 1200 Yuan/t [32]; oxygen releasing price adopts an industrial parameter, which is 1000 Yuan/t calculated from the average oxygen price in spring 2007 provided by the Ministry of Health of China.

2.6. The Valuation of Water Conservation

The areas with flourishing growth of plants have a very good water conservation function. Forest weakens the erosion of rainfall through the interception and absorption of rainfall by three hydrological functional layers: forest canopy, dry branches and fallen leaves, and soil layer. Therefore, the water conservation function of each type of vegetation was calculated differently as follows.
(1) Water conservation function of grassland and wetland vegetation
The water impounding effect of grassland vegetation is selected to measure its water conservation function (Equation (4)) [33].
Q 1 = A g × J 0 × k × ( R 0 R g )
where, Q 1 is the increment of water conservation of grassland vegetation compared to bare land; A g is the area of grassland; J 0 is the annual precipitation; k is the proportion of runoff to the total precipitation in the study area (0.4 and 0.6 for the Northern and Southern areas of Qinling Mountains-Huaihe River respectively) [34]; R 0 is the rainfall runoff rate of bare land under the runoff rainfall condition; R g is the rainfall runoff rate of grassland under the runoff rainfall condition.
(2) Water conservation function of forest vegetation
The water impounding effect of forest vegetation is used to measure its water conservation function (Equation (5)) [35].
Q 2 = 0.55 × A f × J 0 × k × P f
here, Q 2 is the increment of water conservation of forest vegetation compared to bare land; A f is the area of forest vegetation; J 0 is the annual precipitation; k is the proportion of runoff to the total precipitation in the study area (0.4 and 0.6 for the Northern and Southern areas of Qinling Mountains-Huaihe River respectively) [34]; P f is the percentage of forest vegetation coverage.
(3) Water conservation function of farmland
The non-capillary porosity in soil is the place for quick water impounding in soil, which provides temporary water impounding capacity, and quickly discharges water and absorbs the newly infiltrated rainwater, which can reduce the surface runoff accordingly. The non-capillary static water impounding volume is usually used as a benchmark of calculating water impounding volume of forest soil (Equation (6)) [36].
W = h × R × P × M
where, W is the non-capillary water impounding volume (m3/m2); h is the depth of soil layer (0.5 m is used in this paper); R is the non-capillary porosity (%) of soil; P is the precipitation (mm); M is the area of farmland (m2). The non-capillary porosity of soil applies the experimental value of 8.5% obtained by Yang Hengshan et al. from the corn surface soil in the northeast farming-grazing interlocking district [37].
(4) Water conservation function of water body
The water conservation of water body Q 3 is calculated by the difference between precipitation and evaporation.
(5) Estimation of the total quantity and value of water-conservation of water body (Equation (7)):
Total quantity of water conservation :   Q = Q 1 + Q 2 + Q 3 + W
The valuation of water conservation chooses the value equivalent to the reservoir volume in accordance with the alternative engineering method, and the accounting price uses the construction cost of reservoir to impound 1 m3 water. The value of water conservation in 2005 was 6.1107 Yuan/t [32], which was converted to 8.1028 Yuan/t in 2015 according to the CPI indexes during 2005–2015.

2.7. The Valuation of Air Purification

The air purification service of vegetation is mainly reflected in 4 aspects: absorption of dirt, retardation of dust, killing of germs and reduction of noise. The vegetation ensures the maintenance of good living environment and provision of resources for the human beings. SO2 and dust are the main atmospheric pollutants. Vegetation can absorb a certain level of SO2 through the air holes on the leaves and lenticels on the branches. The tomentum, grease and adhesive on the surface of leaves can absorb and retain dust. Therefore, this indicator for air purification focuses on the ability of vegetation to absorb SO2 and filter dust [38].
(1) SO2 absorption
Different types of vegetation have different SO2 absorption abilities due to the difference in the shape and leaf tissue of vegetation. The formula to calculate the SO2 absorption of vegetation is as follows (Equation (8)):
Q s = i Q i × S i
where, Q s is the amount of SO2 absorption of vegetation (t/a); Q i is the ability of SO2 absorption by different types of vegetation (kg/hm2); S t is the area of the i type of vegetation (hm2).
(2) Retaining and filtering of dust
The formula for valuation of retaining and filtering dust is as follows (Equation (9)):
Q D = i Q i × S i
where, Q D is the total amount of dust retained and filtered (t/a); Q i is the capacity of retaining and filtering dust (kg/hm2); S i is the area of the ith type of vegetation (hm2).
(3) Total value of air purification (Equation (10)):
V = Q s × W s × Q D × W D
where, V is the total value of air purification (Yuan/a), Q s is the amount of SO2 absorption by vegetation (t/a), and Q D is the total amount of dust retained and filtered (t/a). Ws is the average cost of controlling, treating and reducing SO2 (Yuan/t), which is calculated to be 1263.13 Yuan/t in accordance with a charge of 6,702,195 Yuan for the discharge of 5,305,907kg SO2 [39]. WD is the average cost of controlling, treating and reducing dust (Yuan/t), which is calculated to be 1.20 Yuan/kg [40]. The charging standard for discharge of general dust is 158 Yuan/t in accordance with the rate of 0.15 Yuan/kg [39].

2.8. The Valuation of Nutrients Accumulation

Ecosystems produce organic materials through photosynthesis, during which, nutrients such as N, P and K in the inorganic environment will be stored in the organisms, and then N, P and K will be transferred to market chemical fertilizer products (diammonium phosphate and potassium chloride) to value the ecological system for nutrients accumulation.
The formula is listed as follows (Equations (11) and (12)) [41]:
V n i = V n i ( x )
V n i ( x ) = N P P ( x ) × r 1 × r 2 / M
where, V n i is the value of annually absorbed elements in the region (Yuan); V n i ( x ) is the value of elements absorbed by the ecosystem in each year at the location x (Yuan); N P P ( x ) is the organic materials (t) produced in each year at the location x; r1 is the distribution rate of the ith element in different ecosystems in the organic materials (g/gC); M is the content of the ith pure element in chemical fertilizer (%); r 2 is the average price of chemical fertilizer (Yuan/t), and r 1 is the value of different types of ecosystems, which refers to the Research Report on the Biodiversity Situation of China (Table 2) [42].
The State Forestry Administration issued and executed a Standard (No. LY/T1721-2008) Specifications for Assessment of Forest Ecosystem Service Functions [32]. In accordance with the specification and the descriptions of market chemical fertilizer products, the nitrogen and phosphorus components of diammonium phosphate, and the potassium component of potassium chloride are 14%, 15.01%, and 50%, respectively. Referring to the average price of chemical fertilizers in recent years listed on the China’s chemical fertilizer website [43] the average price of diammonium phosphate fertilizer and potassium chloride fertilizer are 2400 and 2200 Yuan/t, respectively.

2.9. The Valuation of Soil Conservation

The valuation methods employed for soil conservation are perhaps the most varied across different studies in China [44].
In accordance with the Standard for Classification and Gradation of Soil Erosion [45], the whole country is dominated by three categories of 1st grade soil erosions (water erosion, wind erosion and freeze-thaw erosion). Following the division of 2nd grade areas, Deqing County, in the region with mid-subtropical hilly red soil, is mainly influenced by water erosion. The revised universal soil loss equation (RUSLE) [46,47,48] takes comprehensive account of rainfall, slope, vegetation, soil texture and human disturbance and estimates the average level of annual soil erosion through quantifying these five factors as rainfall erosivity (R), soil erodibility (K), topography (slope length and gradient LS), vegetation coverage factor (C) and water and soil conservation measures (P).
The RUSLE equation is listed as follows (Equation (13)):
A = R × K × L S × C × P
where A represents soil erosion (t/ha/year); the units of R and K are MJ·mm/(hm2·hr·a), t·hm2·hr/(hm2·MJ·mm) respectively; LS is a dimensionless topographic factor; C is a dimensionless vegetation cover factor; and P is a dimensionless conservation practice factor. However, the actual soil erosion considers the influential factors of surface vegetation coverage and land management, and in this case, C = 1 and P = 1. Thereby, the above-mentioned RUSLE is updated to the following formula (Equation (14)):
A p = R × K × L S
Then the soil conservation is calculated as follows (Equation (15)):
A c = A p A r
where, A p is the potential soil erosion per unit area (t/hm2·a); A r is the actual soil erosion per unit area (t/hm2·a); A c is the soil conservation per unit area (t/hm2·a).

2.10. The Valuation of Natural Resources

The valuation of natural resources in the study area of Deqing County is aggregated from the five types of ecological assets: cultivated land, garden, forest land, grassland and water area. The total valuation of ecological assets is based on spatial overlay of all the valued items above.

2.11. Assessment of Regional Sustainable Development at County Level

In order to assess the sustainable development including spatial equality at county level, it is crucial to analyze the spatial distributions of the value of ecological assets and the corresponding economic output at town/township level. The ecological asset per capita is measured as the division of total the ecological asset by the total population in the township. Due to unavailability of data on the per capita GDP at township level across China, tax revenue, an indicator of the national economy, can be used to reflect the local economic growth. Enterprise tax revenue, as an important part of the national tax revenue, can effectively measure the overall economic development locally, in particular the development level of non-agricultural industries. Together with GDP, this indicator is often used as a measure of political performance at township level. To comprehensively analyze the regional development pattern at county level, all towns/townships have been classified into four categories according to the values of per capita ecological asset and per capita enterprise tax revenue. The average value of each indicator is taken as a threshold value, and it is then classified as high (H) if it is above the average and low (L) if it is below the average. This classification results in four categories: HH, HL, LH and LL (where the first letter indicates the per capita ecological asset and the second letter indicates the per capita enterprise tax revenue). This classification enables an assessment of the balance between economic development and ecological environmental protection and their spatial equality across the study area.

3. Results

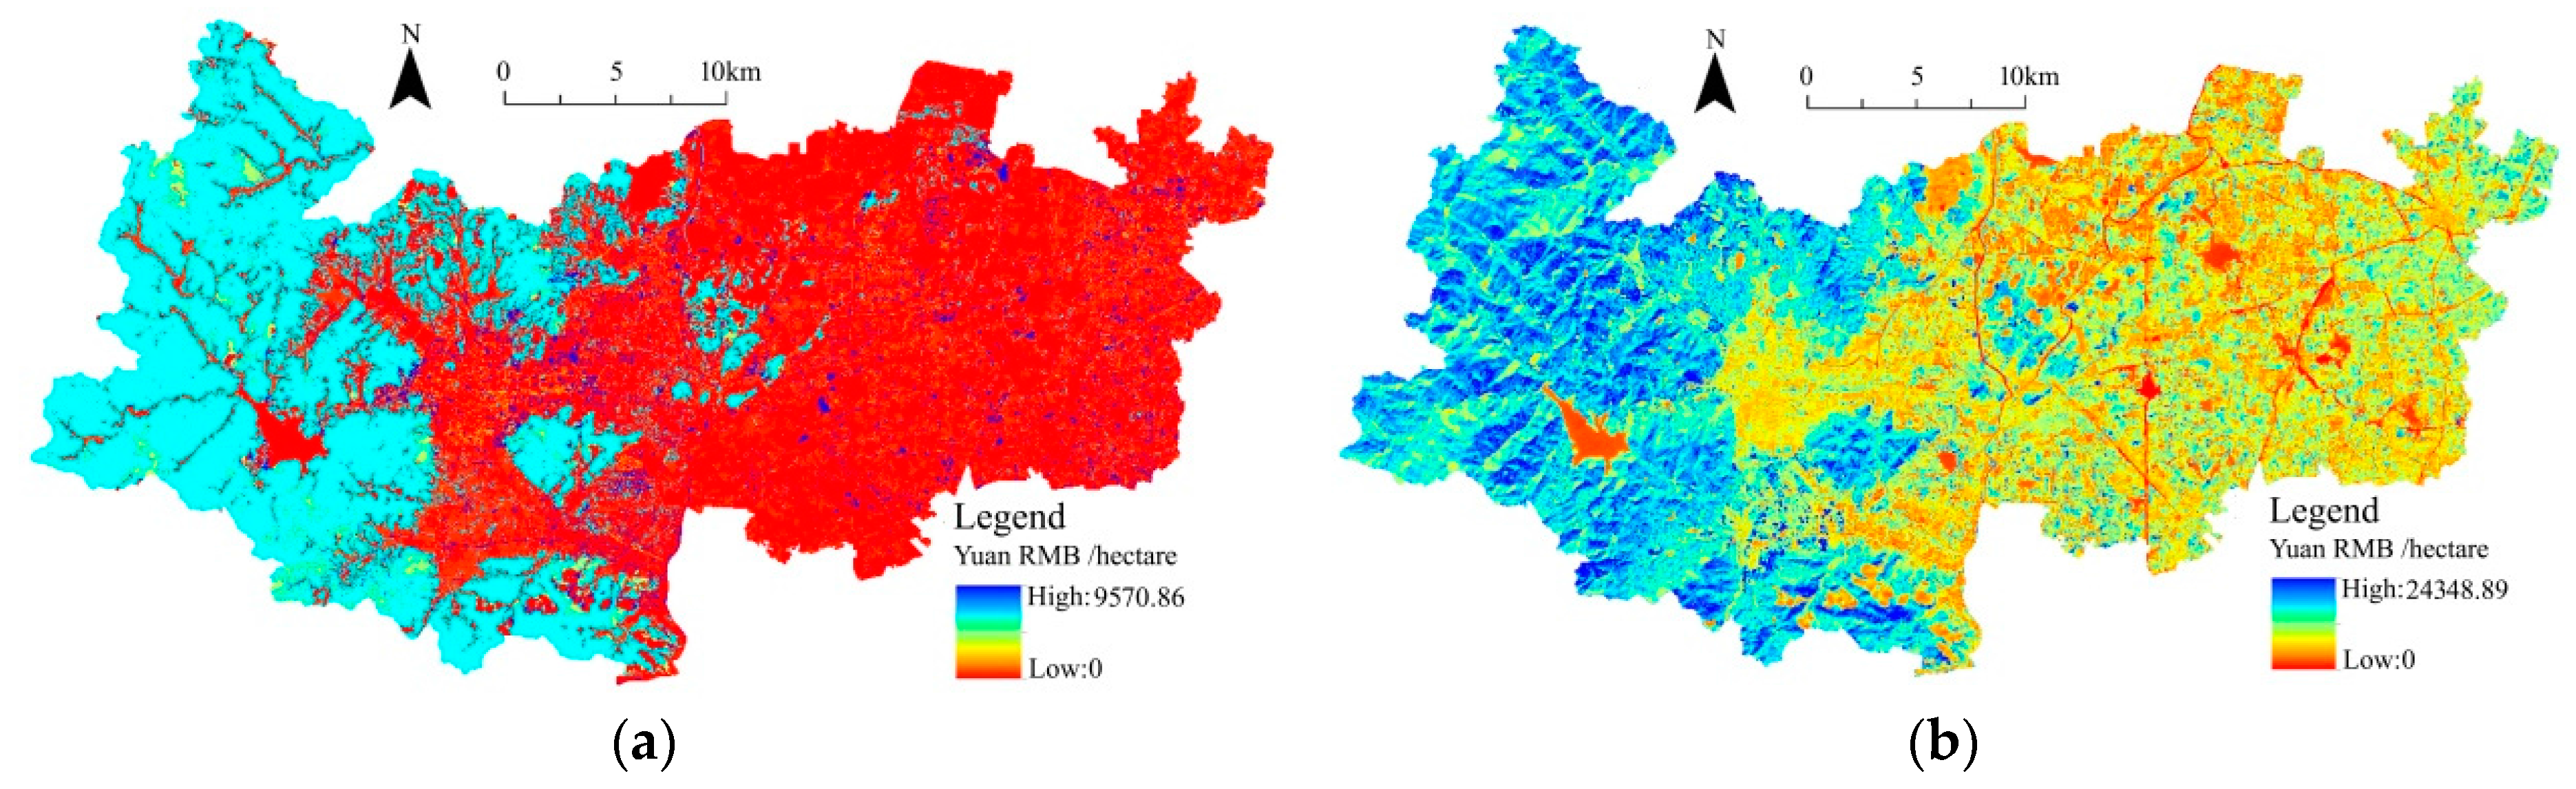
3.1. The Valuation of Produced Organic Material of Ecosystems

The spatial distribution of NPP across Deqing County in 2014, which was calculated by using a CASA model [49], is shown in Figure 3a. The valuation of produced organic material of ecosystems based on the NPP data are shown in Figure 3b. The total value of the produced organic material of the ecosystem is 72,110,000 Yuan RMB in 2014, and the largest value per unit area is 2023.01 Yuan/hectare. Comparing Figure 3a,b, it can be seen that the valuation of produced organic material varies with the vegetation types and changes of spatial distribution of NPP, and the NPP in the west is higher than that in the east. This is because a large area of forests is located in the west of Deqing County, and cultivated land and grassland are distributed in the north and west, while the net primary productivity of forest vegetation is higher than that of the cultivated land and grassland.

3.2. The Valuation of Air Purification and Oxygen Releasing

The SO2 and dust absorbed by air purification are shown in Figure 4a, where the valuation of oxygen releasing was calculated using the carbon tax method and industrial oxygen method is shown in Figure 4b. The valuation for air purification in 2014 reached up to 221,505,900 Yuan RMB, with the value per unit area up to 9570.86 Yuan/hectare. The ecological value for releasing oxygen reached up to 871,346,100 Yuan RMB in 2014, with the highest value per unit area up to 24,348.89 Yuan/hectare, and higher values in the west than that in the east.

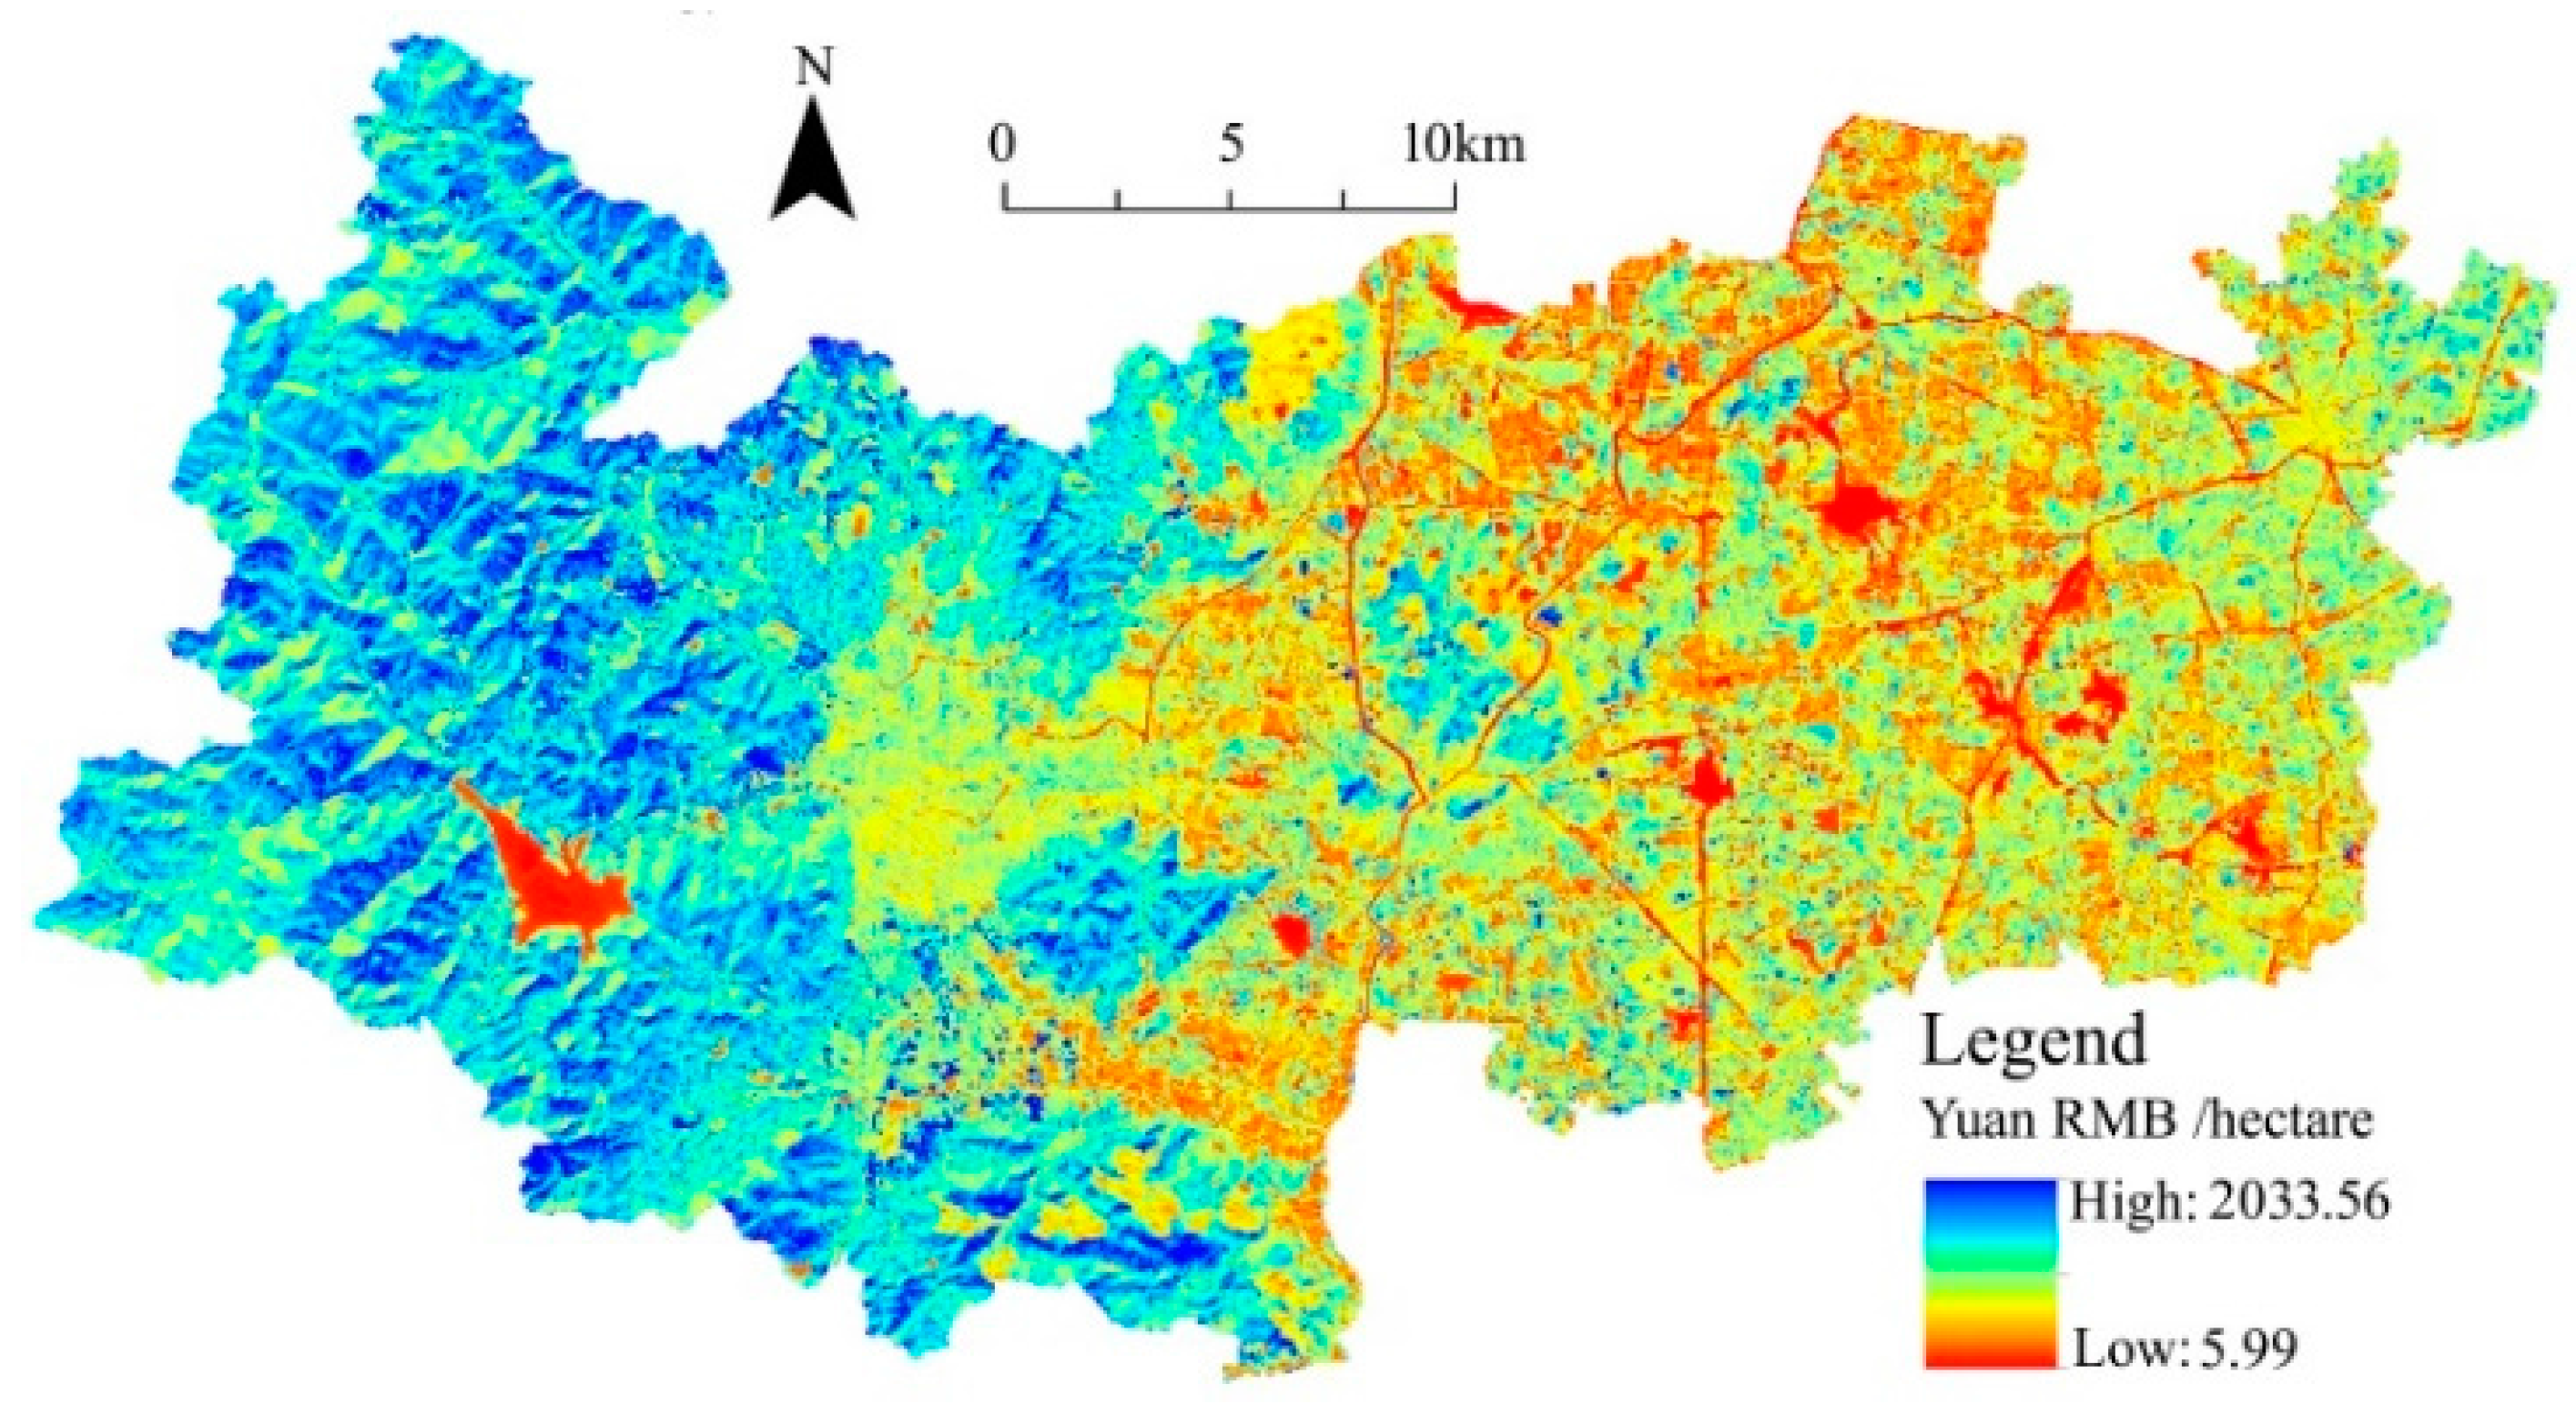
3.3. The Valuation of Water Conservation

The valuation of water conservation of grassland, forest land, farmland and water body, as shown in Figure 5, was calculated based on the precipitation, evaporation and NDVI data as well as the investment price of reservoir construction capacity per unit. The ecological system for water conservation in Deqing County was valued about 3.1 billion Yuan RMB with the largest value per unit area up to 115,748 Yuan/hectare. The conversed water body in the western forest and eastern paddy field is larger than that of the construction land and bare land.

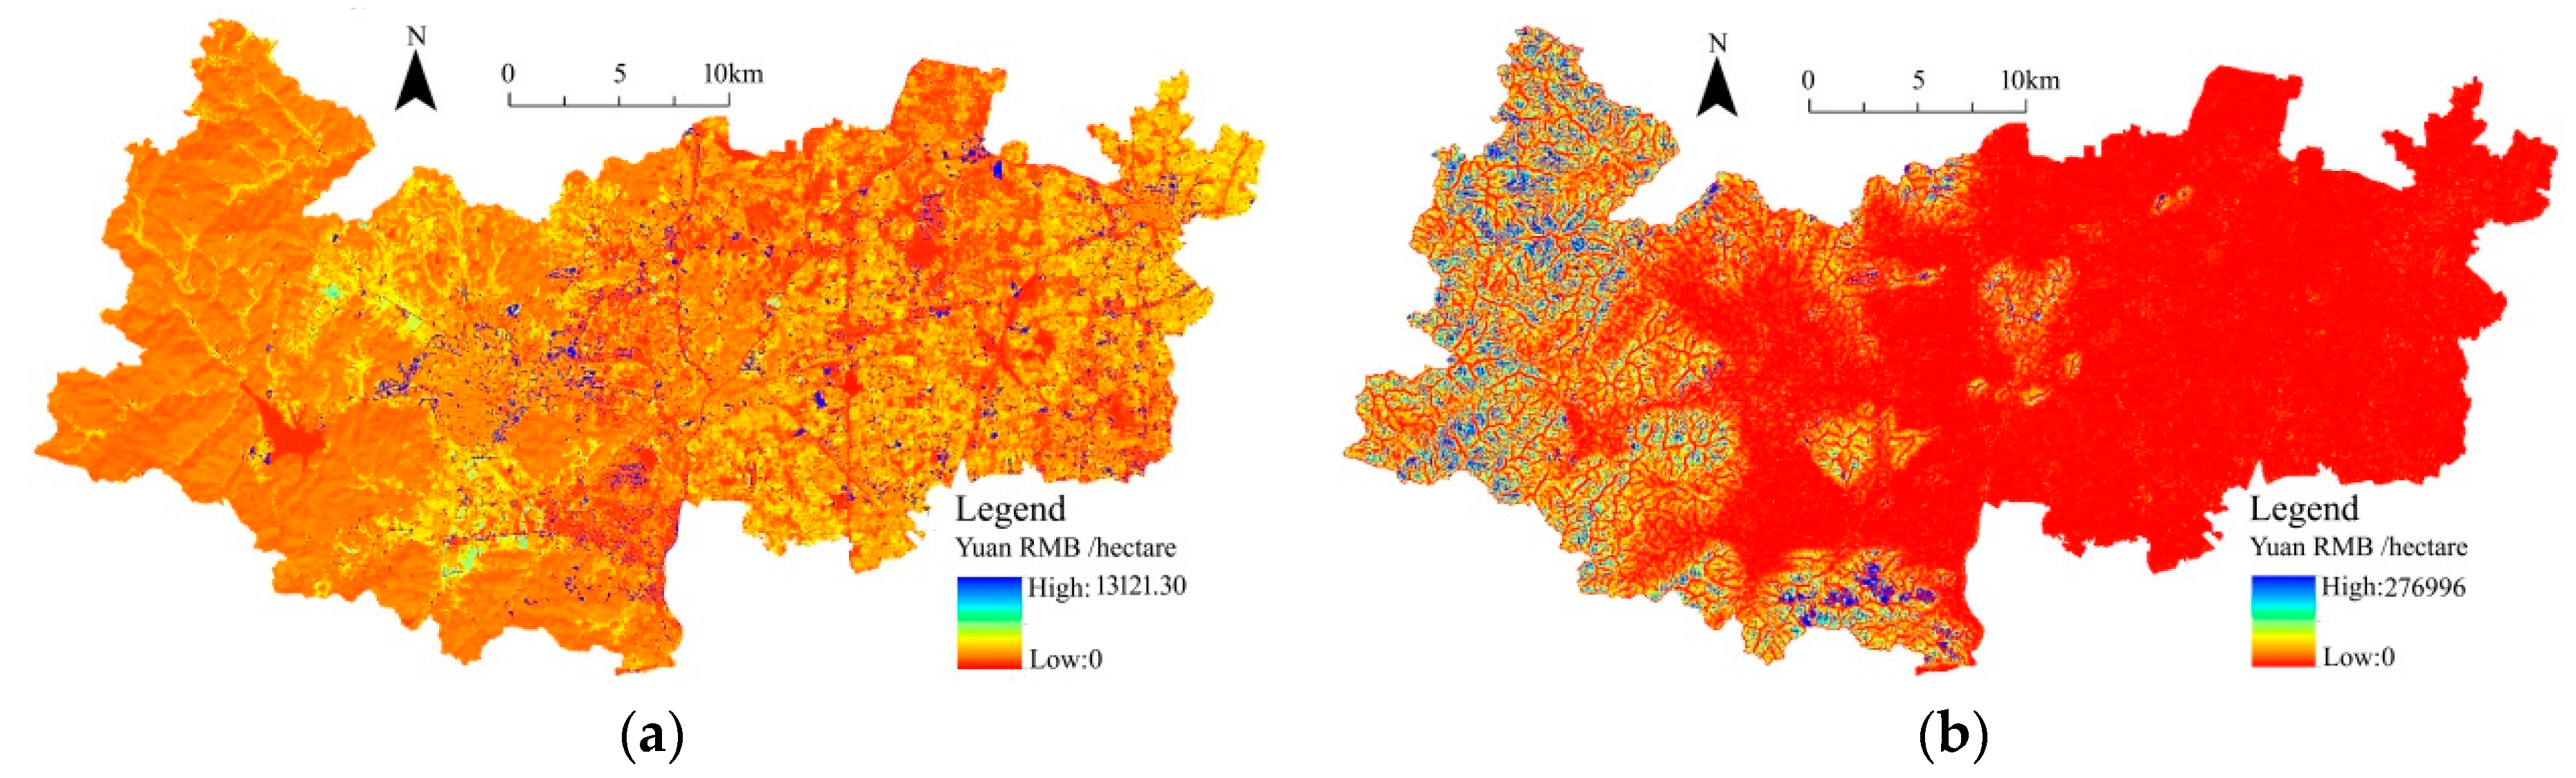
3.4. Soil Conservation and Nutrients Accumulation

As shown in Figure 6a, the ecological value for nutrients accumulation in Deqing County was valued to 49,304,800 Yuan RMB, and the highest value per unit area is 13,121.30 Yuan/hectare, through considering the production of organic materials of different land use systems as well as the storage and accumulation of its nutrient elements. It was calculated based on prices of different elements of market chemical fertilizers by using the market valuation method.
The valuation for soil conservation in Deqing County, as shown in Figure 6b, was valued to 272,153,900 Yuan RMB for 2014. Its spatial distribution is characterized by higher values in the western and partial central areas and lower values in the eastern and central areas. The former has many forests and mountainous areas, which contribute to high amount of vegetation coverage. Conversely, the latter has areas are relatively flat, dominated by farmland and grassland, which therefore contribute to a smaller quantity of water and soil loss, and soil conservation.

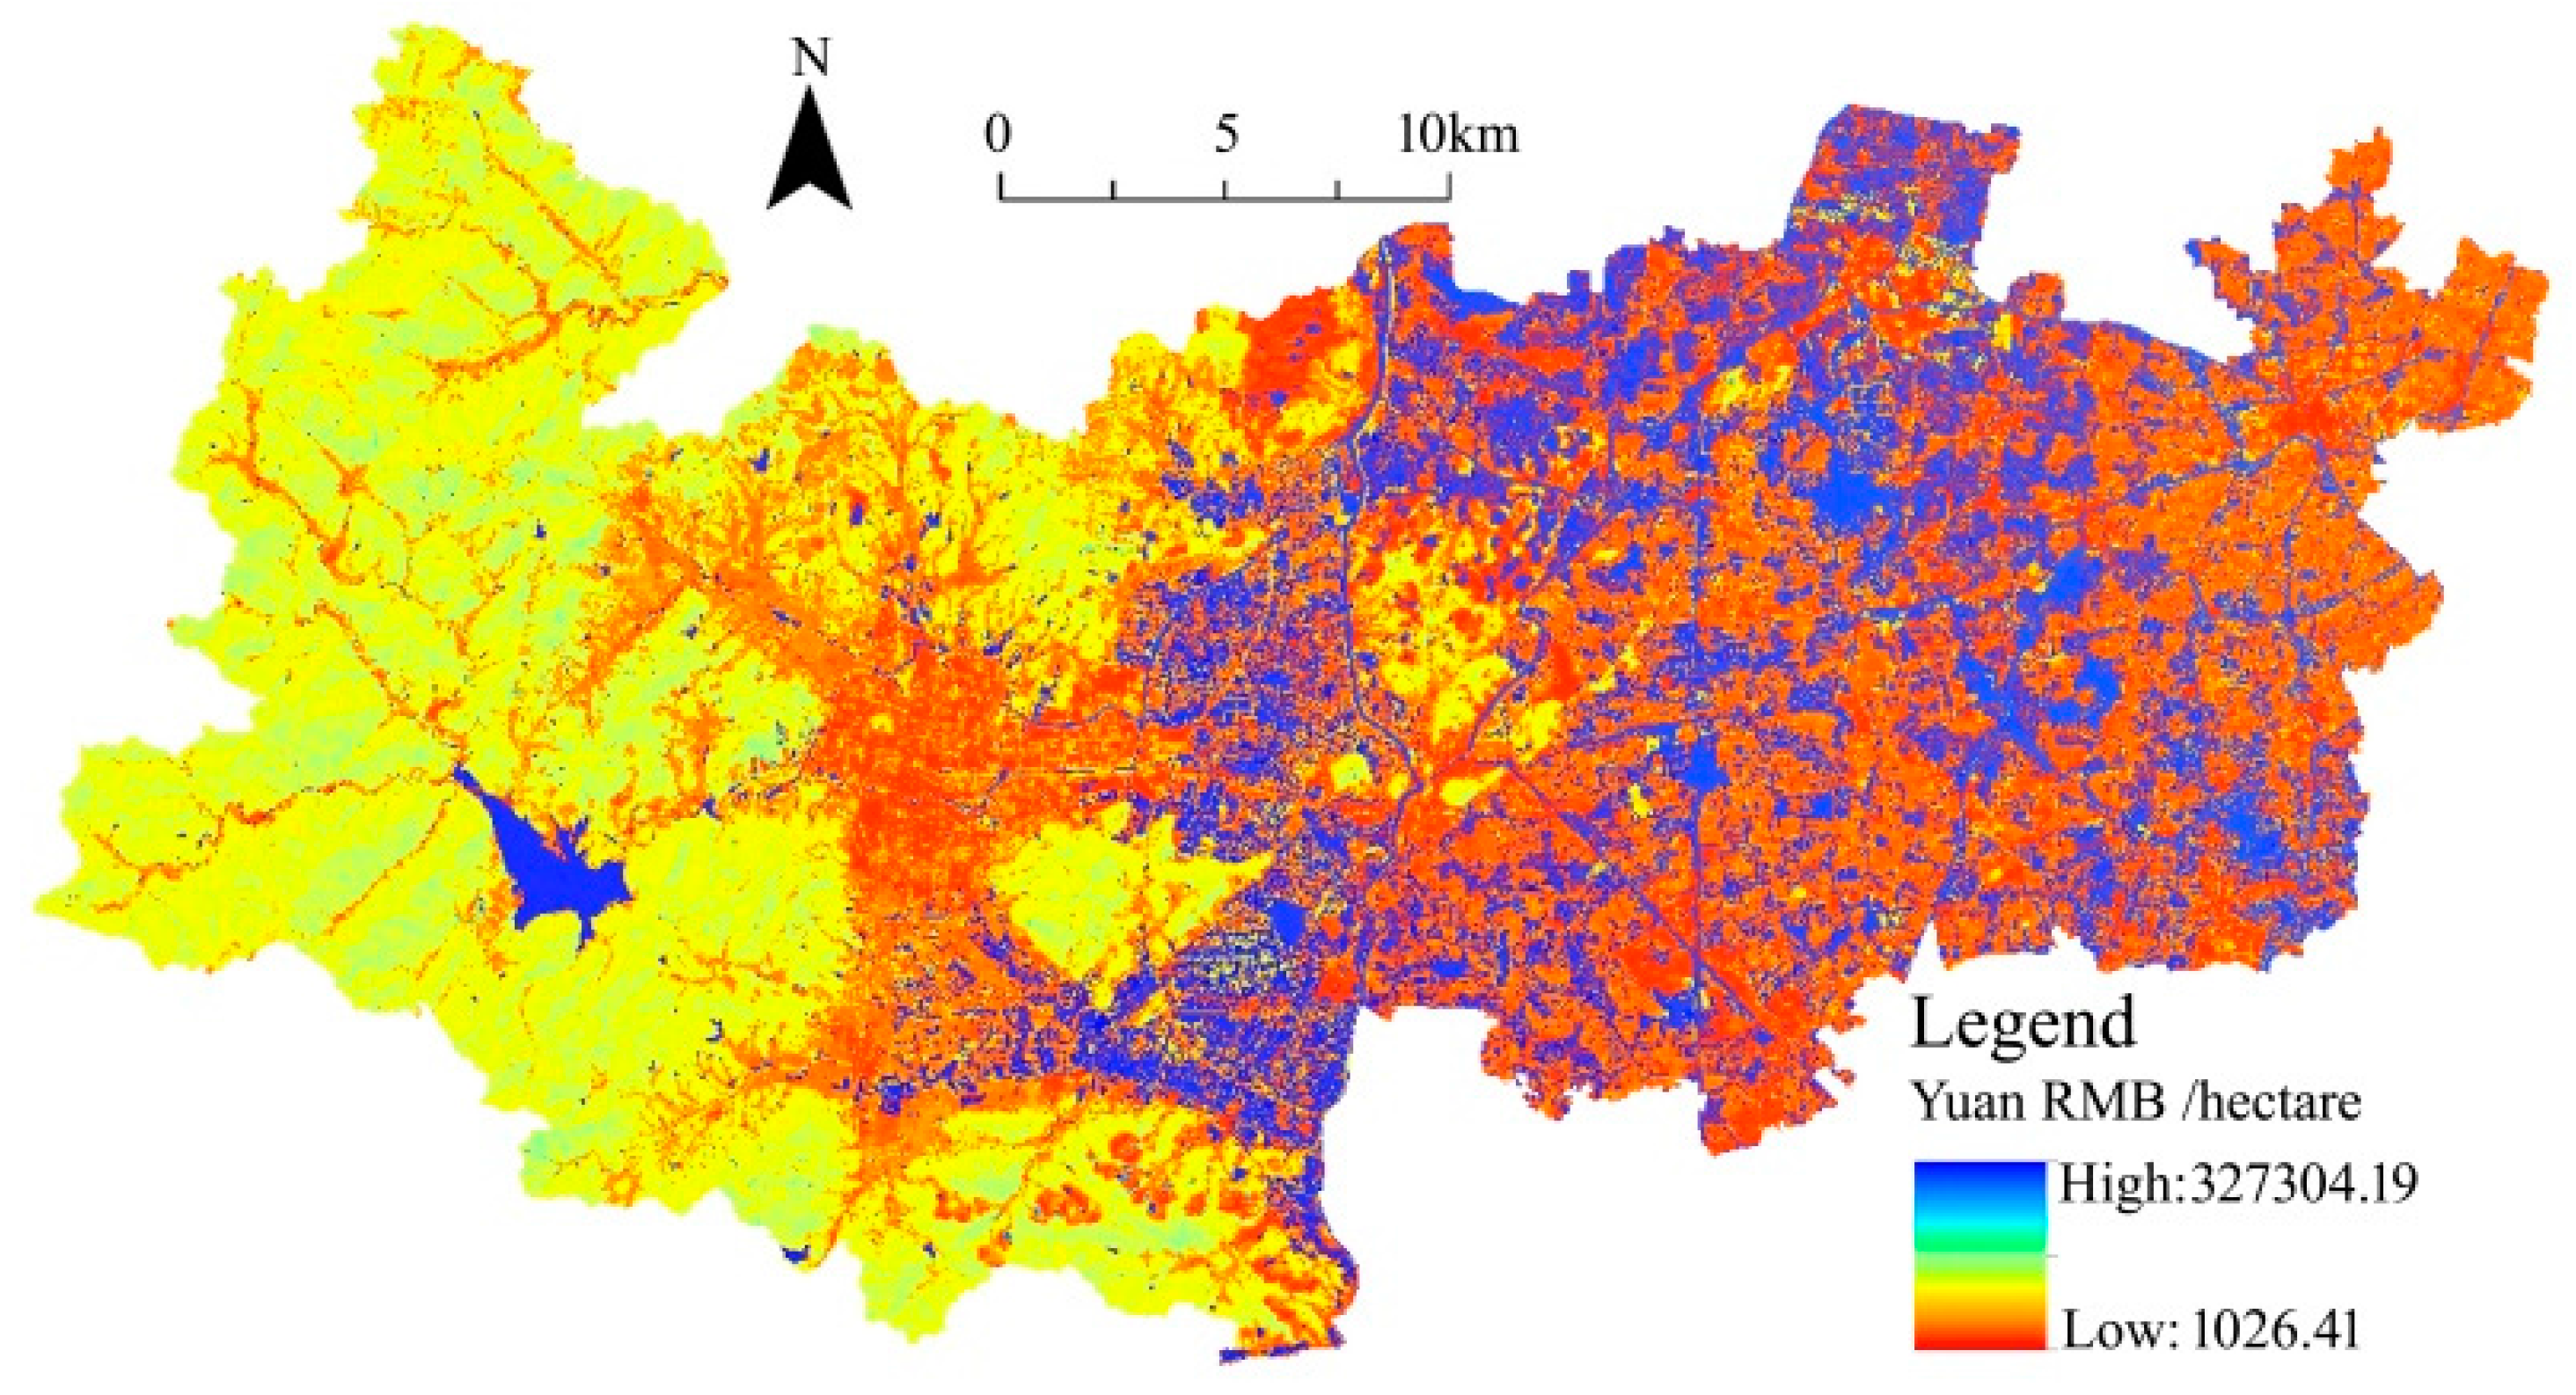
3.5. The valuation of Natural Resources

The natural resource of Deqing County in 2014 was valued to 3719.37 million Yuan RMB with the largest value per unit area of 2033.56 yuan/hectare, as shown in Figure 7. Its spatial distribution is characterized by higher values in the western areas with forest vegetation than in the central and eastern areas with herbaceous vegetation and crops.

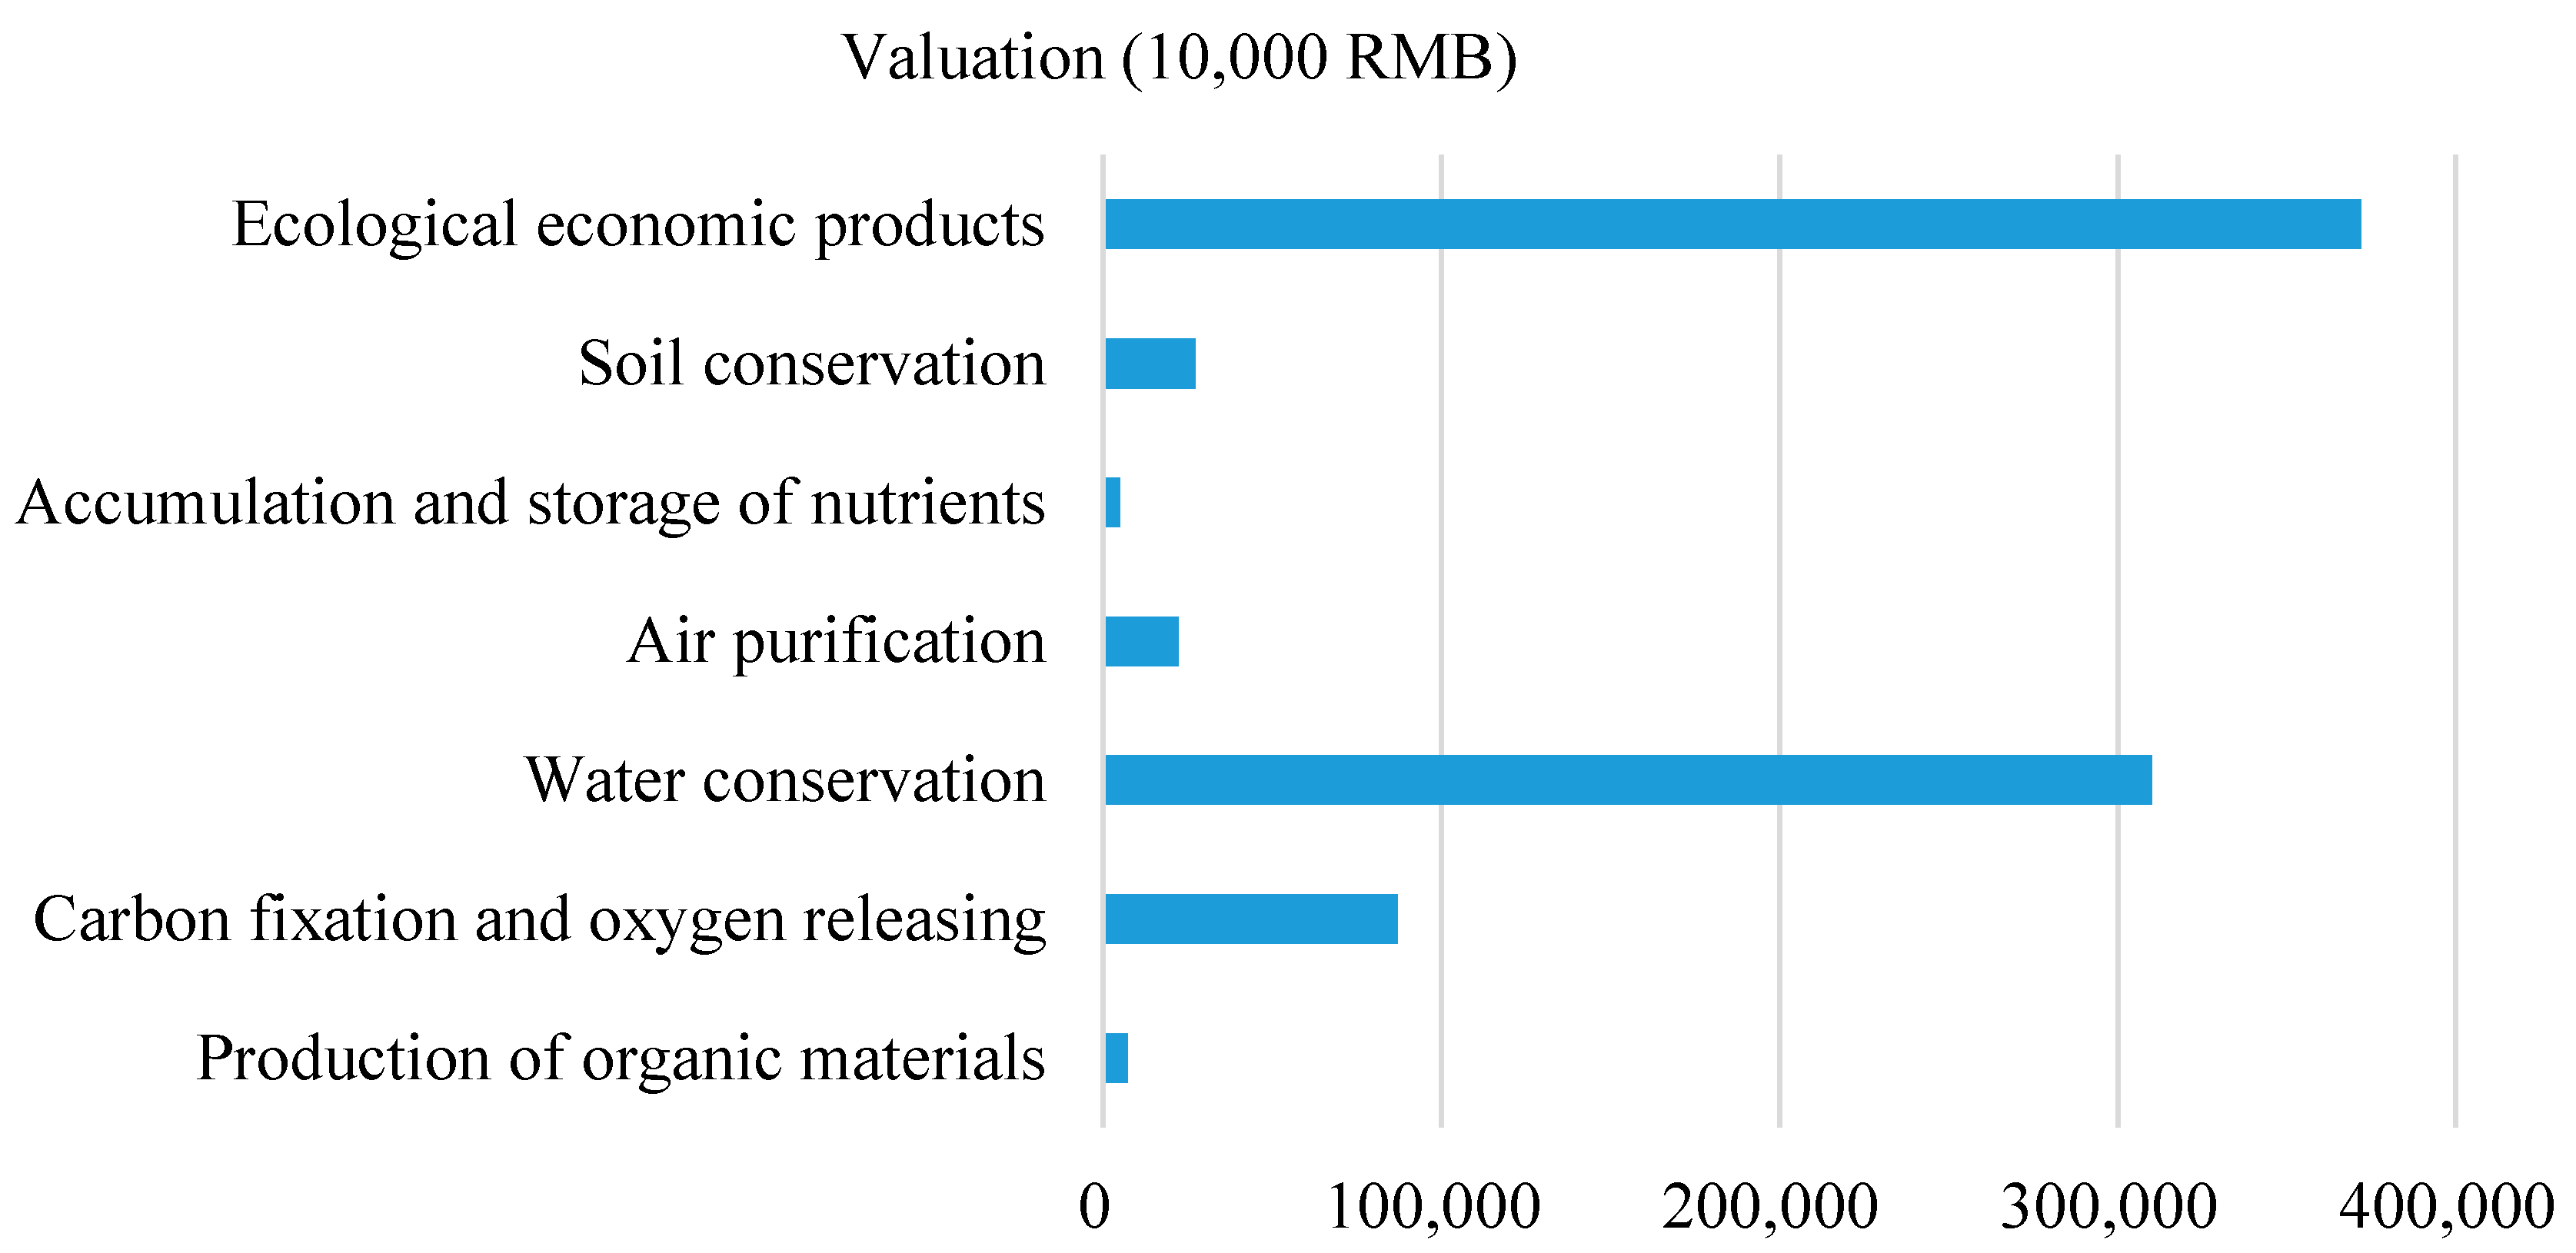
3.6. The Valuation of Ecosystem Services

In accordance with the conceptual frame for ecological assets assessment in Figure 1, the ecological service of Deqing County in 2014 was valued to about 4.587604 billion Yuan RMB with the highest value per unit area of up to 327,304.19 Yuan/hectare (Figure 8). The forest vegetation in the west and the grassland, garden, cultivated land and water body in the central areas have a higher ecological service value.

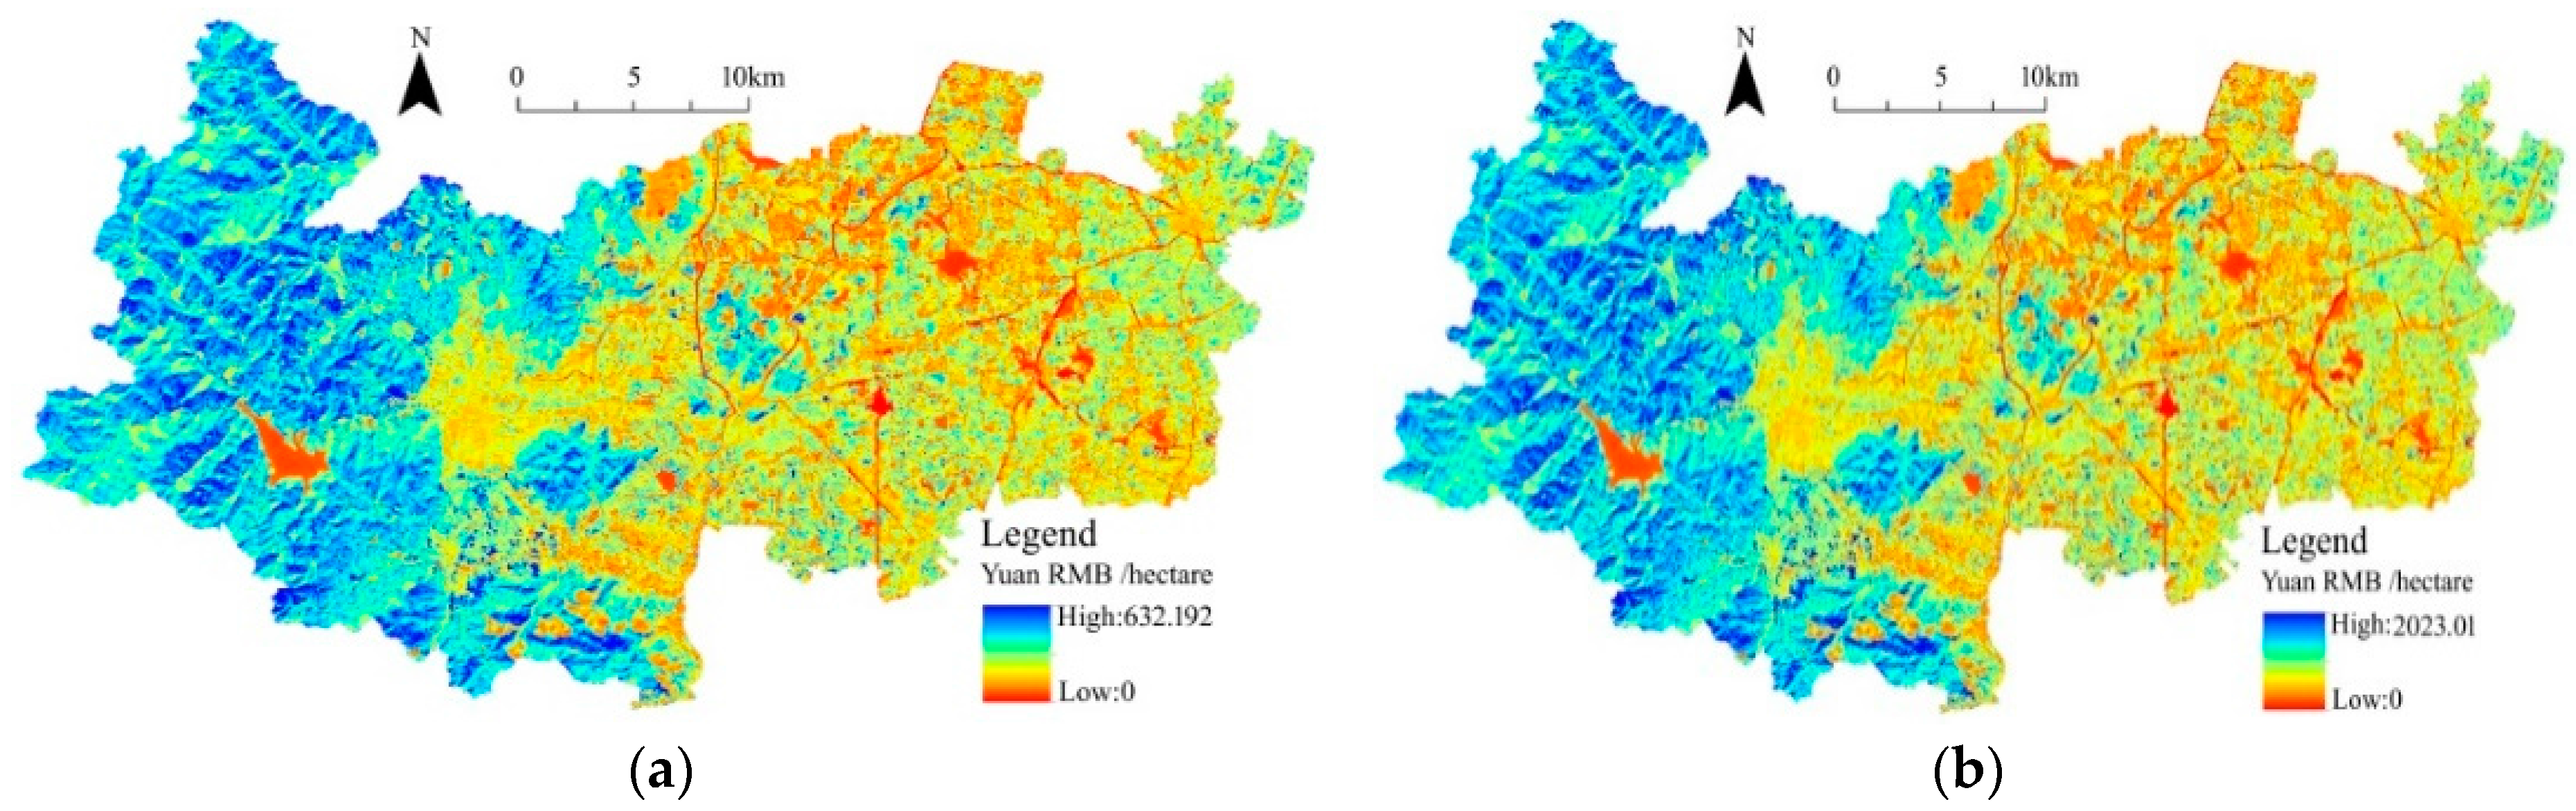
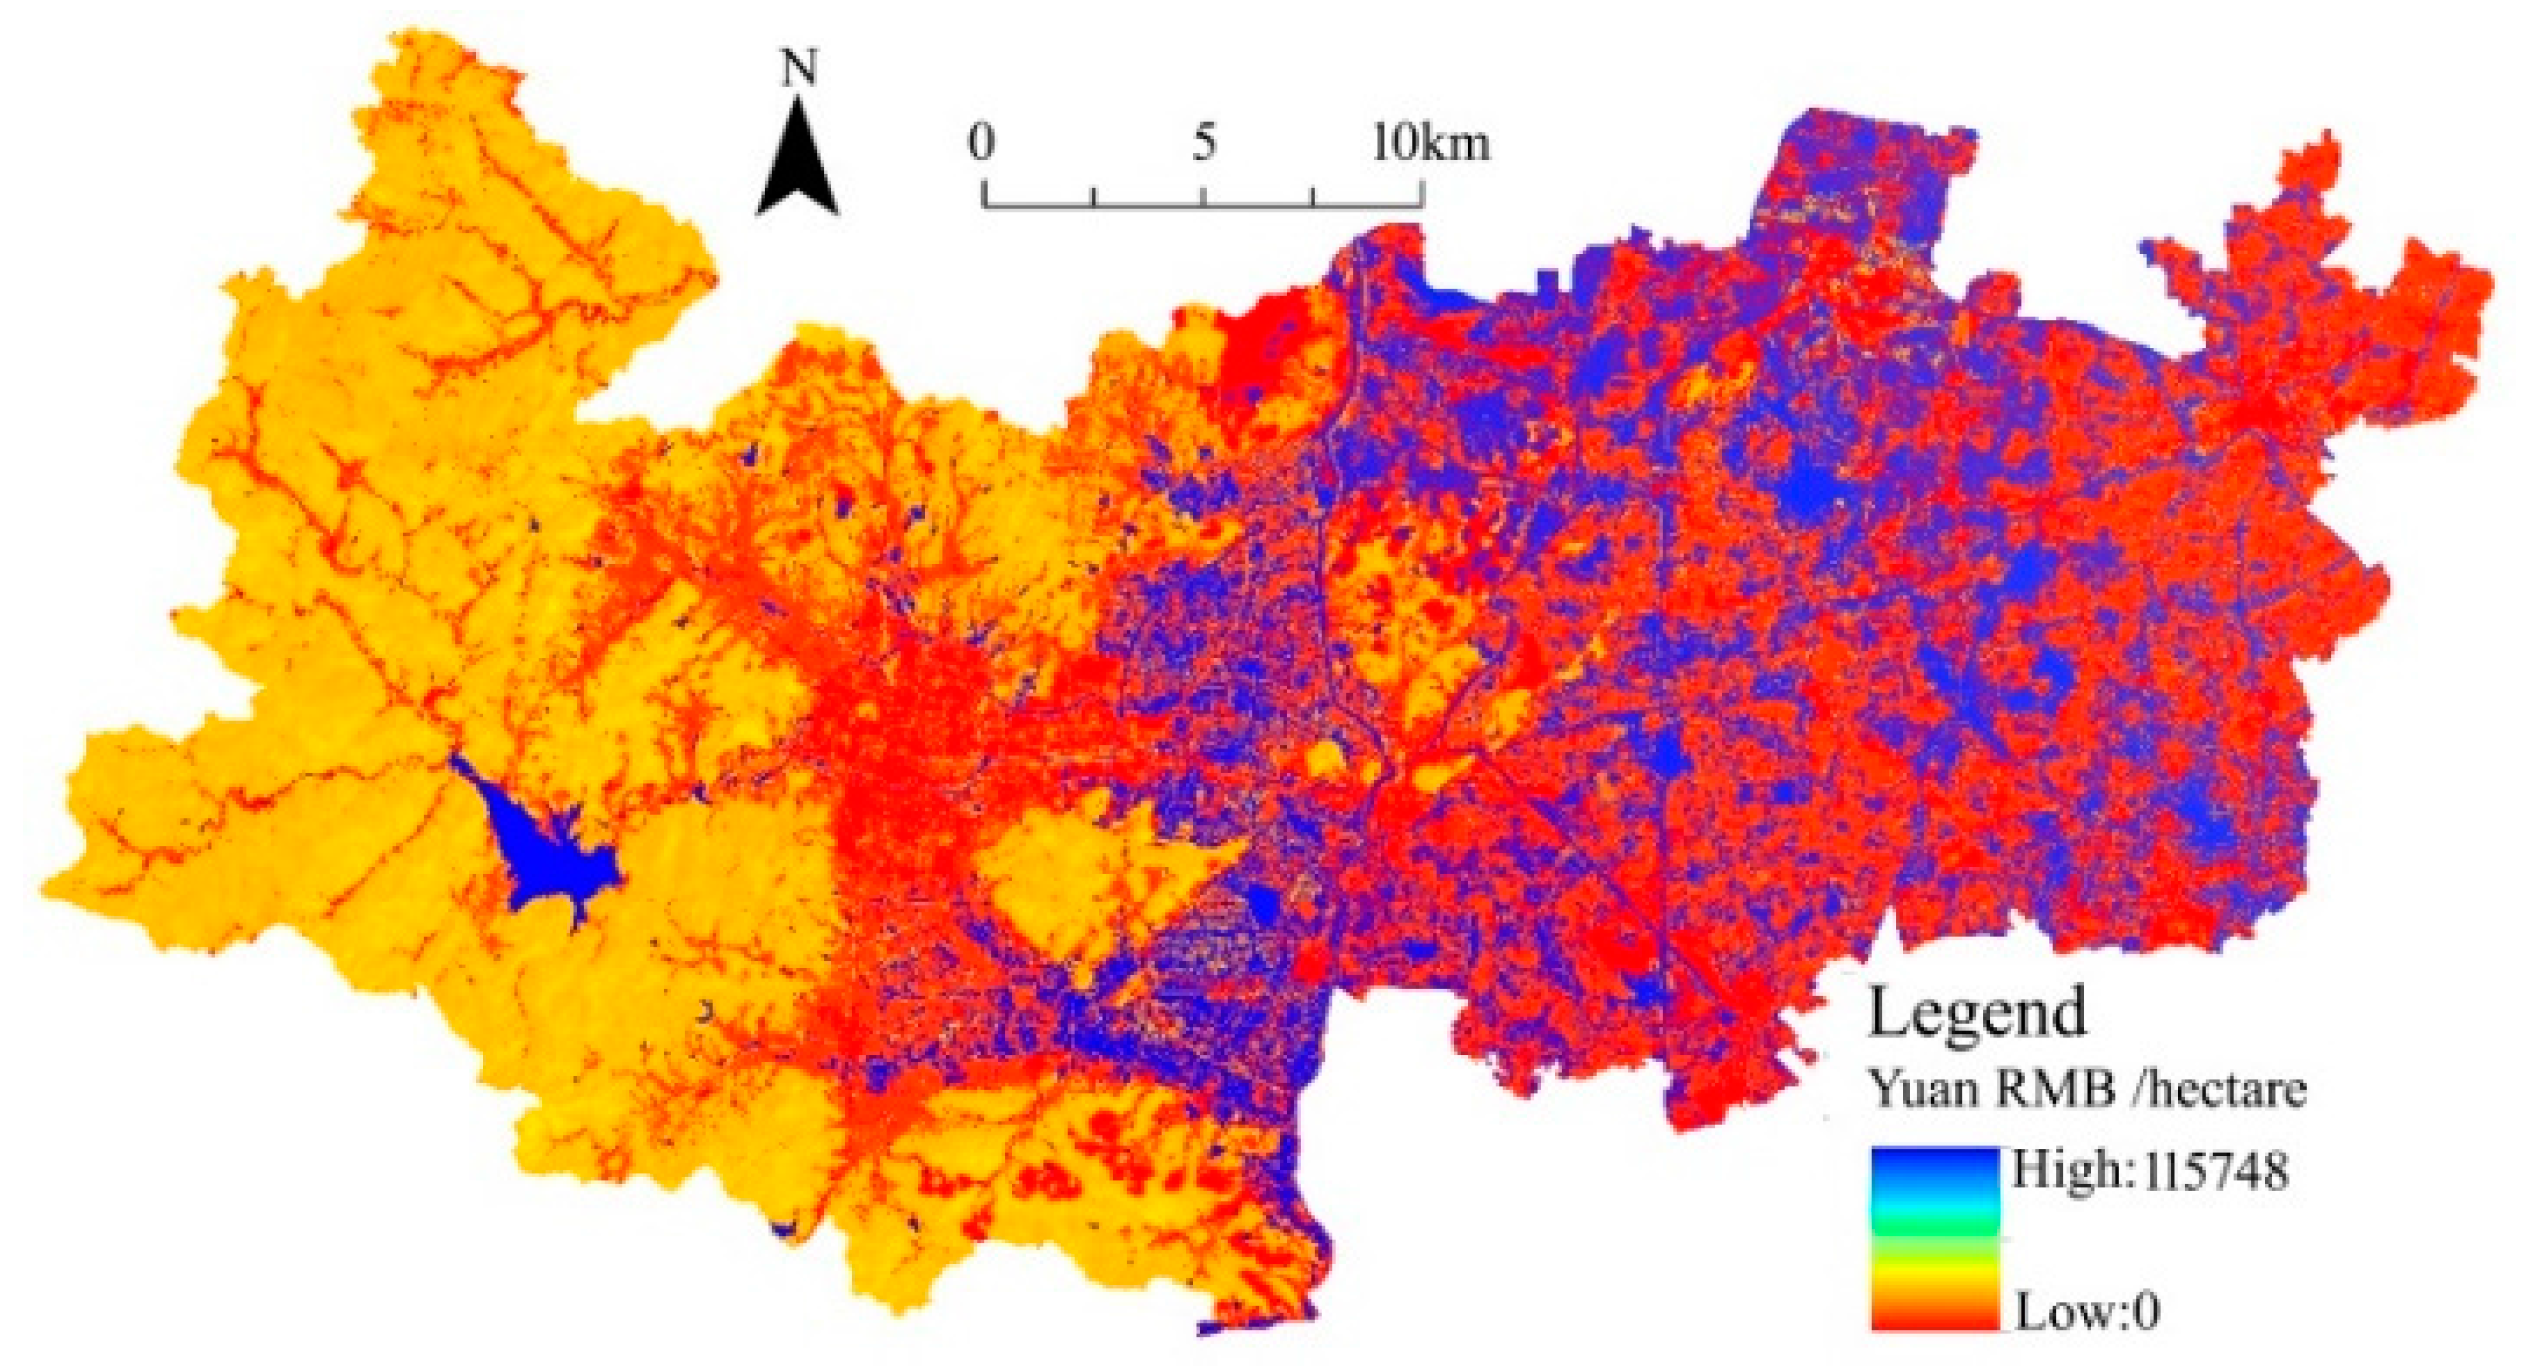
3.7. The Valuation of Ecological Assets

The total ecological asset of Deqing County in 2014 was valued to about 8.307 billion Yuan RMB, and its value per unit area is between 1305.93 and 328,606 Yuan RMB /hectare, as shown in Figure 9. Comparatively, the forest, grassland and water body have a higher value of ecological assets (Figure 10). The ratio of ecological asset to GDP reaches 24.85% in 2014, while the ratio in other case studies of China ranges between 15% and 20% [50,51,52]. It indicates that the Deqing County has a reasonable balance between economic development and ecological protection.

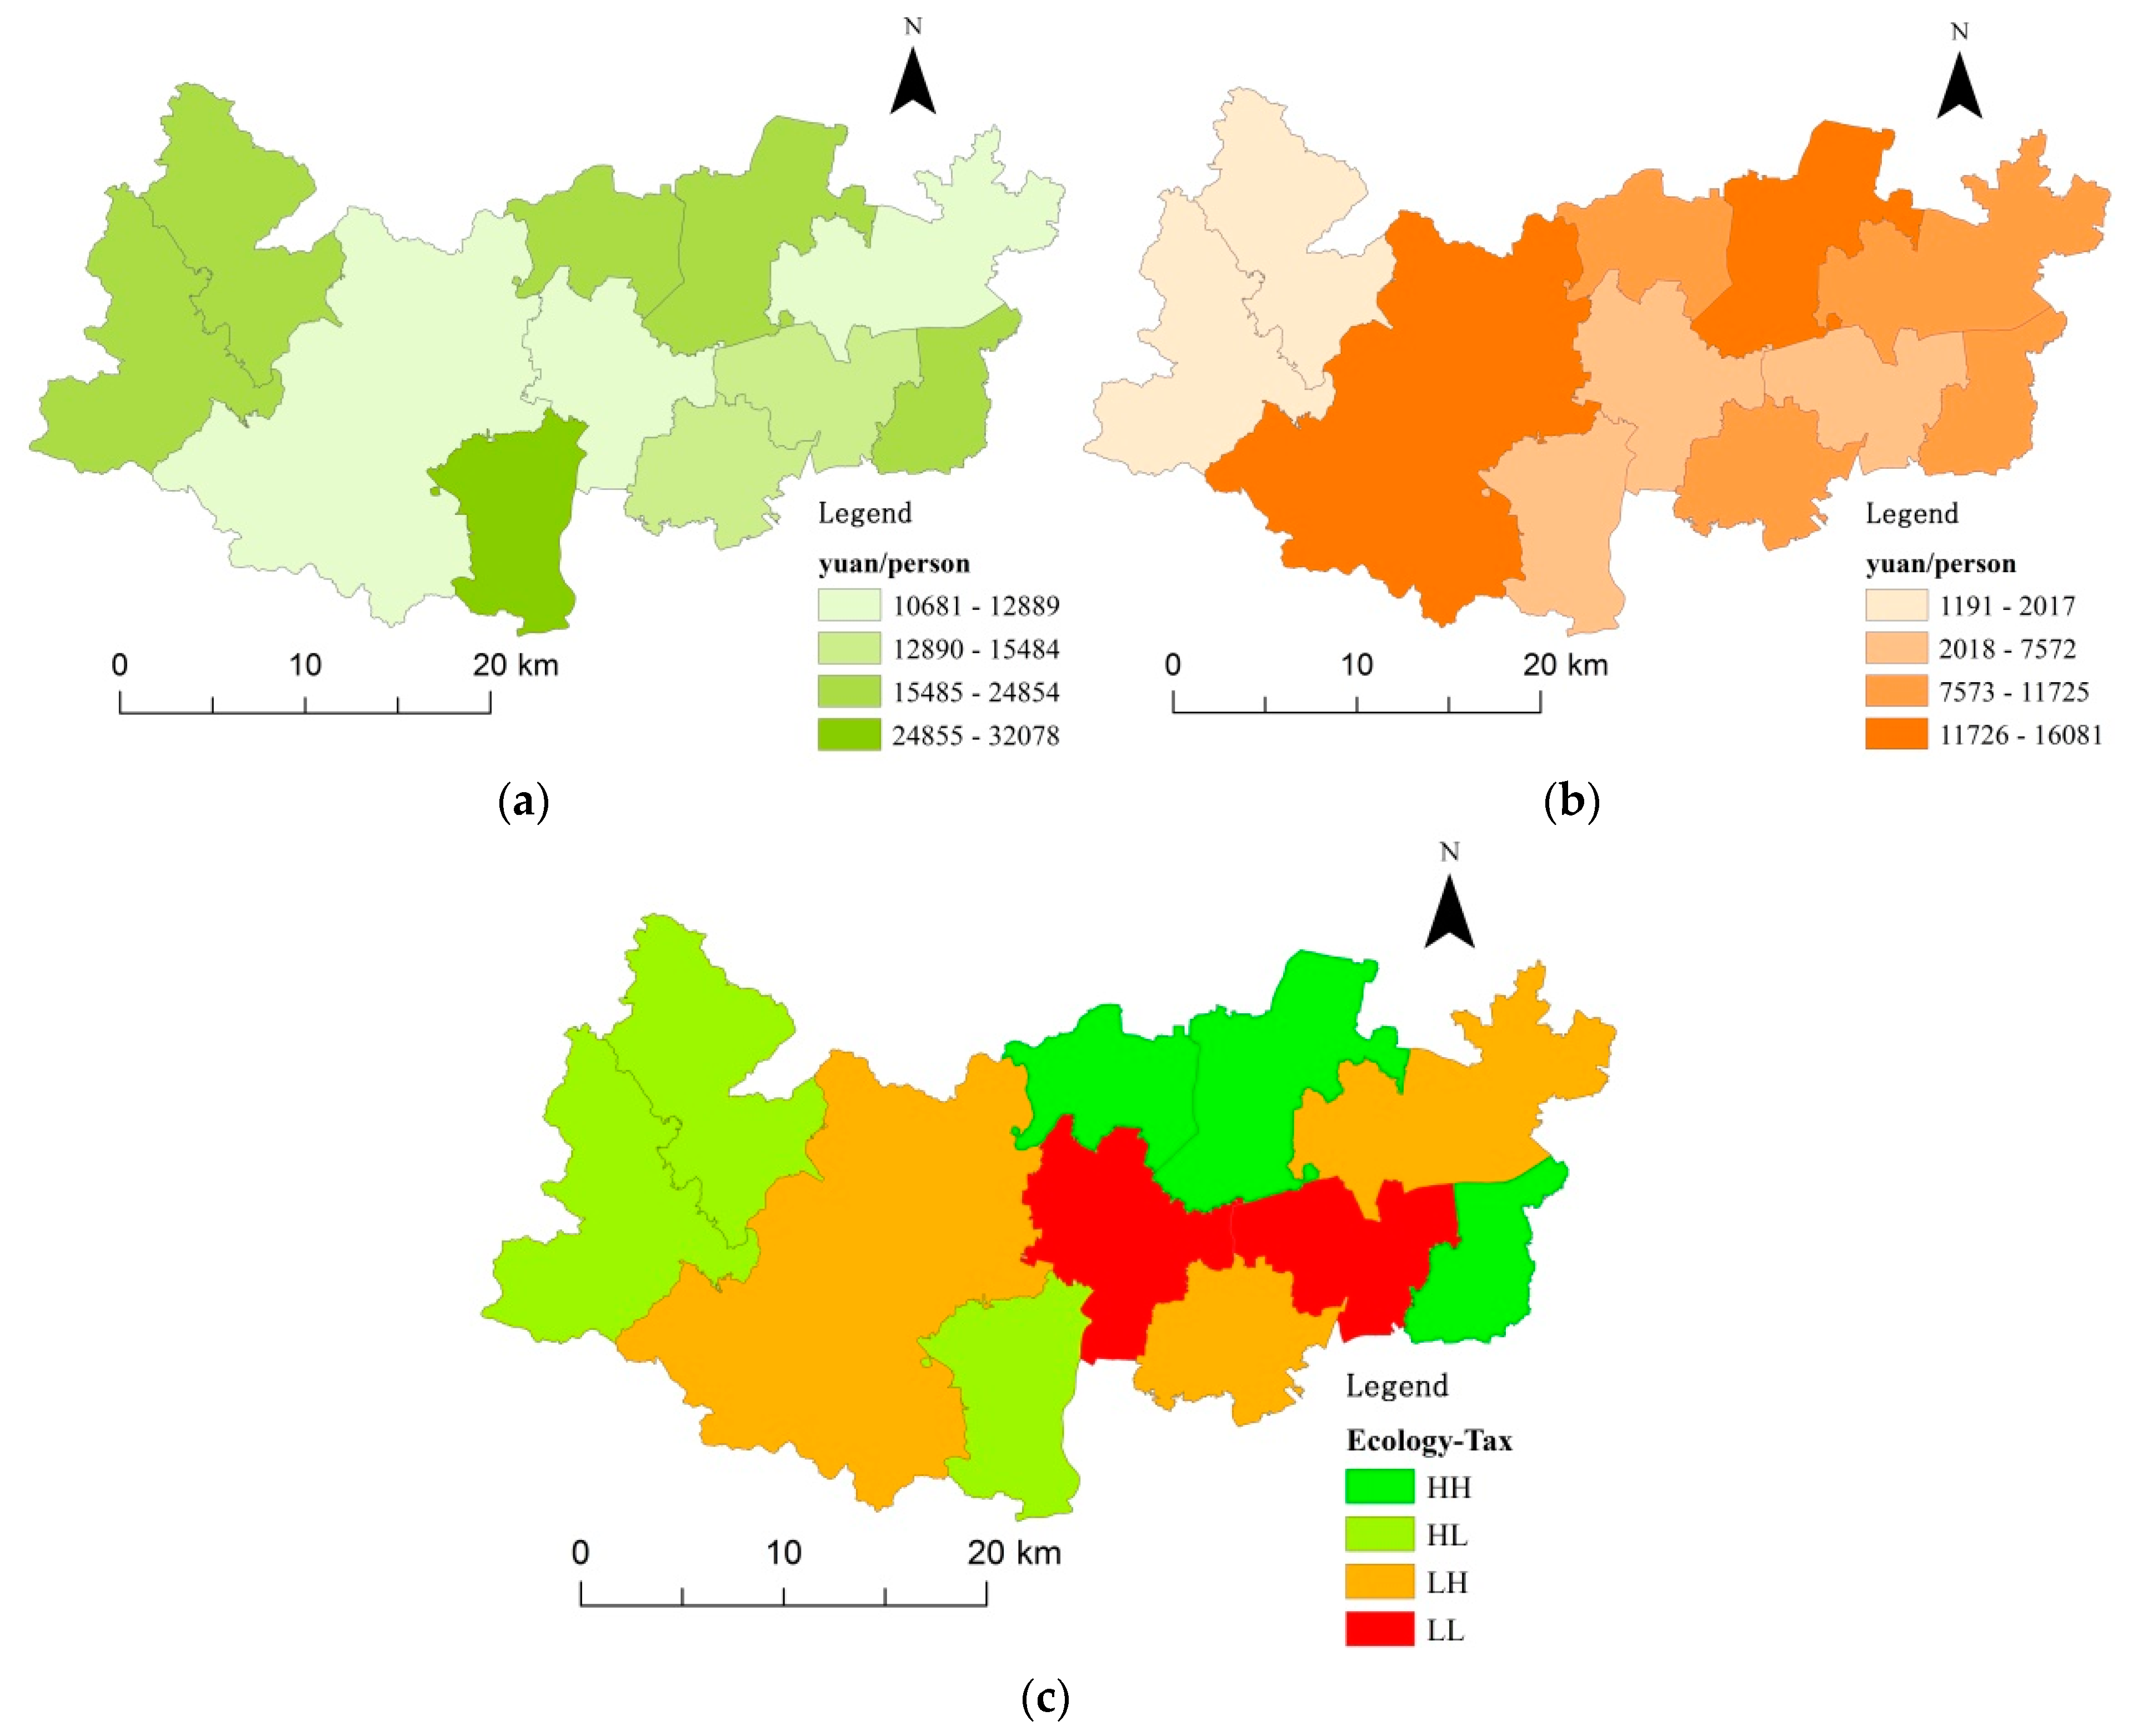
3.8. Measurement of Political Performance at Township Level

The total value of ecological assets was aggregated from the pixel level to township level using the township administrative boundary data (9 towns and 2 townships in total, another example at this township level in 17). The distribution of per capita ecological assets in Deqing County in Figure 11a is extremely unbalanced. Comparatively, the towns with higher ecological assets are mainly situated in wetland, mountainous areas. Sanhe Town in the south has the highest value because of its large wetland area (Xiazhu Lake) within the town. The second largest is Fatou Town located in the central part of western mountain area. The towns in the central and eastern areas have a lower value of per capita ecological asset, such as Xinshi Town and Wukang Town. Wukang Town, as the capital of this county and a political, economic and cultural center, has the largest population and highest level of urbanization in the county. The per capita enterprise tax revenue at township level is calculated using collected statistics data and its distribution is shown in Figure 11b. Wukang Town, as the capital of county, has the highest value. In contrast, Moganshan and Fatou Town located in the western mountain area have the lowest value. The value of Wukang Town is 13.5 times of that of Moganshan Town. Thereby, per capita enterprise tax revenue has demonstrated a significant spatial differentiation and clear imbalance in the economic development across the county.
Following the rule of defining HH, HL, LH and LL, the 11 towns and townships were classified into four categories (Figure 11c). Of these, there are 3 towns within the HH category, meaning that they have relatively higher ecological assets and economic development. There are 3 towns within the HL category, which have higher value of ecological assets but are lagging in economic development relative to other towns. There are 3 towns within the HL category, which are located in the ecological sensitive area with higher value of ecological assets but relatively lagged economic development. There are 3 towns within the LH category, which have lower values of ecological assets but higher economic development relative to other towns. There are only 2 towns which are characterized by both low ecological assets and low economic development (LL).
Through the case study of Deqing County, it is believed that the county-level government should formulate sustainable policies and strategies by balancing its economic development and ecological protection. The HH towns have demonstrated good practice. HL areas are usually ecologically vulnerable, so the protection of ecological environment should be given priority and the ecological industries such as tourism can be appropriately developed to increase the income of local residents when the ecological assets are not reduced. LH areas should be strictly controlled for urban expansion. Effective strategies to increase ecological assets should be promoted so that local residents can benefit from the improved ecological environment in addition to achieved economic income. LL areas may face greater challenges regarding both economic development and ecological assets. These towns need more policy support from county and provincial level government. A strong attention paid in China and other countries, in line with this need to embed environmental problem within economic development, emerges from industrial symbiosis approach, which was extensively applied at urban scales [53,54,55].

4. Conclusions

In this paper, based on the adapted indicators of assessing ecological assets, ecological assets have been effectively valued at county level and represented spatially using a variety of high-resolution data sets. The total value of ecological assets in Deqing County in 2014 was about 8.307 billion Yuan RMB with a value of per unit area between 1305.93 and 328,606 Yuan RMB /hectare. Its ratio of ecological asset to GDP reached 24.85% in 2014, which is above the values reported in other Chinese case studies in the published literature [26,38,50]. This means that the regional development of Deqing County is relatively sustainable at the county level from the perspective of the ecological environment.
The paper then focused upon spatial equality at the township level, which is rarely studied and reported in published literature due to the poor data availability across rural China. A comparison of the distribution of per capita ecological assets and per capita enterprise tax revenue demonstrates that there is spatial inequality in both the economic development and the ecological environment between townships. The final classification of all of the townships have varied implications for the local (county) development strategy from the perspective of sustainability and for the rural governance, such as assessment of political performance at township level. Banzhaf and Boyd distinguished ‘weak’ with ‘strong’ sustainability [56]. The former is defined as the maintenance of welfare or net Green GDP over time. The latter refers to the maintenance of stock of ecosystem assets over time. GDP ignores the value of natural capital by separating resources and environment from economic activities, and therefore tends to lead decision-makers to sacrifice natural resources and the environment to achieve economic development [16]. Consequently, protecting ecological assets should be applied as a government performance measure and a benchmark of gains and losses to environment-related well-being.
In terms of rural governance, performance measurement is high on the agenda of governments in many nations [57]. In China, local government performance was mainly measured in economic terms, such as the growth of GDP, industrial outputs, fiscal revenues, and foreign direct investment [58]. Even in the late 1990s some township governments were only assigned economic targets from county and above governments. In 2007, economic targets still accounted for 60% of the weight of performance measurement for township governments in Jingbian County [59]. This study implies that integrating the valuation of ecological assets into the measurement of political performance at the lowest township level enables the provision of quantitative evidence for enhancing rural governance and monitoring sustainable development at local (county) level. Accordingly, the township-to-county bottom-up model in this paper can help to assess sustainable development policies at county level as there is a strong hierarchy of political administration, in which upper-level government is committed to evaluating the political performance of lower-level government. For example, improving the economic development of counties has become a priority for policy makers in China because of its large population and concerns about rural poverty and inequality. Within 72% of the Chinese territory, counties directly administer 70% of the total population and yet generate only 37% of the national gross domestic product (GDP) [60]. Local administrative hierarchies have changed over the centuries, but counties have remained China’s most stable administrative unit. Valuing and assessing ecological assets at county level is a challenge for measuring regional sustainable development theoretically and practically. The indicator system in this paper was adapted from others but not validated locally. There is no national standard of indicator systems particularly at county level as a variety of case studies have not been validated by policy practice, which calls for future work in this area. D’Amato et al. (2016) argued that there is the issue of distinguishing between stocks and flows of ecosystem services [44]. The stock is the amount of ecosystem assets at a given point of time, and it is measured as a physical quantity; a flow is measured as a production during a certain assessment period. Additionally, some of the data sets used in this paper are not publically accessible. As such, availability of high-quality data including geographic and socio-economic data has proven a barrier to evidence based policy-making. National geographical survey has made one step further [21] however its data resolutions (spatial and temporal) and qualities are still not high enough for monitoring and analyzing its dynamics. An open data initiative for not only urban but also rural areas is urgently needed at national and local levels. With reliable data sets, sensitivity analysis dealing with uncertainties of the results can be conducted to help build scenarios of sustainable development strategies. In conclusion, this paper has presented a method of examining regional sustainable development at county level, including the balance or coordination between economic development and ecological environment prevention and spatial inequality between townships. However, its rural governance and dynamics of spatial inequality e.g., [14] are recommended for further work in the future.

Acknowledgments

We are thankful to the National Natural Science Foundation of China (Serial number: 41430635, 41571134, 41671137 and 21361022), the Natural Science Foundation of the Jiangsu Higher Education Institutions (Serial number: 16KJA170002), and the fund of the Priority Academic Program Development of Jiangsu Higher Education Institutions (Serial number: 164320H116).

Author Contributions

Cheng Jin and Jianquan Cheng conceived and designed the experiments; Mengqiu Lu performed the experiments; Mengqiu Lu analyzed the data; Cheng Jin and Jianquan Cheng contributed reagents/materials/analysis tools; Mengqiu Lu and Cheng Jin wrote the paper; Cheng Jin and Jianquan Cheng extensively revised the paper.

Conflicts of Interest

The authors declare no conflict of interest.

References

  1. Liu, H.; Zhou, G.; Wennersten, R.; Frostell, B. Analysis of sustainable urban development approaches in China. Habitat Int. 2014, 41, 24–32. [Google Scholar] [CrossRef]
  2. National Bureau of Statistics of China (NBSC). China Statistical Yearbook; China Statistics Press: Beijing, China, 2011.
  3. Gao, J.; Tian, M. Analysis of over-consumption of natural resources and the ecological trade deficit in China based on ecological footprints. Ecol. Ind. 2016, 61, 899–904. [Google Scholar] [CrossRef]
  4. Wang, C.; Pan, D. Zoning of Hangzhou Bay ecological red line using GIS-based multi-criteria decision analysis. Ocean Coast. Manag. 2017, 139, 42–50. [Google Scholar]
  5. Dong, M.; Wu, D.; Fu, X.; Deng, H.; Wu, G. Regional-scale analysis on the strengths, weaknesses, opportunities, and threats in sustainable development of Shangri-La County. Int. J. Sustain. Dev. World 2015, 22, 171–177. [Google Scholar] [CrossRef]
  6. Zorpas, A.A. Sustainability behind Sustainability; Nova Science Publishers Inc.: New York, NY, USA, 2014. [Google Scholar]
  7. Ebrahimzadeh, I.; Aghasizadeh, A.A. The analysis of effective factors in the expansion of coastal region of Chabahar tourism through SWOT model. J. Urban Reg. Stud. Res. 2009, 1, 107–128. [Google Scholar]
  8. Zorpas, A.A.; Voukkali, I.; Pedreño, J.N. Tourist area metabolism and its potential to change through a proposed strategic plan in the framework of sustainable development. J. Clean. Prod. 2017. [Google Scholar] [CrossRef]
  9. Badri, S.A.; Rahmani, K.; Qeydari, M.S.; Poor, O.H. Strategies of ecotourism development in Marivan township. Rural Res. 2011, 2, 6–10. [Google Scholar]
  10. Radulescu, C.V. Tourism and environment towards a European tourism policy. J. Knowl. Manag. Econ. Inf. Technol. 2011, 1, 66–76. [Google Scholar]
  11. Voukkali, I. The impact of tourist sector in the waste management plans. Desalin. Water Treat. 2014, 56, 1–9. [Google Scholar]
  12. Xie, H.; Yao, G.; Liu, G. Spatial evaluation of the ecological importance based on GIS for environmental management: A case study in Xingguo county of China. Ecol. Indic. 2015, 51, 3–12. [Google Scholar] [CrossRef]
  13. Ioppolo, G.; Cucurachi, S.; Salomone, R.; Saija, G.; Shi, L. Sustainable local development and environmental governance: A strategic planning experience. Sustainability 2016, 8, 180. [Google Scholar] [CrossRef]
  14. Yue, W.; Zhang, Y.; Ye, X.; Cheng, Y.; Leipnik, M.R. Dynamics of multi-scale intra-provincial regional inequality in Zhejiang, China. Sustainability 2014, 6, 5763–5784. [Google Scholar] [CrossRef]
  15. Courtney, P.; Mayfield, L.; Tranter, R.; Jones, P.; Errington, A. Small towns as ‘sub-poles’ in English rural development: Investigating rural–urban linkages using sub-regional social accounting matrices. Geoforum 2007, 38, 1219–1232. [Google Scholar] [CrossRef]
  16. Singh, R.K.; Murty, H.R.; Gupta, S.K.; Dikshit, A.K. An overview of sustainability assessment methodologies. Ecol. Indic. 2009, 9, 189–212. [Google Scholar] [CrossRef]
  17. Lin, Z.; Wu, C.; Hong, W. Visualization analysis of ecological assets/values research by knowledge mapping. Acta Ecol. Sin. 2015, 35, 142–154. [Google Scholar] [CrossRef]
  18. Wang, R.S.; Li, F.; Hu, D.; Larry, L.B. Understanding eco-complexity: Social–economic–natural complex ecosystem approach. Ecol. Complex. 2011, 8, 15–29. [Google Scholar] [CrossRef]
  19. Yao, G.; Xie, H. Rural spatial restructuring in ecologically fragile mountainous areas of southern China: A case study of Changgang Town, Jiangxi Province. J. Rural Stud. 2016, 47, 435–448. [Google Scholar] [CrossRef]
  20. Deqing Statistics Bureau (DSB). Statistical Yearbook of Deqing County (2015); China Statistics Press: Beijing, China, 2011.
  21. Jin, C.; Cheng, J.; Lu, Y.; Huang, Z.; Cao, F. Spatial inequity in access to healthcare facilities at a county level in a developing country: A case study of Deqing County, Zhejiang, China. Int. J. Equity Health 2015, 14, 1–19. [Google Scholar] [CrossRef] [PubMed]
  22. National Earth System Science Data Sharing Infrastructure. Scientific Data Center of Yangtze River Delta. Available online: http://nnu.geodata.cn:8008/ (accessed on 21 January 2016).
  23. Fang, Q.; Zhang, L.; Hong, H. Ecological function zoning for environmental planning at different levels. Environ. Dev. Sustain. 2008, 10, 41–49. [Google Scholar] [CrossRef]
  24. Song, W.; Deng, X.; Yuan, Y.; Wang, Z.; Li, Z. Impacts of land-use change on valued ecosystem service in rapidly urbanized North China Plain. Ecol. Model. 2015, 318, 245–253. [Google Scholar] [CrossRef]
  25. Ioppolo, G.; Saija, G.; Salomone, R. From coastal management to environmental management: The sustainable eco-tourism program for the mid-western coast of Sardinia (Italy). Land Use Policy 2013, 31, 460–471. [Google Scholar] [CrossRef]
  26. Wang, H.; Gao, Z.; Li, Z.; Wang, Z.; Bai, L.; Wang, Z. The value assessment of county-level ecological assets: A case in Fengning County, Hebei Province. Acta Ecol. Sin. 2012, 32, 7156–7168. [Google Scholar] [CrossRef]
  27. Ministry of Agriculture of the People’s Republic of China. Chinese Agricultural Information Network. 2008. Available online: http://www.agri.cn (accessed on 6 March 2016).
  28. Zhu, W. Estimation of Net Primary Productivity of Chinese Terrestrial Vegetation Based on Remote Sensing and Its Relationship with Global Climate Changes; Beijing Normal University: Beijing, China, 2005; pp. 163–164. [Google Scholar]
  29. Gao, J. Evaluation of Regional Ecological Assets—Theory, Method and Application; Science Press: Beijing, China, 2013. [Google Scholar]
  30. Jin, F.; Lu, S.; Yu, X.; Rao, L.; Niu, J.; Xie, Y. Forest ecosystem service and its evaluation in China. Chin. J. Appl. Ecol. 2005, 16, 1531–1536. [Google Scholar]
  31. Jiang, L.; Tan, Z.; Xie, W. Estimation of grassland ecosystem services value of China using remote sensing data. J. Nat. Resour. 2007, 22, 161–170. [Google Scholar]
  32. State Forestry Administration of the People’s Republic of China. Specifications for Assessment of Forest Ecosystem Service in China; Standards Press of China: Beijing, China, 2008; pp. 32–33. [Google Scholar]
  33. Liu, J. Study on the Spatial Change of Boundary and Its Ecological Effect in the Farming-Pastoral Ecotone of Northern China; University of Chinese Academy of Sciences: Beijing, China, 2008; pp. 67–69. [Google Scholar]
  34. Zhao, T. Research on China Terrestrial Ecosystem Services and Their Valuation; University of Chinese Academy of Sciences: Beijing, China, 2004; pp. 82–84. [Google Scholar]
  35. Zhou, X. Study on economic evaluation of forest public welfare efficiency in Heilongjiang Province. For. Inv. Des. 1998, 2, 48–51. (In Chinese) [Google Scholar]
  36. Ma, X. Forest Hydrology; China Forestry Press: Beijing, China, 1993; pp. 123–128. [Google Scholar]
  37. Yang, H.; Cao, M.; Fan, F. Comparison of comprehensive benefits between alfalfa and corn in agriculture-pasture ecotone in the Northeast China. Chin. J. Eco-Agric. 2005, 13, 107–109. [Google Scholar]
  38. Li, C. Research of Regional Ecosystem Service Value Evaluation Based on GIS; Zhejiang University: Hangzhou, China, 2010; pp. 1–88. [Google Scholar]
  39. Zhejiang Environmental Bureau. Announcement for the Provincial-Level Collection of Standards Fees for Pollution Discharge in the 3rd Quarter of 2015. 2015. Available online: http://www.zj.gov.cn/art/2015/10/30/art_5502_2018133.html (accessed on 8 February 2016).
  40. National Development and Reform Commission of the People’s Republic of China. The Degree No. 31 Charging Standard and Calculation Method of Pollution Discharge Fees. 2003. Available online: http://www.china.com.cn/chinese/huanjing/654865.htm (accessed on 8 February 2016).
  41. Wang, H.; Wang, B.; Wu, J. Study on the techniques of valuation of ecosystem services based on remote sensing in Anxin County. Proc. SPIE Int. Soc. Opt. Eng. 2014, 9158, 451–467. [Google Scholar]
  42. Biodiversity Research Group. Research Report on the Biodiversity Situation of China. Beijing; China Environmental Science Press: Beijing, China, 1998; pp. 92–95. [Google Scholar]
  43. China’s Chemical Fertilizer Website. Available online: www.fert.cn (accessed on 3 December 2015).
  44. D’Amato, D.; Rekola, M.; Li, N.; Toppinen, A. Monetary valuation of forest ecosystem services in China: A literature review and identification of future research needs. Ecol. Econ. 2016, 121, 75–84. [Google Scholar] [CrossRef]
  45. The Ministry of Water Resources of the People’s Republic of China. Standard for Classification and Gradation of Soil Erosion; Standards Press of China: Beijing, China, 2008; pp. 14–16. [Google Scholar]
  46. Cohen, M.J.; Shepherd, K.D.; Walsh, M.G. Empirical reformulation of the Universal Soil Loss Equation for erosion risk assessment in a tropical watershed. Geoderma 2005, 124, 235–252. [Google Scholar] [CrossRef]
  47. Tao, Y.; Li, F.; Wang, R.S.; Zhao, D. Effects of land use and cover change on terrestrial carbon stocks in urbanized areas: A study from Changzhou, China. J. Clean. Prod. 2015, 103, 651–657. [Google Scholar] [CrossRef]
  48. Thierfelder, C.; Wall, P.C. Effects of conservation agriculture on soil quality and productivity in contrasting agro-ecological environments of Zimbabwe. Soil Use Manag. 2012, 28, 209–220. [Google Scholar] [CrossRef]
  49. Field, C.B.; Randerson, J.T.; Malmstron, C.M. Gloval net primary production: Combining ecology and remote sensing. Remote Sens. Environ. 1995, 51, 74–88. [Google Scholar] [CrossRef]
  50. Chen, X.; Zhang, Q.; Zhou, K.; Sun, L. Quantitative evaluation and dynamic analysis of ecological assets in arid area. Chin. Sci. Bull. 2006, 51, 168–174. [Google Scholar] [CrossRef]
  51. Ma, L.; Tan, X.; Sun, N.; Yang, G. The pattern of ecological capital in Daxiaoxinganling, Heilongjiang Province, China. Ecol. Sin. 2013, 33, 7838–7854. [Google Scholar]
  52. Sun, H. Cause of eco-property loss of grassland in China and discussion for renewal construction of new-model. Acta Part. Sin. 2014, 10, 1–5. [Google Scholar]
  53. Taddeo, R.; Simboli, A.; Ioppolo, G.; Morgante, A. Industrial symbiosis, networking and innovation: The potential role of innovation poles. Sustainability 2017, 9, 169. [Google Scholar] [CrossRef]
  54. Chertow, M.R.; Ashton, W.S.; Espinosa, J.C. Industrial symbiosis in Puerto Rico: Environmentally related agglomeration economies. Reg. Stud. 2008, 42, 1299–1312. [Google Scholar] [CrossRef]
  55. Sterr, T.; Ott, T. The industrial region as a promising unit for eco-industrial development reflections, practical experience and establishment of innovative instruments to support industrial ecology. J. Clean. Prod. 2004, 12, 947–965. [Google Scholar] [CrossRef]
  56. Banzhaf, H.S.; Boyd, J. The Architecture and Measurement of an Ecosystem Services Index. Sustainability 2012, 4, 430–461. [Google Scholar] [CrossRef]
  57. Lewis, J.M. The politics and consequences of performance measurement. Policy Soc. 2015, 34, 1–12. [Google Scholar] [CrossRef]
  58. Jing, Y.; Cui, Y.; Li, D. The politics of performance measurement in China. Policy Soc. 2015, 34, 49–61. [Google Scholar] [CrossRef]
  59. Chan, H.S.; Gao, J. Putting the cart before the horse: Accountability or performance? Aust. J. Public Adm. 2009, 68, S51–S61. [Google Scholar] [CrossRef]
  60. Li, P.; Lu, Y.; Wang, J. Does flattening government improve economic performance? Evidencefrom China. J. Dev. Econ. 2016, 123, 18–37. [Google Scholar] [CrossRef]
Figure 1. Location of the study area and its administrative units.
Sustainability 09 00939 g001
Figure 2. Methodology for the valuation of county-level ecological assets and regional sustainable development assessment.
Sustainability 09 00939 g002
Figure 3. The spatial distribution of valuation of NPP and organic materials; Valuation of NPP (a); Valuation of organic materials (b).
Sustainability 09 00939 g003
Figure 4. Spatial distribution of valuation of purifying air and fixing carbon & releasing oxygen; Purifying air (a); Fixing carbon & releasing oxygen (b).
Sustainability 09 00939 g004
Figure 5. Spatial distribution of valuation of water conservation.
Sustainability 09 00939 g005
Figure 6. Spatial distribution of valuation of nutrient accumulation and soil conservation; Nutrient accumulation (a), Soil conservation (b).
Sustainability 09 00939 g006
Figure 7. Spatial distribution of valuation of natural resources.
Sustainability 09 00939 g007
Figure 8. Spatial distribution of the valuation of ecosystem services.
Sustainability 09 00939 g008
Figure 9. Spatial distribution of the total value of ecological assets.
Sustainability 09 00939 g009
Figure 10. Valued ecological assets of Deqing County in 2014.
Sustainability 09 00939 g010
Figure 11. Spatial comparison between per capita ecological assets and per capita enterprise tax revenue at township level; Per capita ecological assets (a); Per capita enterprise tax (b); Classification (c).
Sustainability 09 00939 g011
Table 1. County-level indicators for valuation of ecological assets (adapted from [24]).
IndicatorEcosystem ServicesEcosystem FunctionsPhysical Quantity
1Storage of solar energyProduction of organic materialsNet Primary Productivity
2Gas regulationStoring carbon and releasing oxygenNet Primary Productivity
3Water regulationWater conservationNet Primary Productivity
4Environment purificationAir purificationWater conservation
5Accumulation of nutrientsCirculation and storage of nutrientsSoil conservation
6Preserving soil nutrient, reducing land waste and sediment accumulationSoil conservationVolume of air purification
Table 2. Distribution rate of nutrients in each ecosystem (g/g C).
ItemFarmlandGardenForestGrasslandConstruction LandWaterDesert
N0.0132880.0132880.0041800.1328900.0132030.0042040.013273
P0.0000900.0000900.0008900.0000930.0000870.0009010.000091
K0.0089150.0089150.0018100.0089080.0088740.0018200.008909

