Article

Assessment Method for Substation Capacity Credit of Generalized Power Source Considering Grid Structure

State Key Laboratory of Alternate Electrical Power System with Renewable Energy Sources, North China Electric Power University, Beijing, 102206, China
*
Author to whom correspondence should be addressed.
Sustainability 2017, 9(6), 928; https://doi.org/10.3390/su9060928
Submission received: 13 April 2017 / Revised: 20 May 2017 / Accepted: 25 May 2017 / Published: 2 June 2017
(This article belongs to the Special Issue Sustainable Electric Power Systems Research)

Abstract

:
This paper presents the concept of the generalized power source in an active distribution network. After the energy storage system (ESS), distributed generators (DG), and demand-side controllable load are connected to the active distribution network, part of the system load can be undertaken by these ESS, DG, and controllable load instead of relying on the capacity of the substation, which greatly improves the reliability of the system. The above-mentioned distributed energy resources in the active distribution network are collectively referred to as the generalized power source (GPS). Substation credible capacity refers to the capacity of the GPS to supply the distribution network that is equivalent at the high voltage distribution network level when considering the faults of the main transformer, 110 kV lines, and circuit breakers. Considering the uncertainties and control strategies of GPS, this paper takes a specific distribution area as the background to study its substituted substation capacity. Based on a sequential Monte Carlo evaluation framework and the principle of constant reliability, an evaluation method of the GPS credible capacity is proposed. In order to verify the effectiveness of the method proposed in this paper, the credible capacity of various typical connection modes of a high voltage distribution network is quantitatively analyzed in the case study, which can provide a reference for the capacity planning of an active distribution network substation and grid structure selection.

1. Introduction

An active distribution network can effectively integrate the distributed generation (DG), demand response (DR) load, energy storage, and other resources on the demand side, which can significantly improve the utilization ratio of equipment and the acceptable capacity of green energy [1]. With continuous increases in DG, energy storage system (ESS), and demand response (DR) resource penetration, they can be used to replace the substation capacity to carry part of the load.
Many existing studies only consider the capacity value of DG, while they fail to fully account for energy storage, DR, and its equivalent capacity value when interacting with DG. Therefore, in this paper, distributed generation, energy storage system, and demand-side controllable load are collectively referred to as the generalized power source (GPS) in an active distribution network. At the stage of substation capacity planning, we aimed to integrate the coordinated operation of the DG, ESS and DR, in addition to comprehensively accounting for their capacity value. Evaluating the amount of load that can be undertaken by the generalized power source instead of relying on substation capacity in the distribution network is important for substation locating, sizing, and reliability analysis with large-scale GPS integration.
The existing research on substation planning with DG mainly focuses on the calculation of the DG penetration level and the optimal configuration of DG [2,3]. In the substation planning stage, when the DG accesses the grid, there are two traditional methods of processing its influence on the substation locating and sizing. One method regards DG as a dynamic load with negative power consumption. The DG output is multiplied by a certain coefficient and counted in the total installed capacity. Although this method considers the contribution of DG output and effectively reduces the planning capacity of a substation, it does not consider the volatility of DG output. The loss of part of the load caused by potential DG failure will reduce the reliability of the system. The other method only considers the minimum DG output, which is conservative and cannot fully consider the DG capacity value.
At present, domestic and foreign scholars use the concept of credible capacity to evaluate the contribution of DG to maintaining an adequate system capacity. However, most of the studies are at the transmission grid level, which aims to study how much generating capacity can be replaced by DG. The related work is as follows: In a previous study [4], an empirical model for assessing the capacity of large-scale photovoltaic power generation is proposed, in which the capacity credit of a utility-grade photovoltaic was calculated using the effective load carrying capacity (ELCC) method. Another study [5] used the capacity factor method (CF) to measure the capacity credit of wind power instead of ELCC, but this method avoided the reliability calculation model and is not precise enough. Another author [6] extended the concept of power generation credible capacity to energy storage systems and demand-side response resources to assess the alternative to conventional generators.
The research of credible capacity mentioned above has all been undertaken at the transmission grid level. In more recent studies [7,8], the concept of credible capacity has been enlarged to the distribution grid level for the first time. A new substation optimization method based on capacity credit evaluation with DG is proposed. The specific method is as follows: in the intermediate link of the substation planning, the expected energy not supplied (EENS) is selected as an indicator of reliability. The increased load capacity after DG access is studied under the premise of equal generation reliability. This increased load is defined as the capacity credit, and will be deducted from the substation capacity. However, the shortcoming of this substation planning method is that the reliability calculation only takes the generation reliability into account and does not consider the influence of high-voltage distribution network structure. Therefore, the planned substation capacity would not reach the predetermined reliability level. As a result, re-updating the substation capacity according to the DG capacity credit may lead to great differences in transformer capacity and type selection in one area, which cannot guarantee the unity and consistency of the transformer selection in the same region. This method only considers DG and does not fully consider the value of the energy storage, DR, and its interaction with DG. In another study [9], the influence of the controllable load on the smart grid is evaluated by the improvement in power quality and reduction of the network loss in the high photovoltaic (PV) permeability grid.
As mentioned above, most of the studies to-date are at the transmission grid level, which studies how much generating capacity can be replaced by DG. The research gap of the credible capacity is that few studies are at the distribution grid level, with a lack of studies examining how much substation capacity can be replaced by GPS. Meanwhile, the influence of grid structure has not yet been considered. With the increasing access of distributed power supply and the load, the role of GPS should be considered when upgrading the grid. Therefore, the method of integrating the coordinated operation of the GPS and the method to account for the capacity replaced by GPS at the stage of the substation capacity planning will become the important issues for the planning of the distribution network with permeability of high distributed energy resources. Among them, the method of calculating the credible capacity is a key component to examine further.
On the basis of the above research, this paper first gives the definition of the GPS substation credible capacity in the distribution network. Following this, considering the uncertainties and control strategies of GPS, this paper takes a specific distribution area as the background under the premise of forecasting certain values of GPS penetration and GPS scattered distribution in the planning level year, which is needed to study its substation substitution capacity. Because the reliability of a high-voltage distribution network is not only related to the capacity of substations, but also to the structure of the high-voltage distribution network, the assessment method proposed in this paper regarding GPS substation capacity credit has considered the grid structure. The research results can set up the foundation for follow-up substation locating and sizing or the upgrading of the original substation.
The rest of this paper is organized as follows. Section 2 gives the definition of substation credible capacity of GPS in an active distribution network. The GPS output model is introduced in Section 3. Analysis of typical power supply modes of high voltage distribution network and reliability calculation method is shown in Section 4. The method for evaluating substation credible capacity of GPS considering grid structure is provided in Section 5. Section 6 is the case study. Finally, Section 7 is devoted to the conclusions.

2. Definition of Substation Credible Capacity of GPS in an Active Distribution Network

Large-scale distributed energy resources can be actively adjusted in an active distribution network to increase the power capacity and system reliability [10], which can partly replace the load which is currently provided by a higher-level power supply. However, intermittent DGs have strong randomness and volatility, which are difficult to effectively control. The load that the DG of the same capacity can carry is much smaller than that carried by the higher-level power supply. The energy storage system can stabilize the volatility of the intermittent DG output by setting reasonable operation strategies. The DG load capacity can be improved to a certain extent. The demand side response resource—an important part of the active distribution network—can flexibly change the load power according to the demand of the grid.
In summary, the access of DG, ESS, and the demand-side response load improves the reliability of the system and can be equivalent to a certain substation capacity to carry part of the load. The sources mentioned above are collectively known as the generalized power source (GPS) in a distribution network.
In order to evaluate the capacity value of GPS in a distribution network, the concept of credible capacity is adopted. According to different substitutes, the credible capacity of GPS in an active distribution network is defined as generation credible capacity, substation credible capacity, and feeder credible capacity.
  • Generation credible capacity refers to the capacity of the traditional generating units that can be equivalently replaced by the new energy resources unit at the transmission grid level under the same generation reliability, which can be applied to the power balance of power system planning.
  • Substation credible capacity refers to the capacity that can be equivalently replaced by GPS at the high-voltage distribution grid level, under the premise of obeying the equivalent reliability principle, considering the faults of main transformers, 110 kV lines, and circuit breakers. The substation credible capacity can be applied to the overall planning of substation capacity.
  • Feeder credible capacity refers to the line capacity replaced by the power sources at the distribution network level under the condition of a 10 kV line fault, considering the line power flow constraint and ensuring the reliability of a power supply. The line selection is known, and the calculation result is equivalent to the number of standard lines.
By definition, the substation credible capacity is the alternative part of substation capacity replaced by GPS under an equivalent reliability. The effective load carrying capacity (ELCC) indicator is adopted to assess the substation credible capacity of GPS.
The reliability at this time refers to the reliability of the high-voltage distribution network supplying power to 10 kV under the random failure of 110 kV lines and transformers. Due to the open-loop operation of a high voltage distribution network when there is in-station transferring and inter-station transferring, the reliability calculation needs to consider the topology change and line overload problem. The load capacity at this time is different from the evaluation of the generation credible capacity. This is because when the reliability is the same, the additional loads carried by the substation are not only related to the contribution of DG, but are also closely related to the load rate. A higher load rate results in a higher credible capacity [7]. Therefore, the definition of ELCC in this paper is the payload capacity under a certain load level.
To remove the contribution of the higher-level power grid, the maximum safety load of the given system should be determined first. The maximum safety load of the distribution network is the maximum load supply capacity in the case where the distribution network in a certain power supply area satisfies the N-1 safety standard under the actual operation. When there is no GPS in the system, the further load increases will result in the load rate exceeding the safety value. When this happens, the higher-level power grid will no longer be able to provide additional load capacity support. From this point, under the premise of the equal system reliability, the newly-added load is completely from the GPS. In addition, all the load and generalized power sources are equivalent to 10 kV, although this does not involve the medium voltage feeder.
Figure 1 is a schematic diagram of one power supply partition in one substation, indicating the location of GPS.
The substation credible capacity of GPS in an active distribution network can be expressed as Equation (1).
R ( C T , L 0 ) = R ( C T , C GPS , L 0 + Δ L )
where R(·) is the high-voltage distribution network reliability estimation function. Its reliability indicator can take LOEE (loss of energy expectation), SAIDI (system average interruption duration indicator) or EENS (expected energy not supplied) into account. Furthermore, CT is the substation capacity under a certain wiring mode; CGPS is the accessed GPS capacity under a certain wiring mode; L0 is the sum of 10 kV primal loads of substations in the power supply area; and ΔL is the sum of new load.
When Equation (1) is established, the corresponding ΔL is the substation credible capacity of CGPS.

3. GPS Output Model

In general, there are two types of operation control strategies: cooperative control decision and independent control decision. The control strategy is closely related to the output of each power source. In the cooperative control decision, each DG timing output is related to the control objectives in order to smooth the whole output. The optimal output in the independent control decision is related to the control strategy of each DG to maximize the output of a single DG. In this present study, independent control is taken as the example, assuming that GPS operate separately according to each of their own settings below.

3.1. Distributed Generator Modeling

Wind turbine generator (WTG) and photovoltaic (PV) are two of the most widely used new energy sources. Therefore, in this paper, DG is represented by WTG and PV, with its sequence output model shown in previous studies [11,12,13].

3.2. Energy Storage System Modeling

The output model of ESS is related to its operation strategy. One of the main tasks of ESS is to smooth the output fluctuation of intermittent energy such as WTG and PV. We defined the difference between load demand and DG output as the net exchange power, pex. In this paper, the operation strategy of the ESS in the normal running state is set as follows. When pex is less than 0, the energy storage discharges. In comparison, when pex is greater or equal to 0, the excess output power will be used to charge ESS, as described in Equation (2).
p BES . t c = min ( η c | p ex | , γ c S nom ) ,   p ex < 0
p BES . t d = min ( 1 η d p ex , γ d S nom ) ,   p ex 0
where p BES . t c and p BES . t d are, respectively, charge and discharge power of the energy storage battery at time t; ηc and ηd are, respectively, the efficiency of charge and discharge progress; γc is the ratio between the maximum charge power per unit time and the storage battery rated capacity (Snom); and γd is the ratio between the maximum discharge power per unit time and the storage battery rated capacity (Snom).
In order to maintain the fully charged state for ESS in case of a system fault and to reduce the frequency of state change between charge and discharge states to increase the service life of the ESS. This paper states that under normal operating conditions, once the charging starts, the ESS must keep charging until it reaches a specified level. Being different from the normal running state of the system, the net exchange power pex in the outage area caused by the fault should be considered as the amount of load transfer, as shown in Equation (3).
p ex . t = p load . t + p loss . t i = 1 N D G p D G . i . t p T . t
where pload.t, ploss.t, and pDG.i.t are, respectively, the total load power in the blackout area at time t, grid power loss, and the upload power of Group i; pT.t is the amount of load that can be transferred in the power outage area; and NDG is the total number of DGs in the power outage area. The charge and discharge power of the ESS is determined by Equations (2) and (3). In addition, the charge and discharge power and charge state of the ESS should meet the three constraints below [10].
p BES . t c p BES . t d = 0
S oc . min S oc . t S oc . max
S o c . t = S o c . t 1 + ( η c Δ T p B E S . t c 1 η d Δ T p B E S . t d ) / S n o m

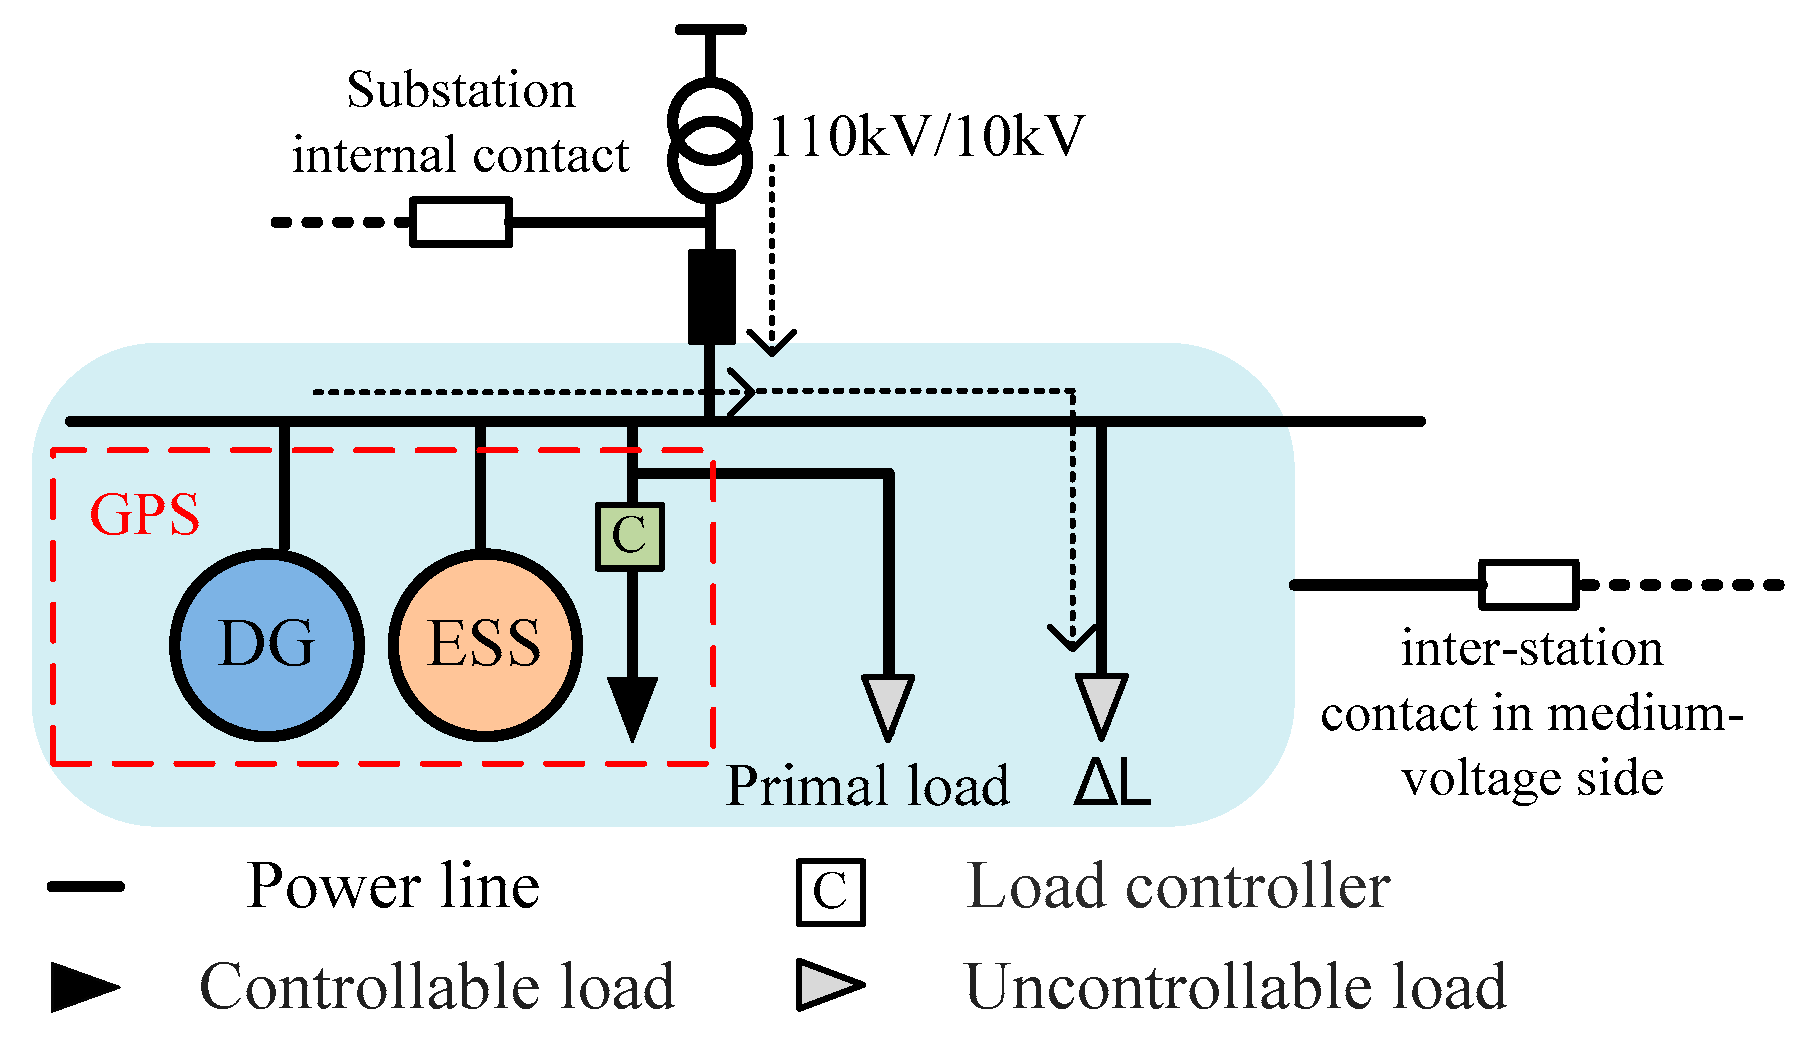
3.3. Controllable Load

The demand-side response based on incentives mainly has the following types: direct load control (DLC), interruptible load (IL), demand side bidding (DSB), emergency demand response (EDR), and capacity/ancillary service program (CASP). Load control includes the first two types listed above. In this paper, we used interruptible load as the controllable load. This means that the DLC operators have the ability to shut down or cycle control the users’ electrical equipment through remote control devices during the peak period, with the advance notice usually being within 15 min. This paper assumes that the load under the same transformer belongs to the same partition and that when fault occurs, it has a direct control ability related to the controllable load in the same power supply partition and can cut the load down in time if needed.
In this paper, the maximum available controllable load of a single load point is in proportion to the load power of this point, as follows:
p D . i . t = α p l o a d . i . t
where pD.i.t is the controllable load power that can be reduced at time t of load point i; α is the ratio of the controllable load to the load power of load point i; and pload.i.t is the load power of load point i at time t.
The fault recovery mechanism determines the power supply order and the power shortage of the load during the fault process, which ensures the DG power supply is the priority and considers the amount of load that can be transferred. When the two measures are still unable to meet the full load of power in the fault area, the ESS execute the operation fault condition strategy, as shown in Equation (3). The total controllable load to be reduced is as follows:
p I L . t = p l o a d . t i = 1 N D G p D G . i . t p T . t p B E S . t D ,   t T o u t
where T o u t is the outage time. When the total controllable load in that area is greater than pIL.t, there will not be a load blackout. On the contrary, when the total controllable load in that area is less than pIL.t, this means that part of the load is still not supplied after using all the controllable load to implement direct load control. In this situation, the system power outage load is:
p out . t = p I L . t i = 1 N D p D . i . t
where ND is the total number of controllable load set in the power outage area; and pD.i.t is the controllable load i that can be reduced at time t.

4. Reliability Calculation of High-Voltage Distribution Network Considering Grid Structure

According to The Code of Planning and Design of Urban Electric Network compiled by State Grid Corporation of China [14], when there is a high-voltage distribution network fault, the power loss loads are first transferred from the high-voltage distribution network, as the load under the same transformer belongs to the same partition. When the fault of the transfer lines or the transferred load reach the upper transfer limit, the power will be transferred through the medium-voltage side between substations. The high-voltage power transfer and the medium-voltage power transfer jointly determine the reliability of the system.

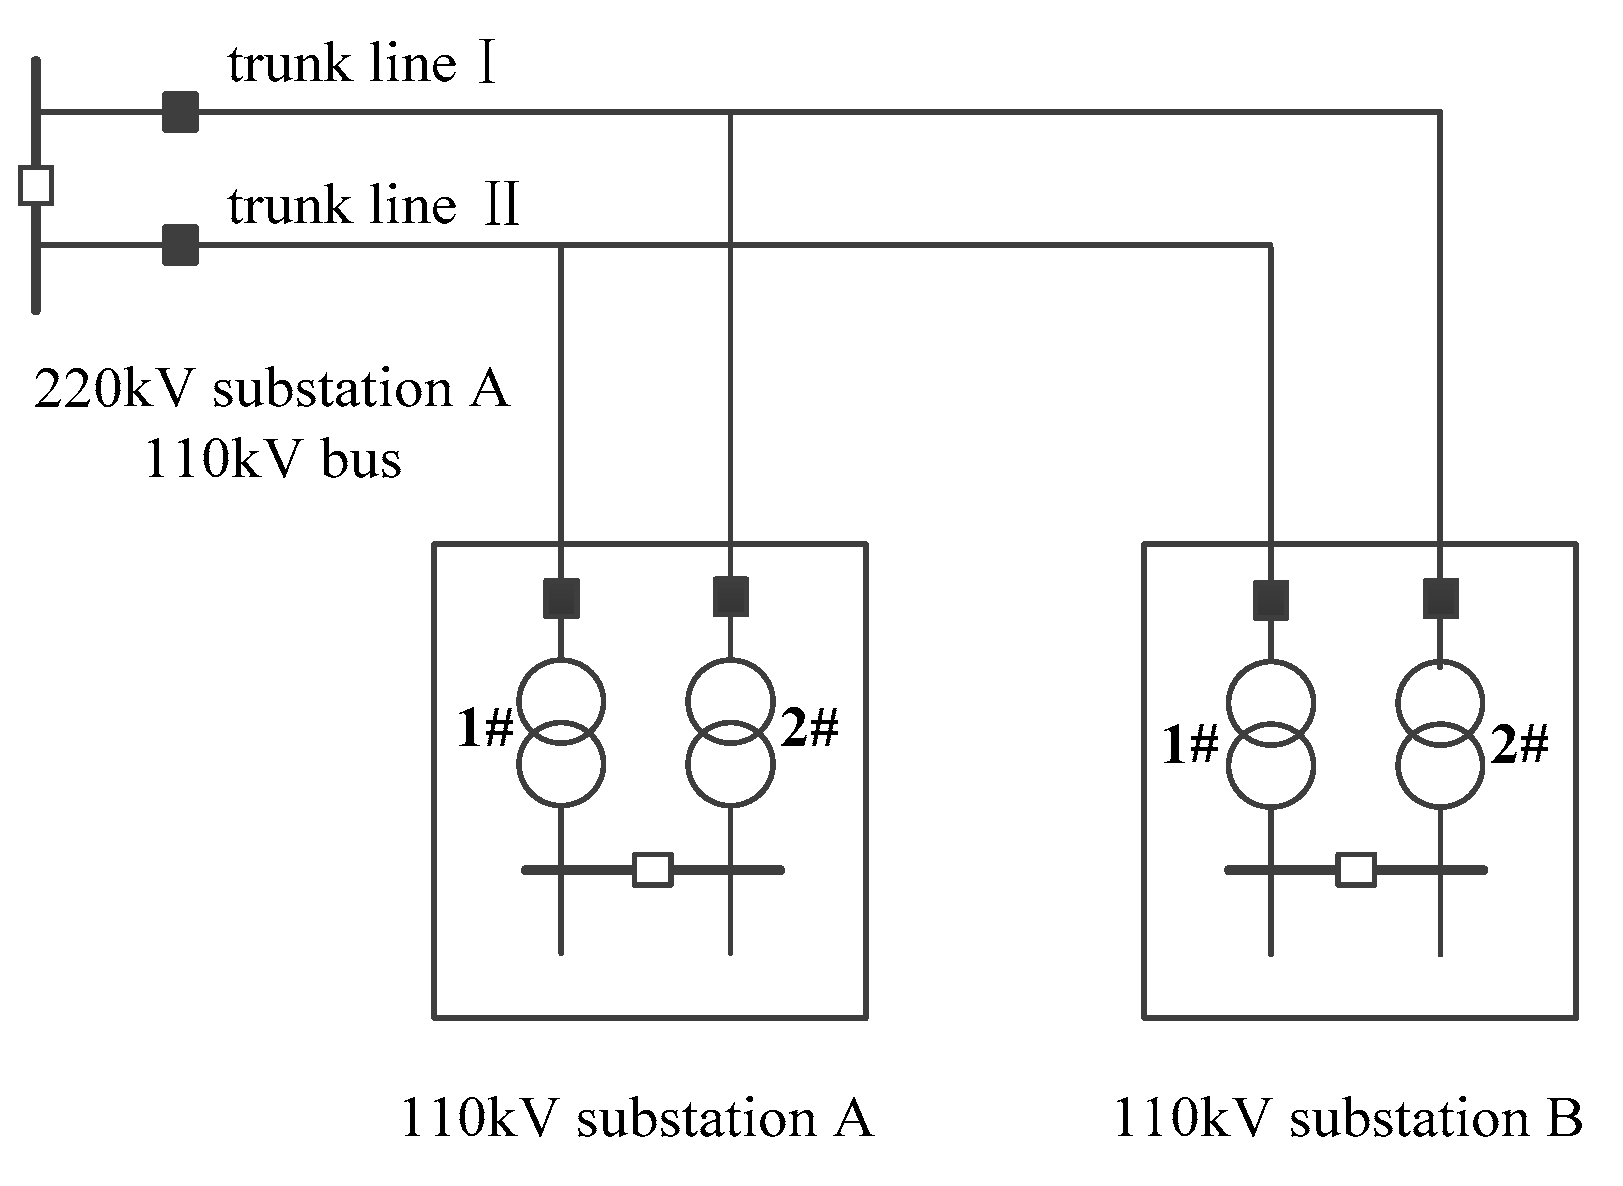
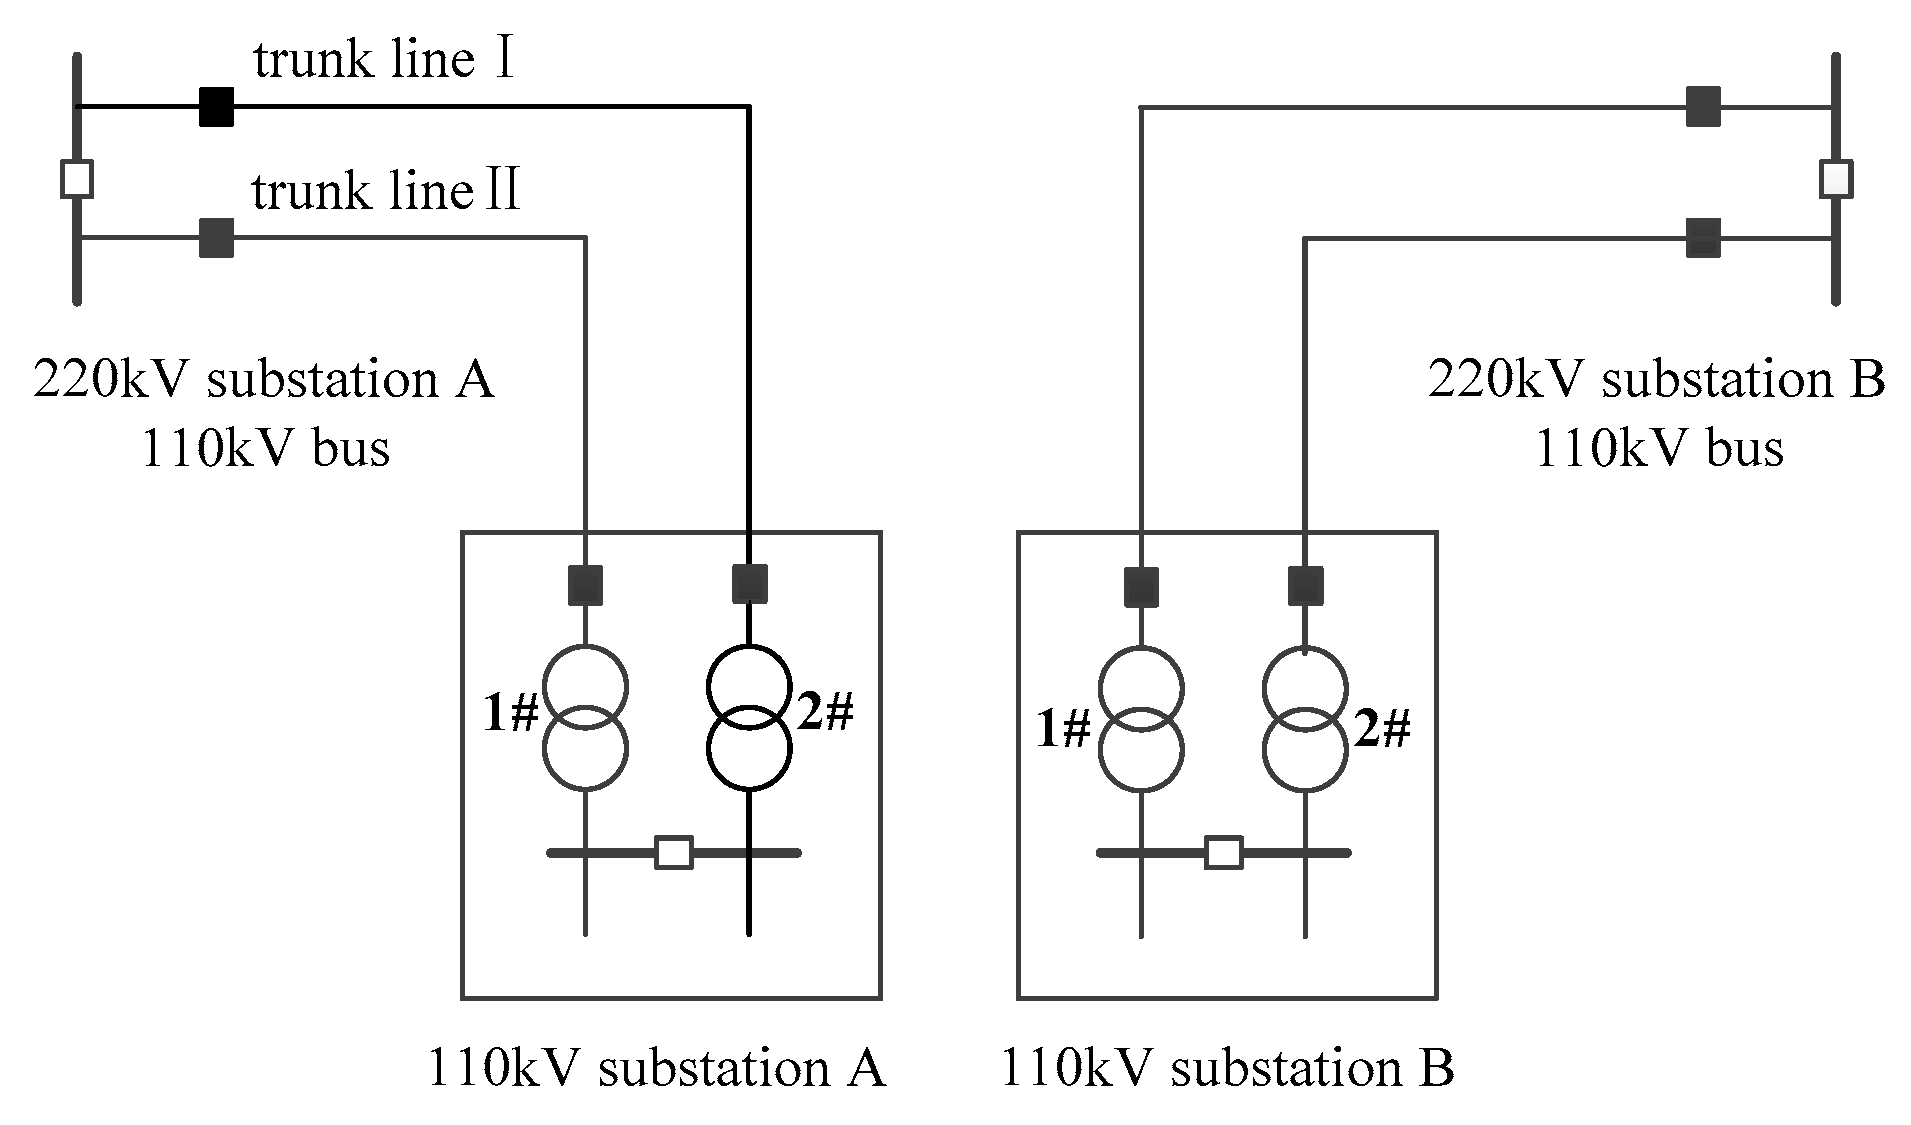
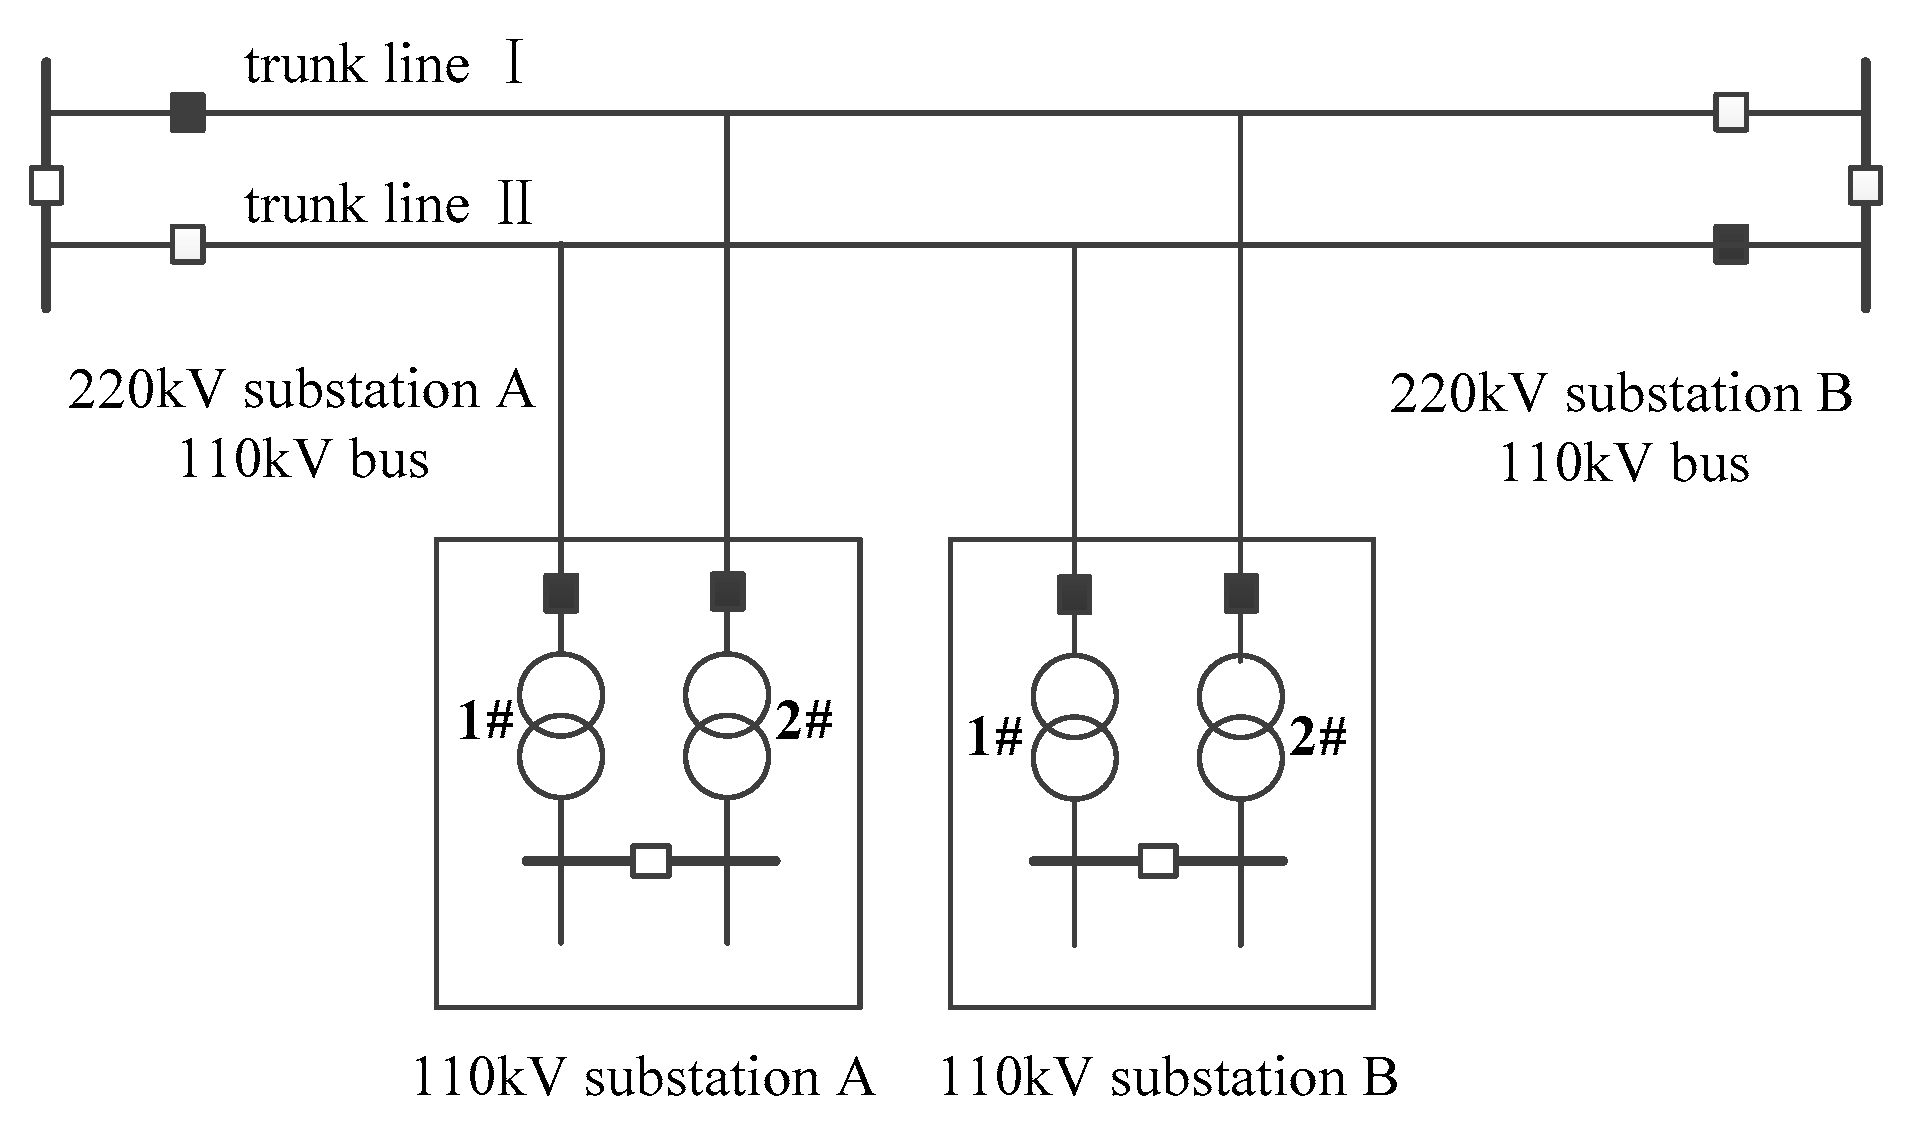
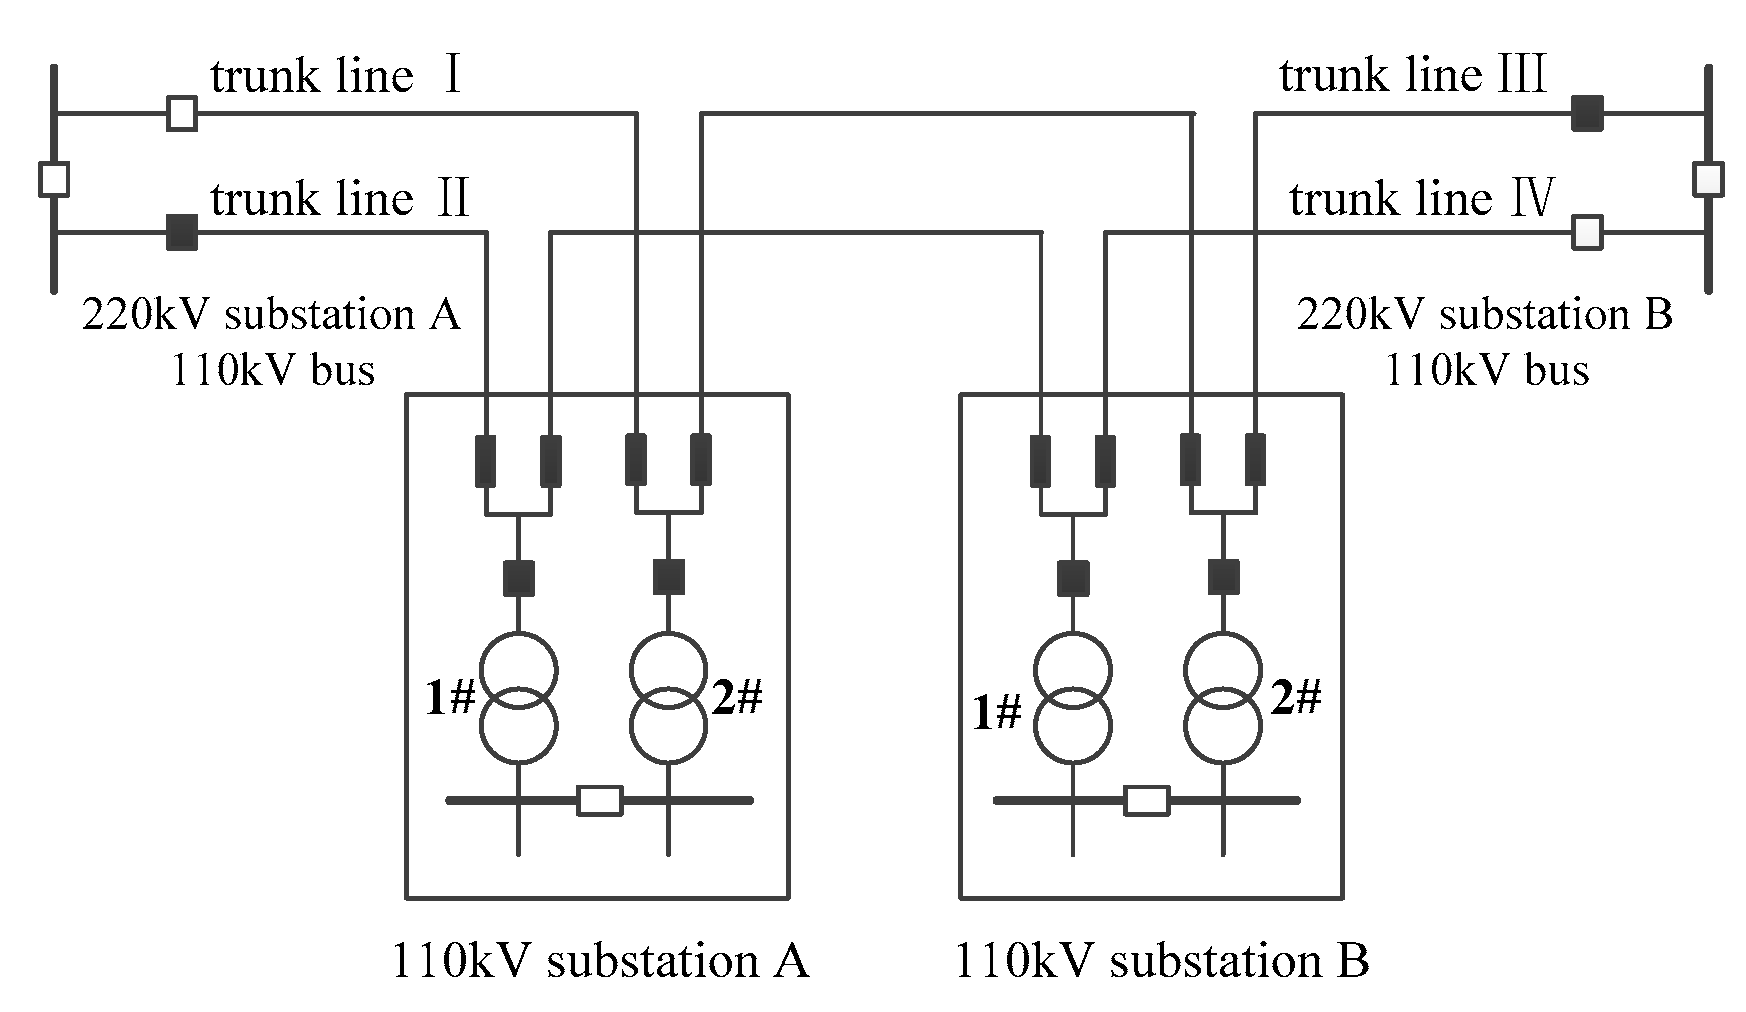
4.1. Analysis of Typical Power Supply Mode and Transfer Mode of High Voltage Distribution Network

A high-voltage (HV) distribution network mainly has the following wiring modes: direct power supply wiring, single-sided power T-type wiring, dual-power T-type wiring, and dual-power π-type wiring. In Figure 2, the electrical wiring diagram of mode 1 [15]—direct power supply wiring mode—is taken as an example. The electrical wiring diagrams of the other three modes are described in Appendix A, and will not be introduced here. Each transformer is responsible for supplying one load partition.
In this paper, the high-voltage side of the substation uses the line-transformer unit connection mode, whose connection between the incoming line and the main transformer is left out. The low-voltage side uses the sectionalized single-bus configuration. Assuming a transformer capacity of 40 megawatts (MW), there is an inter-station connecting line constraint of 10 MW and a domestic connecting line constraint of 40 MW. Each transformer can carry a maximum load of 25 MW. As the line limit transmission capacity is generally greater than the sum of the maximum safety load within the transformer substation, the line capacity limit on the transfer load is not considered.
In Figure 2, when the circuit breaker of 110 kV trunk line I fails, the load partition linked to the 2# transformer of 110 kV substation A loses power. The 25 MW load of this partition will be transferred through the substation A’s domestic connecting line and substation B's inter-station connecting line. Since the other three transformers can work properly, the power loss of the area can be transferred from the domestic connecting line for a 15 MW load as well as from the inter-station connecting line for a 10 MW load. The time it takes from blackout to being fully supplied is the load transfer time.
From the above analysis, we can see that the failure treatment approach is different for some components in different wiring patterns, which causes the difference in substation credible capacity after the GPS integration.

4.2. Reliability Calculation

At present, the reliability evaluation methods of a distribution network mainly include analytic methods and simulation methods. Considering the time order of PV and sequential control characteristics of ESS, in addition to the random failure of high-voltage lines and transformers, a reliability evaluation method based on a sequential Monte Carlo simulation method is presented in this paper.
The timing model of the active distribution network reliability calculation is established as considering different grid structures. This paper comprehensively considers the expected energy not supplied and loss of energy expectation [16] as the evaluation indicators, as shown in Equation (10) below.
R G = 1 N ( n = 1 q E n s . n + n = 1 p E n s . n )
where N represents total years of simulation; Ens represents the loss of energy and energy not supplied in one fault condition; q is the GPS component failure status simulation times; and p is circuit component failure state simulation times. Circuit components are the components of the grid other than GPS components. The specific steps are as follows:
Step 1:
Generate sequential change sequences. According to the WTG and PV output models, the sequential sequence of WTG and PV are generated in the range of total simulation time T. According to the operation strategy under the normal ESS operation states, the state of charge (SOC) sequential change sequences of the ESS are generated. The load sequence is constant and is set as the maximum safety load.
Step 2:
Generate fault state sequences. Perform sequential simulations of GPS components and circuit components in the system, regardless of double and above failures. When the circuit component fault condition occurs, proceed to step 3a and p plus 1. When the fault condition of the GPS component is present, proceed to step 3b and q plus 1.
Step 3:
Fault evaluation. According to different fault component, the evaluation methods are divided into two types:
(a)
When the circuit component fails, look at the failure mode table to determine the loss of load area. Following this, according to the DG output sequence obtained in Step 1, the output condition of DG in the power loss area during the system failure is determined. Determine the size of the load to be transferred and the transfer path: when the transfer fails to complete, conduct a fault operation strategy on the energy storage in the power loss area to supply part of the load. If the total supplement of power for the entire load is not satisfied, determine the quantity of controllable load that needs to be reduced. After all the measures above, the load that still fails to be restored is the dead load of this failure. Record the power shortage for this fault state, Ens.n.
(b)
When the GPS component fails, determine the fault area and remove the fault power. According to the DG output sequence obtained in Step 1, the output of the remaining DG in the fault area is determined. The rest of the processing is the same as step 3a.
Step 4:
Indicator evaluation. The reliability indicator of the system after the GPS integration can be obtained by unifying the GPS component and circuit component fault state calculation indicators, as shown in Equation (10).

5. Method for Evaluating the Substation Credible Capacity of GPS
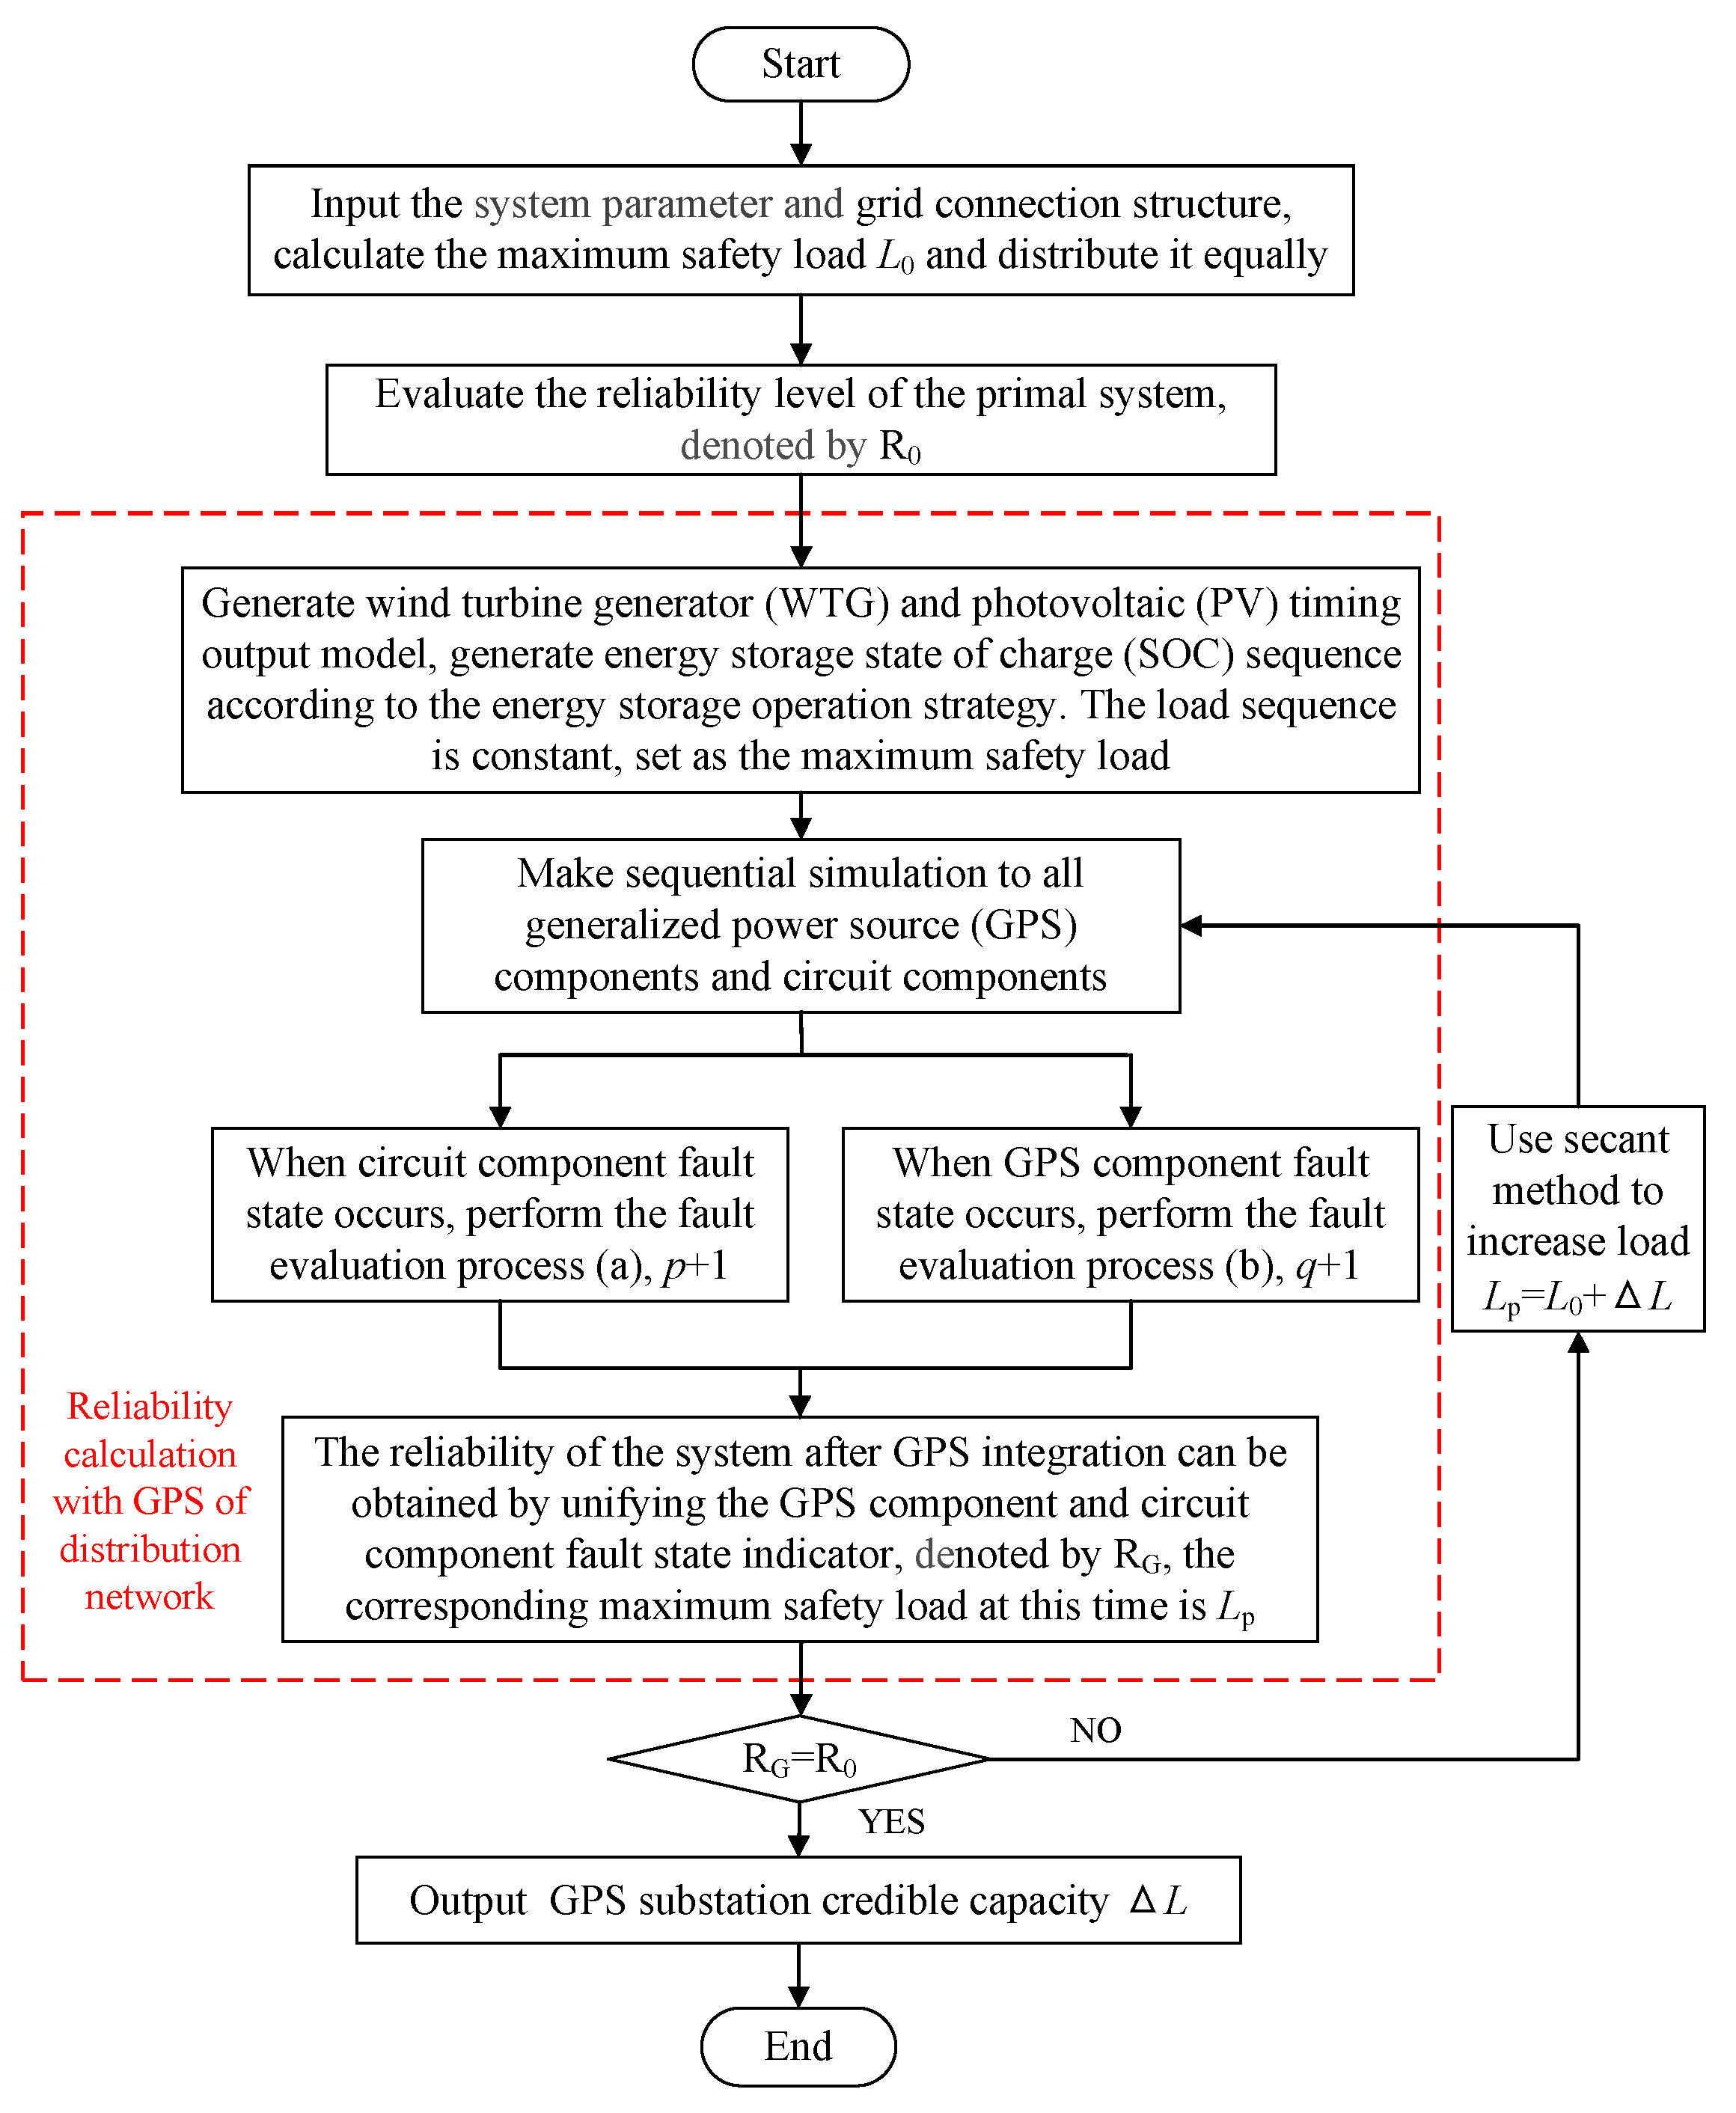
At present, the main methods of credible capacity evaluation are the bisection method [6,17] and Newton method [18]. Considering that there is no specific function formula for derivation, this paper uses the secant method [4,19], which has a fast computing speed. The secant method is a variation of the Newton iteration method, which is a numerical calculation method to find roots. The calculation process is as follows. Take two load values, namely L1 and L2, with the corresponding reliability values being R1 and R2. If R1 and R2 are greater than or less than R0 at the same time, these are re-selected until one of R1 and R2 is greater than R0, with the other one being less than R0. A straight line connecting the points (L1, R1) and (L2, R2), intersect the line whose ordinate is R0 and parallel to the abscissa axis at a point L. Obtain the corresponding reliability level R. If R is greater than R0, L is the new L1. Following this, connect the new (L1, R1) and (L2, R2) before creating a loop.
The concrete steps of solving the substation credible capacity of GPS in the active distribution network are as follows:
Step 1:
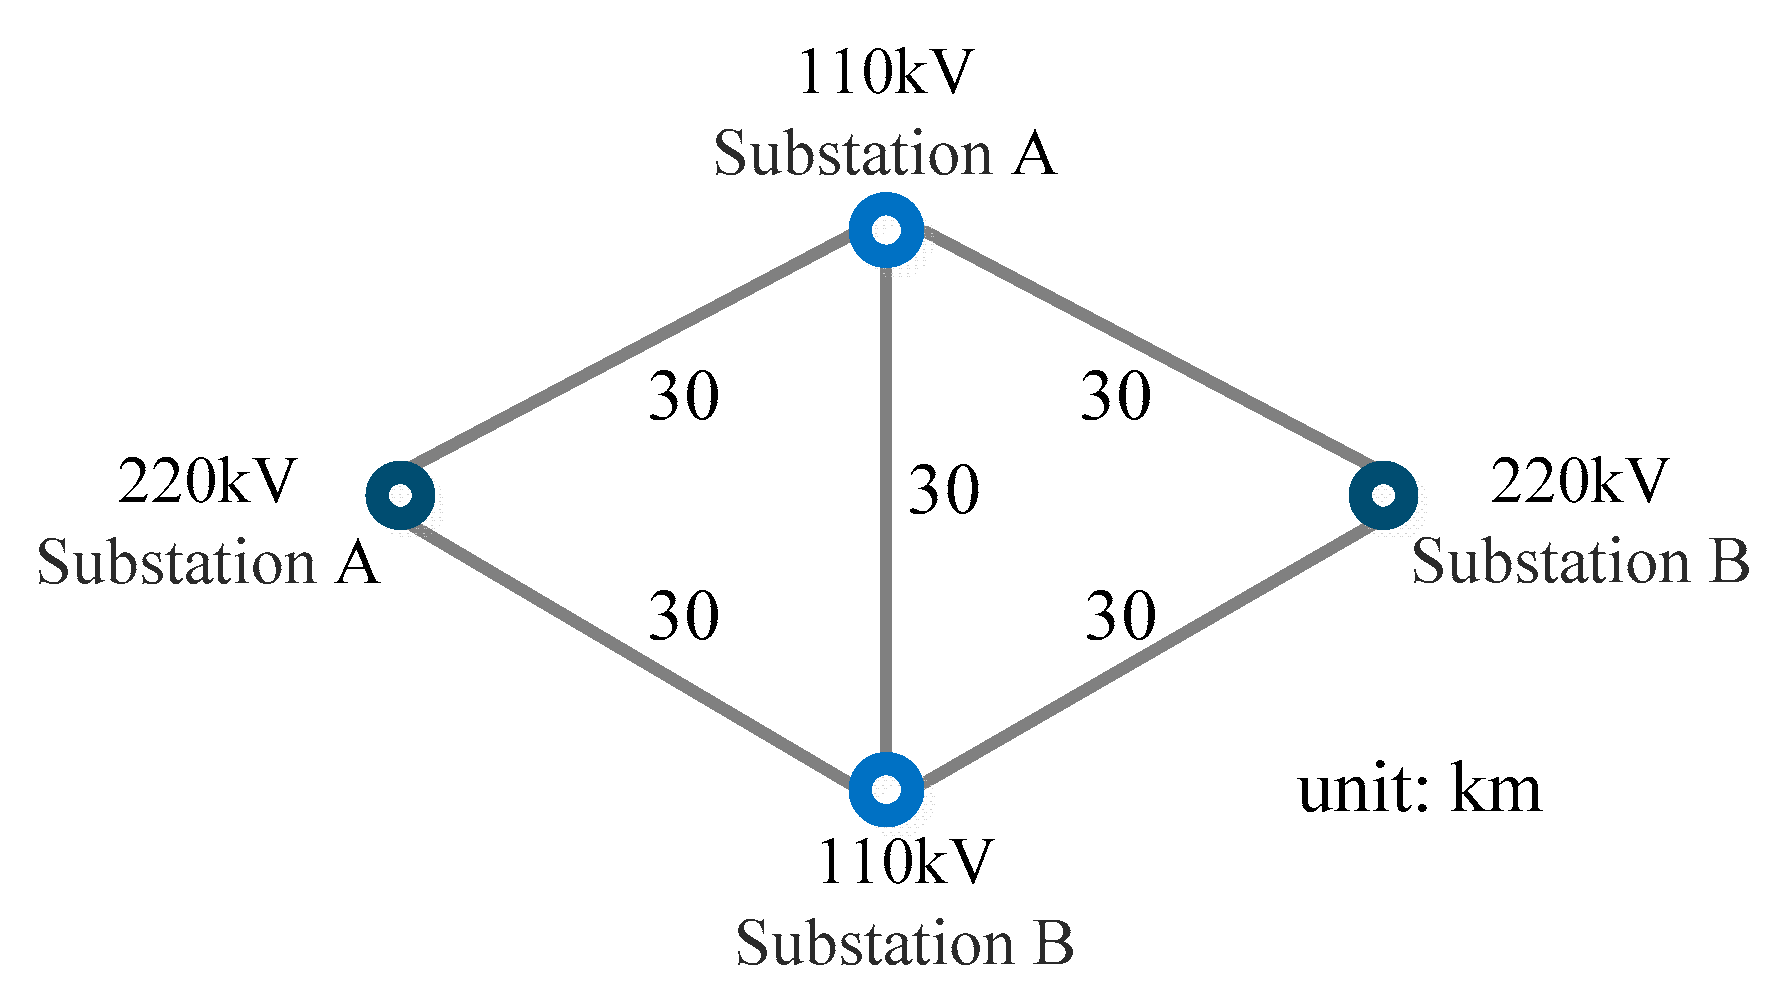
Input the grid connection structure of the HV distribution network and the inter-station contact constraint of the substation. According to the previous literature [20], the maximum safety load of the system under the wiring structure is obtained by linear optimization. Through the automatic traversing of the computer, a failure impact analytical table of all circuit components is established and the modes of transferring are determined.
Step 2:
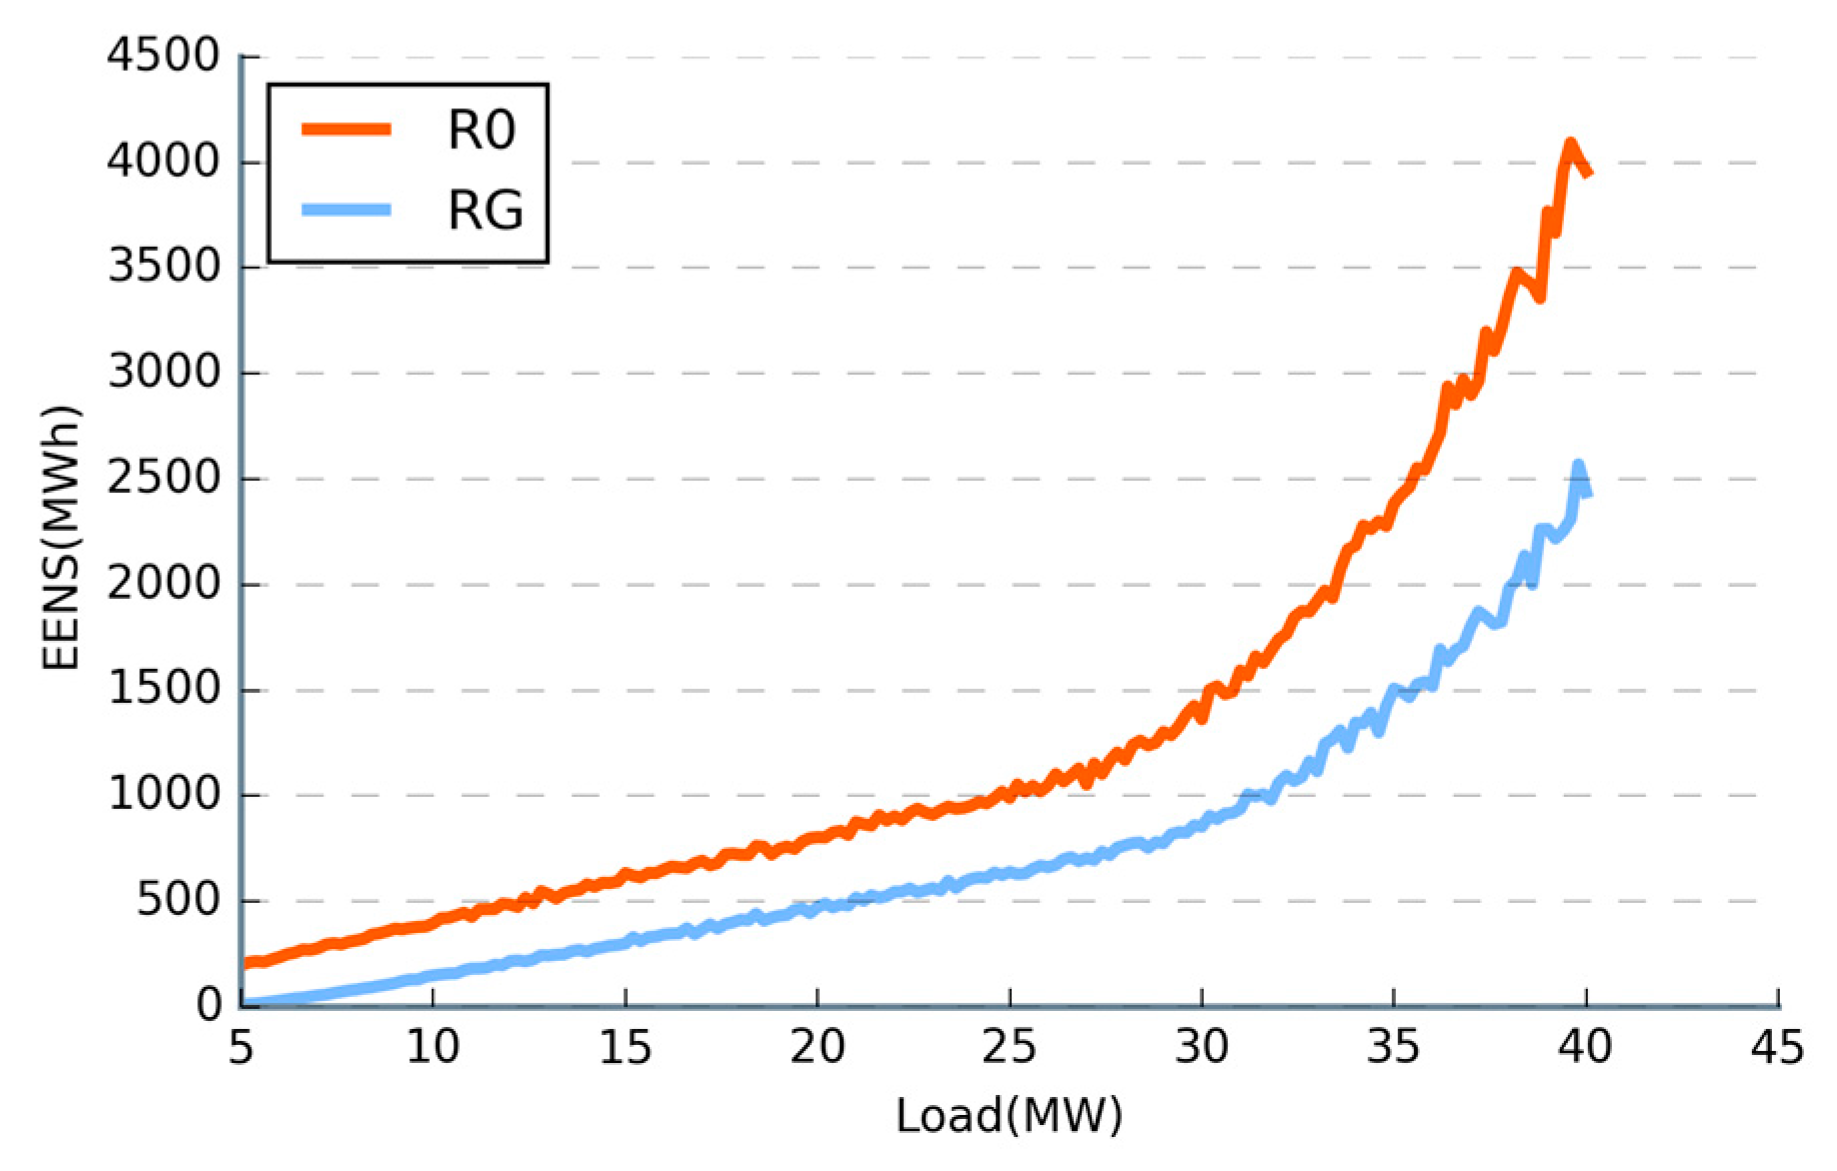
Calculate the reliability level R0 in the primal system when the GPS is not integrated.
Step 3:
Calculate the distribution network reliability level RG with GPS integration using the Monte Carlo simulation method as described in Section 4.2.
Step 4:
Using the secant method to adjust load (primal load is the maximum safety load L0), make the system reliability RG after the GPS integration equal to the primal system reliability R0. Obtain the corresponding maximum safety load Lp at this time. The difference between Lp and L0 is the increment of the load, ΔL, which is exactly the substation credible capacity of the accessed GPS.
The concrete calculation is shown in Figure 3.

6. Case Study

6.1. System Parameters

This paper takes the development zone in Gonghe County of Qinghai as an example. The planning area is 8.41 km2, which is divided into four districts for load forecasting. Supposing that all of the 110 kV/10 kV substation capacity in this area are 2 × 40 MVA, the loads in the four districts are equally distributed. The station internal contact constraint is 40 MVA, and the inter-station contact constraint is 10 MVA. According to the definition of the maximum safety load, the maximum supply load in one substation partition is 50 MVA. Under normal operating conditions, the peak load that each transformer can take is set as 25.0 MW. Therefore, we set the initial annual load peak as 25 MVA. If the station internal load transfer is designed with a backup automatic switch, the time for the transfer can be ignored. This paper is confined to the calculation accuracy. In order to make the results more observable, the inter-station load transfer time is set to 1 h. Circuit components are divided into four categories: 110 kV overhead lines, 10 kV circuit breakers, 110 kV circuit breakers, and 110/10 kV transformers. The failure rates and repair time are set in Table 1, in which t is one time, a represents one year, and u is one component. The reliability parameters of WTG and PV are shown in Table 2.
In this paper, the case is provided, including four typical connection modes 1 to 4 that respectively corresponded to: direct power supply wiring, single-sided power T-type wiring, dual-power T-type wiring, and dual power supply π-type wiring. In each mode, a total of four substations of 220 kV and 110 kV are connected in line according to the geographical position in Figure 4 to ensure that the length of line of each mode is substantially equal. ACSR-120/20 overhead line is selected as the 110 kV line.
On the whole, the failure transfer ways and reliability of the four modes are qualitatively summarized in Table 3.
The rated installed capacity of photovoltaic power generation in the region is 100 MW. The number of wind turbines is 358 units, while the rated capacity is 335 kW. The cut-in wind speed, rated wind speed, and cut-out wind speed of wind turbines are, respectively: 2 m/s, 12 m/s, and 25 m/s. According to the data of the Bureau of Meteorology, the average wind speed in Gonghe County is 13.5 m/s. In addition, a 25 MW load is used as a benchmark for the following GPS penetration rate calculation.

6.2. Impact of GPS Integration on System Reliability

This paper comparatively analyzes the trend of distribution network reliability, which was found to vary with the load under both conditions with and without GPS integration. This is shown in Figure 5. R0 is the reliability without GPS. RG is the reliability with GPS. The expected energy not supplied (EENS) is the indicator of reliability.
With an increase in load, the gap in reliability before and after GPS integration increases, indicating that the credible capacity of GPS increases with load and shows an upward trend. When the load is less than 25 MW, the increase in load is not significant, although R0 and RG keep following the upward trend. This is because at this time, the load does not reach the maximum safety load of the system. The increased load can be shared by the system line capacity margin and the substation capacity margin, so the power shortage is basically the same. Therefore, in this paper, the initial load capacity corresponding to R0 is set as the maximum capacity of the distribution network satisfying the N-1 constraints, which is the maximum safety load of the system. This aims to eliminate the interference of the system capacity margin.

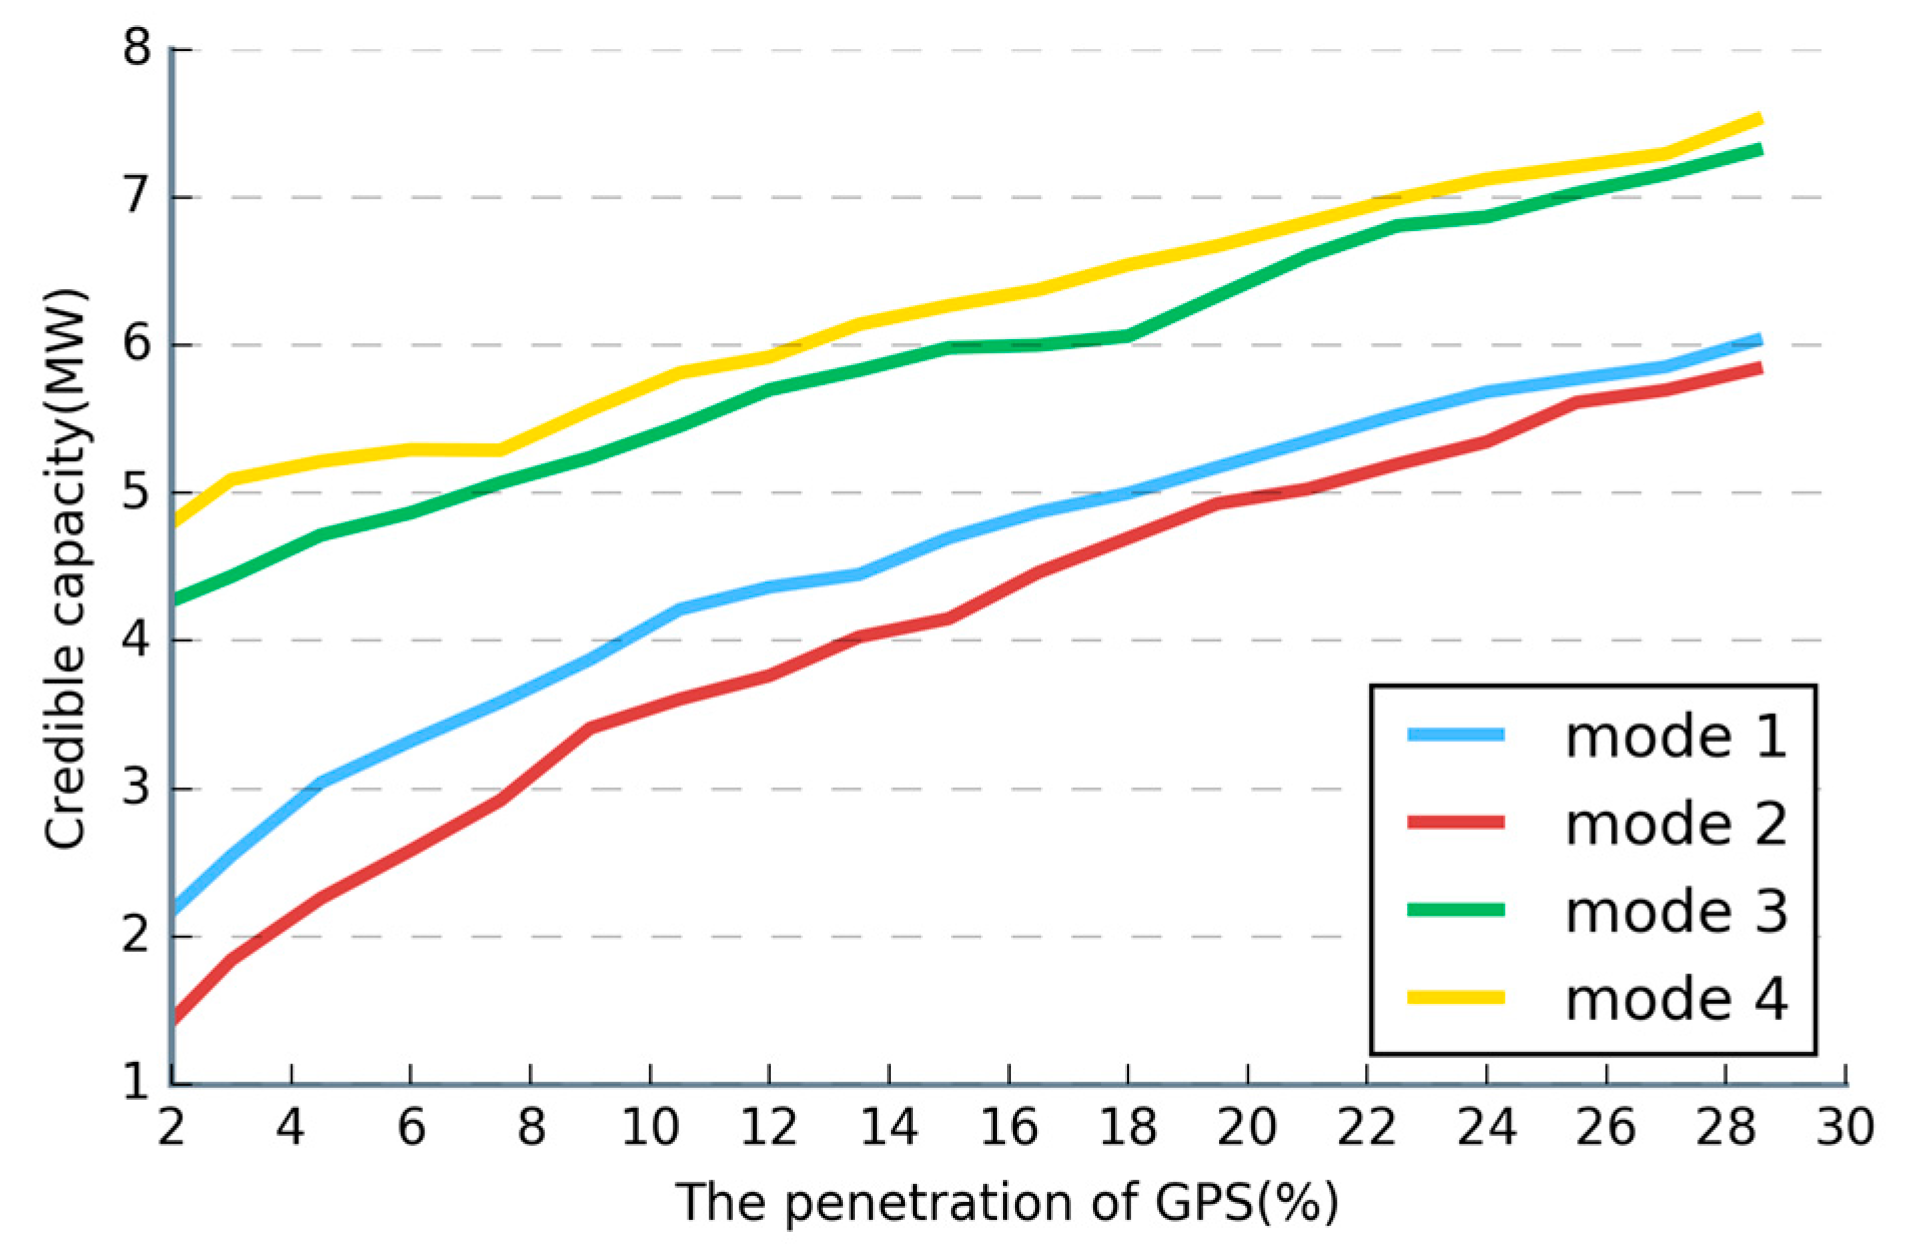
6.3. Substation Credible Capacity of GPS under Different Wiring Modes

During the calculation process, the reliability indicator R0 of mode 2 in the case of no GPS and a load of 25 MW is used as the benchmark to calculate the change of the credible capacity, corresponding to each instance under different GPS penetration rates. At the same time, WTG, PV, ESS, and each power supply penetration iterative calculation step length is 0.5%. In this paper, the definition of GPS penetration rate is defined as the proportion of the sum of the rated capacity of WTG, PV, and ESS to the maximum load of the system. Considering that there is a large influence of the controllable load and that the proportion is small in reality, the controllable load is set as a fixed value of 2% and is not included in the total penetration. The comparison of the simulation results of the four modes under different GPS penetration rates is shown in Figure 6.
Comparison between credible capacities of four wiring modes under different GPS penetration rates is shown in Table 4.
According to the results shown in Table 4 and Figure 6, we can see that the substation credible capacity of GPS is different under different grid structures. Among them, the substation credible capacity corresponding to the single-side power T-type wiring in mode 2 is the minimum, while the substation credible capacity corresponding to the two-side power π-type wiring in mode 4 is the maximum. Mode 2 has the lowest reliability, and mode 4 has highest reliability, which verifies the analysis of Table 3. In addition, with a further increase in penetration, the gaps between substation credible capacities of GPS in those four modes become smaller. Within a certain range, the GPS capacity increases and the improvement of the system reliability is still significant.

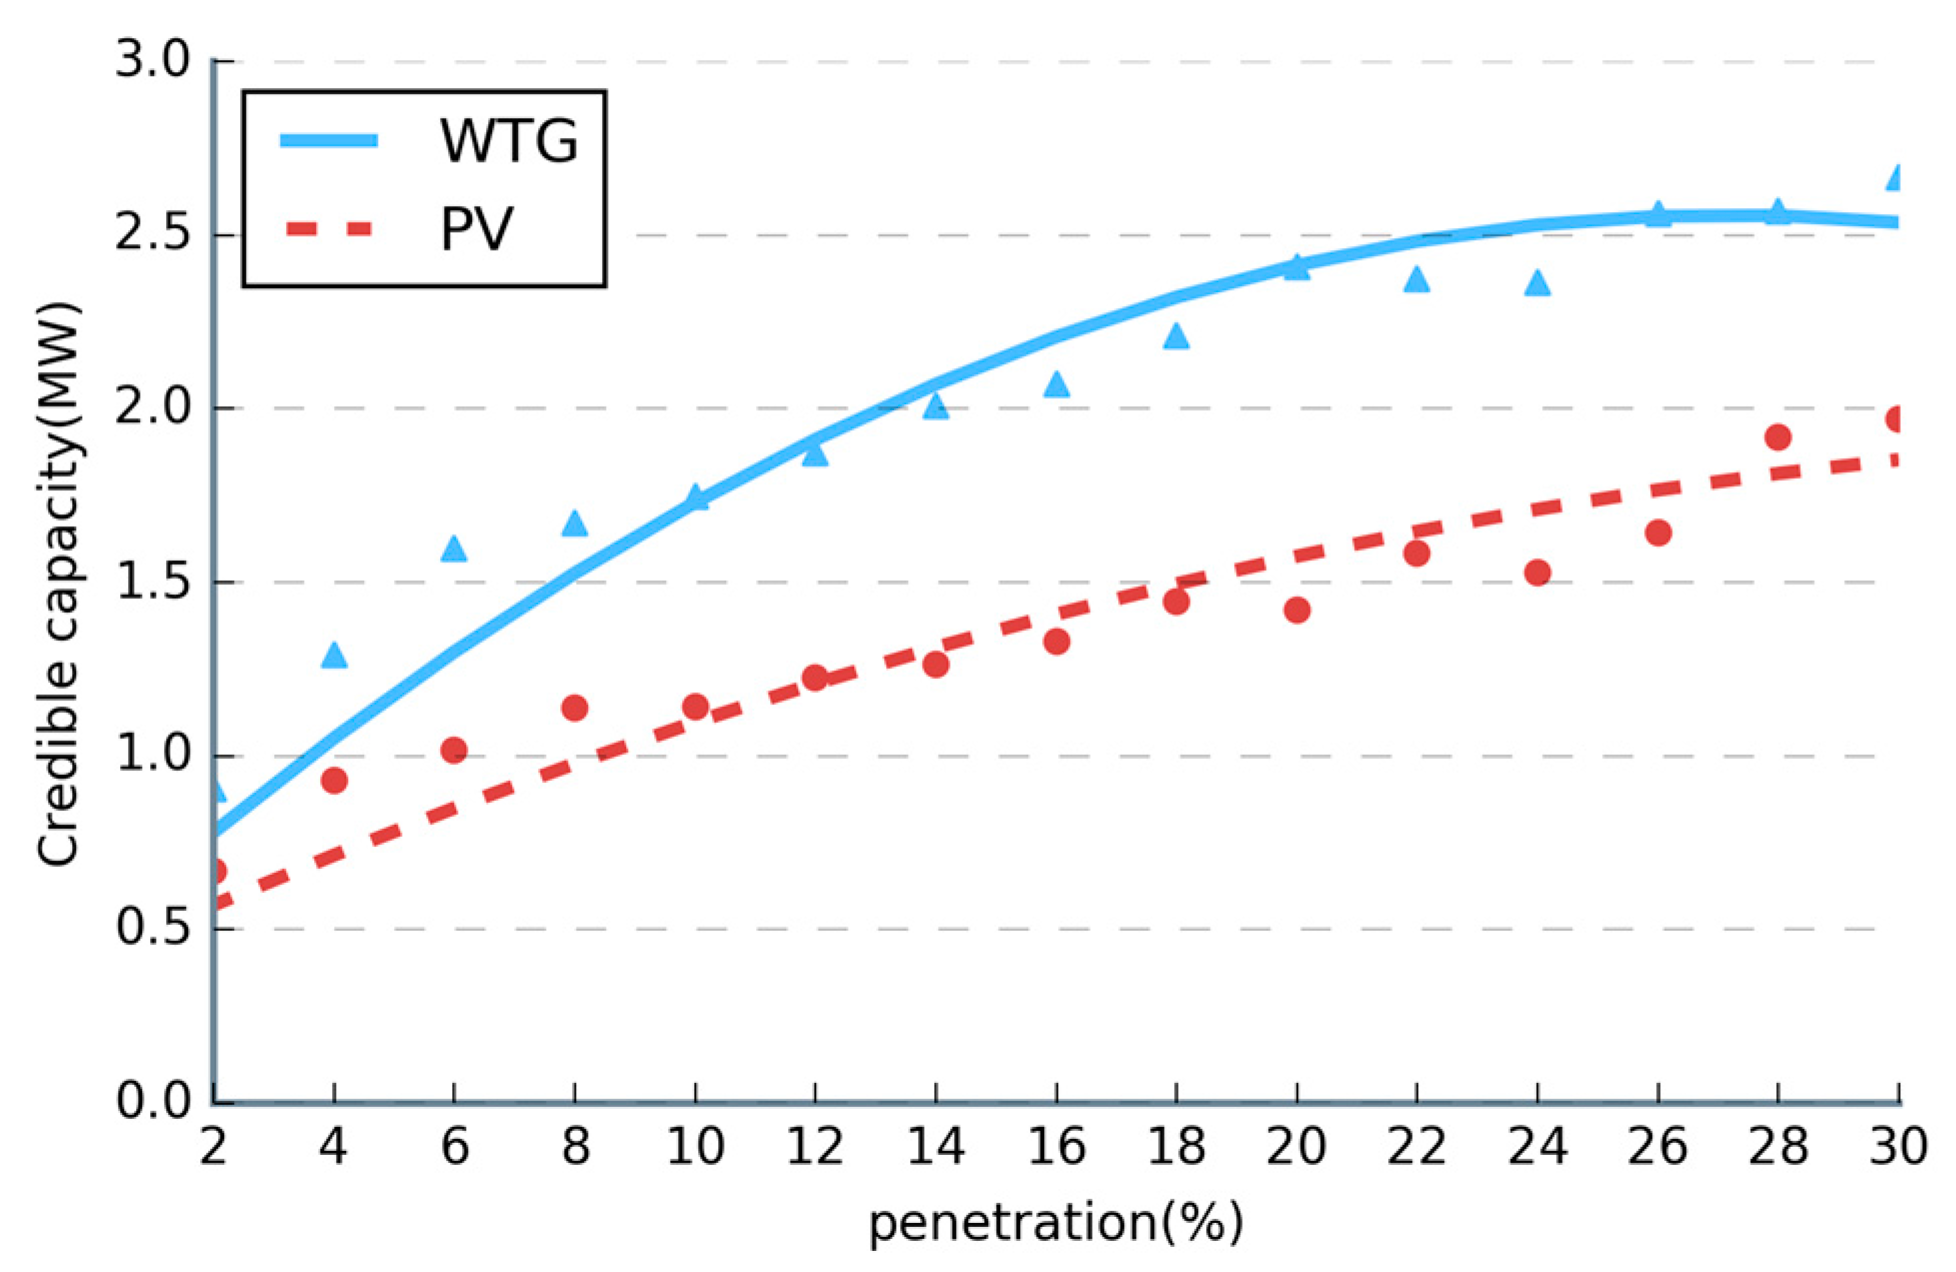
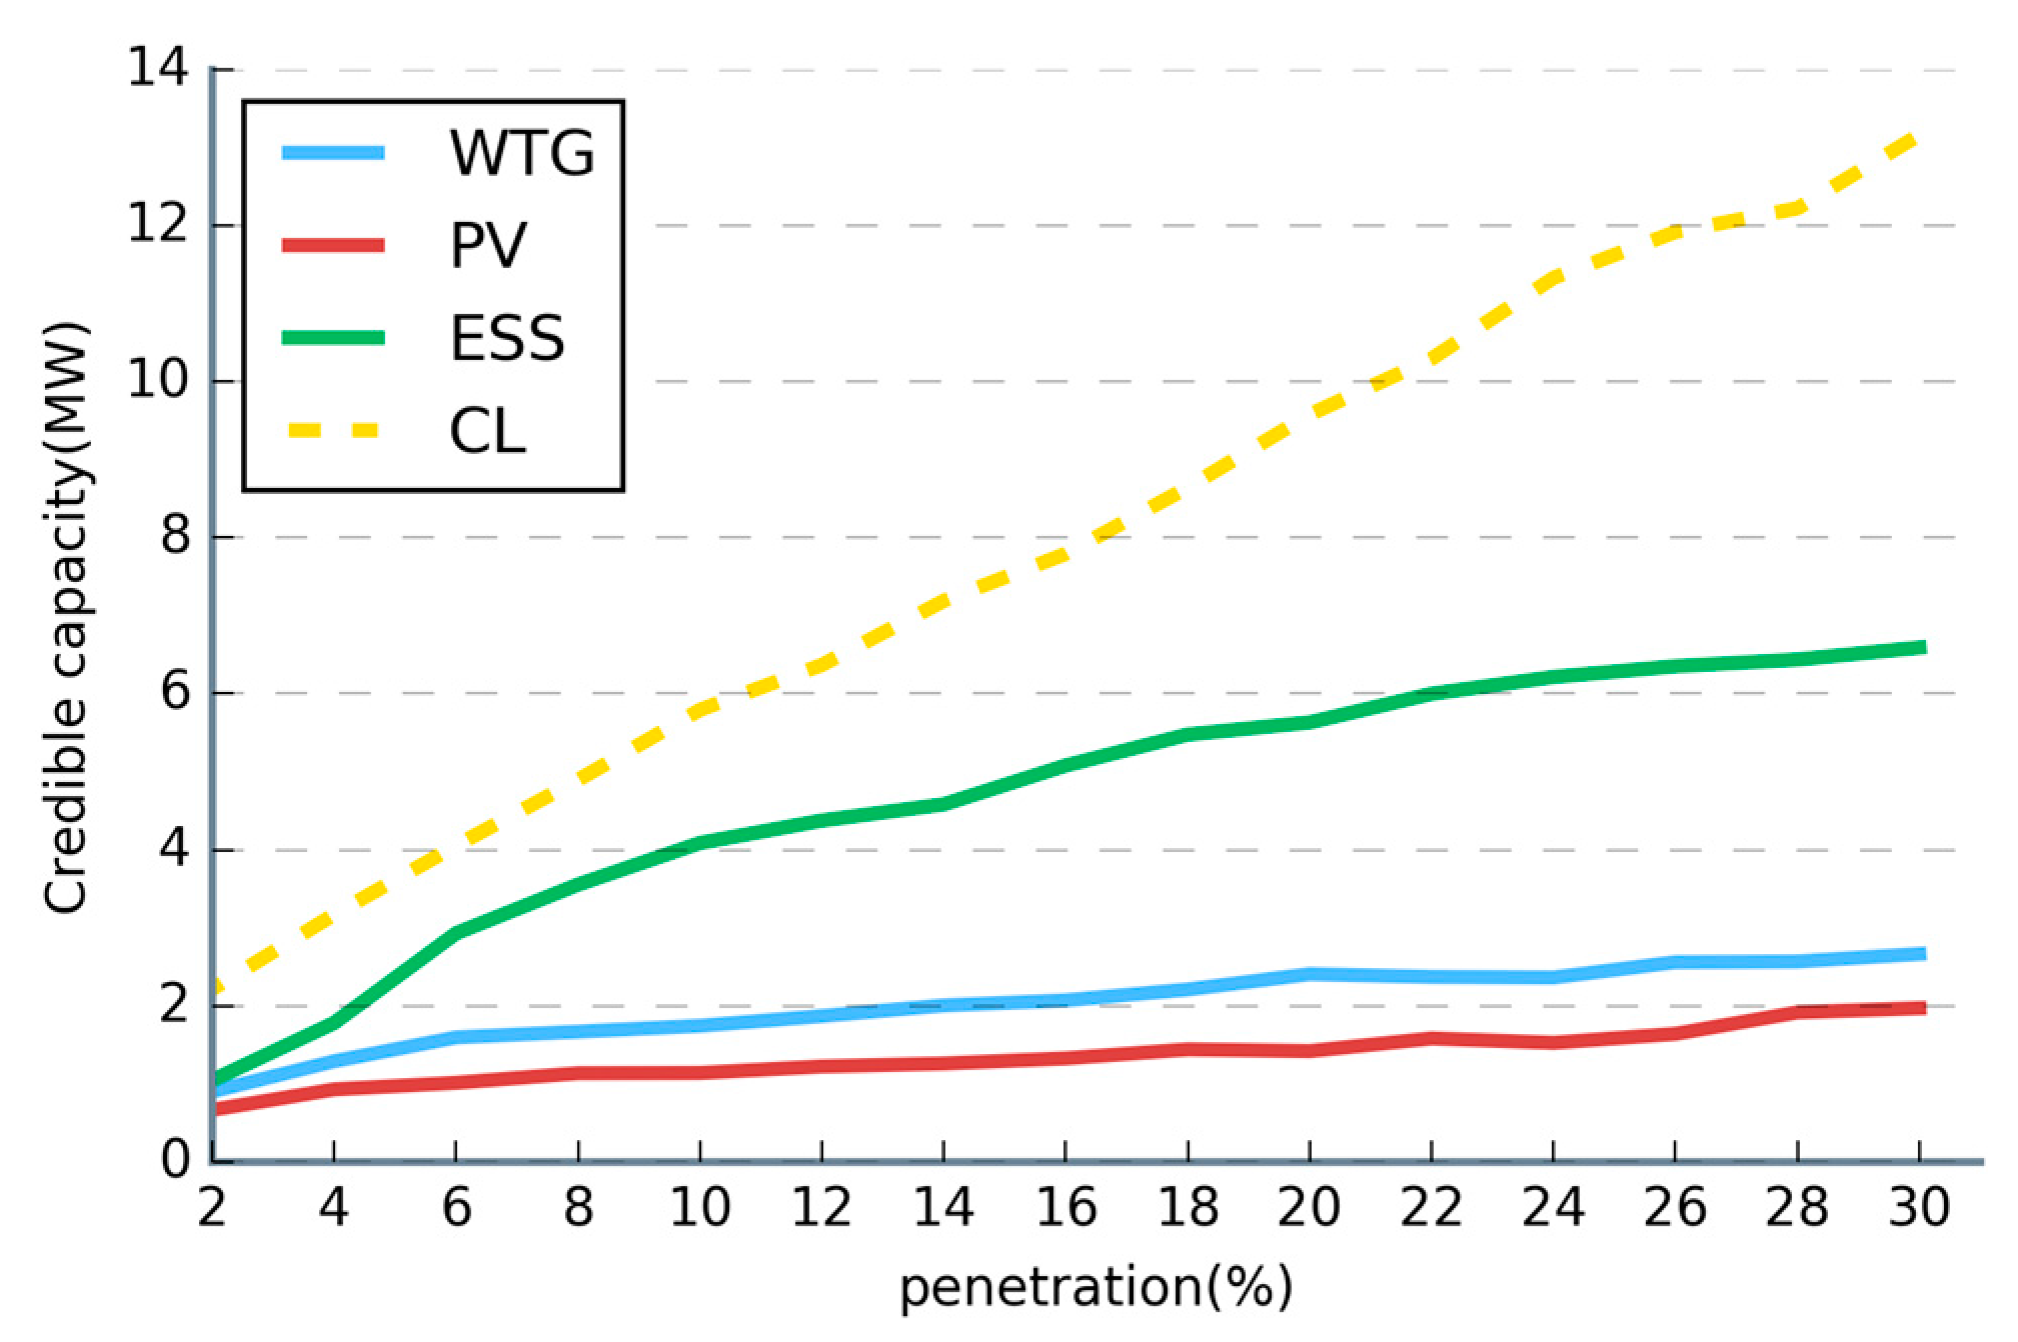
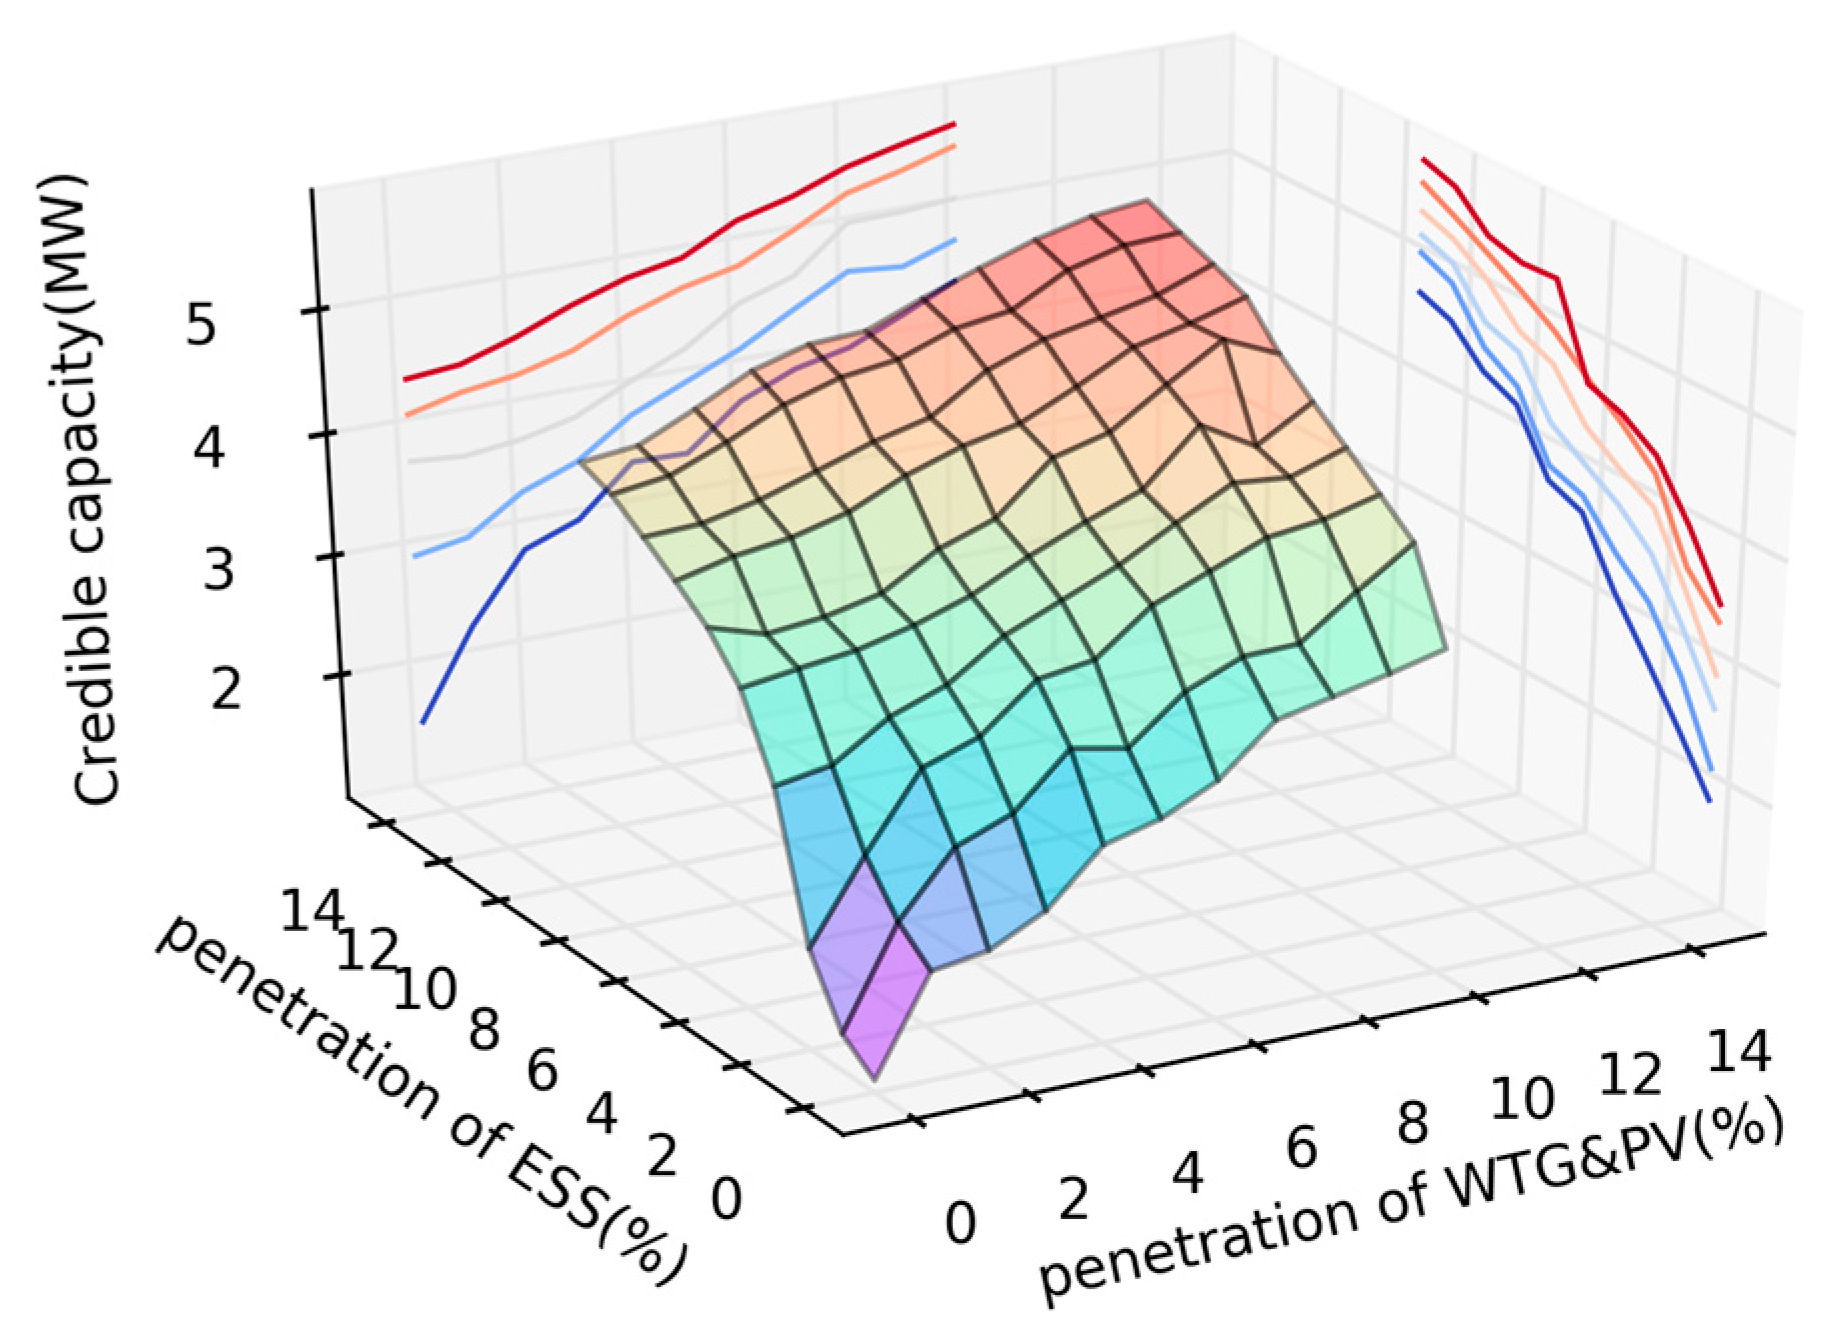
6.4. Substation Credible Capacity of GPS under Different GPS Types

To further analyze the influence of different types of GPS on the substation credible capacity, we changed the penetration of intermittent DG (WTG and PV), energy storage system (ESS), and the demand-side controllable load (CL). This was made on the basis of other parameters remaining unchanged. Figure 7 shows the corresponding substation credible capacity in different scenarios.
As shown in Figure 7, the increase in controllable load penetration contributes the most to the substation credible capacity in the case where only a single GPS increased penetration is considered. The impact of ESS is less than that of controllable load. When changing the penetration of WTG or PV power alone, the corresponding variation in substation credible capacity is small. Figure 8 shows the quadratic function fitting for only the changes in WTG and PV penetration. It can be seen that WTG is slightly more pronounced than PV.
Credible capacity comparison under different DG (WTG and PV) and ESS penetration conditions is shown below (Figure 9).
It can be seen that the increase of controllable load and ESS penetration will significantly improve the reliability of the system and contribute significantly to the substation capacity. Due to the intermittency and fluctuation, the increase of system reliability is not obvious when only WTG or PV is installed. They require ESS for cooperation in order to maximize the reliability of the distribution network and to improve the GPS substation capacity.

7. Conclusions

This paper considers WTG, PV, ESS, and the controllable load as a whole, which is referred to as the generalized power source (GPS) in a distribution network. The definition of the substation credible capacity of GPS is provided, and a calculation method of the substation credible capacity considering the grid structure is put forward. The substation credible capacity evaluates the capacity value that GPS can replace the capacity of the substation. The following conclusions are obtained by simulation analysis:
  • GPS in the distribution network can replace substation capacity. The access of GPS can reduce the shortage of power supply and improve the reliability of the system.
  • It is necessary to consider the influence of the different grid structures on substation credible capacity of GPS in order to improve reliability calculation accuracy and provide reference for the substation capacity planning of GPS integration in an active distribution network.
  • The contribution of the controllable load to substation credible capacity is the most obvious. The influence of the ESS is smaller than that of the controllable load. Due to the intermittency and fluctuation of the PV and WTG, ESS coordination is needed to maximize the substation credible capacity of GPS.

Author Contributions

Wenxia Liu designed, directed and made suggestions to this research. Yicong Liu was responsible for the experiments, analyzed the data and wrote this paper. Shuya Niu contributed to analysis, writing and the revision. Zongqi Liu took part in the revision work. All authors have read and approved the final manuscript.

Conflicts of Interest

The authors declare no conflict of interest.

Abbreviations

The following abbreviations are used in this manuscript:
DGDistributed Generator
DRDemand response
GPSGeneralized Power Source
CFCapacity factor method
HVHigh Voltage
ESSEnergy Storage System
CLControllable Load
ELCCEffective Load Carrying Capacity
EENSExpected energy not supplied
LOEELoss of energy expectation
SAIDISystem average interruption duration indicator
WTGWind Turbine Generator
PVPhotovoltaic
DLCDirect Load Control
ILInterruptible load
DSBDemand-side bidding
EDREmergency demand response
CASPCapacity/ancillary service program
SOCState of Charge
kVkilovolt
MWMegawatt
MVAMegavolt-ampere(s)
ACSRAluminum cable steel reinforced

Appendix A

The electrical wiring diagrams of modes 2, 3, and 4 mentioned in Section 4.1 are respectively shown in Figure A1, Figure A2 and Figure A3 [15].
Figure A1. Mode 2, known as single-sided power T-type wiring.
Sustainability 09 00928 g010
Figure A2. Mode 3, known as dual-power T-type wiring.
Sustainability 09 00928 g011
Figure A3. Mode 4, known as dual-power π-type wiring.
Sustainability 09 00928 g012
The following is a simple example which illustrates the process of using the Monte Carlo simulation method and the secant method to obtain the GPS substation credible capacity, providing an illustration of the computation flow of Figure 3 in Section 5.
Figure A4. Wiring diagram of the simple example.
Sustainability 09 00928 g013
The wiring diagram of the simple example is taken from a portion of the wiring diagram of the direct power supply wiring mode 1 in Figure 2. As shown in Figure A4, there are five components in the network, including non-power components: circuit breakers Q F 1 and Q F 2 ; a transformer T r and transmission line L ; and a generalized power source (GPS) for power supply. These are respectively numbered j = 1, 2, 3, 4, 5. The failure rate of the components is λj in an hour, while the repair time is Δ t j . On the 10 kV bus side, the load P L ( t i ) and inter-station transfer power transmitted over the low voltage line P T ( t i ) are accessed.
First, the following assumptions are made:
(1)
Assuming that there is at most one component failure in the same time period, the probability of a failure of a single component in time ts is satisfied with the Poisson distribution P j = 1 e λ j t s , where λ j represents the failure rate of components in one hour.
(2)
To calculate the substation credible capacity of GPS, set P L ( t i ) to constant L a here. That is, during the calculation process in 8760 h of a year, P L ( t i ) remains unchanged to remove the impact of load fluctuations.
(3)
GPS components only fail in the working state, with the power loss in a failure equal to the rated output of the fault component.
  • The process of obtaining the reliability R using the Monte Carlo simulation method:
    (1)
    Enter the component parameters, set the current time as t i = 0, the year k = 0, and the total failure power loss E F = 0.
    (2)
    Calculate the fault probability P j of the five components.
    (3)
    When k < N and ti is equal to 8760, reset ti = 0. When k < N and ti < 8760, calculate the WTG/PV output at time k and determine the SOC status of the ESS according to the size of P W T G , P P V , P L , and transfer load PT. At time ti, five random numbers (j = 1, 2, 3, 4, 5) that are uniformly distributed are generated. The probability of failure is compared with the corresponding random number.
    (4)
    If r j > P j , no failure, return to the third step to calculate the next moment ti + 1.
    (5)
    If r j P j and j is not a GPS component, j fails and the system switches to the circuit component failure state. The fault lasts for Δ t j hours.
    (i)
    Calculate the sum of the GPS outputs, including P W T G , P P V , P L , and P T , and compare with load P L to determine the size of the controllable load P D to be reduced.
    (ii)
    If there is still a load to be supplied after all the controllable load resources are used, the remaining load at this time is the power failure load P f . During the time t i to t i + 1, the total blackout is updated to E F = E F + P f × 1 .
    (iii)
    In the event of a fault duration Δ t j , if t i + Δ t j < 8760, repeat steps (1) and (2). Otherwise, return to step (3).
    (iv)
    When the fault is over, return to step (3).
    (6)
    If r j P j and j is a GPS component, GPS component j fails, and the system enters the GPS component failure state. The fault lasts for Δ t j hours.
    (i)
    Calculate the lack of power supply PG for the GPS component.
    (ii)
    During the time t i to t i + 1, update the total power loss E F = E F + P G × 1 .
    (iii)
    In the event of a fault duration Δ t j , if t i + Δ t j < 8760, go back to step (6i). Otherwise, return to step (3). After the fault, return to step (3).
    (7)
    When k = N, stop the calculation of the total amount of power loss and calculate the annual average loss of power E ¯ F = 1 N × E F . When N is large enough, R E ¯ F of the system at this time.
  • Use the secant method to calculate the credible capacity:
    (1)
    Enter the system parameters (including the GPS penetration at this time) and set the initial system maximum power supply load as L 0 .
    (2)
    Use the Monte Carlo method to calculate the original system reliability level R0 without GPS.
    (3)
    Calculate the reliability level RG of the system, corresponding to the maximum supply load level under GPS.
    (4)
    Use the secant method to adjust LP and repeat step (3). Finally, make RG = R0.
    (5)
    Calculate Δ L = L P L 0 according to the ELCC method, with the substation credible capacity at this level of GPS being ΔL.

References

  1. Liu, W.; Niu, S.; Shi, D.; Xie, J.; Xu, H. Optimal allocation of ADS battery energy storage considering operation strategy and investment subject benefit. Power Syst. Technol. 2015, 10, 2697–2704. [Google Scholar]
  2. Gholizadeh-Roshanagh, R.; Najafi-Ravadanegh, S.; Hosseinian, S. A Framework for Optimal Coordinated Primary-Secondary Planning of Distribution Systems Considering MV Distributed Generation. IEEE Trans. Smart Grid. 2016. [CrossRef]
  3. Tanaka, I.; Ohmori, H. Scenario generation with clustering for optimal allocation of renewable DG. In Proceedings of the 2016 IEEE Innovative Smart Grid Technologies-Asia (ISGT-Asia), Melbourne, Australia, 28 November–1 December 2016; pp. 966–971. [Google Scholar]
  4. Ding, M.; Xu, Z. Empirical Model for Capacity Credit Evaluation of Utility-Scale PV Plant. IEEE Trans. Sustain. Energy 2017, 8, 94–103. [Google Scholar] [CrossRef]
  5. Sallam, A.; El-Khattam, W.; El-Salmawy, H. Economic impact of Capacity Credit evaluation for Wind Energy Conversion Systems projects in Egypt. In Proceedings of the Power Systems Conference (MEPCON), 2016 Eighteenth International Middle East, Cairo, Egypt, 27–29 December December 2016; pp. 664–669. [Google Scholar]
  6. Zhou, Y.; Mancarella, P.; Mutale, J. Framework for capacity credit assessment of electrical energy storage and demand response. IET Gener. Transm. Distrib. 2016, 10, 2267–2276. [Google Scholar] [CrossRef]
  7. Ge, S.; Wang, S.; Lu, Z.; Liu, H.; Feng, Z.; Lu, Z. Substation Optimization planning method based on capacity credit evaluation of distributed generator. Autom. Electr. Power Syst. 2015, 19, 61–67. [Google Scholar]
  8. Ge, S.; Wang, S.; Lu, Z. Substation planning method in an active distribution network under low-carbon economy. Mod. Power Syst. Clean Energy 2015, 3, 468–474. [Google Scholar] [CrossRef]
  9. Ziadi, Z.; Taira, S.; Oshiro, M.; Funabashi, T. Optimal power scheduling for smart grids considering controllable loads and high penetration of photovoltaic generation. IEEE Trans. Smart Grid 2014, 5, 2350–2359. [Google Scholar] [CrossRef]
  10. Liu, W.; Niu, S.; Xu, H. Optimal planning of battery energy storage considering reliability benefit and operation strategy in active distribution system. Mod. Power Syst. Clean Energy 2017, 5, 177–186. [Google Scholar] [CrossRef]
  11. Billinton, R.; Bai, G. Generating capacity adequacy associated with wind energy. IEEE Trans. Energy Convers. 2004, 19, 641–646. [Google Scholar] [CrossRef]
  12. Billinton, R.; Chen, H.; Ghajar, R. Time-series models for reliability evaluation of power systems including wind energy. Microelectron. Reliab. 1996, 36, 1253–1261. [Google Scholar] [CrossRef]
  13. Cha, S.T.; Jeon, D.H. Reliability evaluation of distribution system connected photovoltaic generation considering weather effects. In Proceedings of the 8th International Conference on Probability Methods Applied to Power Systems, Ames, IA, USA, 12–16 September 2004; pp. 451–456. [Google Scholar]
  14. State Grid Corporation of China. The Code of Planning and Design of Urban. Electric Network; China Electric Power Press: Beijing, China, 2007; p. 14. ISBN 155083.1604. [Google Scholar]
  15. Ge, S.; Guo, Y.; Liu, H.; Ma, K.; Liu, J. Load Supply Capability Based Analysis of HV Distribution Network Connection Mode. Power Syst. Technol. 2014, 2, 405–411. [Google Scholar]
  16. Ge, S.; Wang, H. Reliability Evaluation of Distribution Networks Including Distributed Generations Based on System State Transition Sampling. Autom. Electr. Power Syst. 2013, 2, 28–35. [Google Scholar]
  17. Gami, D.; Sioshansi, R.; Denholm, P. Data Challenges in Estimating the Capacity Value of Solar Photovoltaics. Available online: https://ise.osu.edu/isefaculty/sioshansi/papers/pv_cv_subhour.pdf (accessed on 20 May 2017).
  18. Liang, S.; Hu, X.; Zhang, D.; Zhang, H.Y.; Wang, H.H. Capacity credit evaluation of wind generation considering wind speed variation characteristics. Proc. CSEE 2013, 33, 18–26. [Google Scholar]
  19. Zhang, L.; Wu, Y.; Lou, S.; Yang, Y.; Wang, Y. Photovoltaic generation capacity credit evaluation method considering its daily output characteristics. In Proceedings of the 2014 International Conference on Power System Technology, Chengdu, China, 20–22 October 2014; pp. 2763–2768. [Google Scholar]
  20. Chen, K.; Wu, W.; Zhang, B.; Djokic, S.; Harrison, G.P. A method to evaluate total supply capability of distribution systems considering network reconfiguration and daily load curves. IEEE Trans. Power Syst. 2016, 31, 2096–2104. [Google Scholar] [CrossRef]
Figure 1. A power supply partition schematic diagram. DG: distributed generation; ESS: energy storage system; GPS: generalized power source.
Sustainability 09 00928 g001
Figure 2. Mode 1, known as the direct power supply wiring.
Sustainability 09 00928 g002
Figure 3. Computation flow of generalized power source (GPS) substation credible capacity calculation.
Sustainability 09 00928 g003
Figure 4. Geographical location sketch map of substations.
Sustainability 09 00928 g004
Figure 5. Reliability with and without GPS integration.
Sustainability 09 00928 g005
Figure 6. Credible capacity under different wiring modes.
Sustainability 09 00928 g006
Figure 7. Credible capacity under different types of GPS penetration. CL: controllable load.
Sustainability 09 00928 g007
Figure 8. WTG and PV quadratic function fitting curve.
Sustainability 09 00928 g008
Figure 9. Credible capacity under different DG (WTG and PV) and ESS penetrations.
Sustainability 09 00928 g009
Table 1. The component reliability parameters.
Parameter110 kV Overhead Lines10 kV Circuit Breakers110 kV Circuit Breakers110/10 kV Transformers
Failure rate0.01/t·(a·km)−10.005/t·(a·u)−10.02/t·(a·u)−10.005/t·(a·u)−1
Repair time (h)1247.548
Table 2. The reliability parameters of wind turbine generator (WTG) and photovoltaic (PV).
ParameterWTGPV
Fault probability (%/u)8.683.1
Repair time (h)55
Table 3. Qualitative analysis of the four modes.
Transfer Ways When 110 kV Circuit Breaker on Trunk Line I FailReliability
mode 1In-station + inter-station transfer
mode 2In-station transfer onlyLower than mode 1
mode 3Close contralateral breaker, quickly restoredHigher than mode 1 and 2
mode 4Isolate the faulty lineHighest
Table 4. Credible capacity of the four modes under different GPS penetration (megawatt).
Penetration%Mode 1Mode 2Mode 3Mode 4
22.32491.51434.31884.8913
42.98452.15904.66325.1839
63.32132.58244.86655.2943
83.73213.10895.12405.3563
104.11303.50565.38895.8032
124.36373.76455.69915.9209
144.54974.09385.90106.1892
164.77194.38505.99336.3257
184.99894.69596.06216.5443
205.24174.93926.44576.7315
225.48675.12576.73526.9637
245.68455.34716.86937.1246
265.79155.64277.07277.2218
286.06325.79767.26957.4959

