Abstract
Drought vulnerability of agriculture is significant to economic development and sustainable food production. In this paper, we proposed a framework to evaluate the regional agricultural-eco environment in the face of drought caused by climate change. Based on a vulnerability scoping diagram (VSD) model, we built up a comprehensive system to evaluate the agricultural drought vulnerability of Yunnan Province in China. The model highlights the human-land relationship by considering both natural conditions and human activities. Twelve indicators were generated to construct three components of the model: exposure, sensitivity, and adaptive capacity. During the construction of the VSD model, the entropy and the analytic hierarchy process (AHP) comprehensive analysis method were adopted to generate the weights and to compute the composite index for each section. Furthermore, the factor analysis method was used to determine the dominant factors of different cities and the main indicators driving the system. The results indicated a spatial pattern that the vulnerability value was high on the eastern and western sides, but low in the middle of Yunnan Province. Most of the vulnerable regions were concentrated in remote areas. Indicators such as population density, irrigation level, annual average precipitation, cultivation land ratio, and difficulty of water supply were the main driving factors. This means that there is a deep connection between agricultural drought vulnerability and urbanization. The evaluation system developed during this research will provide guidance for drought mitigation in regions of complex terrain.
1. Introduction
Extreme natural events seriously affect people’s production and living. Drought, which is typically associated with aridity, creates problems, such as soil water shortage, imbalance of crop water, and reduction of crop yield. The characteristics of drought include, but are not limited to, frequency (too often), duration (too long), and area influenced (too broad). As climate has changed dramatically, the drought-stricken areas in China have expanded constantly. Too frequent occurrences of drought have brought great loss in production of sustainable agriculture, and to the national economy, in recent years [1].
As an important part of the overall drought hazard, the term agricultural drought refers to the status that agricultural production is sensitive and vulnerable to drought stress [2]. Agricultural drought, seen as a kind of agro-meteorological disaster, causes a decline of grain yield and puts very large pressure on regions dependent on agricultural production. The term vulnerability refers to the frangible nature of a system threatened by different disasters [3]. According to the 4th Assessment Report of the Intergovernmental Panel on Climate Change, vulnerability represents the extent to which a system is fragile to hazard, or capable of dealing with climate change [4]. Since the pressure and release model (PAR model) input that the disaster is the intersection of disaster-inducing factors and vulnerability [5], we consider that the drought disaster consists of drought compounded by drought vulnerability. Vulnerability has a positive correlation with the degree of drought-disaster aggravated with the increase of vulnerability when they are at the same intensity. A reduction of vulnerability, in other words, taking the initiative via human activity, is an effective way to alleviate the loss caused by a drought disaster [6].
In the context of the increase in serious agricultural drought, research on drought vulnerability is also increasing [7]. Identifying drought-prone areas rapidly, and monitoring the occurrence and development of drought effectively, have become hot topics in recent research on agricultural drought [8]. There are two methods to study agricultural drought vulnerability, one is qualitative evaluation based on zoning. This method includes regional agricultural vulnerability evaluation from a macro perspective and a farmer vulnerability evaluation from a microcosmic perspective. The second method involves a quantitative evaluation based on fragility curves. Eriyagama et al. assessed the impact of climate change on water resources and agriculture in Sri Lanka [9]. Kim et al. proposed using the empirical orthogonal function (EOF) to evaluate the vulnerability of agricultural drought of major river basins in Korea [10]. Dipanwita et al. used the vegetation condition index (VCI) and standardized precipitation index (SPI) to monitor the spatio-temporal extent of agricultural drought in Rajasthan of Indian [11]. Achievements mainly focus on the establishment of indicators, or improvement of the social economic index [12]. The limited input parameters cannot effectively capture the characteristics of complexity and uncertainty of the agricultural system and the comprehensive evaluation method requires further exploration. However, there is no standardized assessment system yet that considers both natural components (such as relevant terrain) and human activities; most, specifically, examine the interaction between them [13,14].
The vulnerability scoping diagram (VSD) model, developed by Polsky from the project for public spaces model, decomposes the vulnerability into three dimensions (exposure, sensitivity, and adaptive capacity); then organizes and evaluates the data layer-by-layer (“Dimensions of Vulnerability”, “Components of Dimensions”, and “Indicators of Components”) [15,16]. A variety of vulnerability results from different areas can be compared with the model for vulnerability evaluations; otherwise, it will reveal the influence of both natural geographical and human factors [17]. The advantage it provides for wide application makes it effective in agricultural drought evaluation [18,19]. Xiaoqian Liu et al. implemented a three-dimensional model of drought vulnerability based on exposure, sensitivity, and adaptive capacity in China [17]. Murthy et al. used the framework to describe the agricultural drought vulnerability with exposure (rainfall), sensitivity component (vegetation condition and cropping pattern), and adaptive capacity (irrigation and land holdings) in India [20]. Although these studies improved the comprehensive assessment model of drought vulnerability, the framework still lacks consideration of both the local ecological sensitivity and social conditions to reflect the probability of imbalance and other environmental issues. Additionally, past studies used to focus on the evaluation result but few of them discuss the factors that may affect the evaluation.
Most of the comprehensive agricultural drought assessments in China have been carried out on the eastern plains (such as Hebei Province, Inner Mongolia). Regarding research, particularly complex regional research, Southwest China is the least studied area [21]. Yunnan Province is a typical arid drought-afflicted region in China. In the past dozen years, drought has often occurred in Yunnan Province and this has become the main factor limiting local economic development and the productivity and living conditions of the people there. With tough conditions, such as rugged terrain, complicated natural environment, and considerable geographical variation, the drought situation in these regions are particularly serious [22,23]. It is necessary to consider natural features such as topography, and other underlying factors, to construct an index system according to the local conditions.
The object of this study was (a) to develop a composite index of agricultural drought and build up a comprehensive assessment framework based on the VSD model to integrate the multiple natural and social indicators at provincial level, and (b) to identify the main driving factors in the affected area by a factor contribution model zoning the dominant characteristics of vulnerability. According to the map (spatial pattern) of vulnerability, we hope to provide the government with a practical approach by which to mitigate the effects of agricultural drought. This kind of evaluation result is crucial to the improvement and creation of long-term management measures.
2. Materials and Methods
2.1. Study Areas and Data Sources
As shown in Figure 1, Yunnan Province (21–30° N, 97–107° E) is located in the southwest of China. The province includes eight cities (Kunming City, Yuxi City, Lijiang City, Lincang City, Baoshan City, Zhaotong City, Qujing City, and Puer City) and eight minority autonomous prefectures (Chuxiong Yi, Diqing Tibetan, Nujiang Lisu, Dali Bai, Dai-Jingpo of Dehong, Wenshan Zhuang and Miao, Xishuangbanna Dai, and Honghe Hani and Yi Autonomous Prefecture). The total area of Yunnan is 394,000 square kilometers, which accounts for 4.11% of the entire area of China. The population in Yunnan in 2010 reached 49.65 million people (3.35% of the population of China). In recent decades, Yunnan province has developed rapidly, forming a double-center economic growth model, involving Kunming City and Yuxi City.
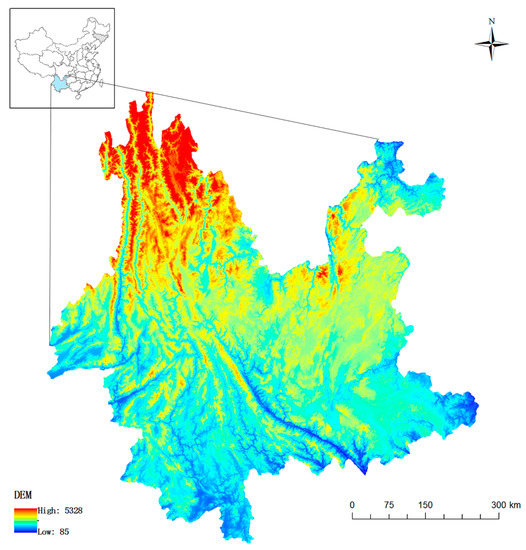
Figure 1.
Location of study area: Yunnan Province.
The topography is diverse, with the Yunnan plateau in the east and the Hengduan Mountains in the west. Mountainous and semi-mountainous areas account for 94% of its total land area. Given the situation, agricultural development is restricted in much of Yunnan. The elevation difference is disparate, with low-lying topography in the west and high in the east, with a tilt from northwest to southeast. The climate of Yunnan is complex and varied, including subtropical to tropical zones. Within the province, wet and dry seasons are distinct. The annual precipitation is 1100–1600 mm. There is seasonal variance in the distribution of precipitation. Precipitation mainly occurs from June to August, presenting an obvious ladder-like distribution from west to east. The annual total rainfall in the west is above 1500 mm, while rainfall in the northeast is no more than 800 mm. In recent years (2009–2012), the province has experienced agricultural drought conditions. The most severe drought, leading to a reduction in crop yield, took place in 2010.
In this study, we adopted the TM data of the worst drought year (2010) and used Erdas Imagine 10.0 (ERDAS, Atlanta, GA, USA) to interpret the thematic data of land use, to generate a (30 × 30) m grid map using ArcGIS (ESRI, Redlands, CA, USA). Climate data were interpolated with the support of kriging interpolation in ArcGIS. Socioeconomic data were collected from the Yunnan Statistical Yearbook and China City Statistical Yearbook. The cell size was then changed to 1 km by using the resample tool in GIS. The detailed data resources are listed in Table 1.

Table 1.
List of data sources.
2.2. Methodology
2.2.1. Index System
Building a reasonable evaluation index system is an important premise of scientific evaluation, especially since the indicators should reflect the system synthetically. Regional difference is one of the important characteristics of geography. Previous studies in plains with homogeneous distribution were usually assessed from the perspective of social and economic systems, but for complex areas, complex landforms have great influence on the drought hazard [24]. To build a scientific agricultural evaluation system for drought vulnerability, we adopted the vulnerability scoping diagram (VSD) model with three components of vulnerability: exposure, sensitivity, and adaptive capacity. Each component has three or four elements divided into several indicators, layer by layer. Combining the actual conditions of Yunnan and the known research results, 11 indicators were adopted following scientific, systematic, and workable principles to construct an agricultural drought vulnerability model of Yunnan. The details of the parameters and indicators composing the model are shown in Table 2.
Table 2.
Yunnan agricultural drought vulnerability assessment index system.
Exposure characterizes the degree of interference or intimidation of a region. The higher the degree of exposure, the more probable it is that agricultural risk may happen; thus, the higher the vulnerability value is. Climate conditions, population density and the scale of cultivation are source components of exposure, so we adopted annual average precipitation population density, proportion of agricultural population, rate of land cultivation, and cropping index to reflect exposure [25]. Annual average precipitation reflects the local climate conditions. Population density reflects the per capita possession of resources, and because the population density is increasing, the exposure to agricultural drought is very obvious. The rate of land cultivation is a proportion of the land area cultivated to the total land area. The cropping index is the percentage of the cropping area (of the total area cultivated). High-intensity agriculture on the land affects the water requirement. Since the cultivation is decreasing sharply, the cropping index is increasing, relatively.
Sensitivity characterizes the degree of positive or negative impact of stress on the exposure unit, which is determined by the type of exposure and systematic features. Regions with high sensitivity values may be more vulnerable to destruction [26]. Sensitivity in the study area is mainly manifested in the natural resource conditions and the landform characteristics. Large differences in elevation and complex terrain result in high mountains and steep slopes. Water supply is difficult to provide for mountain inhabitants and their agricultural activities. Therefore, there is a need to consider natural limitations and their influence. Topography, difficulty of water supply, and underlying conditions were taken to describe sensitivity [27]. When selecting the factors of topography, elevation, slope, and aspect; transpiration and conservation of water were taken into consideration. Difficulty of water supply (the process for providing potable water) was the cost distance between surface rolling data, which was calculated using a digital elevation model, and river network data was calculated using hydrology analysis in GIS.
Adaptive capacity means the capacity for a system to adapt to climate change (i.e., to minimize any potential loss or make use of advantageous opportunities) [28]. Human intervention or adaptive management can improve the capacity for handling stress and recovering from the consequences of stress. Generally, there is a significant and negative relationship between adaptive capacity and vulnerability. A stable system is apparently not a fragile one. Remarkable adaptive capacity of a system is beneficial for maintaining a balanced state (stability) of systems. Socio-economic development and establishment of agricultural ecology can reflect this capacity. Indicators, including per capita GDP and rural per capita income, were adopted to represent the level of local economic development. Cities with economic strength usually develop water conservation in leaps and bounds. Rural per capita income and per-unit-area cultivation-machine power describe the investment in agriculture; the higher the value, the more conducive to recovery after the occurrence of agricultural drought. The irrigation index can be calculated as the proportion of effective irrigation area of the land area under cultivation. Under the condition of equilibrium of natural precipitation, the probability is directly related to irrigation techniques and irrigation capacity.
The selection of indicators and hierarchy were mainly divided based on search results for ecology, environment, economy, and society. Among them, indicators with a “+” are indices that have a positive relationship with vulnerability, and vice versa.
2.2.2. Evaluation Method
In this study, the widely-used comprehensive index method was used with weighted summation and statistics to calculate the composite vulnerability index to represent the degree of agricultural drought vulnerability. After constructing the agricultural drought vulnerability evaluation model and establishing a comprehensive evaluation of the impact of each index, we calculated the ADVI (agricultural drought vulnerability index) as follows:
ADVI referred to the index of agricultural drought vulnerability. A higher ADVI indicates a higher trend of vulnerability to agricultural drought and vice versa. Here, XEI, XSI, and XAI represented the values of exposure, sensitivity, and adaptive capacity; and WE, WS, and WA represented the weight values of three criteria. Since there were no tiered international standards, we used the equal interval method with GIS to classify the composite index into five intervals (low, medium low, medium, high, and extremely high).
2.2.3. Indicator Standardization
The influences of different dimensions and separate units are various, but they can be eliminated by standardization of the indicators. The maximum difference normalization method was adopted to process the data. After being standardized, all of the values ranged from ‘0’ to ‘1’. The index system included positive and negative indices according to different aspects of the influence of index factor effects on the target factors. The target and positive indexes were positively correlated. For analytical convenience, we unified the direction of the indices. The two kinds of indices were calculated by different standardized measures [29].
The positive index was calculated as follows:
The negative index was calculated as follows:
where R was the standardized index value and Xi was the actual value of each county or point; MIN (Xi) was the minimum actual value; and MAX (Xi) was the maximum actual value of the real value.
2.2.4. Comprehensive Index Weights
Weighting plays a vital role in the evaluation. Currently, there are many methods by which to confirm weighting, including methods for objective weights, subjective weights, and comprehensive weights. Subjective weighting methods, including the Delphi method, square summation method, and the analytic hierarchy process (AHP), have discretionary subjectivity [30]. Objective weighting methods include entropy, principal component analysis, and gray correlation. Their effectiveness depends on the information acquired about the data. The comprehensive weighting method combines the strengths of the two previous methods and makes the results scientific and reasonable. Therefore, we used a combination weight process combining the entropy method and AHP [31].
AHP is a powerful tool for solving decision problems such as the multi-level and multi-objective programming proposed by Saaty [32]. The kernel is a pairwise comparison between the component elements of the study problems. The following process included calculating the weight vector, characteristics root, and consistency of these factors; sorting them and, finally, determining the weight of each influence factor. The entropy weight theory is a method for objective weighting according to information about the data. The process includes, first, standardizing the original data and building a standardized data matrix R = [Rij] n×m. In this case, Rij refers to the value of the j-th indicator of i-th evaluation unit. Second, the proportion of the j-th indicator of the i-th evaluation unit is calculated:
In the third step, the entropy index of the j-th indicator is calculated (if Pij = 0, then Ej = 0):
Finally, the entropy weight of the j-th indicator is calculated:
The entropy value was used to reflect the degree of dispersion of the indices. The smaller the entropy, the greater the degree of variation of the index, and the more effective the information the index can provide. Upon examination, indices that were greater than 0.96 were removed (the proportion of farmers, elevation, and electricity of rural use). We finally selected 12 indicators for the indicator system and calculated the combined weight as follows:
where tij represents the combined weight, aij represents the eigenvector of AHP, and wij represents the vector of the entropy weight method.
2.2.5. Factor Contribution Analysis Method
Agricultural drought vulnerability assessment reveals the spatial pattern of vulnerability. The key to reducing drought vulnerability is to identify the main driving factors, a significant step in the development of agricultural drought risk management [33,34]. The obstacle degree model was used to analyze the main contribution factor of vulnerability [35]. The contribution values were calculated as follows:
Cj referred to the j-th factor’s contribution to vulnerability, Ua referred to the a-th criterion factor’s contribution value, and Wj referred to the weight of a single factor:
Here, wr refers to the r-th criterion factor’s weight, wj refers to the weight of the j-th factor, Ii refers to the membership of index (the proportion of a single index in the vulnerability result, which was the percentage value of single index factors).
3. Results
3.1. Factor Analysis
3.1.1. Exposure Index
We assessed the three components of agricultural drought vulnerability based on the pixel scale. The pattern of the exposure index is shown in Figure 2a. Exposure values showed the trend of vulnerability reduced gradually from east to west. Extremely high exposure regions (0.8 < EI < 1) were concentrated in Kunming City, which has a high proportion of cultivated land and a large population. High exposure regions (0.6 < EI < 0.8) were concentrated in Zhaotong City and Qujing City. Exposure values were high in relation to the high population density, low rainfall, and the areas with few farm crops sown in these regions. Medium regions (0.4 < EI < 0.6) showed a trend of transition to connect the highest and lowest areas. Medium low regions (0.2 < EI < 0.4)) and low exposure regions occurred in Northwest and Southwest Yunnan Province; especially in the northwest, the EI was at a bare minimum (0 < EI < 0.2). Low population density in rural areas caused low industrial demand for agriculture. The ratio of tillable land was a small proportion of all the farmland, and the areas planted accounted for an accordingly small amount.
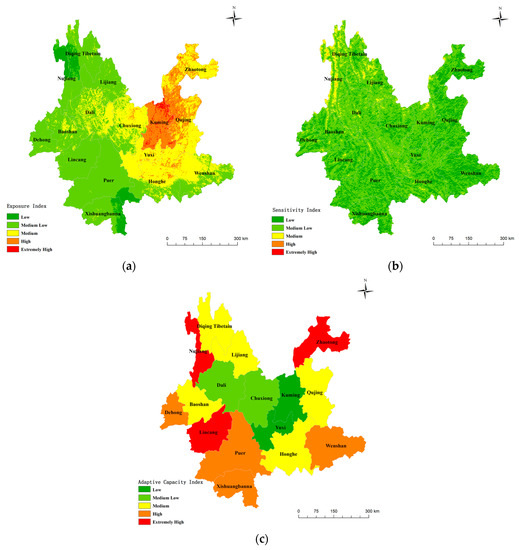
Figure 2.
Zoning map of agricultural drought factors in Yunnan Province, (a) exposure index; (b) sensitivity index; and (c) adaptive capacity index.
3.1.2. Sensitivity Index
The space pattern of sensitivity declined gradually from the northwest to the southeast (Figure 2b), and the overall distribution was different from the exposure. Complex terrain and extreme high altitude caused a pattern fragmentation. Extremely high (0.8 < SI < 1.0) and high sensitivity (0.6 < SI < 0.8) regions were few and they were sporadically distributed in the northwest and north-central regions. The most sensitive regions were located northwest of Diqing, Nujiang, and Lijiang City. Due to the high altitude and extremely undulating terrain, supplying water there is extremely difficult and poses a heavy burden. Forest coverage, soil conservation ability, and water conservation capacity made a great contribution to the sensitivity of the west central regions. Medium sensitivity areas (0.4 < SI < 0.6) were concentrated in northwest and northern regions of Yunnan (Drug-Nu Autonomous County of Gongshan in Nujiang Lisu Autonomous Prefecture, and in a small county of Kunming City). Medium low (0.2 < SI < 0.4) sensitivity regions were widely distributed in the whole study area and low (0 < SI < 0.2) sensitivity regions has the same characteristics, but low sensitivity regions were mainly distributed in the east due to the high vegetation condition index there. As expected, the classic feature of tropical rainforest climate (coverage with lush vegetation) characterized the south-central, southwest, and southeast regions. The relatively flat terrain there also contributed to the lowest sensitivity.
3.1.3. Adaptive Capacity
Since we considered adaptive capacity as a negative index in the comprehensive vulnerability evaluation, the result should be read inversely. A high adaptive capacity index reflect high agricultural drought vulnerability, but low adaptive capacity. The lower the absolute value was, the stronger the adaptive capacity and the lower the agricultural drought vulnerability of the region. As shown in Figure 2c, a wide difference was presented in the disparity of the adaptive capacity. The low adaptive capacity regions (0.8 < AI < 0.1) were in Northwest and Northeast Yunnan, where rural per capita net income and mechanical power were at the backward level. Medium low adaptive capacity regions (0.6 < AI < 0.8), such as Dai-Jingpo Autonomous Prefecture of Dehong, Puer City, Sipsongpanna and Wenshan Zhuang and Miao Autonomous Prefecture, were embedded in the medium regions as the irrigation index was lower there than in the surrounding regions. Medium adaptive capacity regions (0.4 < AI < 0.6) were mostly concentrated in the west, where the slopes were not particularly steep and forest coverage was relatively high. Diqing Tibet Autonomous prefecture, a typical mountain district, was one of the typical cities with low adaptive capacity. The local tourism industry developed rapidly; however, the extremely low population density and complex terrain limited improvement of the traditional farming modes. Since local agriculture was impacted most by climate change, the adaptive capacity was intrinsically low.High adaptive capacity regions (0.2 < AI < 0.4) exhibited higher per unit area cultivation-machine power and rural per capita income. Regions with extremely high adaptive capacity (0 < AI < 0.2) were mainly located in the central regions (including Kunming City, Yuxi City, Qujing City, and surrounding areas). As the main gathering area of population and industry, these regions were more developed than other regions. Here, irrigation and machine-cultivated technology were relatively advanced, thus, the adaptive capacities were high. Kunming City, the capital of Yunnan Province, had the best development conditions. The top ranking in per capita GDP, good irrigation, and significant machine cultivation make Kunming the city with the highest adaptive capacity.
3.2. Vulnerability Mapping
To reflect the pattern of the agricultural drought vulnerability and improve the comparability with other regions, we adopted a fixed classification of index values for classifying the composite index into five classes. The agricultural drought vulnerability of Yunnan Province could be divided into five parts: low vulnerable (0–0.2), medium low vulnerable (0.2–0.4), medium vulnerable (0.4–0.6), high vulnerable (0.6–0.8), and extremely vulnerable (0.8–1.0), and the regions were divided correspondingly.
We calculated the vulnerability value using the agricultural drought vulnerability evaluation model, and generated the ADVI map shown in Figure 3. The geographical pattern of agricultural drought vulnerability was captured well by the composite index, which showed high values in the northeast and medium low values in the northwest, center part, and southwest. Spatial connections can be found on the map: the agricultural drought vulnerability in Yunnan Province was relatively evenly distributed since there were few extremely high and low level regions. High vulnerability regions were scattered in the northeast regions, while regions in Northwest, Southwest, and Central Yunnan were of medium low vulnerability. Northeastern regions exhibited high agricultural drought values due to their high exposure and low adaptive capacity. These regions had high population density and substantial areas under cultivation. Additionally, the low per capita income and the backward farming methods in these regions caused a low adaptive capacity. Improvements should be considered starting from these two aspects. The economic development in different regions was extremely unbalanced.
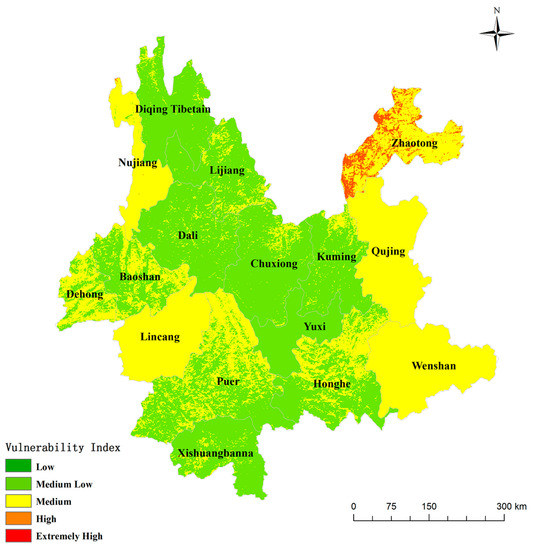
Figure 3.
Classes of agricultural drought vulnerability derived from ADVI in Yunnan Province.
3.3. Contributing Factors
The evaluation model not only requires us to identify the spatial and temporal patterns, but also to probe the factors driving the agricultural drought vulnerability, therefore, to reduce vulnerability. We adopted the contributing factors method to measure the contribution of each factor in each city, according to the formula criterion layer and index layer.
Dominant factors for each city came from contribution values calculated by Equations (9)–(11). They were compared with each other, and finally the dominant one was selected. We divided the dominant factors into three types according to the three components of the model (exposure-dominant regions, sensitivity-dominant regions, and adaptive capacity-dominant regions). In Figure 4, the results are shown of the contribution value of each indicator for the agricultural drought vulnerability of each city.
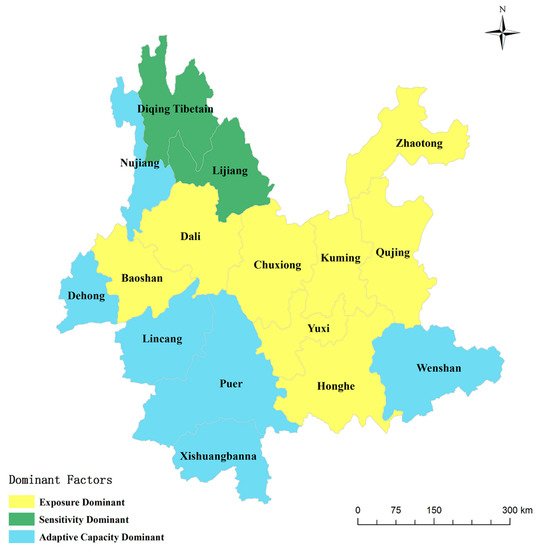
Figure 4.
Distribution of dominant factors of agricultural drought in Yunnan Province.
Exposure-dominant regions were concentrated in Middle and Northeast Yunnan (including Zhaotong City, Kunming City, Qujing City, Yuxi City, and Honghe Hani, Chuxiong Yi Autonomous Prefecture, Dali Bai Autonomous Prefecture and Baoshan City), where population density agglomeration and the land cultivation ratio were high. Sensitivity-dominant regions were distributed in Northwest Yunnan (including Diqing Tibetan Autonomous Prefecture and Lijiang City). The northwest area was characterized by rugged topography and little forest coverage. Adaptive dominant regions were distributed widely; in other words, agricultural drought vulnerabilities of most remote regions in Yunnan were short of adaptive capacity. Nujiang Lisu Autonomous Prefecture had the lowest per capita farmer income and irrigation level, thus, adaptivity was its dominant factor.
We listed the contribution values of each indicator in Table 3. The results show that the main factors driving agricultural drought vulnerability focus on population density, irrigation index, annual average precipitation, cultivation land ratio, and difficulty of water supply, and (i.e., they were the five leaders by frequency of occurrence overall). This means that the dominant factors of drought vulnerability were closely related to climate, surface topography, river distribution, urban economic development, and development of agricultural water conservation.
Table 3.
Contribution of indicators for agricultural drought vulnerability.
4. Discussion
The evaluation framework for measuring agricultural drought vulnerability followed in this study is unique: the climate, natural conditions, and social conditions were considered. With the introduction of the ecological sensitivity indices, the ADVI results represent the current status of agricultural drought vulnerability in a reliable way.
During the study period, the spatial distribution pattern of agricultural drought vulnerability was palpable. (1) The overall distribution of agricultural drought vulnerability in Yunnan is relatively concentrated at a medium level. Extremely high vulnerability regions and low vulnerability regions are few in Yunnan Province. However, ADVI in remote areas in Northern Yunnan Province were very close to this level. Though the value of population density and irrigation index were quite high in the northeast of the study area, some indicators of sensitivity, such as slope and difficulty of water supply, were at a relatively low level compared to the northwest region of Yunnan. However, this does not mean the agricultural drought is not heavy in our study. (2) High vulnerability regions (0.6 < ADVI < 0.8) were concentrated in the northeast part of Yunnan Province. More specifically, they were mainly located in the west of Zhaotong City, where the population density, cultivation land ratio, and irrigation index were extremely high. (3) Medium value regions (0.4 < ADVI < 0.6) showed a scattered distribution in eastern, northwestern, and southwestern regions, mainly in Nujiang, Lincang, Qujing, and Wenshan cities, which accounted for 25.12% of the total area. The other regions (as seen in parts of Zhaotong City, Dehong, Baoshan, and Puer) accounted for 1–5%. The spatial pattern may be related to the distribution of precipitation because the annual rainfall shows a descending trend from the southwest to the east. The other main factors influencing the spatial pattern are the distribution of elevation and population density. (4) Medium low regions (0.2 < ADVI < 0.4) appeared in northern, central, and southern regions. Cities, including Diqing Tibetain, Lijiang City, Dali Bai Autonomous Prefecture, Kunming City, Chuxiong Yi Autonomous Prefecture, Puer, Honghe and Xishuangbanna, occupied a continuous area that accounted for more than 60% of the total area. Other medium low vulnerability regions were scattered in western cities, such as Dai-Jingpo Autonomous Prefecture of Dehong, and Baoshan City. Part of the reason for this is that the precipitation is relatively abundant in the southwestern regions. In addition, cities with high urbanization and economic levels, like Kunming City and Lijiang City, are able to prevent and respond to drought well, thus their vulnerability values are correspondingly low. (5) Low vulnerability regions (0 < ADVI < 0.2) have not been found in the Yunnan Province. This means all of the cities in the whole province have some troubles in facing the agricultural drought problem.
Overall, the agricultural drought vulnerability in Yunnan Province were at a medium level. The distribution trends of the result is similar to other research in the study area that the agricultural drought vulnerability widely distributed in Yunnan province. In our study, serious drought is mainly distributed in the northeastern and remote regions on both sides, but lightly distributed in the middle regions, which was different from other studies without considering social adaptive capacity (they regarded middle cities, such as Kunming City, as having high agricultural drought vulnerability). On one hand, agricultural drought vulnerability depends on the local climate, underlying surface, and vegetation condition; on the other hand, they are influenced by local social and economic development levels. The indices used in this paper could comprehensively reflect the reality of agricultural drought vulnerability.
The three components of the framework exhibit different patterns. High vulnerability values were concentrated in Northeastern, Central, and Western Yunnan. Dense populations, adequate arable land, and abundant land on which agricultural crops were sown, caused intense exposure to agricultural drought vulnerability. The value of the sensitivity index gradually declined from north to south. Northern Yunnan contains high elevation areas with rugged, undulating landforms. It is rather difficult for residents to obtain water. Substantial forests are distributed in Southern Yunnan, thus, good soil and water-source conservation are found there. Adaptive capacity is different throughout the province. Central cities with high adaptive capacity, such as Kunming City (the capital of Yunnan Province), has developed well in both tourism and mechanization of agriculture in recent years.
According to the analysis of factor contribution, population density, irrigation index, annual average precipitation, cultivation land ratio, and difficulty of water supply, were the main driving factors. Agricultural drought vulnerability was closely related to climate, industrial structure, and ecological sensitivity. Population density reflected the city scale and development, which was closely linked to local economic development. Regions with large proportions of cultivated land dominated by exposure factors. The agricultural economy in Yunnan Province is well developed, and s especially concentrated in the central and eastern flat areas. The sensitivity-dominant regions concentrated in the northwest and middle part. Difficult natural conditions, such as high elevation and steep slopes, cause agricultural activities to be hazardous, and solutions proposed for such mountainous regions are difficult to provide. The distribution of adaptive capacity dominant regions was consistent with the socioeconomic development pattern in the eastern and developing western regions.
The map of the agricultural drought vulnerability evaluation could be instrumental in adopting specific measures. Control measures were various in regions with different dominant factors.
- (1)
- Sensitivity-dominated regions, such as Diqing and Lijiang, are short of water resources. In these regions, commonwealth hydraulic engineering should be performed. Small-scale reservoirs and impoundment engineering should be of high-priority to intercept and accumulate water. Reservoirs can play a major role in the optimum distribution of water resources and improve the uneven space-time distribution of precipitation.
- (2)
- For exposure dominated regions including Zhaotong City, Kunming City, Yuxi City, Qujing City, Dali City, Baoshan City and Honghe City, the cities have brought a better life to the people, but they have also led to severe problems, such as population explosion, traffic congestion, environmental pollution, and resource depletion. In these regions, upgrading the social population structure is necessary. As for Zhaotong City, Qujing City, Honghe City, Kunming City, and Yuxi City, where the primary forests are degraded, the most appropriate action would be afforestation using native trees, like broad-leaf species: economic trees, such as eucalyptus and rubber trees, should not be planted. Meanwhile, forest phase transformation and soil improvement are necessary for economically-backward areas.
- (3)
- Adaptive capacity is associated with the economic conditions. To improve their drought resistance, governments should vigorously develop their economies, adjust the industrial structure, and reduce their dependence on agriculture. Some cities have the potential to develop a third industry, especially tourism. Agricultural drought vulnerability status information at different scales is crucial for prescription, development, and implementation of long-term drought management measures.
5. Conclusions
Agricultural drought vulnerability is complicated and full of uncertain factors. The VSD model was used to carry out quantitative evaluation of ecological vulnerability from various aspects. Research showed that the assessment of agricultural drought vulnerability evaluation by means of the VSD model, combining exposure, sensitivity, and adaptive capacity not only emphasized the important influence of the natural geographical environment on drought, but also considered the factors of human economic activities and their correlation with the three components. The results provided a concentrated map showing that both sides of Yunnan Province are much more susceptible to the interference of drought than is the central part. The research could fully represent the space characteristics of agricultural drought vulnerability, and more accurately reflect the correlation between the elements of agricultural drought vulnerability and the development of different cities. Identification of the key driving factors of vulnerability among multiple indicators played a warning role for the state of agricultural drought vulnerability of Yunnan Province. In order to identify the degree of response of various indicators, reasonable expressions of assessment-unit vulnerabilities were depicted separately. Considering Yunnan’s complex natural geographical and economic conditions, we proposed appropriate engineering treatments for the different regions, such as promoting industrial transformation and upgrading and developing water-saving technology.
The main works and novelty of this study are as follows: (a) VSD model was introduced to describe agricultural drought vulnerability; representing exposure, sensitivity, and adaptive capacity based on multiple indicators. Practical indicators were chosen to assess the agricultural drought vulnerability according to local conditions. Meanwhile, the method took ecological sensitivity into consideration, which was neglected in former studies. In addition, in this study indicators were selected based on natural ecological conditions and demand for human development in Yunnan Province. These allowed good consideration of the typical personalized index in the study area; (b) The factor contribution model was used to analyze the main driving factors of agricultural drought vulnerability. This provided a method by which to identify vulnerable areas quickly; (c) The combined entropy weight method considered both impersonal entropy weight and subjective weight, which could reflect reasonable factors. As compared to other current approached to agricultural drought vulnerability assessment, the methodology in this study based on the VSD model and factor contribution method have the advantages of comprehensive, univocal, and clarity of use.
Our future work includes long-term observation and exploration of a space-time evolution law of vulnerability. It is essential to explore how vulnerability changes under various conditions of environmental, economic, and social development using scenario simulations.
Acknowledgments
This research has been supported by grants from National Natural Science Foundation of China (no. 41330747).We express our sincere gratitude to all the participants in the study.
Author Contributions
Conceived and designed the experiments: Jiansheng Wu, Jian Peng, Meijuan Wang; Performed the experiments: Jiansheng Wu, Meijuan Wang, Xin Lin; Analyzed the data: Meijuan Wang, Xin Lin; Contributed reagents/materials/analysis tools: Jiansheng Wu, Meijuan Wang, Xin Lin, Yuanjie Tu; Wrote the paper: Jiansheng Wu, Jian Peng, Meijuan Wang, Xin Lin, Yuanjie Tu; Paper revision and Language correction: Meijuan Wang, Xin Lin, Jiansheng Wu, Jian Peng, Yuanjie Tu.
Conflicts of Interest
The authors declare no conflict of interest.
References
- Guan, Y.H.; Zheng, F.L.; Zhang, P.; Qin, C. Spatial and temporal changes of meteorological disasters in China during 1950–2013. Nat. Hazards 2015, 75, 2607–2623. [Google Scholar] [CrossRef]
- Du, X.D.; Jin, X.B.; Yang, X.L.; Yang, X.H.; Xiang, X.M.; Zhou, Y.K. Spatial-temporal pattern changes of main agriculture natural disasters in China during 1990–2011. J. Geogr. Sci. 2015, 25, 387–398. [Google Scholar] [CrossRef]
- Liu, X.Q.; Wang, Y.L.; Peng, J.; Braimoh, A.K.; He, Y. Assessing Vulnerability to Drought Based on Exposure, Sensitivity and Adaptive Capacity: A Case Study in Middle Inner Mongolia of China. Chin. Geogr. Sci. 2013, 23, 13–25. [Google Scholar] [CrossRef]
- Mccarthy, J.J.; Canziani, O.F.; Leary, N.A.; Dokken, D.J.; White, K.S. Climate Change 2001: Impacts, Adaptation and Vulnerability: Contribution of Working Group II to the Third Assessment Report of the Intergovernmental Panel on Climate Change (IPCC). Available online: http://old.grida.no/climate/ipcc_tar/wg2/pdf/wg2TARfrontmatter.pdf (accessed on 10 April 2015).
- Blaikie, P.; Cannon, T.; Davis, I.; Wisner, B. At Risk: Natural Hazards, People’s Vulnerability and Disasters; De Gruyter: Berlin, Germany, 2003. [Google Scholar]
- Zarafshani, K.; Sharafi, L.; Azadi, H.; Passel, S.V.; Uantwerpen, S.V. Sustainability Vulnerability Assessment Models to Drought: Toward a Conceptual Framework. Sustainability 2016, 8, 588. [Google Scholar] [CrossRef]
- Burke, E.J.; Brown, S.J. Regional drought over the UK and changes in the future. J. Hydrol. 2010, 394, 471–485. [Google Scholar] [CrossRef]
- Kang, L.; Zhang, H. A Comprehensive Study of Agricultural Drought Resistance and Background Drought Levels in Five Main Grain-Producing Regions of China. Sustainability 2016, 8, 346. [Google Scholar] [CrossRef]
- Eriyagama, N.; Smakhtin, V.; Chandrapala, L.; Fernando, K. Impacts of Climate Change on Water Resources and Agriculture in Sri Lanka: A Review and Preliminary Vulnerability Mapping. Available online: https://dlc.dlib.indiana.edu/dlc/bitstream/handle/10535/9082/RR135.pdf?sequence=1 (accessed on 17 March 2017).
- Kim, H.; Park, J.; Yoo, J.; Kim, T.W. Assessment of drought hazard, vulnerability, and risk: A case study foradministrative districts in South Korea. J. Hydro-Environ. Res. 2015, 9, 28–35. [Google Scholar] [CrossRef]
- Dutta, D.; Kundu, A.; Patel, N.R.; Saha, S.K.; Siddiqui, A.R. Assessment of agricultural drought in Rajasthan (India) using remote sensing derived Vegetation Condition Index (VCI) and Standardized Precipitation Index (SPI). Egypt. J. Remote Sens. Space Sci. 2015, 18, 53–63. [Google Scholar] [CrossRef]
- Guo, H.; Zhang, X.; Lian, F.; Gao, Y.; Lin, D.; Wang, J.A. Drought Risk Assessment Based on Vulnerability Surfaces: A Case Study of Maize. Sustainability 2016, 8, 813. [Google Scholar] [CrossRef]
- He, B.; Wu, J.J.; Lü, A.F.; Cui, X.F.; Lei, Z.; Ming, L.; Lin, Z. Quantitative assessment and spatial characteristic analysis of agricultural drought risk in China. Nat. Hazards 2013, 66, 155–166. [Google Scholar] [CrossRef]
- Babaei, H.; Araghinejad, S.; Hoorfar, A. Developing a new method for spatial assessment of drought vulnerability (case study: Zayandeh-Rood river basin in Iran). Water Environ. J. 2013, 27, 50–57. [Google Scholar] [CrossRef]
- Polsky, C.; Neff, R.; Yarnal, B. Building comparable global change vulnerability assessments: The vulnerability scoping diagram. Glob. Environ. Chang. 2007, 17, 472–485. [Google Scholar] [CrossRef]
- Adger, W.N. Vulnerability. Glob. Environ. Chang. 2006, 16, 268–281. [Google Scholar] [CrossRef]
- Liu, X.Q.; Wang, Y.L.; Peng, J. Progress in Vulnerability Analysis of Coupled Human-environment System. Adv. Earth Sci. 2009, 24, 917–927. [Google Scholar]
- Li, Y.C.; Huang, H.P.; Ju, H.; Lin, E.; Xiong, W.; Han, X.; Wang, H.; Peng, Z.P.; Wang, Y.Q.; Xu, J.W. Assessing vulnerability and adaptive capacity to potential drought for winter-wheat under the RCP 8.5 scenario in the Huang-Huai-Hai Plain. Agric. Ecosyst. Environ. 2015, 209, 125–131. [Google Scholar] [CrossRef]
- Mishra, A.K.; Singh, V.P. Drought modeling—A review. J. Hydrol. 2011, 403, 157–175. [Google Scholar] [CrossRef]
- Murthy, C.S.; Laxman, B.; Sai, M.V.R.S. Geospatial analysis of agricultural drought vulnerability using a composite index based on exposure, sensitivity and adaptive capacity. Int. J. Disaster Risk Reduct. 2015, 12, 163–171. [Google Scholar] [CrossRef]
- Chen, T.T.; Xia, G.M.; Liu, T.G.; Chen, W.; Chi, D. Assessment of Drought Impact on Main Cereal Crops Using a Standardized Precipitation Evapotranspiration Index in Liaoning Province, China. Sustainability 2016, 8, 1069. [Google Scholar] [CrossRef]
- Fu, B.; Hu, G.D.; Yang, F.; Wang, L. Analysis of Drought Normalization in Yunnan Province. J. China Hydrol. 2014, 34, 82–85. [Google Scholar]
- Yu, W.J.; Shao, M.Y.; Ren, M.L.; Zhou, H.J.; Jiang, Z.H.; Li, D.L. Analysis on spatial and temporal characteristics drought of Yunnan Province. Acta Ecol. Sin. 2013, 33, 317–324. [Google Scholar] [CrossRef]
- Pandey, R.P.; Pandey, A.; Galkate, R.V.; Byun, H.R.; Mal, B.C. Integrating Hydro-Meteorological and Physiographic Factors for Assessment of Vulnerability to Drought. Water Resour. Manag. 2010, 24, 4199–4217. [Google Scholar] [CrossRef]
- Farhangfar, S.; Bannayan, M.; Khazaei, H.R.; Baygi, M.M. Vulnerability assessment of wheat and maize production affected by drought and climate change. Int. J. Disaster Risk Reduct. 2015, 13, 37–51. [Google Scholar] [CrossRef]
- Hao, L.; Wang, J.A.; Shi, P.J.; Fan, Y.D. Vulnerability assessment of regional snow disaster of animal husbandry: Taking pasture of Inner Mongolia as an example. J. Nat. Disasters 2003, 12, 51–57. [Google Scholar]
- Chen, P.; Chen, X. Summary on Research of Coupled Human-Environment System Vulnerability under Global Environmental Change. Prog. Geogr. 2010, 29, 454–462. [Google Scholar]
- Carrão, H.; Naumann, G.; Barbosa, P. Mapping global patterns of drought risk: An empirical framework based on sub-national estimates of hazard, exposure and vulnerability. Glob. Environ. Chang. 2016, 39, 108–124. [Google Scholar] [CrossRef]
- Ying, N.; Zhe, J.I.; Feng, H. On eco-security evaluation in the Tumen River region based on RS&GIS. Acta Ecol. Sin. 2013, 33, 4790–4798. [Google Scholar]
- Yuan, X.C.; Wang, Q.; Wang, K.; Wang, B.; Jin, J.L.; Wei, Y.M. China’s regional vulnerability to drought and its mitigation strategies under climate change: Data envelopment analysis and analytic hierarchy process integrated approach. Mitig. Adapt. Strateg. Glob. Chang. 2015, 20, 341–359. [Google Scholar] [CrossRef]
- Xie, C.S.; Dong, D.P.; Hua, S.P.; Xin, X.; Chen, Y.J. Safety Evaluation of Smart Grid based on AHP-Entropy Method. Syst. Eng. Procedia 2012, 4, 203–209. [Google Scholar]
- Cheng, J.; Tao, J.P. Fuzzy Comprehensive Evaluation of Drought Vulnerability Based on the Analytic Hierarchy Process:—An Empirical Study from Xiaogan City in Hubei Province. Hydrometallurgy 2010, 1, 126–135. [Google Scholar]
- Ford, J.D.; Smit, B. A Framework for Assessing the Vulnerability of Communities in the Canadian Arctic to Risks Associated with Climate Change. Arctic 2004, 57, 389–400. [Google Scholar] [CrossRef]
- Joyce, L.A.; Briske, D.D.; Brown, J.R.; Polley, H.W.; Mccarl, B.A.; Bailey, A.D.W. Climate Change and North American Rangelands: Assessment of Mitigation and Adaptation Strategies. Rangel. Ecol. Manag. 2015, 66, 512–528. [Google Scholar] [CrossRef]
- Lu, C.Y.; Feng, W.; Yang, Q.Y.; Chen, L.L.; Zong, H.M. An Evaluation of Urban Land Use Performance Based on the Improved TOPSIS Method and Diagnosis of Its Obstacle Indicators: A Case Study of Chongqing. Resour. Sci. 2011, 33, 535–541. [Google Scholar]
© 2017 by the authors. Licensee MDPI, Basel, Switzerland. This article is an open access article distributed under the terms and conditions of the Creative Commons Attribution (CC BY) license (http://creativecommons.org/licenses/by/4.0/).