
Analysis and Prediction of Changes in Coastline Morphology in the Bohai Sea, China, Using Remote Sensing


Abstract
:1. Introduction
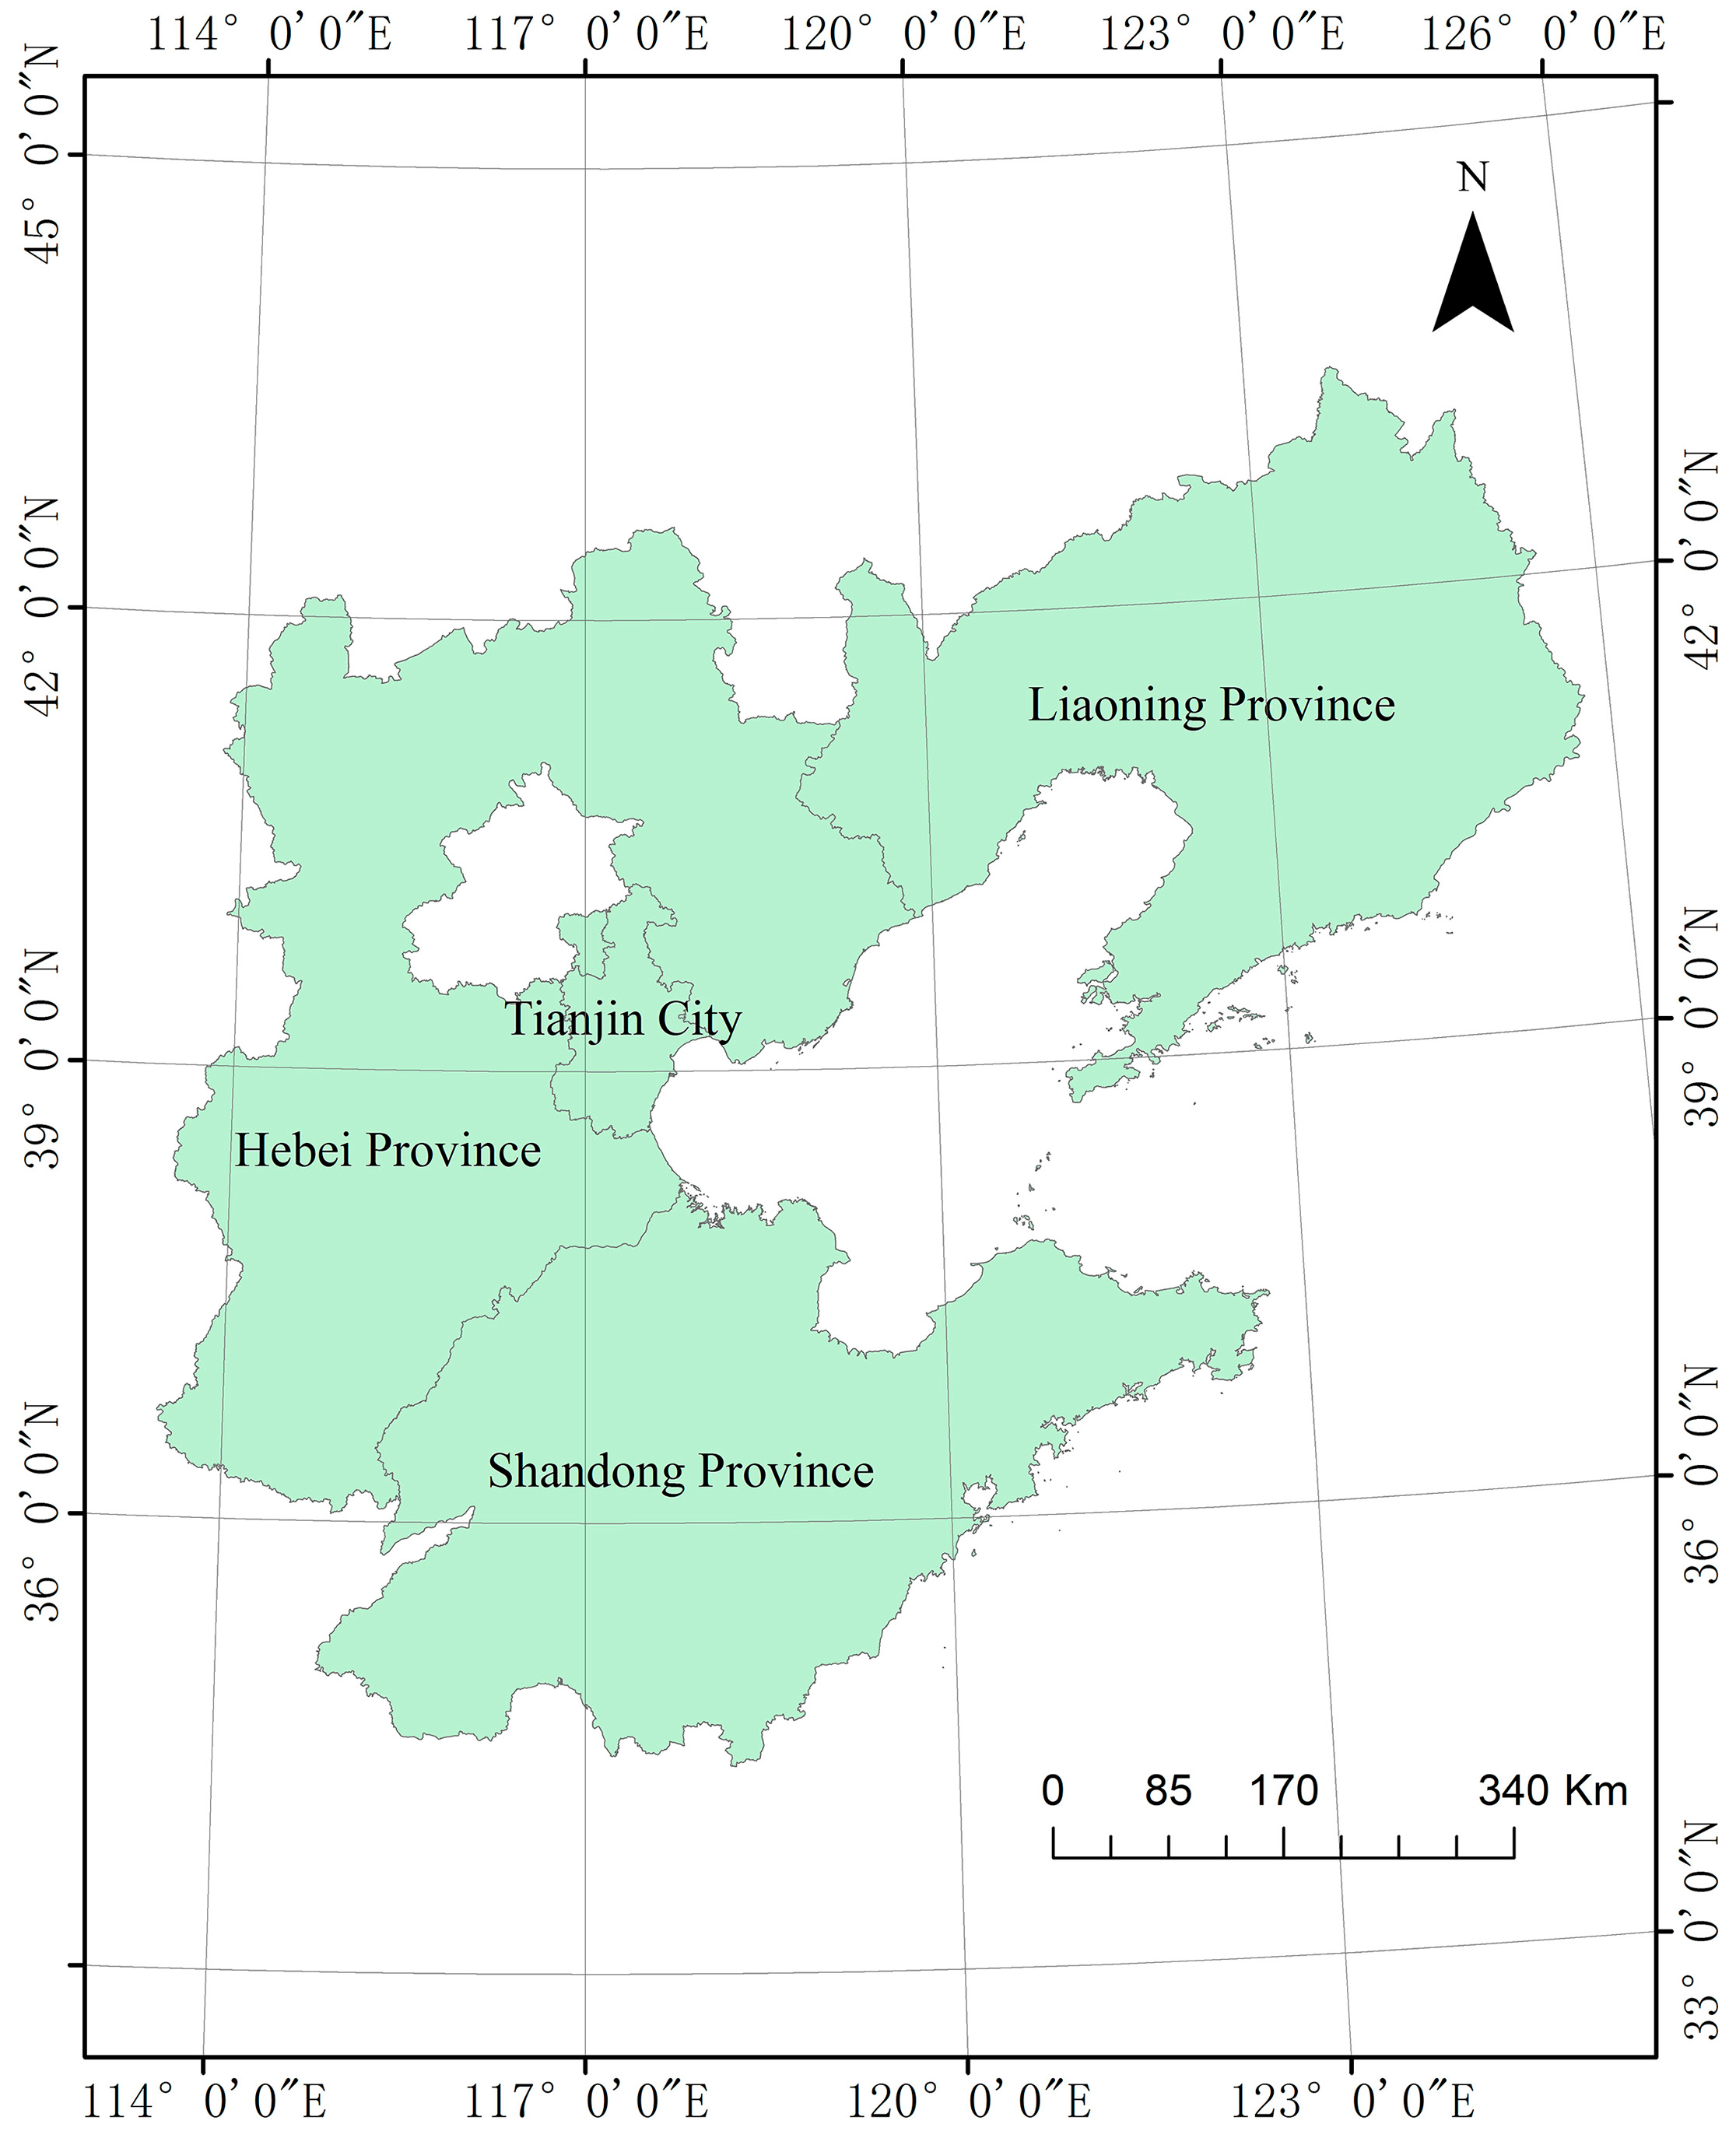
2. Study Area and Data
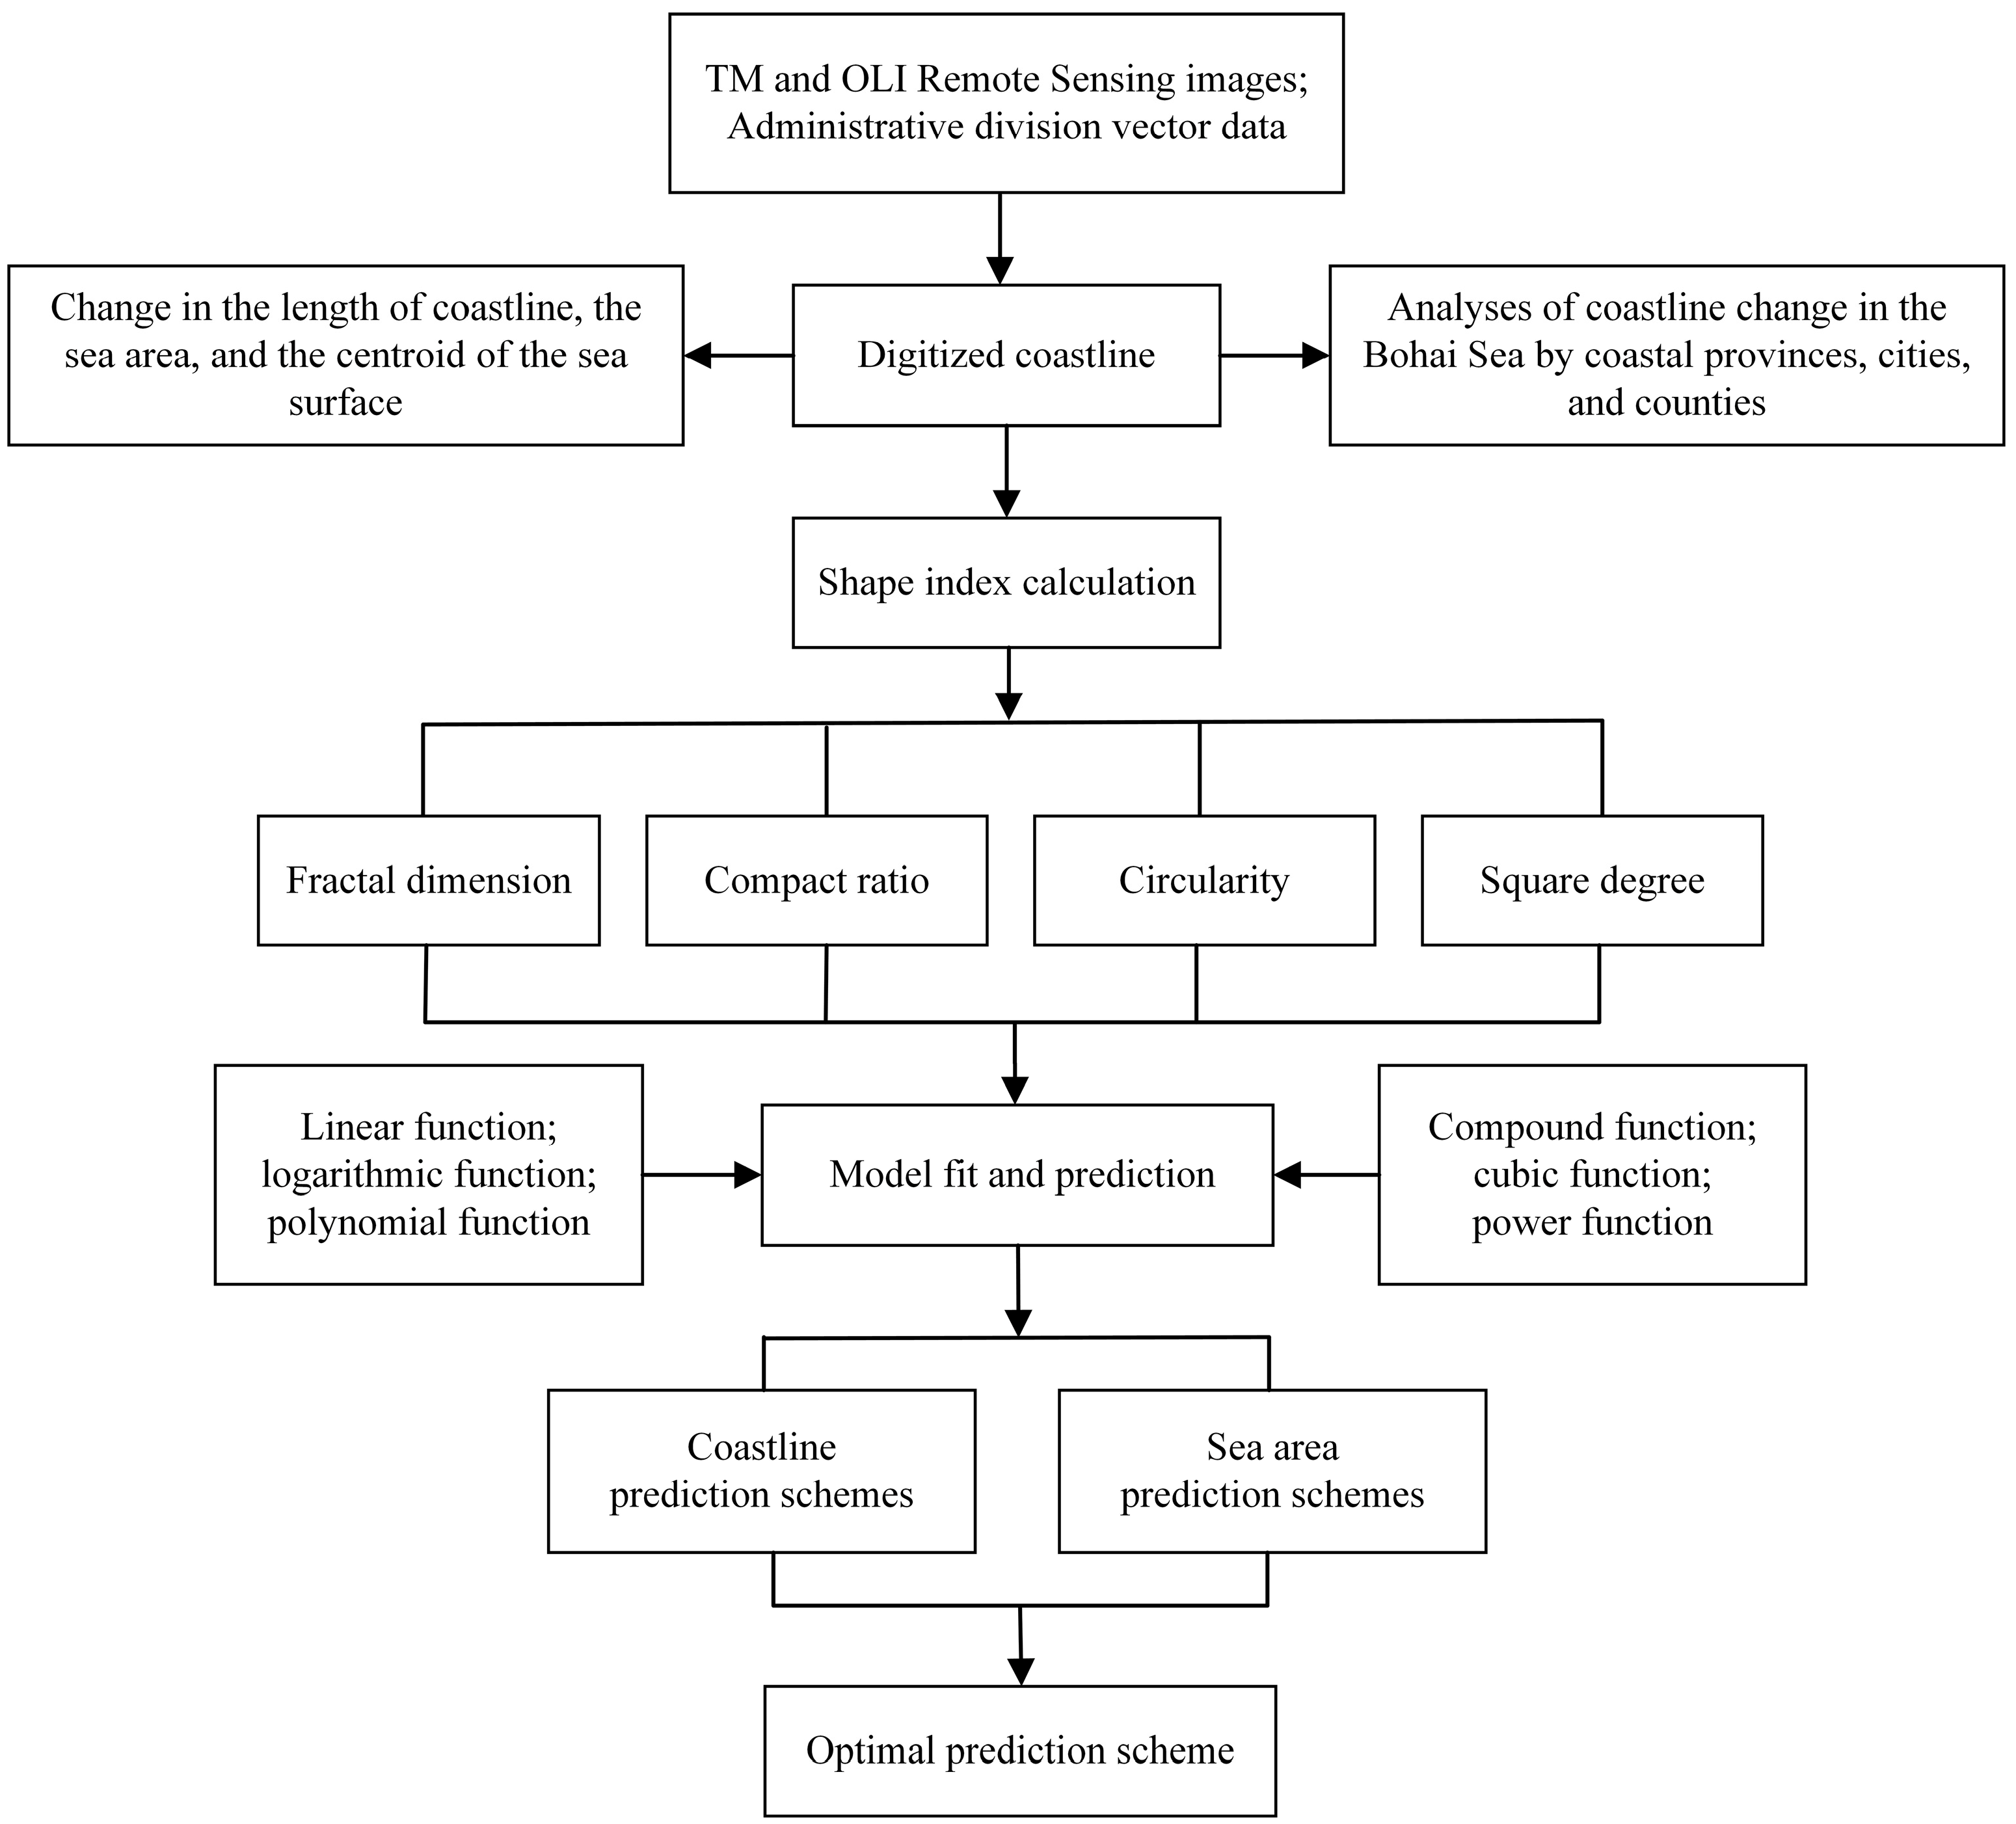
3. Methods
4. Results
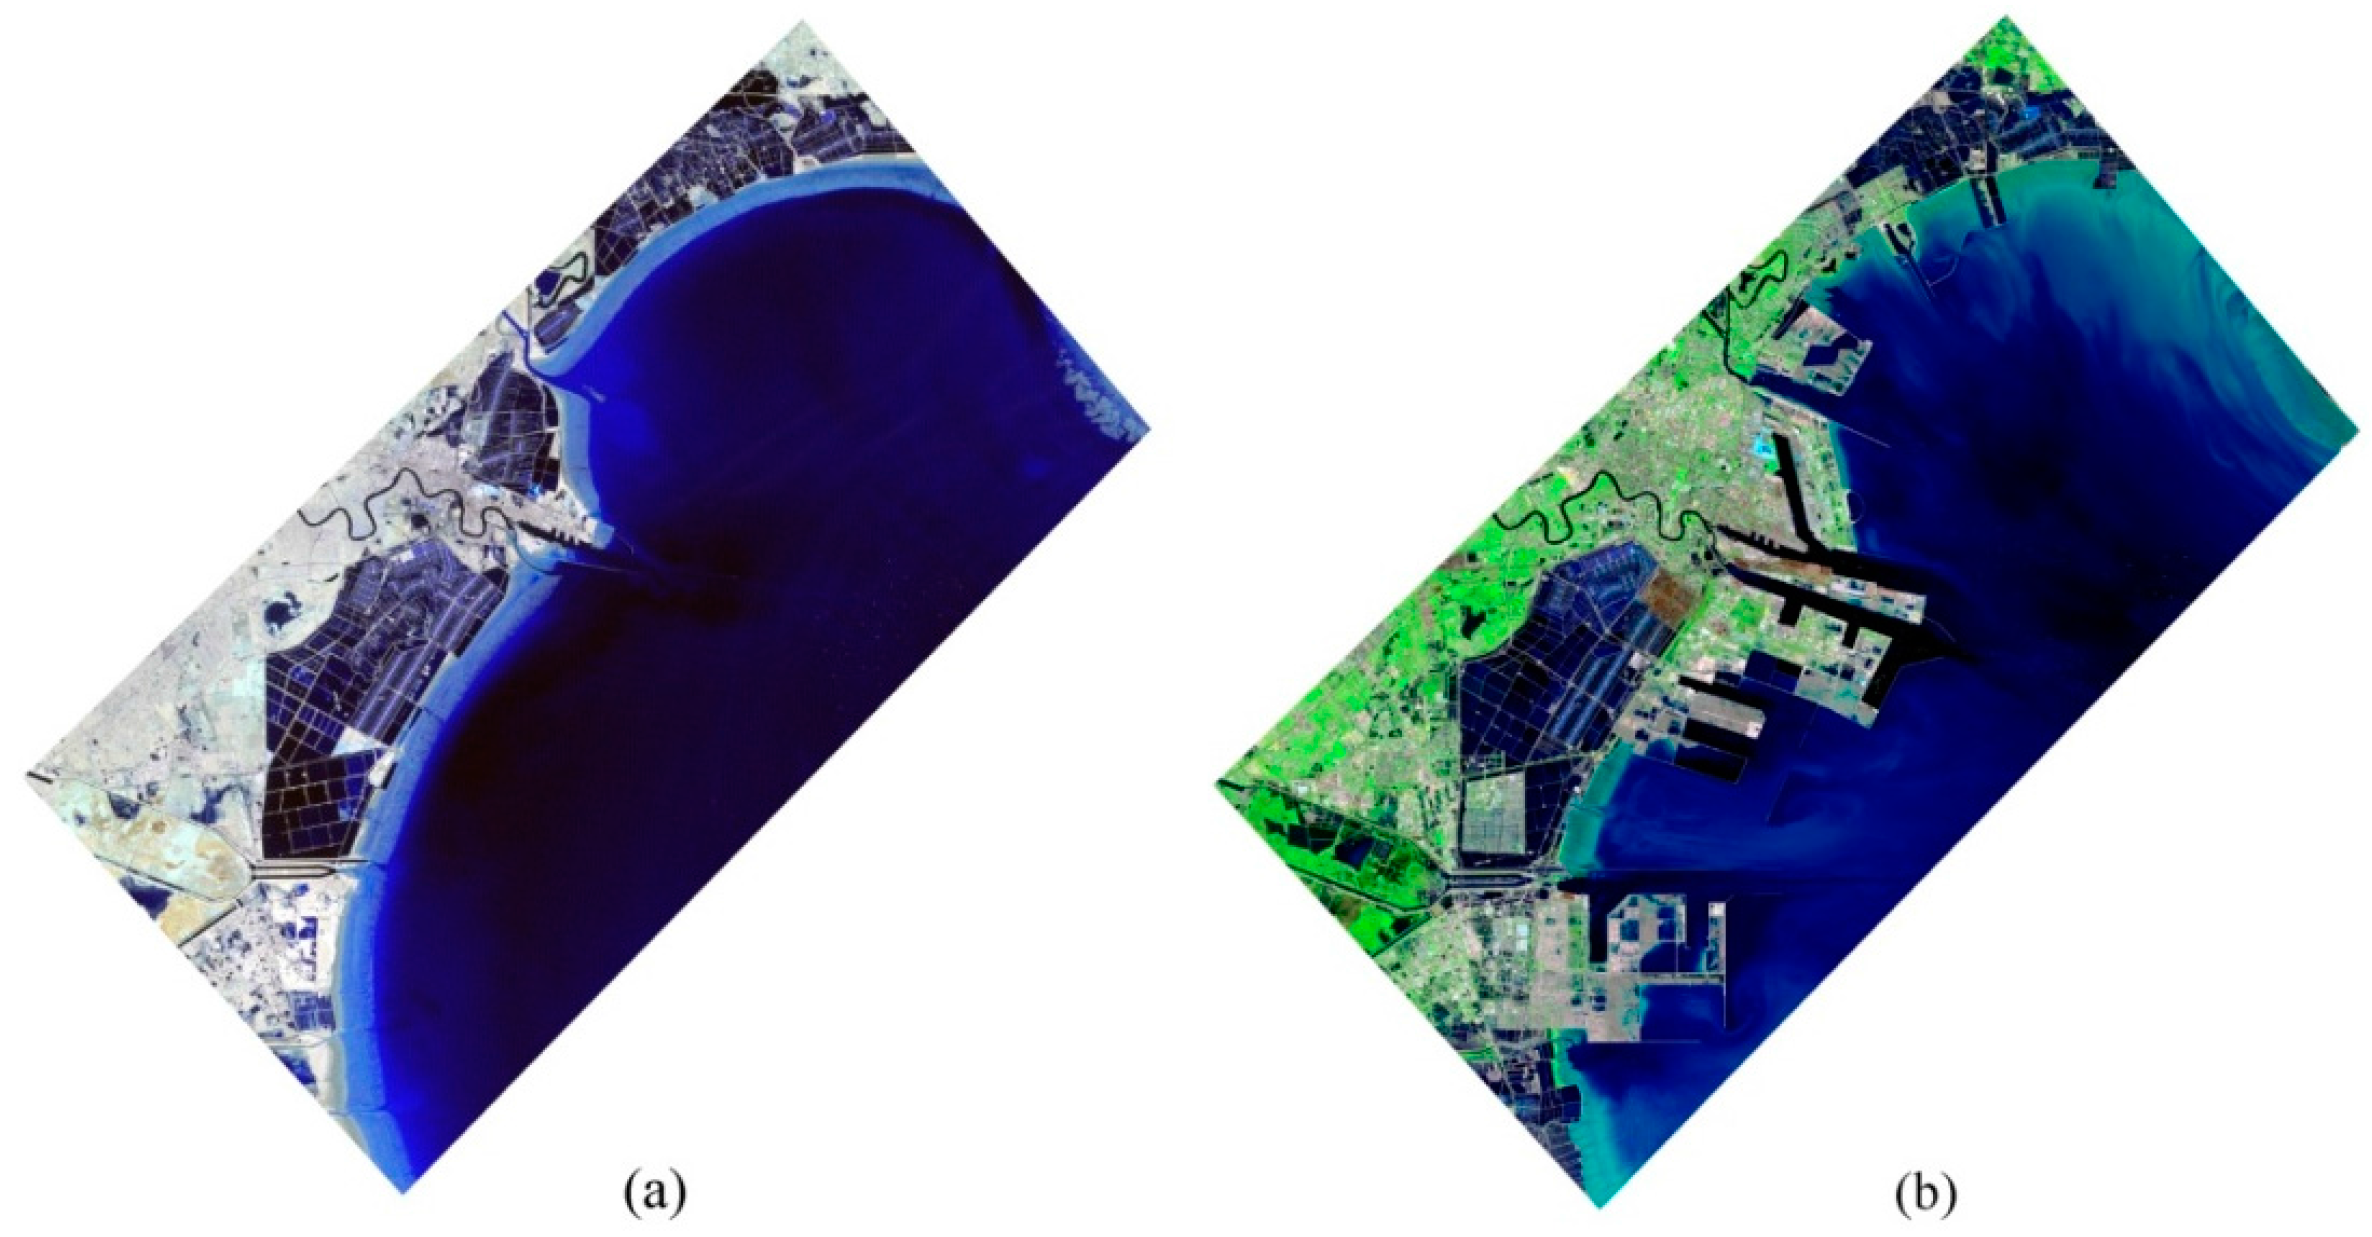
4.1. Coastal Change in the Bohai Sea
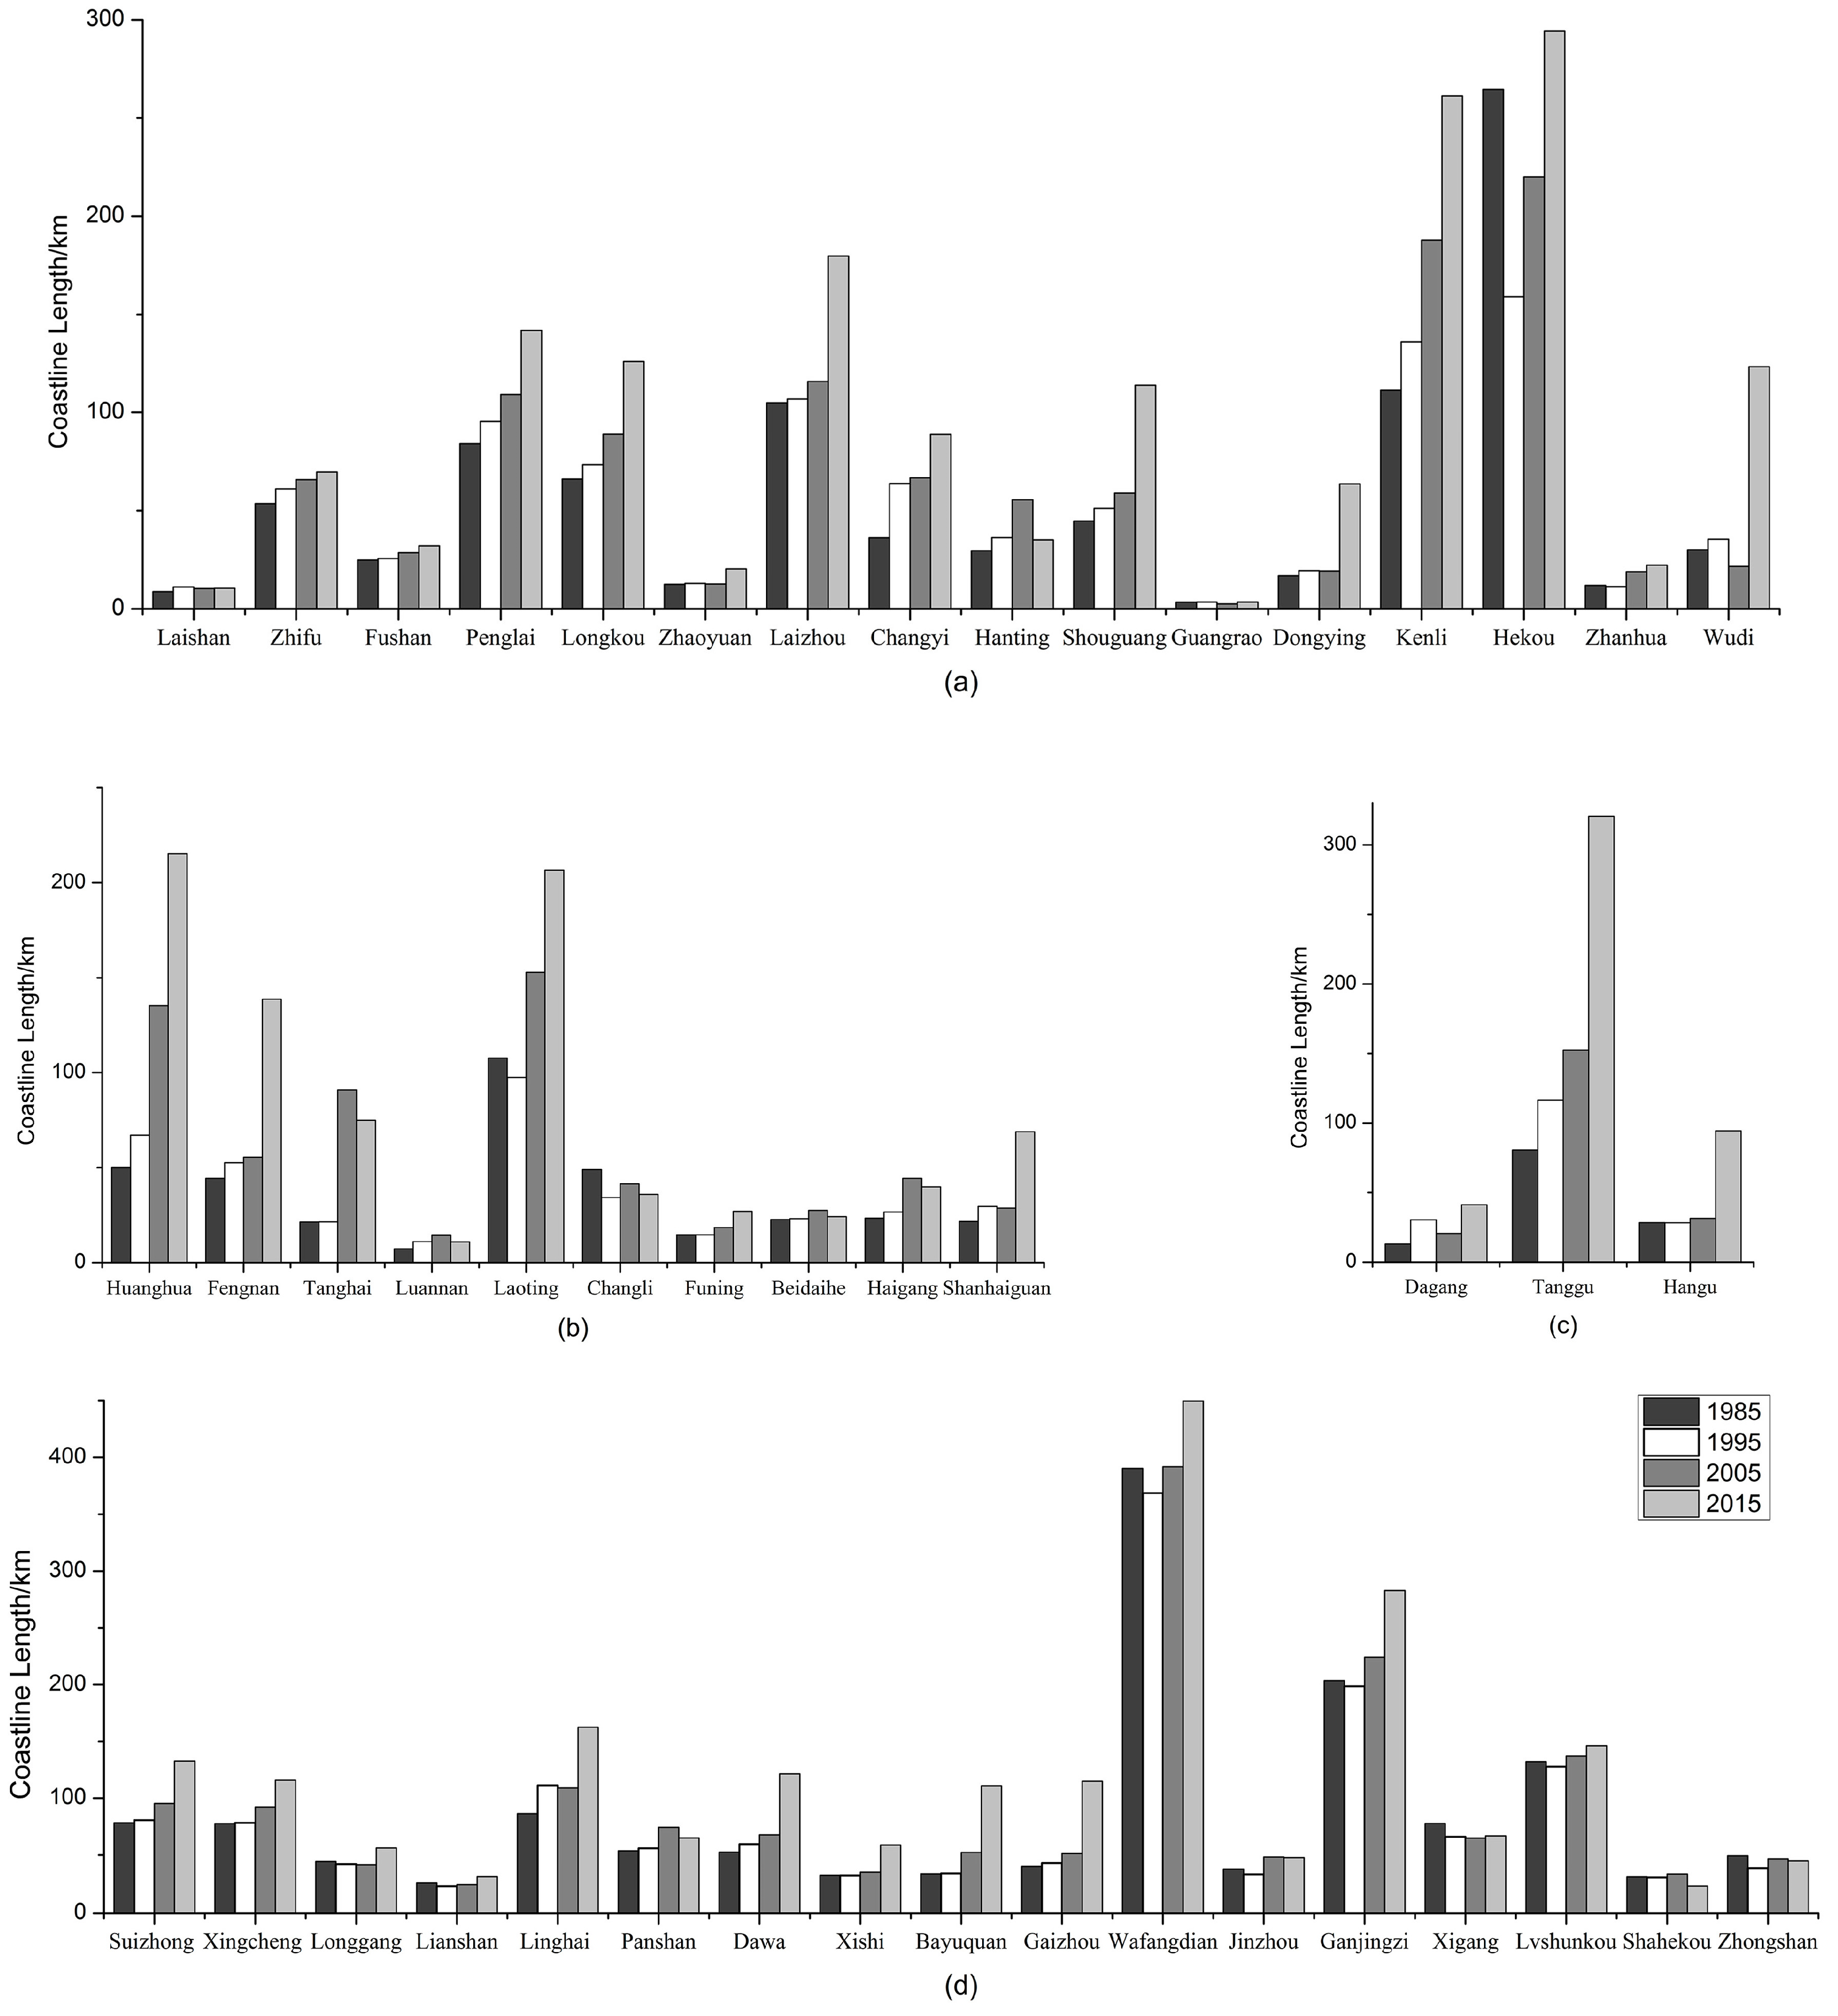
4.2. Coastline Change in the Bohai Sea-Adjacent Coastal Provinces, Cities, and Counties
4.3. Changes in Coastline Morphology
4.4. Model Fit and Prediction
5. Conclusions
- (1)
- From 1985 to 2015, the coastline of the Bohai Sea increased by 2080.80 km, accounting for a 73.43% increase of the total length in 1985, and sea area reduced by 2113.33 km2, accounting for a 2.44% decrease of the total area in 1985. The coastline showed a trend of increasing while sea area showed a trend of declining, and over each 10-year stage, the rate of change for each stage also showed an increasing trend. For the units at the provincial level along the Bohai Sea coast, Tianjin City had the largest change in coastline, growing by 273.80% of the total length of 1985. The units at the county level in each province with the biggest changes were Wudi County (Shandong Province), Huanghua City (Hebei Province), Tanggu District (Tianjin City), and Bayuquan District (Liaoning Province). Their changes in length were 310.23%, 329.32%, 297.45%, and 230.22% of their total length in 1985, respectively. During the past 30 years, the centroid position of the whole Bohai Sea moved about 1.14 km to the southeast.
- (2)
- The fractal dimension, compact ratio, circularity, and square degree of the Bohai Sea in 1985, 1995, 2005, and 2015 indicated that the compact ratio gradually became smaller, while the fractal dimension, circularity, and square degree grew larger. This showed that the shape of the sea surface became more complex and irregular, probably correlating with the coastline becoming longer and more indented and the sea area shrinking.
- (3)
- The R2 fitting of the coastline with the compact ratio, circularity, and square degree were higher than the R2 fitting of the coastline with the fractal dimension. The highest R2 fitting the coastline with the four shape indexes was 0.877 and the lowest was 0.792, which showed that shape index changed with years with certain regularity. The R2 fitting of the coastline with year and sea area reached a maximum of 0.795 and 0.634, respectively, and were lower than the R2 fitting year with shape indexes.
- (4)
- After comparing the model fit and evaluating the prediction accuracy, the prediction scheme with highest accuracy was chosen to predict the coastline length and sea area in 2025. The results showed that the method of predicting coastline using the year and predicting sea area using the compact ratio had the highest accuracy. According to the models, by 2025 the Bohai Sea coastline length will be 525.39 km longer, and sea area will be reduced by 1228.24 km2 compared with 2015. The loss of resources and environmental deterioration in the future caused by the speed of this reduction in sea area must be considered in future plans for coastal change.
- (5)
- The coastline of each year was obtained using an image from one time point. It was an instantaneous coastline when remote sensing images were taken. More accurate results would be obtained if using images from multiple time points each year.
Acknowledgments
Author Contributions
Conflicts of Interest
References
- Mujabar, P.S.; Chandrasekar, N. Shoreline change analysis along the coast between Kanyakumari and Tuticorin of India using remote sensing and GIS. Arab. J. Geosci. 2013, 6, 647–664. [Google Scholar] [CrossRef]
- Tebbens, S.F.; Burroughs, S.M.; Nelson, E.E. Wavelet analysis of shoreline change on the Outer Banks of North Carolina: An example of complexity in the marine sciences. Proc. Natl. Acad. Sci. USA 2002, 99, 2554–2560. [Google Scholar] [CrossRef] [PubMed]
- Li, Y.; Murray, L.; Dominic, R. Multi-scale variability of beach profiles at Duck: A wavelet analysis. Coast. Eng. 2005, 52, 1133–1153. [Google Scholar] [CrossRef]
- Ünal, Y.; Erdoğan, S.; Uysal, M. Changes in the coastline and water level of the Akşehir and Eber Lakes between 1975 and 2009. Water Resour. Manag. 2011, 25, 941–962. [Google Scholar]
- Jana, A.; Biswas, A.; Maiti, S.; Bhattacharya, A.K. Shoreline changes in response to sea level rise along Digha Coast, Eastern India: An analytical approach of remote sensing, GIS and statistical techniques. J. Coast. Conserv. 2014, 18, 145–155. [Google Scholar] [CrossRef]
- Al-Hatrushi, S.M. Monitoring of the shoreline change using remote sensing and GIS: A case study of Al Hawasnah tidal inlet, Al Batinah coast, Sultanate of Oman. Arab. J. Geosci. 2013, 6, 1479–1484. [Google Scholar] [CrossRef]
- Deepika, B.; Avinash, K.; Jayappa, K.S. Shoreline change rate estimation and its forecast: Remote sensing, geographical information system and statistics-based approach. Int. J. Environ. Sci. Technol. 2013, 11, 1–22. [Google Scholar] [CrossRef]
- Zhang, Y.; Zhang, J.L.; Jing, X.D.; Song, D.R.; Zhao, J.H. Historical changes of the length and fractal dimension of Chinese coastline since 1990. Mar. Environ. Sci. 2015, 3, 406–410. [Google Scholar]
- Bouchahma, M.; Yan, W. Monitoring shoreline change on Djerba Island using GIS and multi-temporal satellite data. Arab. J. Geosci. 2014, 7, 3705–3713. [Google Scholar] [CrossRef]
- Kankara, R.S.; Selvan, S.C.; Markose, V.J.; Rajana, B.; Arockiaraj, S. Estimation of Long and Short Term Shoreline Changes Along Andhra Pradesh Coast Using Remote Sensing and GIS Techniques. Proc. Eng. 2015, 116, 855–862. [Google Scholar] [CrossRef]
- Cui, Y.; Wang, Q.; Jin, B.F.; Zhan, C.; Liu, P. Geomorphic evolution of the coast along the southeastern Laizhou Bay over the past four decades. Ludong Univ. J. (Nat. Sci. Ed.) 2015, 2, 156–161. [Google Scholar]
- Wu, T.; Xie, X.F.; Jiang, G.J.; Bian, H.J.; Xiao, C.; Zhang, Y. Temporal and spatial analysis of shoreline changes in Yueqing Bay during 1981–2013. J. Zhejiang Norm. Univ. Nat. Sci. 2015, 3, 249–254. [Google Scholar]
- Li, X.M.; Yuan, C.Z.; Li, Y.Y. Remote sensing monitoring and spatial-temporal variation of Bohai Bay coastal zone. Remote Sens. Land Resour. 2013, 25, 156–163. [Google Scholar]
- Zhang, L.K.; Wu, J.Z.; Li, W.R.; Hu, R.J.; Qiu, J.D. Coastline changes and tidal flat evolution in west and south parts of Bohai Bay and affecting factors. Mar. Geol. Quat. Geol. 2014, 1, 21–27. [Google Scholar]
- Sun, X.Y.; Lv, T.T.; Gao, Y.; Fu, M. Driving force analysis of Bohai Bay coastline change from 2000 to 2010. Resour. Sci. 2014, 36, 413–419. [Google Scholar]
- Zhang, X.; Zhuang, Z.; Zhang, X.K.; Yang, B.H. Coastline extraction and change monitoring by remote sensing technology in Qinhuangdao City. Remote Sens. Technol. Appl. 2014, 29, 625–630. [Google Scholar]
- Wang, F.; Wang, H.; Wang, Y.S.; Pei, Y.D.; Li, J.F.; Tian, L.Z.; Sang, Z.W. Shoreline shifting and morphologic changes of the tidal flat-shallow sea area off Huanghua Harbor. Mar. Geol. Quat. Geol. 2010, 5, 25–32. [Google Scholar]
- Yu, C.X.; Wang, J.Y.; Xu, J.; Peng, R.; Cheng, Y.; Wang, M. Advance of Coastline Extraction Technology. J. Geomat. Sci. Technol. 2014, 3, 305–309. [Google Scholar]
- Wu, T.; Hou, X.Y. Review of research on coastline changes. Acta Ecol. Sin. 2016, 36, 1170–1182. [Google Scholar]
- Miao, J.W.; Ma, Y.; Zhang, J.; Sun, W.F.; Hu, Y.B. Coastline monitoring by remote sensing and change analysis in Tumen River estuary and adjacent area. Ocean Dev. Manag. 2017, 34, 39–45. [Google Scholar]
- Zhang, H.T. Monitoring of coastline change in Zhuhai based on high resolution remote sensing. Bull. Surv. Mapp. 2016, 11, 55–59. [Google Scholar]
- Liao, T.; Cai, T.L.; Liu, Y.F.; Xia, X.M. Continental shoreline change in Zhejiang during the last one hundred years. J. Mar. Sci. 2016, 34, 25–33. [Google Scholar]
- Li, Y.N.; Wang, Q.; Guo, P.F.; Zhang, S.Y.; Hu, H. Shoreline succession during recent 20 years in the Bohai Sea and the strategies for the development and utilization. Trans. Oceanol. Limnol. 2015, 3, 32–38. [Google Scholar]
- Zuo, L.J.; Xu, J.Y.; Zhang, Z.X.; Wen, Q.K.; Liu, B.; Zhao, X.L.; Yi, L. Spatial-temporal land use change and landscape response in Bohai Sea coastal zone area. J. Remote Sens. 2011, 15, 604–620. [Google Scholar]
- Leatherman, S.P. Historical Shoreline Change: Error Analysis and Mapping Accuracy. J. Coast. Res. 1991, 7, 839–852. [Google Scholar]
- Mu, F.Y.; Zhang, Z.X.; Chi, Y.B.; Liu, B.; Zhou, Q.B.; Wang, C.Y.; Tan, W.B. The dynamic monitoring and driving force analysis of Beijing City from 1973 to 2005 based on multi-source remote sensing data. J. Remote Sens. 2007, 11, 257–268. [Google Scholar]
- Cai, B.; Zhang, Z.; Liu, B.; Zhou, Q.B. Spatial-temporal changes of Tianjin urban spatial morphology from 1978 to 2004. J. Geogr. Sci. 2007, 17, 500–510. [Google Scholar] [CrossRef]
- Liu, C.R.; Chen, L.Z. Analysis of the patch shape with shape indices for the vegetation landscape in Beijing. Acta Ecol. Sin. 2000, 20, 559–567. [Google Scholar]
- Li, M.; Lin, C.M.; Huang, Y.Q. Fractal analysis of Quanzhou Bay coastline change. J. Huaqiao Univ. (Nat. Sci.) 2015, 36, 211–214. [Google Scholar]
- Zhang, X.; Pan, D.; Chen, J.; Zhao, J.H.; Zhu, Q.K.; Huang, H.Q. Evaluation of Coastline Changes under Human Intervention Using Multi-Temporal High-Resolution Images: A Case Study of the Zhoushan Islands, China. Remote Sens. 2014, 6, 9930–9950. [Google Scholar] [CrossRef]
- Xu, J.Y.; Zhang, Z.X.; Zhao, X.L.; Wen, Q.K.; Zuo, L.J.; Wang, X.; Yi, L. Spatial-temporal analysis of coastline changes in northern from 2000 to 2012. Acta Geogr. Sin. 2013, 68, 651–660. [Google Scholar]
- Karunarathna, H.; Reeve, D.E. A hybrid approach to model shoreline change at multiple timescales. Cont. Shelf Res. 2013, 66, 29–35. [Google Scholar] [CrossRef]
- Addo, K.A. Shoreline morphological changes and the human factor. Case study of Accra Ghana. J. Coast. Conserv. 2012, 17, 85–91. [Google Scholar] [CrossRef]

| Year | Number of Images | Path/Row of Images for Each Year | Sensor | Spatial Resolution | Band Used |
|---|---|---|---|---|---|
| 1985 | 7 | 120/32, 120/33, 120/34, 121/32, 121/33, 121/34, 122/33 | TM | 30 m | 5, 4, 3 |
| 1995 | 7 | TM | 30 m | 5, 4, 3 | |
| 2005 | 7 | TM | 30 m | 5, 4, 3 | |
| 2015 | 7 | OLI | 30 m | 5, 6, 4 |
| Provincial Units | Counties |
|---|---|
| Shandong Province (a total of 16 counties) | Laishan District, Zhifu District, Fushan District, Penglai City, Longkou City, Zhaoyuan City, Laizhou City, Changyi City, Hanting City, Shouguang City, Guangrao County, Dongying District, Kenli County, Hekou District, Zhanhua County, and Wudi County |
| Hebei Province (a total of 10 counties) | Huanghua City, Fengnan District, Tanghai County, Luannan County, Laoting County, Changli County, Funing County, Beidaihe District, Haigang District, and Shanhaiguan District |
| Tianjin City (a total of 3 districts) | Dagang District, Tanggu District, and Hangu District |
| Liaoning Province (a total of 17 counties) | Suizhong County, Xingcheng City, Longgang District, Lianshan District, Linghai City, Panshan County, Dawa County, Xishi District, Bayuquan District, Gaizhou City, Wafangdian City, Jinzhou District, Ganjingzi District, Xigang District, Lvshunkou District, Shahekou District, and Zhongshan District |
| Year | 1985 | 1995 | 2005 | 2015 |
|---|---|---|---|---|
| Coastline length (km) | 2833.90 | 2878.84 | 3485.68 | 4914.70 |
| Sea area (km2) | 86,639.31 | 86,365.38 | 86,252.15 | 84,525.98 |
| Interval | 1985–1995 | 1995–2005 | 2005–2015 | 1985–2015 |
| Change of length (km) | 44.94 | 606.84 | 1429.02 | 2080.80 |
| Percentage (%) | 1.59 | 21.08 | 41.00 | 73.43 |
| Change of sea area (km2) | −273.93 | −113.23 | −1726.17 | −2113.33 |
| Percentage (%) | −0.32 | −0.13 | −2.00 | −2.44 |
| Year | 1985 | 1995 | 2005 | 2015 |
|---|---|---|---|---|
| Centroid coordinate X (m) | 773,121.34 | 773,168.39 | 773,014.12 | 773,955.49 |
| Centroid coordinate Y (m) | 4,311,894.79 | 4,311,853.50 | 4,311,497.91 | 4,311,111.69 |
| Interval | 1985–1995 | 1995–2005 | 2005–2015 | 1985–2015 |
| Change of displacement (m) | 62.59 | 387.62 | 1017.52 | 1144.14 |
| Change of degrees from north | 131°16′8″ | 197°12′54″ | 112°18′25″ | 133°11′31″ |
| Interval | 1985–1995 (%) | 1995–2005 (%) | 2005–2015 (%) | 1985–2015 (%) | |||||
|---|---|---|---|---|---|---|---|---|---|
| Provincial Units | Tianjin | 43.65 | Hebei | 61.29 | Tianjin | 122.70 | Tianjin | 273.80 | |
| County units | Shandong | Changyi | 76.28 | Zhanhua | 66.98 | Wudi | 471.95 | Wudi | 310.23 |
| Hebei | Luannan | 52.64 | Tanghai | 325.58 | Fengnan | 149.41 | Huanghua | 329.32 | |
| Tianjin | Dagang | 134.16 | Dagang | −32.20 | Hangu | 200.18 | Tanggu | 297.45 | |
| Liaoning | Linghai | 32.60 | Bayuquan | 49.85 | Gaizhou | 125.71 | Bayuquan | 230.22 | |
| Time Interval | Change Percentage | Shandong Province (a Total of 16 Counties) | Hebei Province (a Total of 10 Counties) | Tianjin City (a Total of 3 Districts) | Liaoning Province (a Total of 17 Counties) |
|---|---|---|---|---|---|
| 1985–1995 | <10% | 5 | 4 | 1 | 11 |
| 10–30% | 9 | 2 | 0 | 6 | |
| >30% | 2 | 4 | 2 | 0 | |
| 1995–2005 | <10% | 6 | 2 | 0 | 8 |
| 10–30% | 5 | 3 | 1 | 6 | |
| >30% | 5 | 5 | 2 | 3 | |
| 2005–2015 | <10% | 2 | 0 | 0 | 4 |
| 10–30% | 3 | 5 | 0 | 5 | |
| >30% | 11 | 5 | 3 | 8 | |
| 1985–2015 | <50% | 6 | 2 | 0 | 11 |
| 50–100% | 5 | 4 | 0 | 3 | |
| >100% | 5 | 4 | 3 (all > 200%) | 4 |
| Year | Fractal Dimension (D) | Compact Ratio (C) | Circularity (R) | Square Degree (S) |
|---|---|---|---|---|
| 1985 | 1.07 | 0.35 | 2.89 | 2.56 |
| 1995 | 1.08 | 0.34 | 2.94 | 2.61 |
| 2005 | 1.09 | 0.28 | 3.53 | 3.12 |
| 2015 | 1.12 | 0.20 | 4.95 | 4.39 |
| Dependent Variable | Independent Variable | Function | Adjusted R2 | Equation |
|---|---|---|---|---|
| L | D | Compound | 0.958 | |
| C | Polynomial | 0.999 | ||
| R | Polynomial | 0.999 | ||
| S | Polynomial | 0.999 | ||
| D (x1) C (x2) | Linear | 0.943 (DW = 1.9) | ||
| A | D | Cubic | 0.984 | |
| C | Polynomial | 0.949 | ||
| R | Cubic | 0.963 | ||
| S | Cubic | 0.964 | ||
| L | Cubic | 0.962 | ||
| D (x1) C (x2) | Linear | 0.962 (DW = 1.9) | ||
| L | Year | Compound | 0.795 | |
| A | Cubic | 0.634 | ||
| D | Compound | 0.877 | ||
| C | Cubic | 0.870 | ||
| R | Compound | 0.794 | ||
| S | Compound | 0.792 |
| Prediction Object | Scheme | Prediction Value | C | P | Accuracy Rank |
|---|---|---|---|---|---|
| Coastline length (km) | 1 | 5440.09 | 0.0054 | 1 | good |
| 2 | 5807.92 | 0.0114 | 1 | good | |
| 3 | 6907.49 | 0.1722 | 1 | good | |
| Sea area (km2) | 1 | 84,312.51 | 0.0569 | 1 | good |
| 2 | 83,297.74 | 0.0188 | 1 | good | |
| 3 | 78,414.60 | 0.2794 | 1 | good |
© 2017 by the authors. Licensee MDPI, Basel, Switzerland. This article is an open access article distributed under the terms and conditions of the Creative Commons Attribution (CC BY) license (http://creativecommons.org/licenses/by/4.0/).
Share and Cite
Fu, Y.; Guo, Q.; Wu, X.; Fang, H.; Pan, Y. Analysis and Prediction of Changes in Coastline Morphology in the Bohai Sea, China, Using Remote Sensing. Sustainability 2017, 9, 900. https://doi.org/10.3390/su9060900
Fu Y, Guo Q, Wu X, Fang H, Pan Y. Analysis and Prediction of Changes in Coastline Morphology in the Bohai Sea, China, Using Remote Sensing. Sustainability. 2017; 9(6):900. https://doi.org/10.3390/su9060900
Chicago/Turabian StyleFu, Ying, Qiaozhen Guo, Xiaoxu Wu, Hui Fang, and Yingyang Pan. 2017. "Analysis and Prediction of Changes in Coastline Morphology in the Bohai Sea, China, Using Remote Sensing" Sustainability 9, no. 6: 900. https://doi.org/10.3390/su9060900
APA StyleFu, Y., Guo, Q., Wu, X., Fang, H., & Pan, Y. (2017). Analysis and Prediction of Changes in Coastline Morphology in the Bohai Sea, China, Using Remote Sensing. Sustainability, 9(6), 900. https://doi.org/10.3390/su9060900