1. Introduction
Many studies have predicted the future performance of companies for the purpose of making investment decisions [
1,
2,
3,
4,
5,
6,
7]. Most of these are based on the qualitative judgment of experts in related industries, who consider various financial and firm performance information [
8,
9]. However, qualitative judgments are highly subjective, and limited in the sense that conclusions come at a significant cost in terms of time and money. With recent developments in technology, researchers have begun using machine learning techniques to predict corporate performance [
1,
2,
3,
4,
5,
6,
7]. For example, artificial neural networks, which have relatively good predictive ability in various fields, are widely used in such studies [
4]. However, models based on artificial neural networks often suffer from the problem of overfitting on training data. Moreover, training a deep neural network takes a long time, and the propagation of errors, based on a backpropagation algorithm, back to the input layer can be difficult.
The results of many studies have shown that prediction models constructed using a support vector machine (SVM), as suggested by Vapnik, have good predictive performance and a fast learning speed [
10]. As a result, many researchers have investigated using a SVM to predict corporate performance and stock prices [
1,
3,
5,
7].
Recently, artificial neural network-based prediction models have again been attracting attention owing to the development of parallel processing technology, as well as algorithms that overcome the limitations of deep neural networks [
11,
12,
13]. A typical algorithm used to train a deep neural network is the deep belief network (DBN). A DBN performs pre-training through unsupervised learning using a restricted Boltzmann machine (RBM), and then fine-tunes the network via supervised learning on training data. In addition, convolutional neural networks, widely used in image processing and voice recognition, demonstrate good performance and are widely used in constructing classification models in various fields [
14,
15].
In order to construct a corporate performance prediction model, predictors are needed to predict the performance of companies. Most corporate performance prediction models use a company’s financial performance data and financial indicators as predictors. However, there has been a recent increase in the proportion of technology-intensive firms whose technological capability significantly influences their corporate performance. Thus, in order to predict corporate performance more accurately, it is necessary to use both a company’s financial information and its technical information as predictors. As a result, many recent studies have proposed indicators that show the technological competitiveness of a company [
16,
17,
18]. Many of these studies apply patent data, because they are easy to use in quantitative analyses, have an internationally uniform structure, and contain citation information [
19,
20,
21,
22].
Among the studies that predict a company’s corporate performance, there are few that construct a prediction model using patent data and a deep learning algorithm. In this study, we propose a deep neural network-based corporate performance prediction model that uses a company’s financial and technical indicators as predictors.
The proposed model includes an unsupervised learning phase, using an RBM, in which training uses the entire training data set. Then, there is a fine-tuning phase, which uses a backpropagation algorithm and a relatively up-to-date training data set. These data reflect the latest trends in the correlation between predictors and corporate performance in forecasting in order to improve the prediction accuracy of the network. In general, managerial environments change over time [
23,
24,
25,
26,
27]. Accordingly, a prediction model that cannot reflect recent trends will find it difficult to achieve sustainable prediction performance. The proposed model is expected to maintain sustainable prediction performance in a volatile business environment by fine-tuning the pre-trained model using the up-to-date data set.
2. Related Studies
With the development of technology, many researchers have attempted to use machine learning for investments and managerial decision-making. Here, artificial neural networks and SVMs show relatively good performance [
1,
2,
3,
4,
5,
6,
7]. The studies reviewed in this section predict a company’s performance and stock price using artificial neural networks.
Yoon and Swales [
28] proposed an artificial neural network-based model that predicts stock prices using economic and financial indices as predictors. Furthermore, they compared the prediction performance of their proposed model to that of a multiple discriminant analysis-based prediction model [
28]. Ahn et al. (2000) conducted a study to predict the bankruptcy of firms using a neural network algorithm [
4]. They used companies’ past financial performance indicators as predictors in the model. In addition, they improved the prediction accuracy of the model by adopting a preprocessing procedure, using a rough set approach to obtain a reduced information table. Finally, Lam (2004) proposed a model to predict the financial performance of firms using an artificial neural network with backpropagation algorithms [
29].
However, prediction models based on artificial neural network algorithms may degrade in prediction performance because of overfitting on training data. When training a multi-layer neural network, nodes in the lower layer of the network find it difficult to achieve meaningful learning because of the vanishing gradient problem [
30]. Therefore, studies often use a SVM to develop prediction models, because a SVM increases the prediction performance of a model by applying a maximum margin to reduce the possibility of overfitting [
1,
3,
5,
7].
Many studies predict increases and decreases in stock prices, as well as corporate default, using SVMs. Li and Sun (2009) suggested a SVM-based corporate default prediction model using the K-nearest neighbor algorithm [
31]. Huang et al. (2005) proposed a model to predict the fluctuation of a stock market using a SVM [
7]. The authors verified the proposed model empirically using NIKKEI stock average data. Their proposed SVM-based model showed superior prediction performance when compared with artificial neural network-based models.
Other studies have developed prediction models using a support vector regression (SVR), which is a modified SVM applied to a regression problem [
3,
32,
33,
34,
35,
36]. Hsu et al. (2009) predict the stock price of a firm using a SVR and a self-organizing map [
3]. Lee et al. (2016) proposed a SVR-based corporate prediction model that searches for optimal SVR parameters using a genetic algorithm [
37]. Hinton et al. (2006) proposed a DBN that can train deep neural networks effectively using a RBM and the wake—sleep algorithm [
11].
The development of parallel processing technology has greatly reduced the learning time of neural networks. Thus, many studies have begun using deep neural networks again in various fields, such as speech recognition, image processing, and prediction models [
11,
12,
13,
14,
15]. Deep neural networks are also used to predict firms’ performance. Ribeiro and Lopes (2011) proposed a model that uses a DBN to predict the defaults of French companies [
12]. The authors also compared the prediction performance of their model to that of a SVM-based prediction model. Their results showed that the performance of the DBN-based prediction model surpassed that of the SVM-based prediction model.
Shen et al. (2015) used an improved DBN to predict exchange rate movements [
13]. They applied continuous restricted Boltzmann machines (CRBM) and a conjugated gradient method in the training process. They conducted a comparative study to verify the prediction performance of the proposed model empirically by using the same time series data of exchange rates. Their results showed that the proposed model outperforms a feedforward neural network-based model.
In addition, DBNs are widely used for constructing prediction models in various fields. Huang et al. (2014) proposed a deep neural network model for traffic flow prediction using a DBN. They adopted a grouping method based on the weights of the top layer to train the proposed model more effectively [
38].
Kuremoto et al. (2014) proposed a modified DBN-based model for time series forecasting [
39]. They adopted a particle swarm optimization algorithm during the pre-training process using a RBM. Furthermore, they added a preprocessing process that removes the seasonal factors of the original data ahead of the model training step to obtain smoothed training data [
39]. They compared the prediction performance of the modified DBN model they proposed to that of a multi-layer perceptron-based model. It was shown that the proposed model had the lowest approximation error.
3. Deep Belief Networks
In this study, we propose a corporate performance prediction model using a RBM as the main component of a DBN. After pre-training using the RBM, the proposed model is fine-tuned using a backpropagation algorithm.
A DBN is a generative model with many layers [
11]. The training process of a DBN can be divided into two phases. The first phase is the pre-training step, using unsupervised learning and a RBM. The second phase fine-tunes the pre-trained neural network for predictive purposes on a training data set.
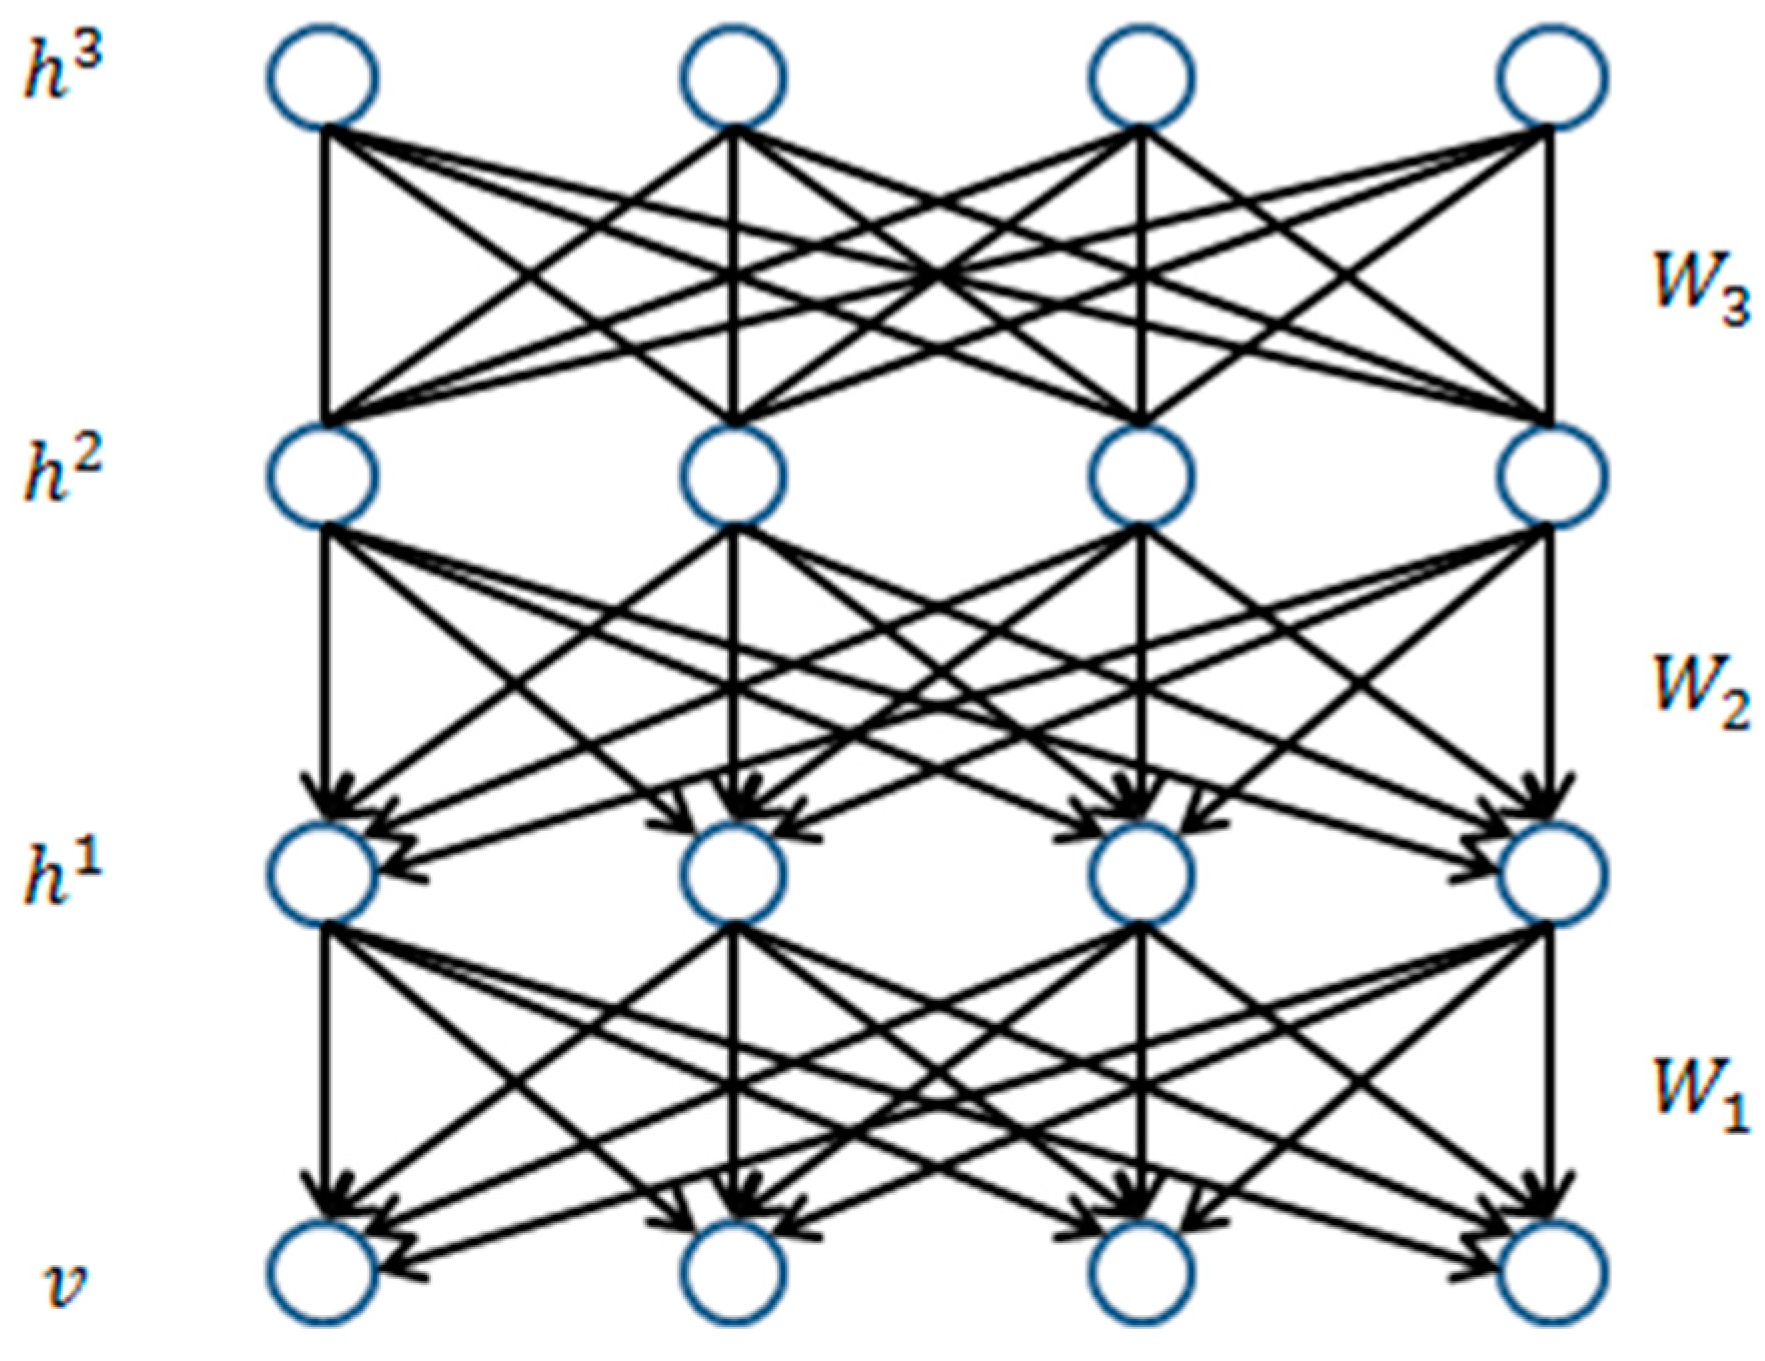
Figure 1 shows a DBN with three hidden layers.
As shown in
Figure 1, the connection between the H3 and H2 layers is undirected, while the connections between the lower layers are directed downward. Here, the top two layers of the DBN consist of a RBM. This acts as an associative memory for the top-level features in the DBN [
13]. The lower layers consist of a sigmoid belief network (SBN).
For example, the top two layers of a DBN, with N hidden layers, contain a RBM composed of
,
,
. The probability distribution of
is expressed as follows [
40]:
The probability distribution of
, located in the next layer, follows the probability distribution of an SBN, which is expressed as follows:
The probability distribution of the
-th hidden layer
is expressed as follows:
Lastly, the probability distribution of the visible layer
v at the bottom of the network is expressed as follows:
The training process of the DBN is performed by modifying its parameters so that the relationship between “data” and “feature” is expressed well, as described above [
11]. For a DBN with N hidden layers, the parameters
,
…,
are trained by searching
,
…,
, which contain the maximum log-likelihood of training data
v for
,
…,
. The log-likelihood of
v for the DBN parameters is expressed as follows [
40]:
As with the SBN, it is difficult to obtain the log-likelihood values directly if the hidden nodes of one layer are associated with a different layer’s hidden nodes. Therefore, a DBN is trained by identifying a parameter that maximizes the lower bound (
) of the log-likelihood [
40]. When the upper parameters
and the lower parameter
are bound, the processes of maximizing the lower bound of the log-likelihood and training an RBM using
as the parameter are the same. Using this, Hinton et al. (2006) proposed a method of training a DBN by training one layer of the network at a time, using multiple RBMs [
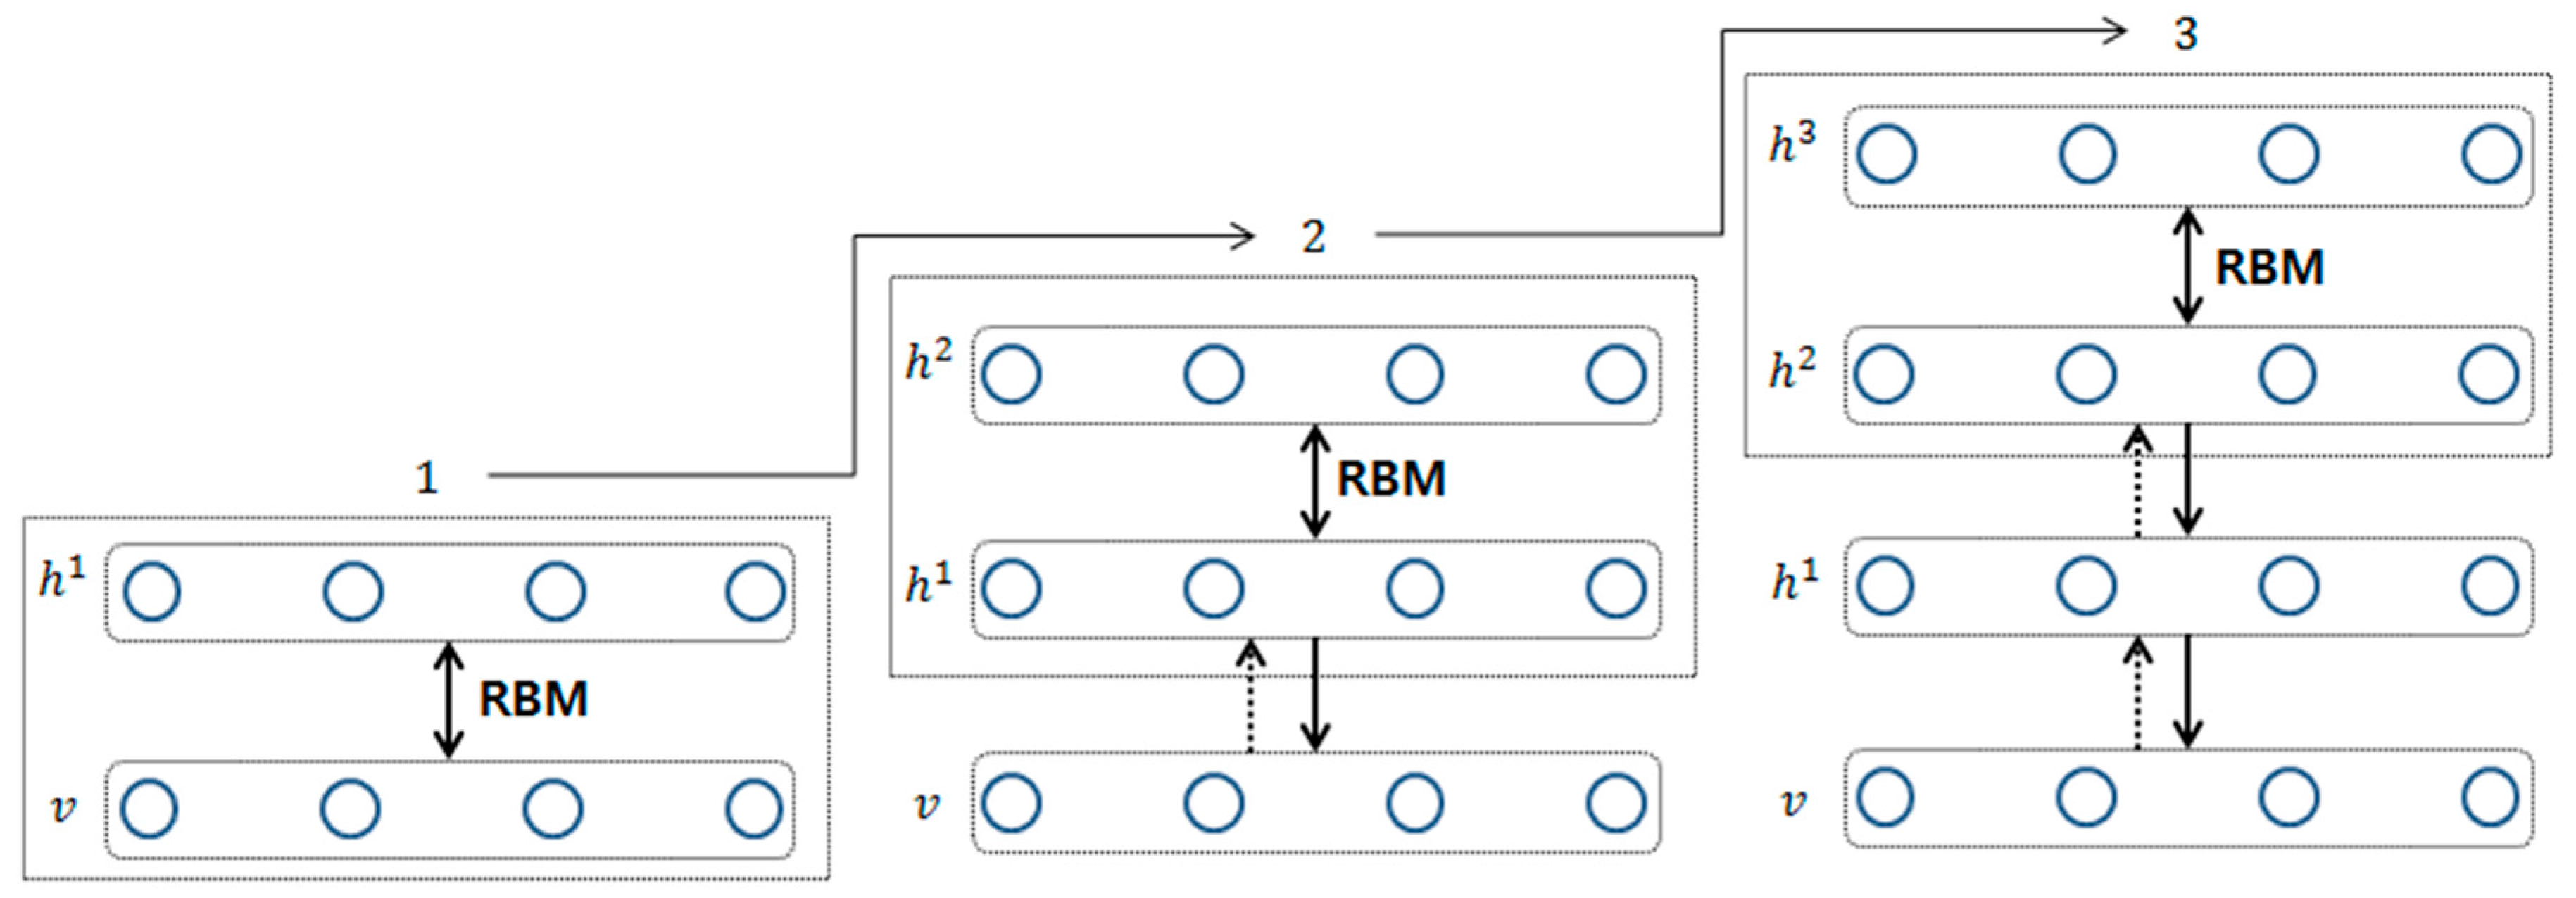
11]. The proposed training process is shown in
Figure 2.
As shown in
Figure 2,
is trained using a RBM with given training data
v. Then, the trained
is fixed and samples
by
(
). To train the second layer,
is trained using a RBM with the sampled
. Then,
for
is sampled by
(
). By repeating this step and stacking the hidden layers incrementally, it is possible to construct a directional neural network similar to a DBN [
40]. As previously described, the pre-trained neural network must be fine-tuned for a specific purpose. For fine-tuning, common methods include the wake–sleep algorithm, and adding a final layer to the upper layer of the pre-trained network, then fine-tuning using a backpropagation algorithm [
41].
In this study, we propose a deep neural network-based corporate performance prediction model trained in the same way as a DBN. In general, the impact of each corporate performance predictor changes with the market and business environment. Therefore, more recent trends should have priority when predicting corporate performance. In this study, the distribution of a company’s performance predictors is pre-trained using unsupervised learning, and applying a RBM with the full training data set (see
Figure 3). Then, we modify the pre-trained neural network using a RBM-to-general feedforward neural network (FNN) structure by stacking one output layer at the top of the pre-trained network. The initial values of the neural network parameters from the second layer to the visible layer of the modified neural network are replaced by the pre-trained parameters, and the uppermost parameters are set to the random initial values. Then, the network parameters are fine-tuned by applying a backpropagation algorithm, using relatively recent training data. Using recent data in the fine-tuning process means recent trends are given priority in predictions, thus improving the accuracy of predictions of time-series data (e.g., corporate performance) [
37,
42]. In addition, the model is expected to have sustainable prediction performance if new data are periodically added to the training data used in the fine-tuning phase.
4. Experiments and Results
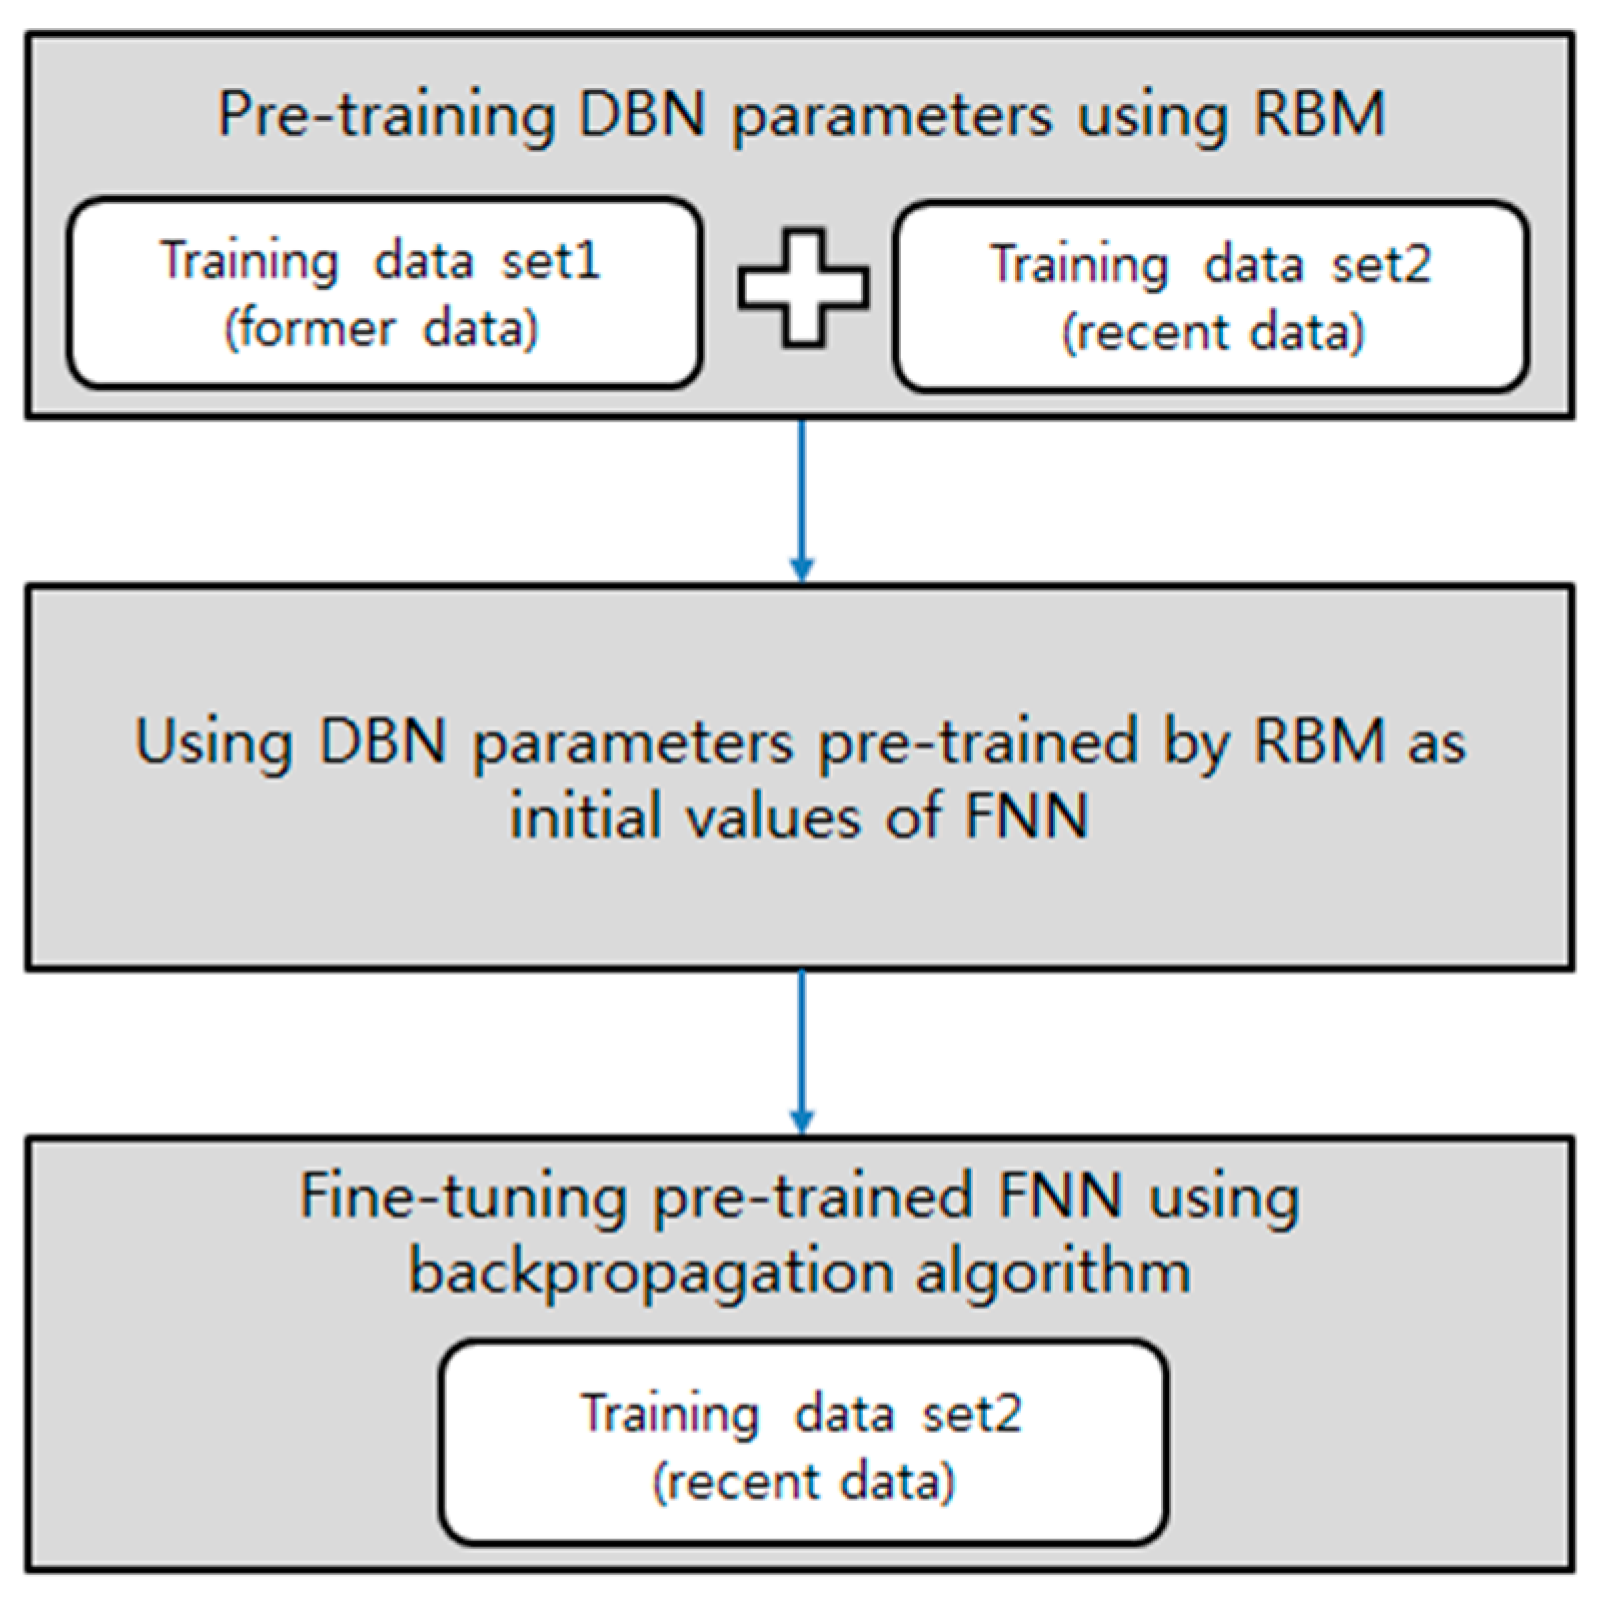
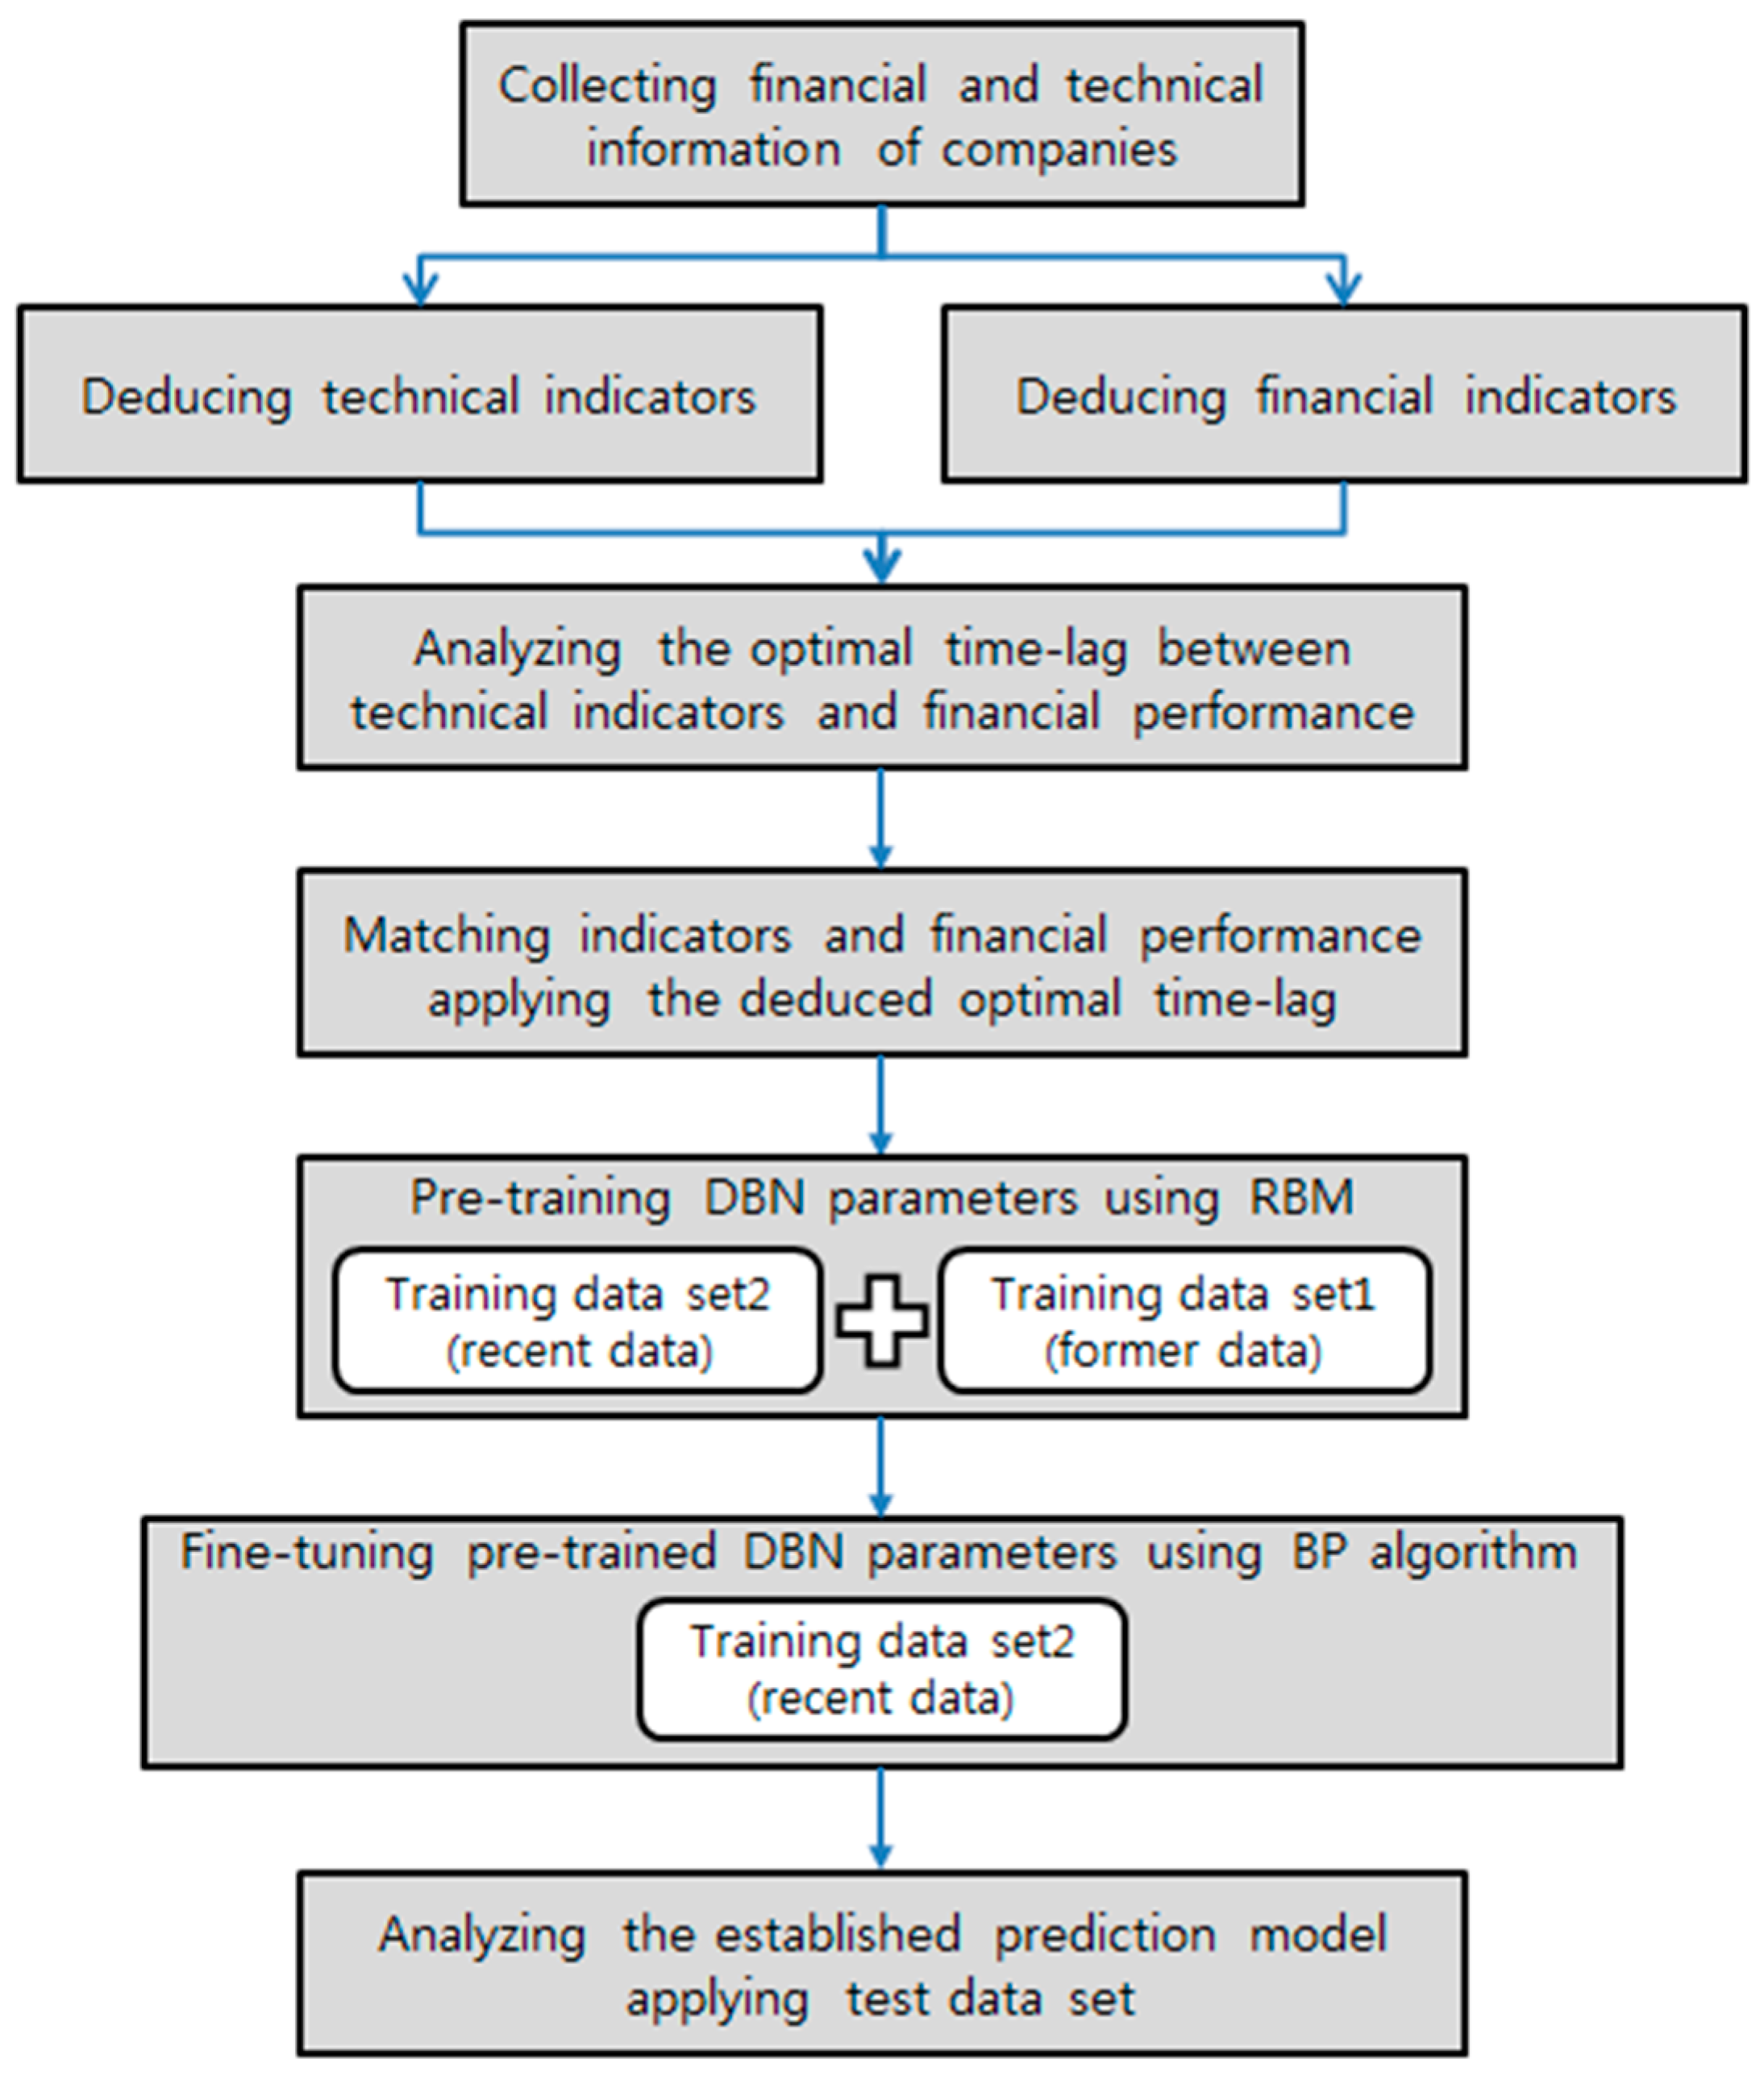
In this study, we propose a prediction model that predicts the revenue, operating profit, and net profit of a company, based on a RBM and a backpropagation algorithm.
Figure 4 summarizes the proposed model.
In this study, we analyzed the prediction performance of the proposed DBN-based prediction model using the financial, technological, and patent data of 22 pharmaceutical companies listed on the US stock market from 2000 to 2015. Using the verification data, we compared the predictability of the proposed model to that of models constructed using a SVR and a FNN.
4.1. Predictors of the Proposed Prediction Model
We used 11 financial indicators and four patent indicators as predictors in the proposed model to predict corporate performance. The descriptive statistics of the 11 financial indicators are shown in
Table 1.
In recent years, there have been studies using technical indicators that represent the technological capability of a company as predictors to predict corporate performance [
16,
17,
18,
37]. Many of these studies apply patent data to derive the technical indicators [
16,
17,
18,
19,
20,
21,
22,
37]. We collected 59,740 patent data items on 22 pharmaceutical companies in order to derive the technical indicators of companies’ technological capability. Using these data, four patent indicators (the number of patent applications, patent share, the number of Patent Cooperation Treaty (PCT) patent applications, and PCT patent share) were identified and used as predictors in the proposed model. The number of patent applications represents the total number of patent applications filed in a year by a particular company. The patent share denotes a company’s share of all patents in the same industry. Unlike a general patent application, a patent registered under the PCT can obtain exclusive rights in many countries at the same time. Because PCT patents are relatively costly in terms of application and retaining rights, they tend to be used for technically significant and valuable inventions. Therefore, we also include the number of PCT patent applications and the PCT patent share as predictors in the proposed model. The descriptive statistics of the four patent indicators are shown in
Table 2.
In many cases, it takes a number of years to commercialize a technology after applying for a patent and, thus, improve corporate performance [
37]. Therefore, we conduct a correlation analysis to determine the time-lag that maximizes the correlation coefficient between technical indicators and corporate performance. The results show that the average correlation coefficient is highest (0.5015) for a time-lag of three years, suggesting that the four technical indicators best explain and predict corporate performance after three years.
4.2. Model Design
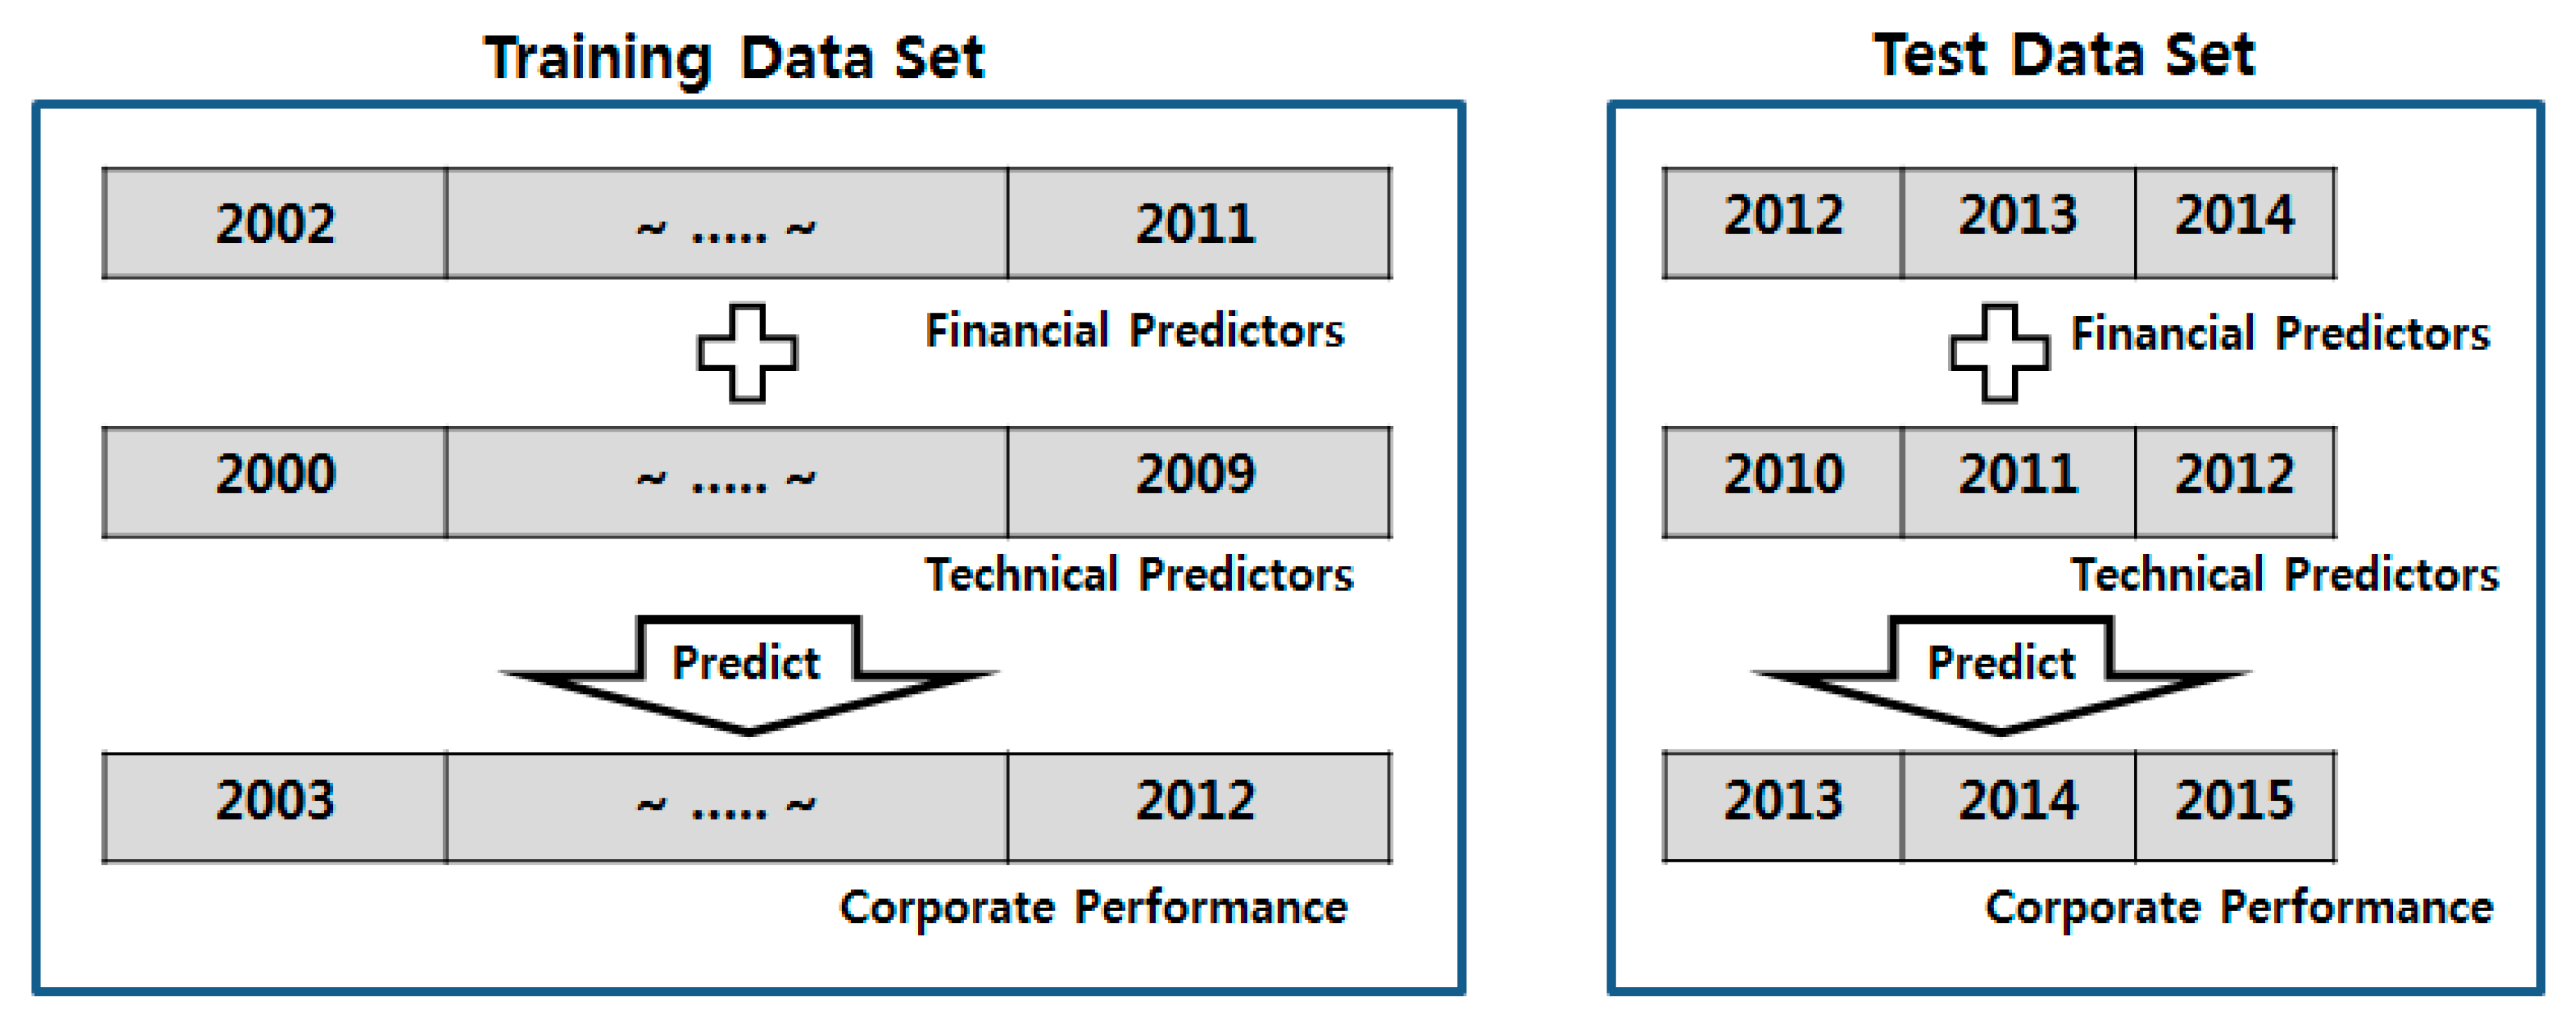
The purpose of this study is to construct a model that predicts a company’s future revenue, operating profit, and net profit using past financial and patent data. Changes in revenue, operating profit, and net profit are more stable than changes in a stock price. Therefore, if the model is designed to predict the corporate performance for the next quarter, a comparison with the performance of models developed using other algorithms, such as a SVR or a FNN, may be unclear. Therefore, we designed the proposed model to predict corporate performance using the financial indicators of the previous year, and the patent indicators from three years previously. To do so, we matched the financial indicators with the corporate performance one year later, and matched the technical indicators with the corporate performance three years later, as shown in
Figure 5.
In order to verify and analyze the prediction performance of the proposed model empirically, the model uses the financial indicators of 2002–2011, the technical indicators of 2000–2009, and the corporate performance of 2003–2012 as the training data set. The neural network architecture of the proposed model has six layers, consisting of an input layer with 15 visible nodes, four hidden layers each with 200 hidden nodes, and an output layer.
In the pre-training phase with a RBM, the financial indicators of 2002–2011 and technical indicators of 2000–2009 are used to train the model. In the RBM training parameters, the learning rate is set to 0.85 and the number of iterations (epochs) to 150000.
For fine-tuning, the pre-trained weight and bias parameters are set as the initial values of the neural network. Then, the output layer is placed on top of the pre-trained network to make a basic FNN architecture. In order to better reflect recent relations between the predictors and corporate performance, we fine-tune the parameters of the neural network using a backpropagation algorithm. Thus, the model predicts the corporate performance of 2009–2012 using the financial indicators of 2008–2011 and the technical indicators of 2006–2009. In the training parameters of the FNN with a backpropagation algorithm (BP-FNN), the learning rate was set to 0.85, and the number of iterations (epochs) to 250,000.
4.3. Experiment Results
In order to verify and analyze the prediction performance of the proposed model empirically, we predicted the corporate performance (revenue, operating profit, and net profit) of 2013–2015 using the trained model and the test data set (i.e., the financial indicators of 2012–2014 and the technical indicators of 2010–2012), as shown in
Figure 5.
The root mean square error (RMSE) value between the actual and predicted revenue for 2013–2015 is 3146.44M. The proposed model predicts a company’s revenue accurately.
The RMSE value between the actual and predicted operating profit for 2013–2015 is $2876.36M. The proposed model is relatively accurate in predicting operating profit compared to other machine learning algorithm-based models. However, because operating profit is, in general, more volatile than revenue, the model predictions are not as accurate as in the case of revenue.
The RMSE value between the actual and predicted net profit for 2013–2015 is $2783.44M. If, compared to the previous year, the net profit improves or falls sharply, the predictability of the proposed model decreases. However, the proposed model predicts net profit more accurately than other machine learning-based models do.
In order to compare the predictability of the proposed model to that of existing algorithm-based models, we used the DBN, FNN, and support vector regression (SVR) learning algorithms to construct corporate performance prediction models using the same training data. Then, we estimated the prediction performance of the four models using the RMSE, as in related studies [
43]. The RMSE values between the actual and predicted corporate performance values for the models, using the same test data, are shown in
Table 3.
In general, the prediction performance of SVM-based models is superior to that of neural network-based models in forecasting data with high volatility such as net profit and operating profit [
3,
7,
32,
33,
35,
37]. However, as shown in
Table 3, the prediction performance of the proposed DBN-based model is the most accurate. Its performance is 1.3–1.5 times better than that of the SVR-based model, which has shown good prediction performance in many studies [
3,
7,
32,
33,
34,
35,
36,
37]. Furthermore, a comparison of the RMSE of the proposed model and that of the general DBN-based model shows that fine-tuning the pre-trained model using relatively recent training data leads to better predictions of time-series data.
5. Results
Many recent studies have attempted to predict the performance of companies quantitatively using machine learning algorithms. Many of these predict the bankruptcy of companies, or increases and decreases in their stock prices. In this study, we proposed a model that predicts a company’s performance in terms of revenue, operating profit, and net profit. We used a RBM for pre-training, and a backpropagation algorithm for fine-tuning, similarly to the way in which a DBN is trained.
We constructed the proposed model using financial and patent data on 22 bio-pharmaceutical companies listed on the US stock market, and then verified the prediction performance of the model empirically. The results suggest that the proposed model shows good prediction performance. We also constructed corporate performance prediction models using various existing algorithms with the same training data set to compare the predictability between them. The results of the comparison show that the prediction performance of the proposed model is superior to that of the models constructed using the DBN, SVR, and FNN algorithms. Furthermore, the prediction accuracy of time-series data can be improved by using relatively recent data when fine-tuning the pre-trained network with a RBM.
The proposed model shows a 1.3–1.5 times reduction in the prediction error compared to that of the SVR-based model, which many studies have shown to have excellent prediction performance because of its high generalization performance. In particular, the proposed model predicts the performance of firms that record earnings surprises or shocks better than SVR-based models do. This shows that the proposed model has sustainable predictability while the general prediction models show degradation of prediction performance over time.
In future research, we expect that the accuracy of the proposed model will be higher if it includes R&D investment data, patent citation data, and patent valuations as predictors. In addition, it is necessary to construct a model and analyze its performance using long-term–short-term memory and a recurrent neural network, which show excellent performance in predicting time-series data.
Although using a deep neural network such as a DBN shows high prediction performance, it takes much longer to train than do models based on shallow learning algorithms, such as a SVR. Therefore, algorithms that can train a deep neural network in less time are necessary. It is also necessary to develop algorithms that can determine the optimal learning parameters, such as the learning rate and the number of iterations, within a required prediction accuracy.


