Article

Municipal Solid Waste Management in Ulaanbaatar, Mongolia: Systems Analysis

by
Bolorchimeg Byamba
* and
Mamoru Ishikawa
Graduate School of Environmental Science, Hokkaido University, Hokkaidō 060-0808, Japan
*
Author to whom correspondence should be addressed.
Sustainability 2017, 9(6), 896; https://doi.org/10.3390/su9060896
Submission received: 10 April 2017 / Revised: 19 May 2017 / Accepted: 22 May 2017 / Published: 25 May 2017
(This article belongs to the Section Environmental Sustainability and Applications)

Abstract

:
Research was conducted in Ulaanbaatar (UB), Mongolia with a view of finding ways of making its municipal solid waste management (MSWM) more efficient by minimizing the negative impact of waste on the environment and public health whilst increasing its resource efficiency in a manner that is economically and financially viable. In this study, “Wasteaware” benchmark indicators were applied to assess the current system for MSWM in UB according to its physical and governance features. Data were obtained from site visits, interviews with the key stakeholders, and consulting of official documents and reports. The results of benchmark indicators showed that, in terms of Public Health, Environmental Control and Institutional Aspects, UB had surpassed the levels of low- and lower-middle-income countries and sufficed the prerequisites for modernizing its waste management system. However, there are still some major steps ahead to fully transition to a modern system. Our study brought significant contributions by filling the existing literature gaps for UB and identified its key strengths and areas for improvement. We conclude that an improvement in data collection and reporting, and widespread consultation with all stakeholders would impact positively on the improvement of the efficiency of the MSWM in UB and other developing countries.

1. Introduction

According to the Global Waste Management Outlook (GWMO) prepared by the United Nations Environment Programme (UNEP) and the International Solid Waste Association (ISWA), approximately two billion tonnes of municipal solid waste (MSW) is being generated worldwide per annum [1]. About half of this is generated in the longstanding high-income developed countries; however, further increase will predominately be from developing countries by 2030 [2].
There is a huge gap in waste management practices between developed and developing countries. Since the 1960s, well-defined engineered systems have been assisting developed countries’ solid waste management (SWM) agencies, whereas the developing world is predominantly preoccupied with collection and removal services to date [3]. When the current methodologies of developed countries are applied to the practices of developing countries, many obstacles are present due to complexities that exist in the developing world [3,4,5]. These complexities include rapid economic growth, population increase, inequality, informal settlements, lack of financial instruments, and inadequate capacity of local governments [3,6,7,8,9]. Therefore, to solve SWM problems in developing countries, the solutions should be designed specifically to meet the needs of a given municipality or a community while taking into account all its specific features.
Ulaanbaatar (UB), the capital city of Mongolia, is one of the cities facing unprecedented consequences of rapid population increase coupled with economic growth and lack of proper regulations in place. A little over 40% of the total country’s population resides in this city [10]. A large part of this population resides in informal settlements, “ger districts”, which lack basic infrastructure [11]. The municipal solid waste management (MSWM) of the city is facing critical challenges, making it one of the most pressing issues concerning public health, the environment, and resource efficiency. However, there is insufficient peer-reviewed literature [12,13,14] describing the system and providing enough details with reliable data to form the basis of decision making for UB’s waste management.
MSWM is a multifaceted system that fits the concept of system of systems, which pools together the resources and capabilities of a collection of a few dedicated systems or subsystems to form a more complex metasystem by offering more functionality and performance than the sum of its constituent systems [15]. It implies that the interconnectedness of various aspects of MSW is far more important for the system’s overall functionality and performance. Therefore, MSWM analysis needs to consider socio-economic, environmental, financial and institutional aspects, as integrated approaches are a promising tool for tackling the current situation of waste management in developing countries [3,6,15]. Simultaneously, the issue of data availability and reliability needs to be addressed for successful management of waste and its negative impacts.
The purpose of this study is to analyse the current state of MSWM of UB, Mongolia by using systems analysis methodology of “Wasteaware” benchmark indicators [16], which is based on the Integrated Sustainable (Solid) Waste Management (ISWM) framework for the comprehensive performance measurement of both physical components and governance aspects of SWM while considering all relevant stakeholders. To achieve a more realistic analysis, we used in situ data collected from the most reliable sources. The results revealed both strengths and weaknesses specific to UB, which were in turn compared to the results of other countries from various income levels. The results would be useful for establishing an optimized system of solid waste management through informed policy making, effective use of financial and human resources, focusing on areas of critical importance, and by adopting a holistic approach. The effectiveness of a city’s SWM system can also be used as a proxy indicator of good governance [16], and how the city/municipality deals with its environmental problems and urbanization issues. The remainder of this paper is organized as follows. Section 2 brings forth background information on UB, followed with explanations on materials and methodology used in Section 3. Results are presented in Section 4, after which discussions are explored in Section 5. Finally, conclusions are given in Section 6.

2. Target Area of the Study

2.1. Background Information on Ulaanbaatar

Mongolia is a landlocked country situated in East Asia, bordered by China and Russia (Figure 1). UB is situated in the north centre of the country and lies at an elevation of about 1350 m a.s.l. in a valley on the Tuul River. It is the country’s administrative, cultural, commercial and financial capital. In 2015, the gross national income (GNI) per capita was US $3830, which is classified as a lower-middle-income country [17]. In 2014, Mongolia was classified as an upper-middle-income country for one year [18].
In 1990, Mongolia transitioned to democracy and market economy, which brought a series of unprecedented changes, especially in the development of the capital city’s structure. During that time, an intense rural to urban migration took place and UB’s population growth resulted in a large-scale increase of informal settlements—“ger districts”—across the city [19]. Ger is a traditional dwelling that is unique to nomads in the steppes of Central Asia.
Ger districts lack basic infrastructure such as water supply, sanitation and proper drainage systems that increases the exposure to water, sanitation and hygiene (WASH) borne diseases [20]. Due to the lack of a centralized heating system, a majority of the households use stoves for cooking and heating that are fuelled by the burning of coal, wood and other combustible materials and waste. Ger districts and apartment type residential areas represent 58% to 42%, respectively, of UB, as shown in Figure 2 [11]. During the transition period between 1990 and 2002, there was, in essence, no regulation in terms of urban planning and, as a result, many “illegal” buildings were built; ger districts in UB grew by 58% during this time [19,21]. However, in recent years, the growth rate of ger districts has been declining (see Figure 3) [11].
The study’s target area includes six central districts—Bayangol (BGD), Bayanzurkh (BZD), Songinokhairkhan (SKhD), Sukhbaatar (SBD), Khan-Uul (KhUD) and Chingeltei (ChD), as shown in Figure 1, totalling 3256.6 km2. In 2015, 1.27 million people resided in these districts [10]. Each district has apartment and ger areas; however, the proportion varies among them.

2.2. Policies and Current Practices of Solid Waste Management in Ulaanbaatar

Environmental Protection law of Mongolia (1995) placed responsibilities on the various administrative divisions and sets out the rights of citizens concerning waste management services. Mongolian Law on Waste Management (17 May 2012) regulates relations arising from collection, transportation, storage and landfill of household and industrial waste as well as promoting the re-use of waste as an alternative to virgin materials. An important local bylaw on “Funding of waste management and transportation operations and consolidation of waste management service fees”, which regulates waste management activities connected to MSW generating from domestic and commercial premises, was enacted on 15 May 2015.
City-scale waste management is facilitated by the municipal government. UB’s city council known as the Citizen’s Representative Khural is in charge of appointing the mayor. Within the mayor’s office, the Public Service Department (PSD) is in charge of formulating the city’s waste management policies and its related work. At the district level, the infrastructure and public service department within the district governor’s office is in charge of implementing the policies regarding waste management and its related work in its designated territory.
The districts contain several subdivisions called “khoroos”. Khoroos are then further divided into khesegs, which is the smallest unit of administration. Waste collection is provided at the district level. Each district is divided into “service zones” that consist of one or several khoroos (BGD, one zones; BZD, four zones; SBD, five zones; ChD, two zones; KhUD, two zones; and SkhD, three zones). Waste service providers known as TUKs in Mongolian (Tohijilt Uilchilgeenii Kompani), are appointed to each zone and are in charge of waste collection, removal and transportation services, as well as the cleaning of public spaces of their designated districts.
There are three disposal sites in UB that use varying degrees of landfill technology: Narangiin Enger (NEDS), Morin Davaa (MDDS) and Tsagaan Davaa (TsDDS). The incoming waste categories include waste from households (ger and apartment), streets and public spaces, commercial, construction and demolition (C&D) and waste from dams, drainage, and sewage sludge, and other (including industrial, medical, secondary raw materials and summer house waste). Medical waste is waste from hospitals that is treated by an autoclave system at NEDS prior to secured burial in the same disposal site.

2.3. Uncertainties in Solid Waste Management of Ulaanbaatar

MSW definition ambiguity: According to the Mongolian Law on Waste Management (2012), there is no legal definition of MSW, as is the case for some countries that do not use the term “municipal solid waste” or “MSW” in their native languages [22]. This hinders the amount of MSW generation, as there are various waste categories coming from different sources.
Japan International Cooperation Agency (JICA) worked on UB’s SWM from 2005 to 2012 [23,24], and made significant contribution in the formal waste management sector such as constructing sanitary landfill sites with weighbridges, procuring waste collection trucks, strengthening the capacity for SWM and conducting waste generation and composition studies and so on. Nevertheless, the system is still inadequate in terms of basic requirements.
Lack of data: Availability of reliable and up-to-date data is one of the biggest challenges in developing countries as well as in UB, which is related to the inadequacy of data collection and reporting. However, this might constitute a barrier to action, or allow incorrect assumptions resulting in incorrect actions [16]. There are no regular waste generation and composition studies conducted. There is a lack of data on informal recycling which accounts for most of the recycling activities. Recyclable waste is informally recovered from the MSW stream and flow into the recyclable stream during each process [22] of discharge, collection, transportation and disposal. Therefore, there is an urgent need to address these uncertainties, which occur in solid waste management.

3. Materials and Methodology

The ISWM “Wasteaware” benchmark indicators introduced by Wilson et al. [16] are based on the work of UN Habitat’s city profiling methodology for SWM for countries of both developed and developing backgrounds [4]. The methodology was tested on more than 50 cities [7,25,26,27], which validates the approach and is very suitable especially for cities that are still in the early stages of developing their SWM systems.
The indicators were assisted by fieldwork, which consisted of site visits, interviews with the key stakeholders, and consulting of official documents and reports; conducted in UB from 25 August to 24 September 2015. Data from previous reports and scientific papers were also used. Interviews were conducted with previously identified key stakeholders which included local and municipal government officials, TUKs, landfill site workers, Non-Governmental Organizations (NGOs), recycling association, auditors and public inspectors.
The collected data were used to assess the MSWM system according to its physical components and governance aspects. Physical components consist of: (1) public health; (2) environmental protection; and (3) resource management. Governance aspects consist of: (4) inclusivity; (5) financial sustainability; and (6) sound institutions, proactive policies. Each of these components and aspects are represented with their corresponding quantitative and qualitative indicators. There are four quantitative and eight qualitative indicators in total. The details are as follows: the physical components are comprised of four quantitative (numbered as 1.1, 1.2, 2 and 3, corresponding to each component, the same applies to all indicators) and three qualitative (multi-attribute, composite) indicators (numbered as 1C, 2E, and 3R); the governance aspects are in turn comprised of five qualitative indicators (numbered as 4U, 4P, 5F, 6N and 6L). The quantitative indicators are represented by a single numerical value in percentage (%). The qualitative indicators are comprised of 5–6 variables that are each given a score of 0, 5, 10, 15 or 20 (from low to high), consistent with Likert-type measurement scales [16,28,29], corresponding to practices that were exceptionally bad/lacking, notably worse than the average, average, notably better than the average, and exceptionally good, respectively. These variables’ scores are then summed together into the score for their qualitative indicators. The benchmark indicators’ results obtained for UB were then compared to four reference cities [16] of all income levels (high, upper-middle, lower-middle and low) classified based on GNI per capita [17].
According to the Global Waste Management Outlook (GWMO), MSW is waste from households and smaller businesses and institutions [1]. In the Mongolia Law on Waste Management, household waste is defined as waste generated from domestic premises and waste of similar composition. For this paper, MSW is waste from households (ger and apartment) and waste from streets and public spaces.
Key waste-related data (waste generation and composition) are part of the supporting information for the benchmarking methodology, comprising the basic information [30] for successful planning, handling and operations optimization of waste management system. The waste generation per capita was calculated based on the weighbridge data at the disposal sites of NEDS, MDDS and TsDDS for year 2015 that was obtained from Link Engine LLC (in charge of the system maintenance and support services for weighbridge data registering software). The composition of household waste was extrapolated from JICA studies of 2010–2011 [31,32] and was compared to the averages of other countries according to all income level groups [1]. “Wasteaware” benchmark indicators are accompanied by a material flow diagram (MFD). However, due to uncertainties in waste flow and insufficient data on recycling aspects, the MFD was constructed using the currently available weighbridge data of 2015 in combination with JICA’s recycling estimates with an attempt to give some overview of the informal recycling activities [24]. The MFD was constructed using the STAN material flow analysis software [33].
The results obtained would help SWM system by identifying strengths to build upon and areas for improvement. The objective of the study was to make policy recommendations and course of action to UB’s authorities and by extension to the international community, especially other developing countries that are faced with similar problems.

4. Results

4.1. Waste Generation and Composition

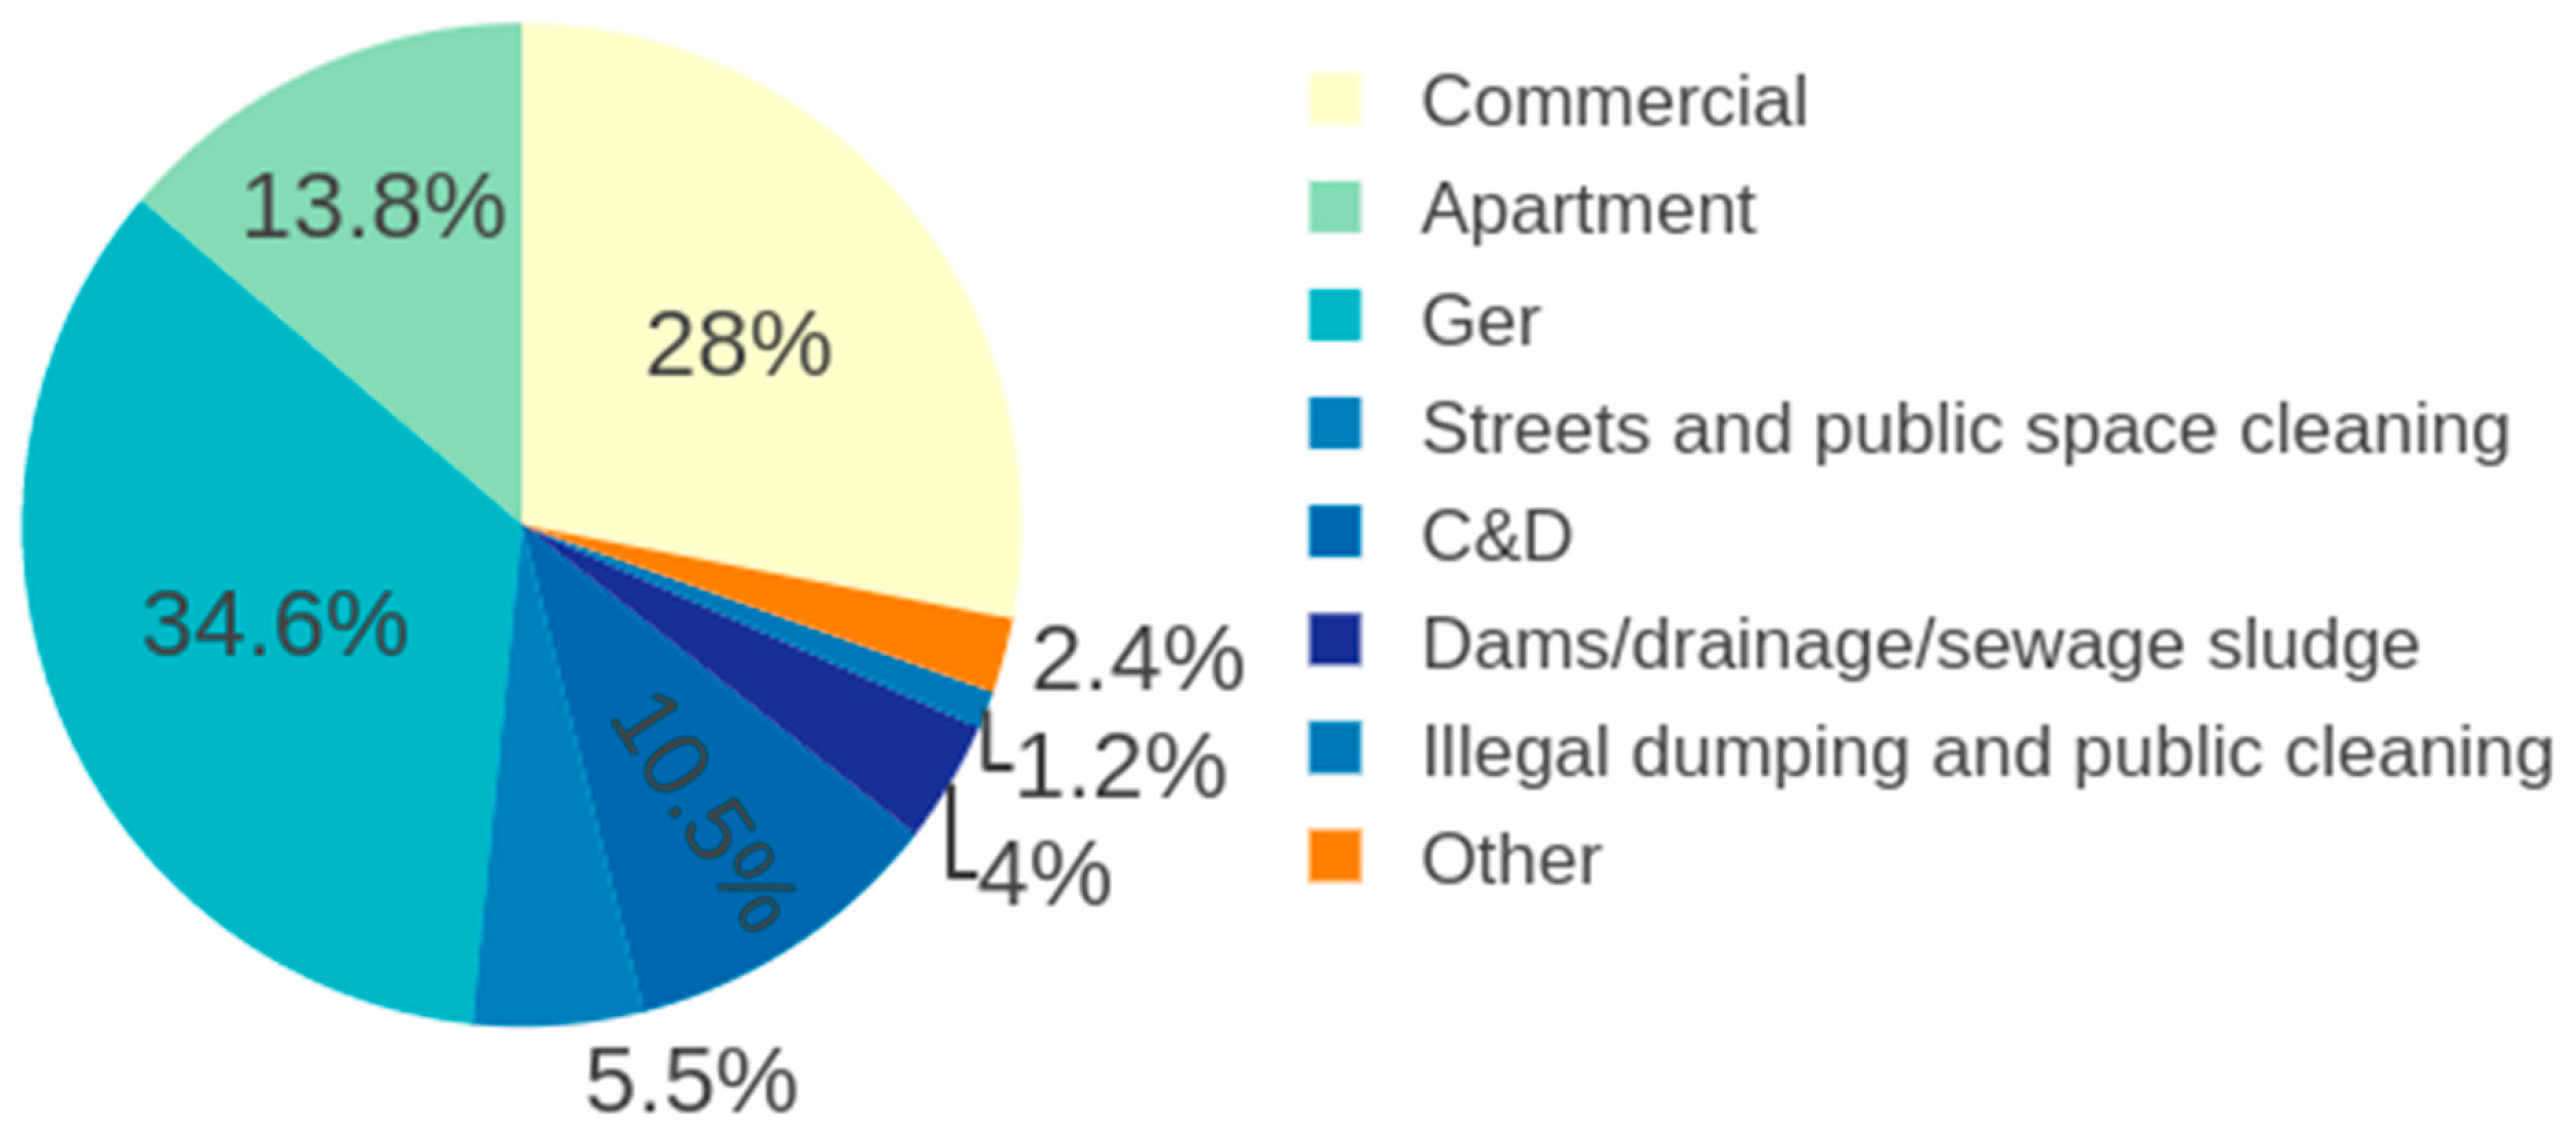
In 2015, the total amount of all waste registered at all three landfill sites was 969.1 thousand tonnes (Figure 4 showing all the waste categories) arriving at NEDS, TsDDS and MDDS with the proportions 47%, 36.8% and 16.2%, respectively. MSW waste includes waste from household (apartment and ger) and streets and public spaces that accounts for 53.9% of total waste registered at weighbridges. MSW generation of UB city is 1.12 kg per capita per day (408.82 kg per capita per year). This number should be considered as the minimum, since recyclables are extracted in the stages prior to disposal. More information about the recycling process is included in Section 4.4 on resource management. The waste generation amount exceeds the threshold of 1kg per capita per day, making UB a “higher waste generating” city [16].
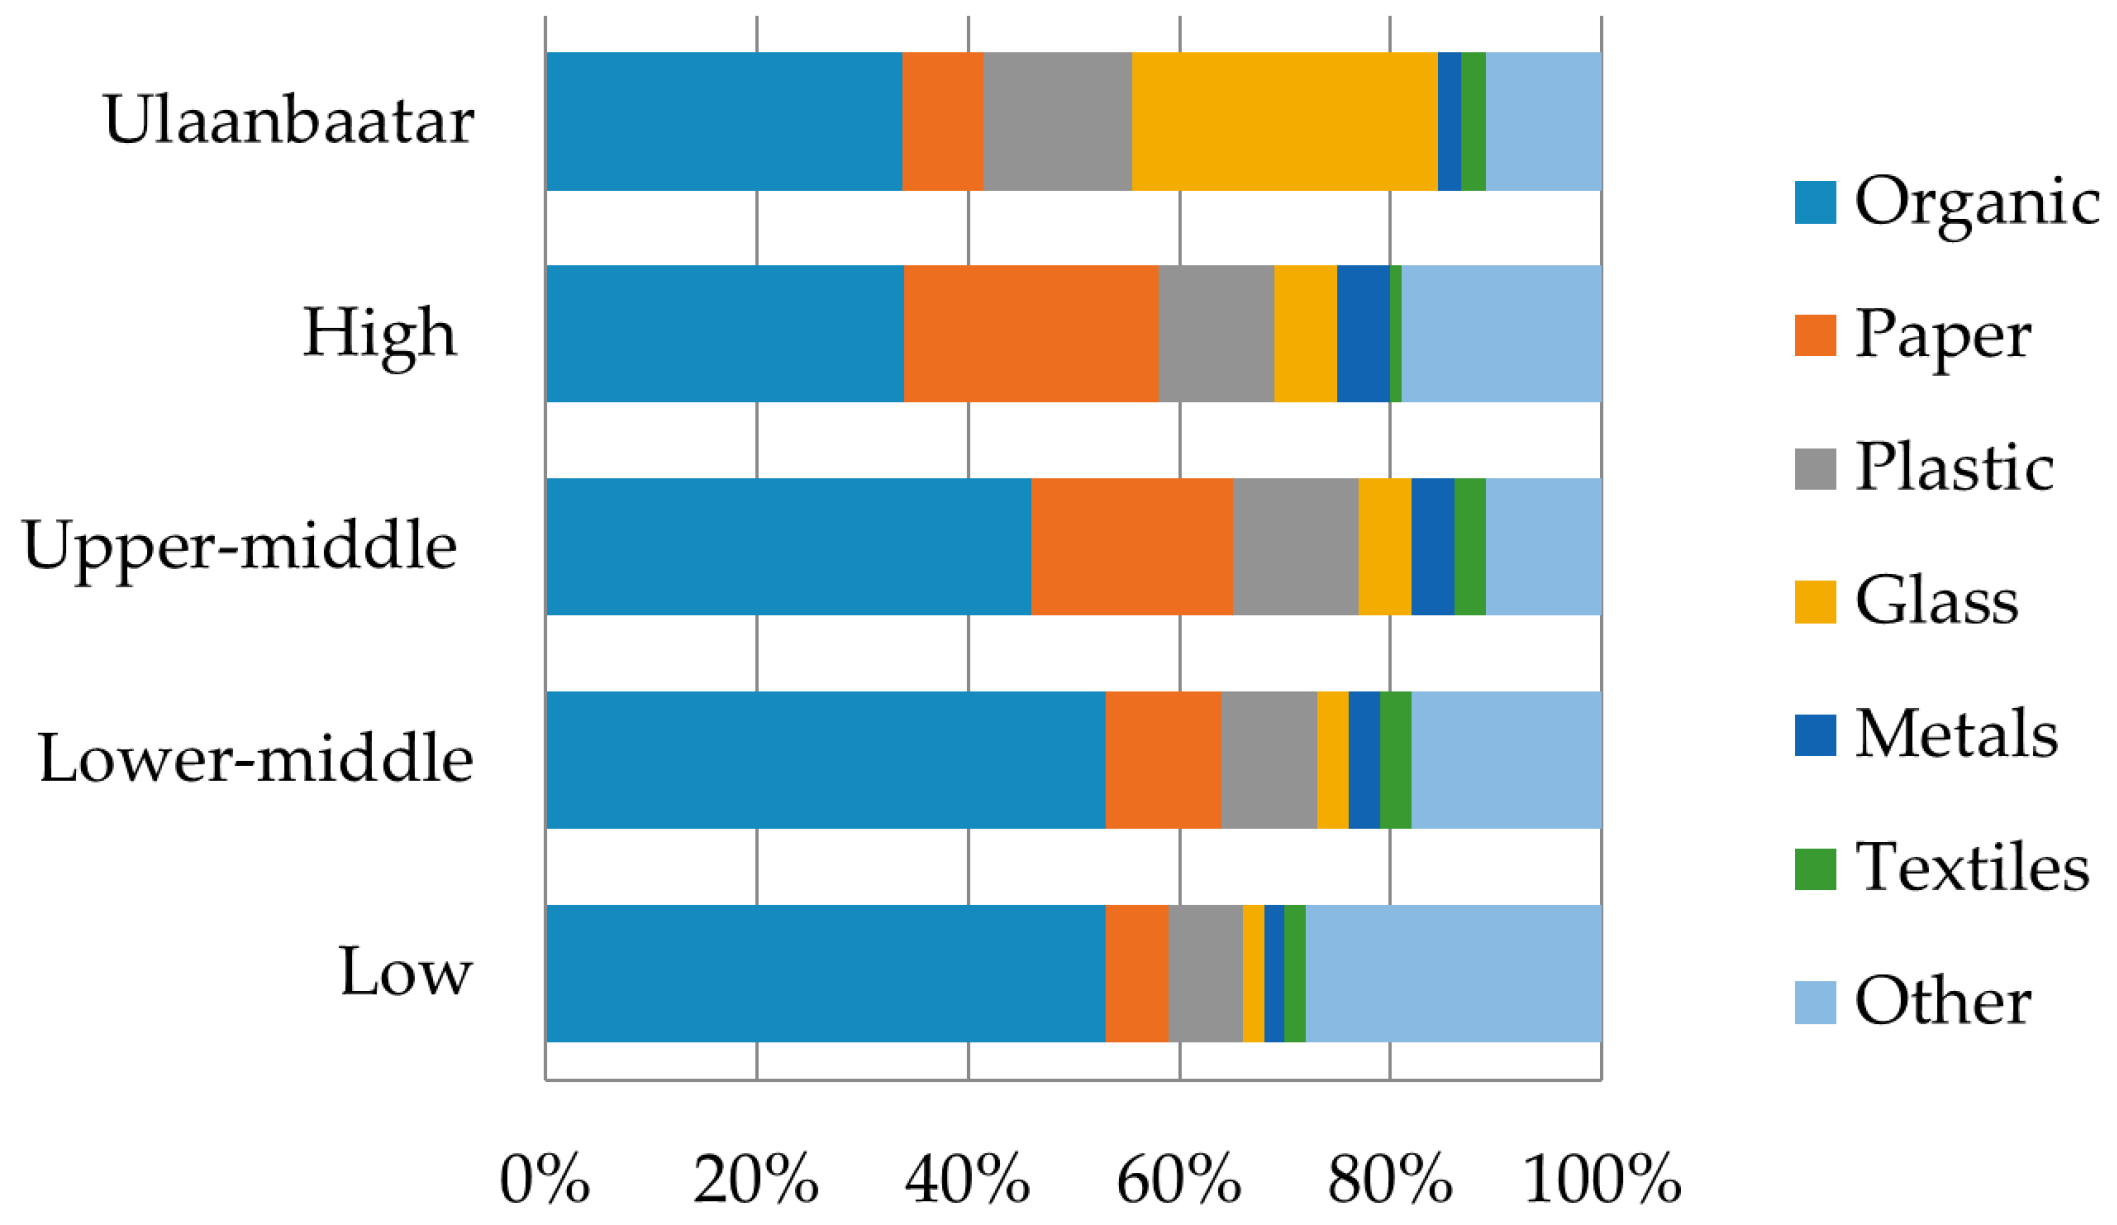
Mongolia is considered a lower-middle-income country, however, according to JICA’s study [31,32], UB’s household waste composition had qualities of countries from all income levels (Figure 5). For instance, UB has only about 33.7% organic fraction, which is similar to high-income countries. The amount of paper (7.7%) and metals (2.1%) were comparable to lower-income countries. The percentage of plastic (14%) waste was in the higher range compared to all other income countries’ waste composition. The percentage of bottles and glass (29%) was significantly higher than the rest. This could be explained by the amount of consumption of products that come in glass jars and bottles, however this should be further investigated for clarity. The percentage of recyclables including paper, plastic, metal, bottles and glass accounted for approximately half (52.8%) of the total waste amount. In this survey, ash from stoves in the ger area was excluded. In the wintertime, the amount of ash in the ger areas increases to an amount equal to the total waste generation from both apartment and ger areas combined.

4.2. Public Health (Waste Collection)

Waste collection service is the primary requirement for eliminating the negative impact of waste on public health. According to the PSD, about 85% of the total waste generated is being captured by the SWM system. However, this needs to be further investigated based on detailed, reliable data and quality research. Nonetheless, based on field observations, there are open dumps that are not being cleared: the amount of illegally dumped waste registered at weighbridges accounts for only 1.2% of total incoming waste amount (see Figure 4), which implies the amount of waste that is still not being captured by the SWM system could be significant and posing threat to the public health directly and through contamination of the surrounding environment.
In terms of residential waste, the waste collection method and frequency differ in both areas of ger and apartment. In apartment areas, households dispose their garbage in waste collection containers, whereas in ger areas the waste collection is primarily on a door-to-door basis. For this reason, there are more waste collection points/containers in apartment residential areas compared to ger district areas. There is medium incidence of accumulated waste around collection points/container (see score for 1C.1). In some of the central apartment areas where there are no waste collection containers, the waste is gathered in front of the apartments or along the road.
Waste collection frequency in apartment and ger areas is 1–2 times a week and 1–2 times a month, respectively. Due to the characteristics of ger areas (horizontally spread and poor infrastructure), waste collection is costlier and more labor and time intensive. Waste collection was about once a month in some of the ger areas, which was changed to twice or more in recent years, especially since the launch of the “model khoroo” project [35]. The Asia Foundation’s “model khoroo” project was directed to improving waste management in ger areas. One of the outcomes of the project was to create a set waste collection schedule (as it was vague and not being followed) with a frequency of twice a month, which became the mandatory requirement for TUKs. However, the renewed schedule system is still being adopted by districts and khoroos, and needs more effort on its actual implementation. According to a public inspector of Sukhbaatar district, the difference between waste collection frequencies of 1 and 2 is very evident. Therefore, a minimum frequency of twice a month should be uniformly attained by all ger districts’ waste collection services (as this could impact the open dumping) before considering other factors such as seasonal, economical and sanitary etc.
However, the situation in low-income districts especially in the marginal areas is still very critical with high incidence rates of accumulated waste, illegal dumps and open burning (hence the score for 1C.3). According to the PSD, 90–95% of households in UB receive waste collection service, excluding some marginal areas that are difficult to access due to steep and narrow roads. Those households dispose their garbage in their surrounding environment (i.e., drains and watercourses). However, this number should be subject to further investigation.
TUKs, the waste collection companies collect waste from households whether they have paid the waste service fees. Collection of waste service fee was previously collected by TUK in the ger areas, however this is no longer the case. Each TUK makes contractual agreement directly with the districts, and is paid based on their performance (Section 4.5 describes financial aspects and other governance features in more details). Waste collection and disposal is monitored by auditor NGOs and through documents including the driver’s record stamped by the dispatcher at the weighbridge, the kheseg leader’s record and finally the khoroo governor’s confirmation of the work performance. TUKs are also obligated to invest 2% of the contract fees for training of their workers and educating citizens regarding waste related issues (see score for 1C.5). Thus far, the TUKs have made brochures, pamphlets and educational comics and distributed to the households of their corresponding districts. This work could be more impactful, if further coordinated with municipal scale programs in a systematic way.
There are no waste transfer stations; waste is directly transported to the disposal sites. As for waste collection trucks, there are both open and contained types. Most of the vehicles require human labor, especially during winter for the handling of ash from the ger areas (see score for 1C.4). At the time of the fieldwork, there were 18 TUKs with 274 trucks (seven of which are private TUKs with 91 trucks), operating on the premises of six central districts. A certain number of the trucks have a GPS system installed for monitoring their location, and speed; with sensors installed for fuel expenditure. According to the field survey, due to financial difficulties, one of the biggest remaining challenges is upgrading the vehicles and the machinery.
In terms of the health and safety of collection workers and street cleaning staff, most of the TUKs provide annual health-checks, boots, gloves, overalls and high visibility vests. The work is labour intensive and working conditions are harsh especially in the winter (see score for 1C.6).
In recent years, the municipality of UB made an effort focused intensively on street cleaning in the city centre, main roads and popular places where people gather (see score for 1C.2). Ulaanbaatar Public Utility Agency (UBPUA) is in charge of the city’s public area cleaning (including dams, drainage and sewage sludge), operating a total of 25 trucks. According to the 2014 report by PSD, the salary for street cleaners at UBPUA was increased by 20% (average salary is 600–750 thousand tugriks (US $306–382)) and drivers by 11.13% (600 thousand tugriks (US $306)) and waste collectors by 19.7% (567 thousand tugriks (US $289)), while the total number of workers per job category was increased by 63% (total 604 street cleaners), 7.5% (288 drivers) and 4.3% (416 waste collectors) compared to the numbers of 2013 [US $1 = 1960 MNT (2015)].
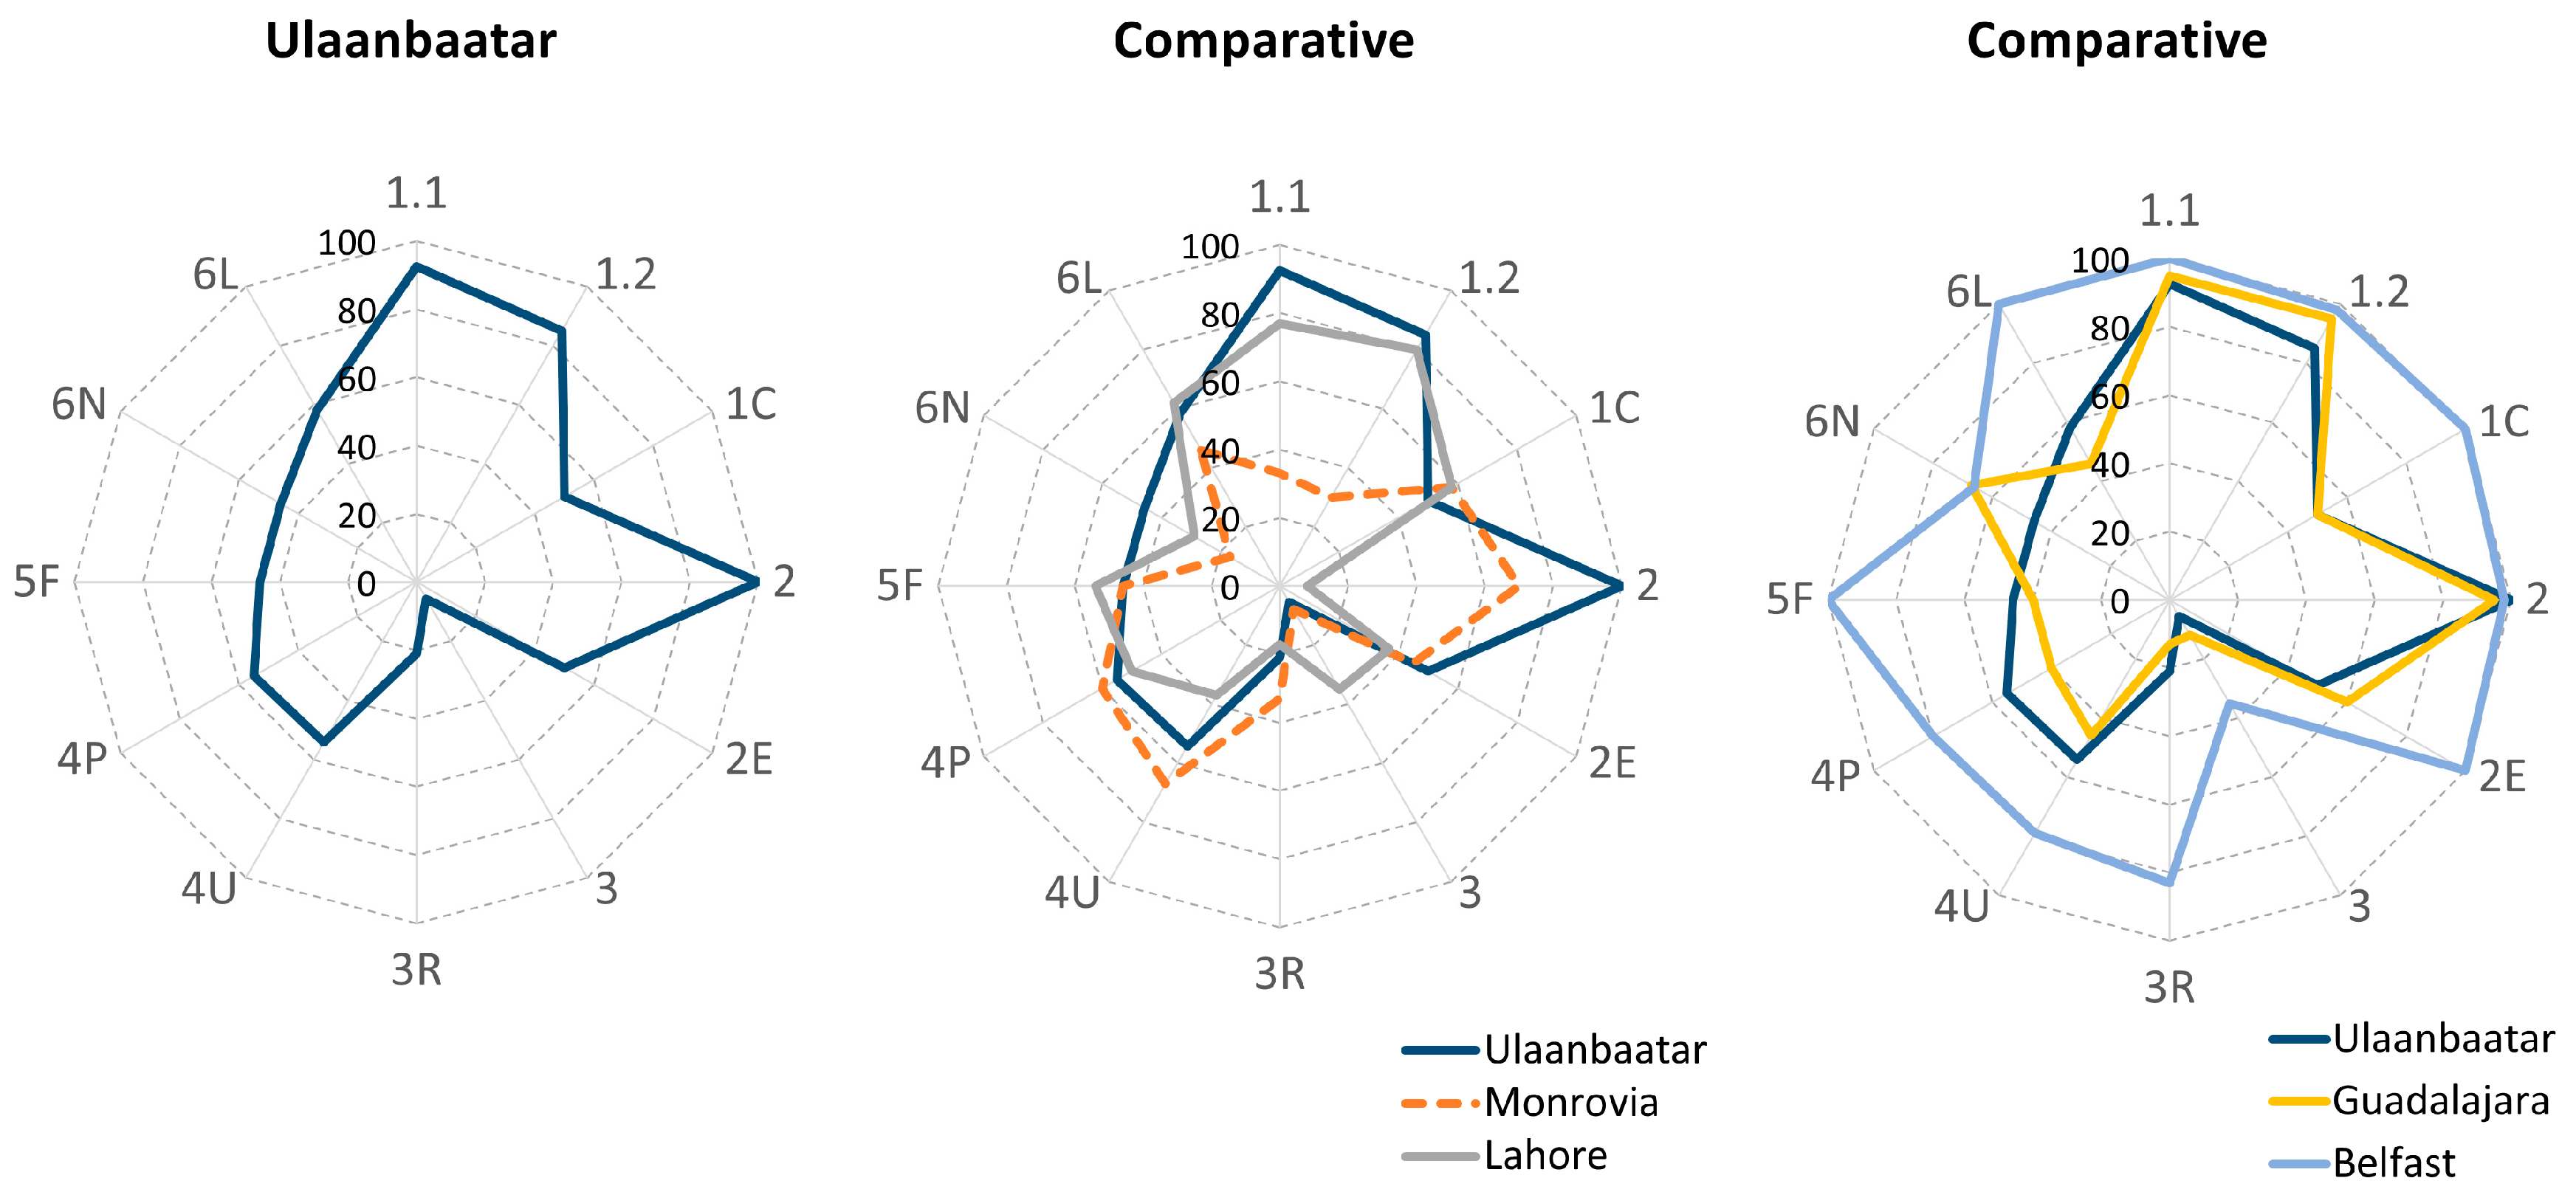
The benchmark indicators for Public Health were scored based on the points discussed above and a summary of the evaluation for the benchmark indicators and their comprising variables is shown in Table 1. The quantitative indicator scores are 92.5% (average of PSD’s reported number) for waste collection coverage (1.1) and 85% (1.2) for waste captured by the SWM system. Consequently, the score for the qualitative indicator (1C) is 50%.

4.3. Environmental Control (Waste Treatment and Disposal)

It was found that 100% of waste which is captured by the system is destined for treatment or disposal in the three controlled disposal sites. Out of the three sites, NEDS, is the most advanced landfill site, an engineered facility that was constructed by JICA, whereas the other two sites are controlled facilities (see score for 2E.2). It has adequate vehicular access to the site with paved roads and is better in terms of overall security. However, all the sites can be accessed easily. All the sites have weighbridges and keep records of all the incoming waste statistics, including incoming waste volumes, weights and categories. Other properties such as waste composition, waste moisture, density etc., have not been researched. Waste is unloaded under supervision of a site staff. There are waste pickers in each disposal site that collect recyclables for a living. They account for most of the fires set at the landfill sites, especially during winter for heating purposes (see score for 2E.1).
No Environmental Impact Assessment was done at these sites, except for NEDS and MDDS in the initial stages. Only NEDS has some type of leachate and landfill gas management. The sites are not operating to their full capacity in terms of environmental controls (see score for 2E.3). The aforementioned points are summarized in Table 2.
UBPUA oversees the operations of each disposal site. There have been significant improvements made in terms of some technical aspects; however, the sites are not managed according to high standards. The frontline operational staff lack technical training. Moreover, due to financial difficulties, the broken vehicles and machineries at the sites are not upgraded, routinely maintained or repaired (see score for 2E.5).
Currently, there are no waste-to-energy facilities in UB. However, a refuse-derived fuel (RDF) facility was constructed with the assistance of the Korea International Cooperation Agency (KOICA). The site was not approved by the state inspection agency after its construction, and currently operates as a sorting facility of apartment area waste.
The staff is provided with boots, gloves, overalls, and high visibility vests. Some types of safe operating procedures are in place and enforced. However, there have been no health checks or inoculations for the workers at these disposal sites. No effort has been made to consider the conditions of workers who are operating heavy machinery or work directly on the landfill sites under hazardous working conditions (hence the variable 2E.6 was scored low).
The evaluation for the benchmark indicators and their comprising variables for Environmental Control are shown in Table 3. The qualitative indicator (2E) received a score of 50%.

4.4. Resource Management

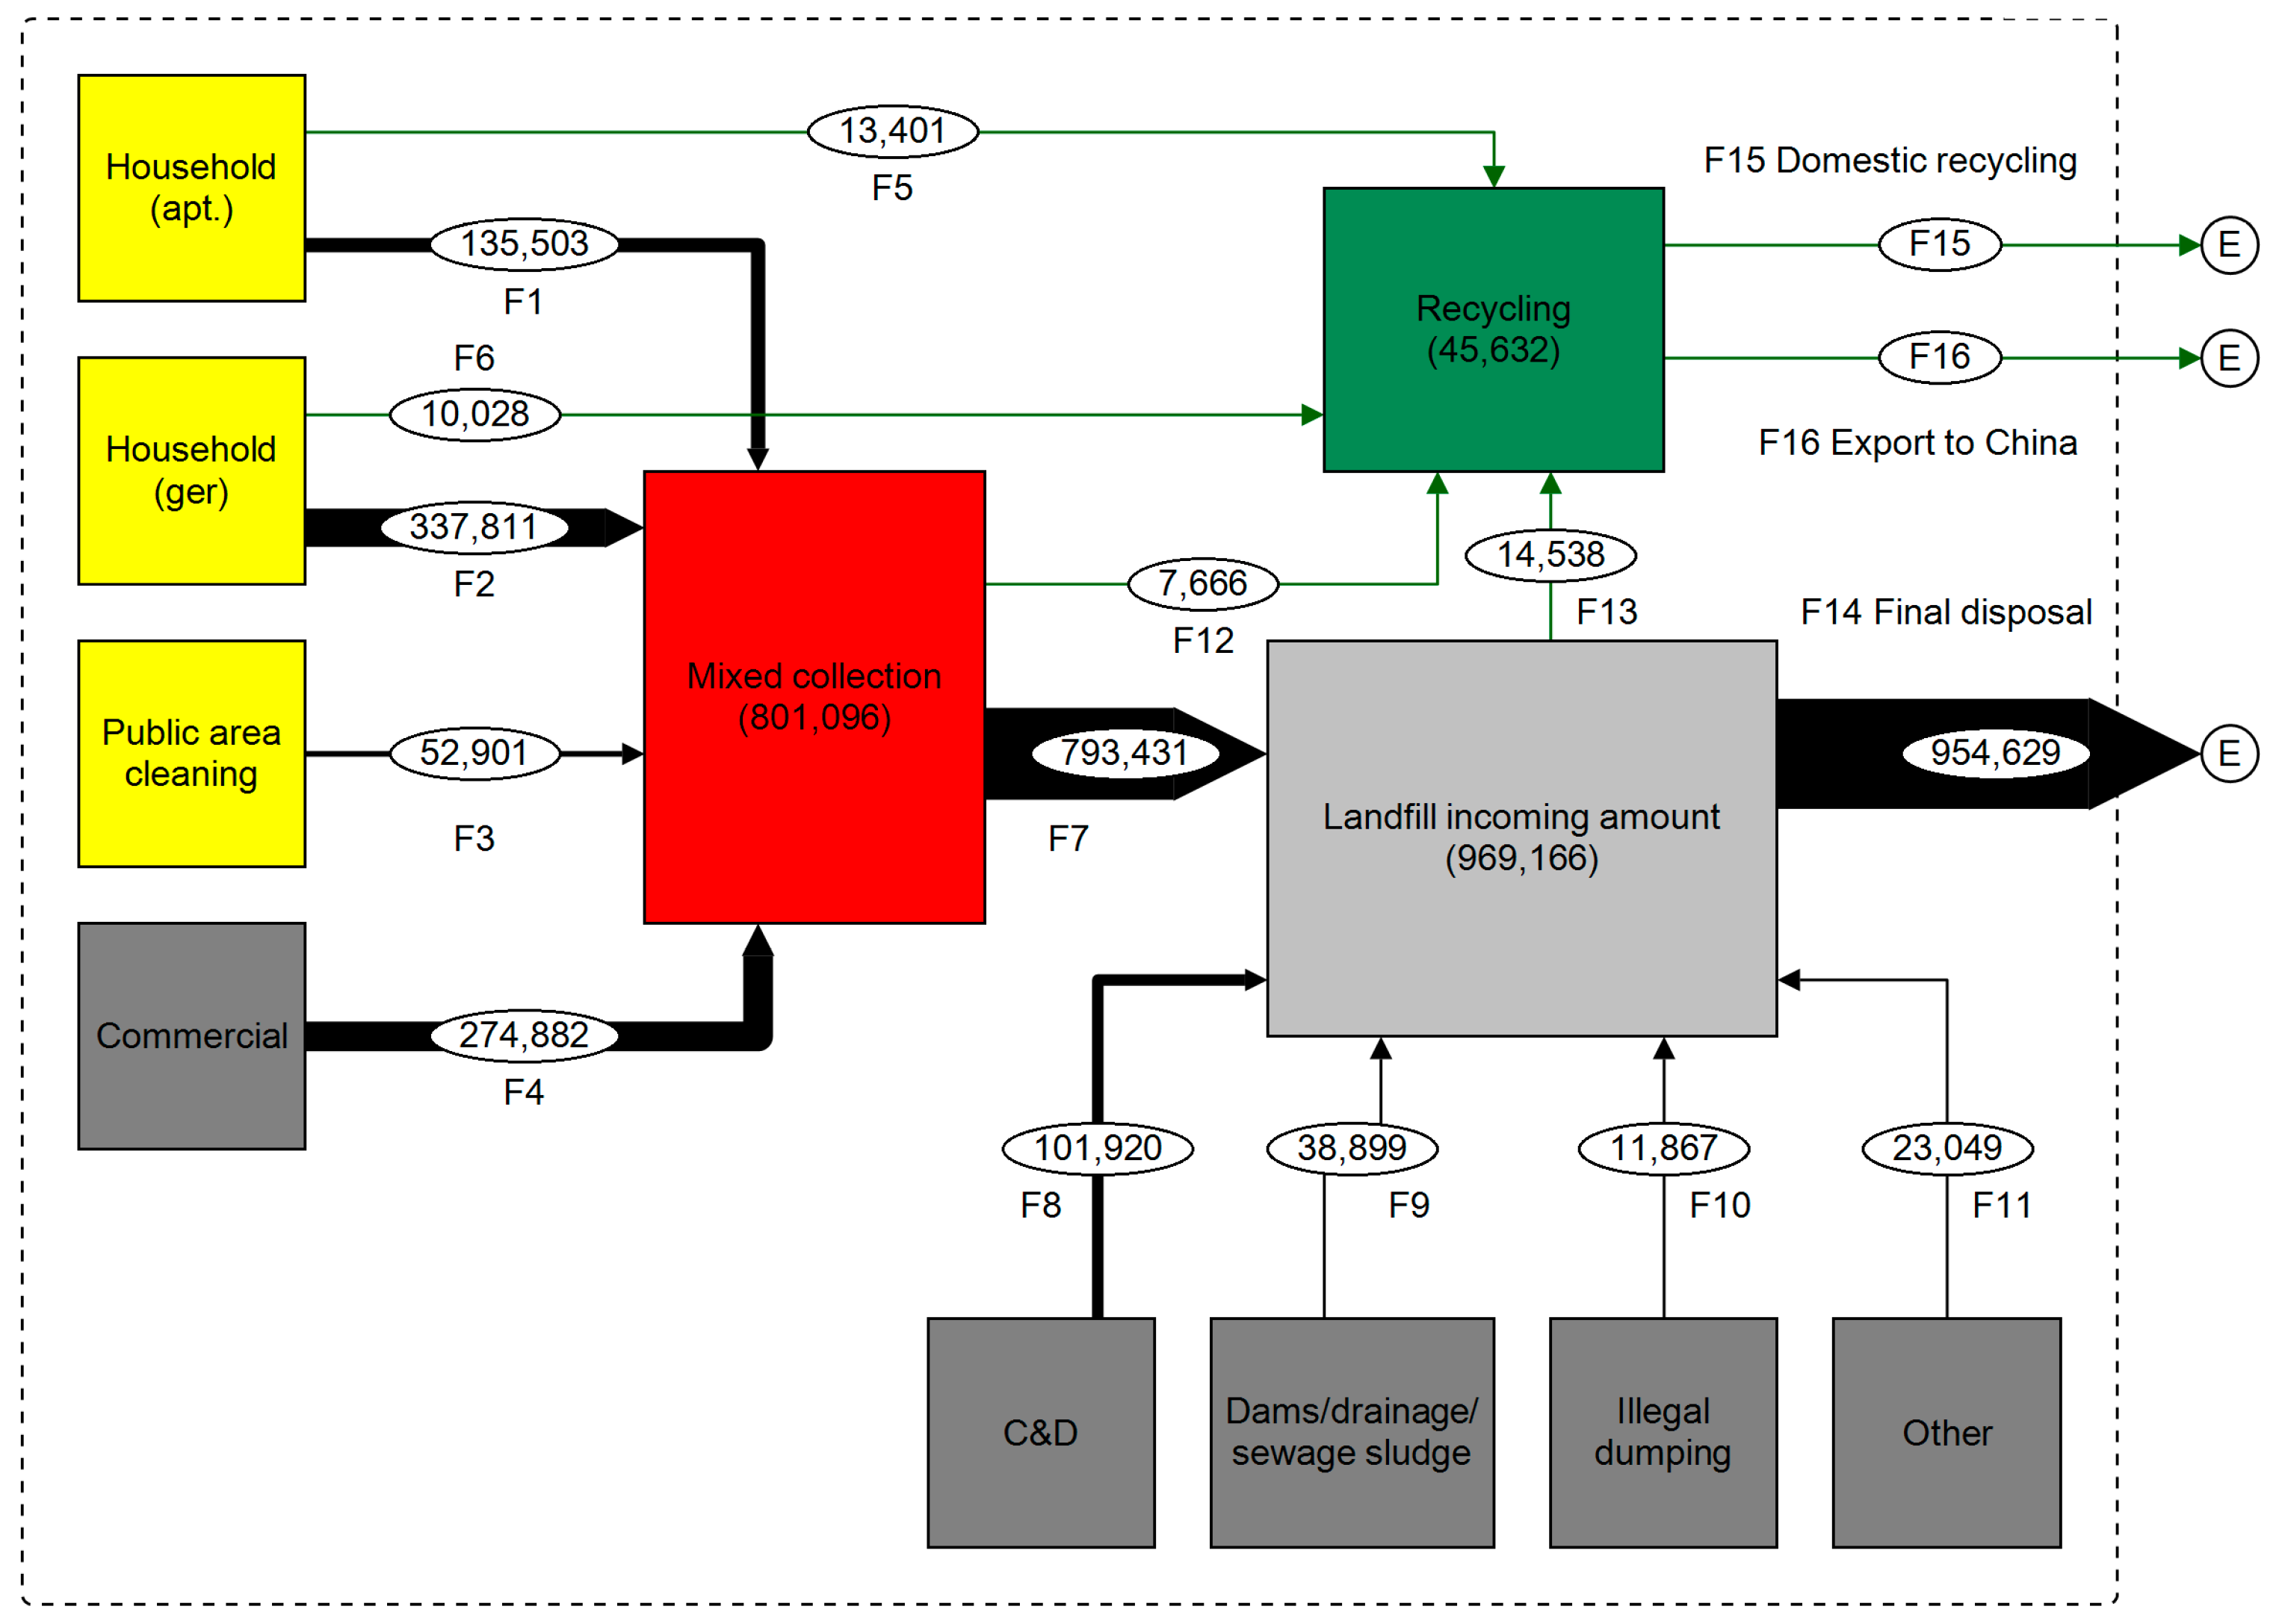
In order to give general understanding and visual representation of UB’s waste flow, an MFD was calculated and constructed (see Figure 6). According to JICA studies [24], recycling activities were identified at three stages, discharge, collection and disposal, and recycling rates were estimated. The provided estimates were applied on the 2015 weighbridge data (Figure 4).
Calculation:
Recycling amount at discharge (F5, F6 in Figure 6): According to JICA’s waste generation study, 9% of generated waste from apartment (26.5 g/person/day out of 294 g/person/day—extrapolated averages of summer and winter seasons) and 9.3% from ger areas (18 g/person/day out of 192 g/person/day, ash excluded) were extracted and sent to the recyclables’ market. (The ratio of ash to general waste from ger area was 69% to 31%, respectively).
Recycling amount at collection (F12): 1.3% of apartment and commercial waste, and 2% of ger area waste (ash excluded) was extracted by waste collection workers and entered the recyclables’ stream.
Recycling amount at disposal (F13): 1.15% of incoming waste to the landfill was being extracted by waste pickers and went into the recyclables’ market (1.3% in winter and 1% in summer).
Consequently, the waste generation amount and recyclables’ stream were calculated based on the above information. The recyclables are processed and recycled domestically (F15) or exported to China (F16). Other waste (F11) includes: industrial waste, hospital waste, secondary raw materials and waste from summer houses.
Based on the constructed MFD, 45,632 tonnes of recyclables, accounting for 5.5% of MSW and commercial waste, are extracted from the waste stream through the informal recycling sector and should be considered as the minimum recycling rate due to using recycling estimates of 2010–2011 [24]. According to unofficial sources, the recycling sector, namely the Mongolian National Recycling Association (MNRA), claims that the amount can go up to 30%. However, the data on informal recycling sector are quite rare and unreliable; there is no clear evidence for it. Therefore, more focus should be directed to researching recycling activities.
Recyclables are recovered at several points: by watchmen, apartment owners’ union workers, waste pickers and residents during discharge; MSW collection workers during the collection process; and by waste pickers during the disposal process and flow into recyclables’ market, which is mainly handled by the informal recycling sector.
Between 0 and 1% of recyclables are clean source-separated materials; all recycling is extracted from mixed wastes (see score for 3R.1). Currently, there are no widespread programs for waste separation at source. Citizens feel discouraged to separate waste due to mixed collection and the lack of recycling facilities. There is little or no separation of organic materials, except for the feeding of dogs with leftover food which is quite a common practice (see score for 3R.2). Ash is separated at source in winter in ger areas due to its sheer volume compared to summer months, when it is not segregated [36]. In winter, it is collected in metal drums or sacks, however, at the collection point, it is mixed with general waste.
Focus on waste reduction, reuse and recycling has been publicly discussed and reflected in the laws and bylaws especially during recent years. However, the implementation of these policies has been insufficient (see score for 3R.3). As pointed out in Section 4.1, waste generation amount per capita per day is over the threshold of 1 kg, which means waste reduction issue must be of equal importance to resource recovery.
The main body that represents the informal recycling sector is the MNRA that protects the rights of its members and acts as a lobbyist for influencing the law enforcement. Among the main members, there are 200 kiosks (itinerant waste buyers (IWB)), and 12 recycling facilities. One of their main activities is focused on organizing the kiosks and regulating the system of separation, collection and transportation of recyclables. Through the kiosks that deal with waste pickers, MNRA had plans to obtain relevant information and to reach out to those waste pickers. Currently, in collaboration with PSD, MNRA is working on a project called “Eco Park” at the NEDS and TsDDS, where recycling facilities will be concentrated and where they plan to create job opportunities for waste pickers. The main hurdles are financial resources and access to capital. Integration of the informal sector with the formal SWM system is still very low on the priorities (see score for 3R.4).
There are few recycling facilities in UB. The issue of environmental protection is rarely highlighted or physically monitored other than in paperwork. There is low compliance regarding actual environmental protection in recycling. Only a select number of facilities take extra caution in the occupational health and safety of their workers, such as Altan Orshikhui, a company that recycles used oil to make fuel, and recycles car tires and plastics. However, the rest of the industry, including the IWBs, waste pickers and recycling facilities, has low compliance regarding the occupational health and safety of their workers (see scores for 3R.5 and 3R.6).
The evaluation for the benchmark indicators and their comprising variables for Environmental Control is shown in Table 4. The aforementioned circumstances lead us to score the qualitative indicator (3R) at 25%. Data on the informal recycling sector are insufficient. Therefore, more attention should be given to this issue.

4.5. Governance

4.5.1. User Inclusivity

As described in Section 4.2 for Public Health, the two types of residential areas are quite distinct in terms of receiving waste collection services. Marginal areas, especially in the ger areas are facing more challenges due to the difficulty to access these services and the lack of a sufficient monitoring system (see score for 4U.1).
Authorities do have a legal obligation to consult with and involve citizens in decisions that directly affect them, especially in matters concerning landfill siting (see scores for 4U.2 and 4U.3). Feedback mechanism is in place, however the efficiency should be further investigated through public survey (see score for 4U.4).
At the district level, waste management departments are in charge of educational materials and awareness raising campaigns. TUKs are also in charge of creating awareness raising programs and educating the citizens of their corresponding districts. The municipality is in charge of initiating and monitoring educational programs and awareness raising activities. However, the interviews conducted with key personnel of the waste sector, including public inspectors and local government workers; reveal that citizens’ mentality and behaviour are the most difficult challenges. It also indicates that there is no systematic educational and awareness raising programs, which need to be developed based on thorough research (see score for 4U.5).
Developing countries are faced with massive rural to urban migration, in low levels of law enforcement, lack of adequate planning and promoting and measuring behavioural change [8]. As a result, citizens’ attitude and behaviour patterns become one of the biggest challenges when dealing with waste management, taking into consideration that citizens are a crucial part of the system itself. This example has been observed in UB. However, in recent years there have been efforts to raise the consciousness of the community through introducing a new term for recyclables, dakhivar, and placing waste bins that segregate recyclables and non. This kind of change could be researched through public questionnaire and improve further behaviour change initiatives (see score for 4U.6). The score for User Inclusivity (4U) is 54% (Table 5).

4.5.2. Provider Inclusivity

The current system enables both public and private sectors to deliver stable SWM services. There are currently 10 local government owned enterprises (LGOE) and seven private waste collection companies operating in UB. All companies are treated fairly based on the procurement laws and procedures of the government in order to achieve a high degree of openness, transparency and accountability (see scores for 4P.1, 4P.2, 4P.4 and 4P.5).
MNRA is the main body that represents the informal sector including IWBs, private recycling facilities and waste pickers. However, waste pickers are not yet directly benefitting from their activities, although it is envisioned to allow for the inclusion of waste pickers. Currently, the purpose is solely on strengthening the structure of the association and organizing the kiosks. The informal sector is dominantly in charge of extracting recyclable materials in the waste stream from discharge to the disposal sites. Currently, there are no municipal recycling programs. However, the informal sector should be carefully factored into the equation when creating national and municipal recycling plans (see score for 4P.3). The score for Provider Inclusivity (4P) is 55% (Table 6).

4.5.3. Financial Sustainability

The MSWM service, excluding the maintenance of disposal sites, is covered by the citizens’ waste service tax fee and additional government subsidy. Waste collection TUKs are in charge of collecting, transporting and disposing waste at disposal sites. They then get paid according to their implementation. The disposal site activities and finances are fully covered by the municipality.
The current budget covers most current operating costs, but insufficient for most of the maintenance costs. As mentioned in Section 4.2 and Section 4.3 , there are many aspects that need to be improved, from waste collection in the ger areas to technical improvement of TUKs and disposal sites (see scores for 5F.1, 5F.2 and 5F.5). Moreover, access to capital for investment remains to be one of the biggest challenges for UB’s SWM (see score for 5F.6).
Since January 2013, the waste service fee is collected in a form of tax and consolidated at the district taxation office. In 2014, the waste service fee payment rate in the apartment area was 81.2%, and in ger area was 57% (see score for 5F.3). While the total number of business entities and organizations in operation was 26,598, 17,132 were in contractual agreements with TUKs with a service fee payment rate of 90%. Currently, citizens in apartment areas are paying 2000 Mongolian tugriks (US $1.02), and citizens in ger areas are paying 2500 tugriks (US $1.27), which were set back in 2006 in the ordinance 182 by the municipality and have not changed since (see score for 5F.4). The price is higher in ger areas due to collection service requiring more resources in these areas as mentioned in Section 4.2. However, there are more economically vulnerable citizens residing in the marginal areas of ger districts, and there is no exemption or subsidy for users who can least afford to pay, which should be subject to consideration. In terms of business entities and organizations, each district has their own set tariffs based on the size and type of businesses and organizations.
The waste service fee collection method differs in both ger and apartment areas. In ger areas, the waste service fee is paid together with the electricity bill since July 2011 by electric distribution company (formerly done by TUKs) and 23% of the fee is taken as a transaction fee. With this new method of charging waste service fee with electricity bill, the waste fee collection rate increased from 28% in July 2011 to 57% in 2014. However, it must be noted that the transaction fee of 23% is deducted from the total amount. In ger areas, inside a single khashaa (fence), 2–3 households reside, of which only one household pays waste service fee. In such circumstances, waste service fee collectors gather money from these households, and 23% of the service fee is given as a reward. Plus, the transient population [22] of the ger areas are not considered in calculating the generation of waste, which remains an uncertainty.
In apartment areas, the service fee is paid together with the utility bills and 6% of the fee is taken as a transaction fee by UB Housing Public Services Company. The score for Financial Sustainability (5F) is 46% (Table 7).

4.5.4. Sound Institutions, Proactive Policies: National Framework

The Mongolian Law on Waste Management (2012) addresses solid waste management requirements, based upon which the municipal “Regulation on funding of waste management and transportation operations and consolidation of waste management service fee” (2015) was enacted. However, the above law was insufficient to regulate the complex issues arising from various waste related aspects. In the beginning of 2017, the process of enactment of the new law formulation began after being once returned back to the Parliament in 2016 (see score for 6N.1).
There are several national plans and strategies towards green and sustainable development. Concepts of Mongolian Sustainable Development 2030 were approved by provision of State Great Khural on 19 February 2016. Green Development Policy was approved on 13 June 2014, which includes targets of decreasing the amount of waste going to landfill by 40% and increasing recycling rate up to 40% (see score for 6N.2). However, these goals should be realistic and actionable with a clear pathway to achieving them. Mostly, these goals are set based on insufficient research, data and information.
There are guidelines for local authorities implementing the laws and strategies; however, the current approaches to solving MSW related issues are not holistic enough. The baseline study for all the targets are insufficient, and oftentimes do not reflect the real picture, which in turn hinders the achievement of these goals and targets. The Ministry of Environment, Green Development and Tourism is the national institution responsible for making policies however they are not responsible for the implementation process and its coordination. The implementation of the regulations is undertaken by the municipal government (see scores for 6N.3, 6N.4 and 6N.5).
No effort has been made in implementing the extended producer responsibility (EPR) or Product Stewardship (PS). This issue has been discussed in some ways by introducing an added import tax on products that cannot be reused. However, this issue is no longer being discussed (see score for 6N.6). On the other hand, the informal sector through their involvement in the “Eco-Park” wants to create job opportunities for waste pickers as a form of corporate social responsibility (CSR). Based on these facts, the score for the qualitative indicator (6N) is 46% (Table 8).

4.5.5. Sound Institutions, Proactive Policies: Local Institutional Policies

Within the municipality, the Public Service Department (PSD) at the Mayor’s Office is responsible for ensuring that SWM services are planned, delivered and funded. The municipality funds the SWM’s collection and transportation services through subsidies, and fully funds the disposal and disposal site’s maintenance.
In terms of institutional capacity, JICA’s project on “Strengthening the capacity for SWM” [24] was one of the most significant contributions towards effective training, in both the classroom and the field. The PSD consists of the following members: head of the department; and officers responsible for landscaping, assets and signs in public areas, greenery, architectural and landscape drawings, advertisement and information facilities, waste, construction and industrial waste, waste recycling plants and waste collections points, and medical and hazardous waste, with four out of nine officers being directly in charge of waste related matters (see scores for 6L.1 and 6L.2).
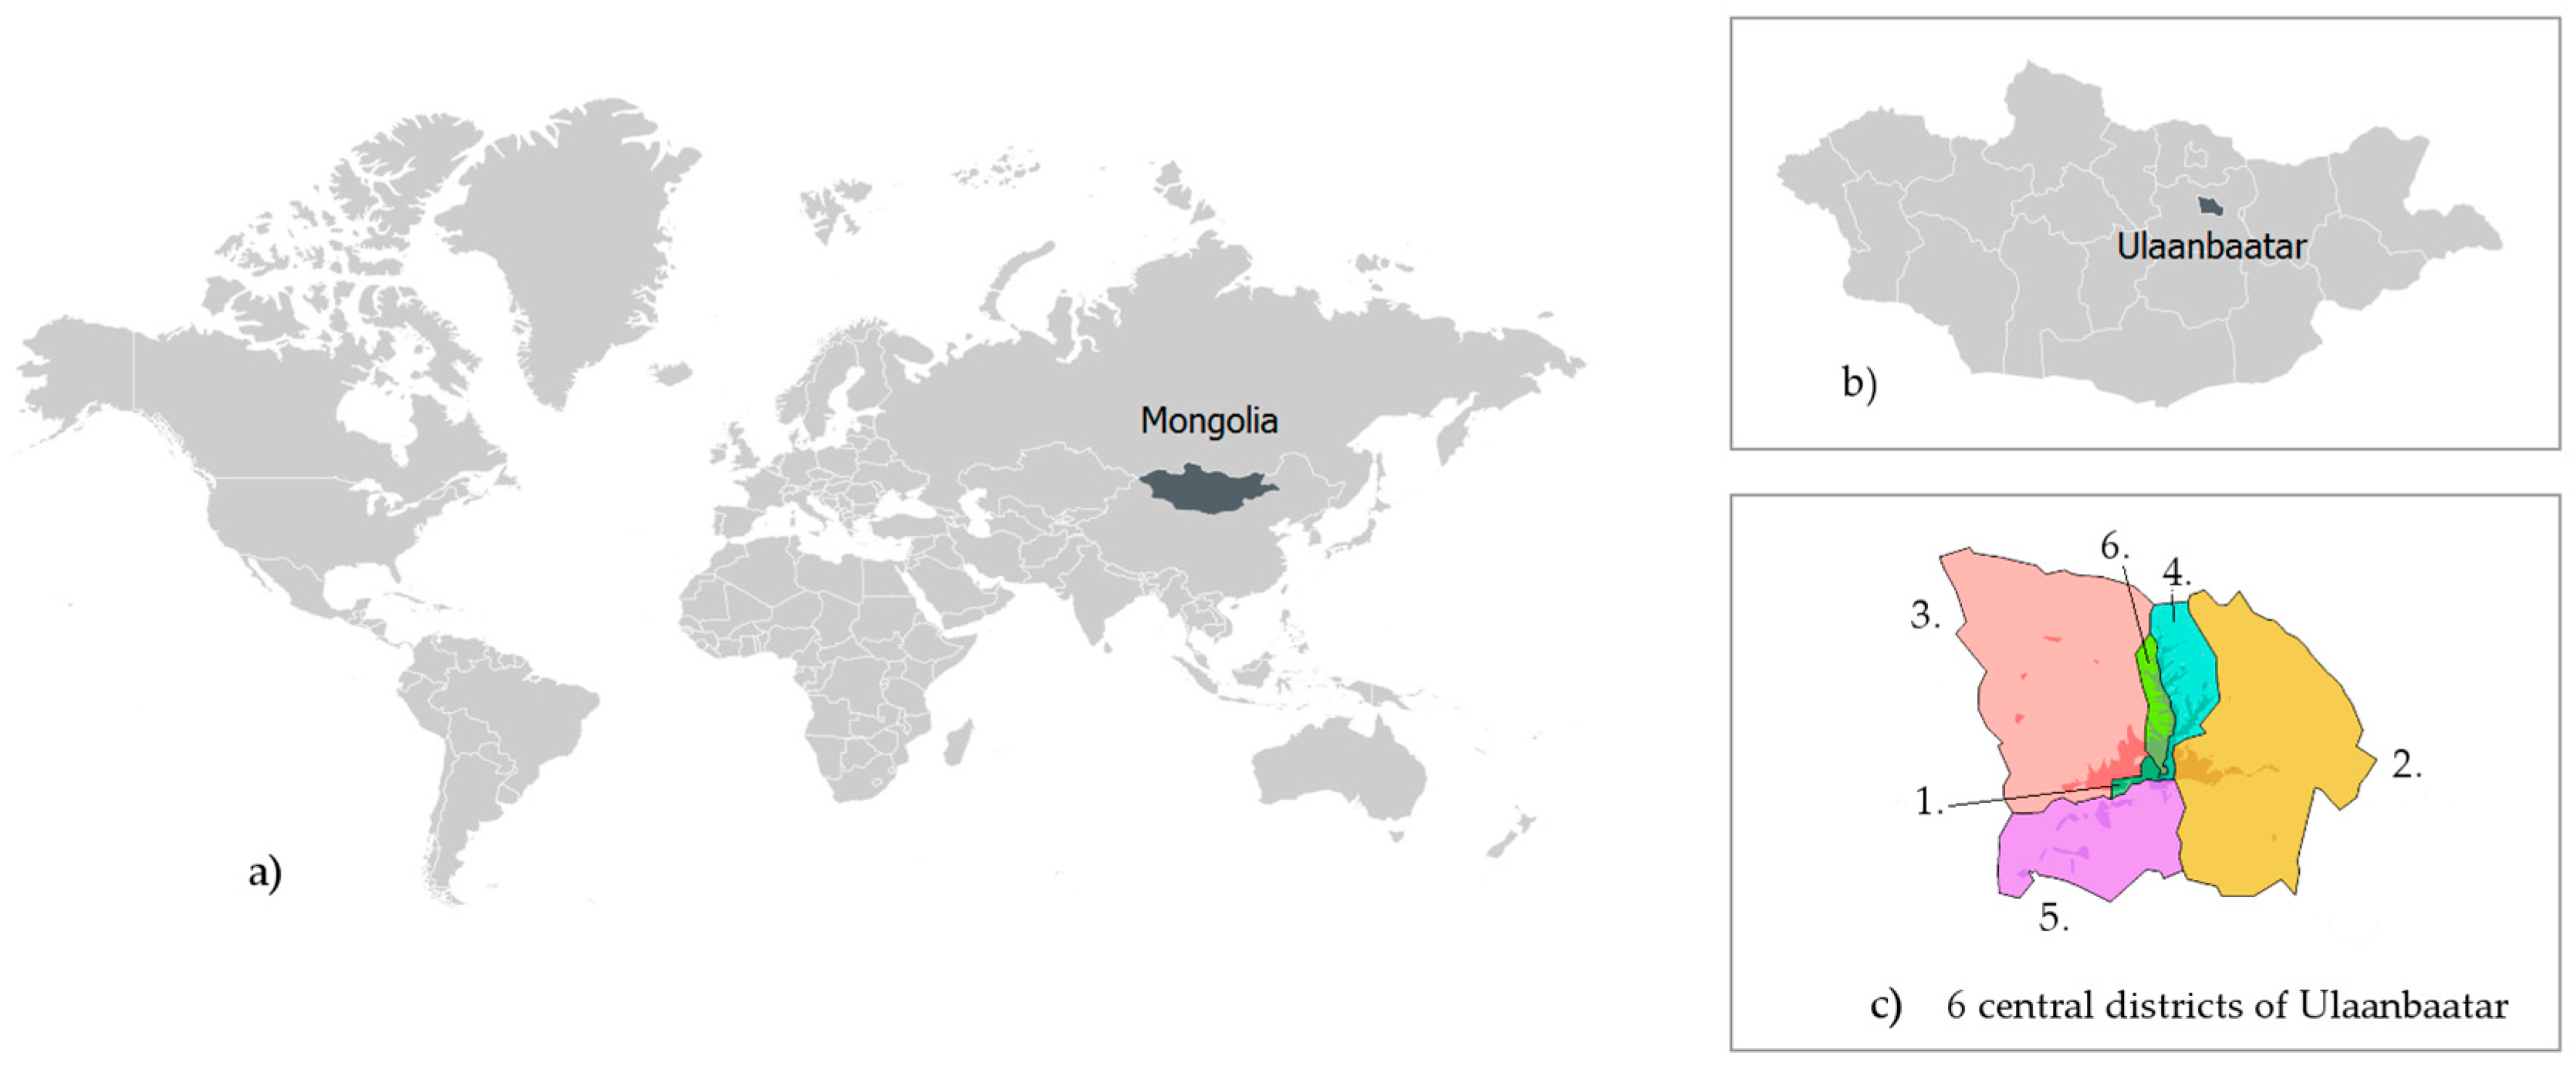
The citywide SWM strategy and plans are improving but are not adequate enough. The national strategy is not clearly translated to regional (city, district, community) levels. In the six central districts of the municipality, both public and private sectors are present. The collection companies hold contractual agreements with the district governors. All the waste collection companies work closely with the PSD and attend meetings and seminars regarding waste service requirements. Since 2015, the auditor NGOs started monitoring the work implementation of waste collection companies in collaboration with citizen’s groups. There were three auditor NGOs for the six central districts. Each NGO consists of 2–3 staff members that conduct daily inspections. In terms of efficiency, 2–3 staffs cannot check all the areas. There could be more effective ways of monitoring, for instance leveraging the power of the public (see scores for 6L.3 and 6L.5).
In terms of availability and quality of data, there has been improvement especially since installing the weighbridges. However, there is an urgent need for more quality data and improving data collection and reporting methods (see score for 6L.4).
The municipal government works very closely with the districts and the districts are also well-connected. UB is a unique city within Mongolia, as it is the capital city that is home to more than one third of the country’s population. However, in recent years, the situation of SWM is becoming an increasing issue in other cities as well as in the rural areas. As a result, inter-regional and inter-municipal cooperation needs to be strengthened to enable capacity building and knowledge sharing. Currently, the flow of recyclables from rural areas also should be studied closely (see score for 6L.6). For the above reasons, the score for the qualitative indicator (6L) is 58% (Table 9).

5. Discussion

The MSWM of UB was assessed using the “Wasteaware” benchmark indicators and the results were compared to four cities of various income levels [16]. Data for SWM is very rare and oftentimes unreliable; this holds especially true for developing countries. However, in this assessment, the best possible data with reliable sources were used to mark the current baseline. This in turn works as a solid foundation for further quality research studies to be conducted.
In Table 10 and Figure 7, a summary of the benchmark indicators’ results are shown and compared with four cities of each income level according to the World Bank’s country classification based on GNI per capita [17]. The cities are: Monrovia (Liberia), low income; Lahore (Pakistan), lower-middle income; Guadalajara (Mexico), upper-middle income; and Belfast (UK, Northern Ireland), high income levels. Mongolia is considered a lower-middle-income country.
Waste generation was 408.8 kg per capita per year equivalent to 1.12 kg per capita per day (which is the minimum amount), meaning the amount of waste generated falls above the threshold of 1 kg per person per day and into the category of a “higher waste generating” city [16]. This means that the issue of waste minimization should also be taken critically as well as waste recycling. For waste composition, the content of organic waste was the lowest among the other four cities as well as the comparison results to the averages of countries from all income levels (see Section 4.1) and can be attributed to the levels of high-income countries. The content of paper and metals were in the normal lower range, the content of plastics in the normal higher range. However, the amount of bottles and glass was significantly higher than the averages of other cities. The amount of recyclables including paper, plastic, metal, bottles and glass accounted for roughly half of the total waste amount. This can be explained by the fact that due to UB’s climate there are less seasonal fresh fruits and vegetables resulting in a large amount of imported consumer goods and products and their packaging. There needs to be more effort in conducting a detailed and up-to date waste composition study as well as research on waste flow. The basic data on waste generation and waste composition are the most important components for MSWM planning and plays special role in educating the stakeholders. Therefore, such type of research should be a priority.
UB’s results for benchmark indicators show that in terms of Public Health, Environmental Control and Institutional Aspects, UB has surpassed the levels of low- and lower-income countries and satisfied the prerequisites for modernizing its waste management system. However, there are still some major steps ahead in order to fully transition. The highest performing indicators, (1.1) Waste collection coverage and (2) Controlled treatment and disposal, and are consistent with the projects of JICA and Asia Foundation that have been directed to improving SWM. However, the “quality” indicators for Public health (1C) and Environmental control (2E) reveal that there is room for improvement. Quality service provision should be extended to the marginal areas by setting a collection frequency of at least twice a month in ger areas. In terms of Inclusivity, certain progress has been made for Provider Inclusivity (4P) in the formal SWM sector; however, there is still more needs to be done for the informal sector inclusivity. Additionally, users (4U) are an integral part of the system and programs related to behaviour change and awareness raising should be conducted in a systematic manner.
The lowest scoring indicators are (3) Recycling rate and (3R) Quality of 3Rs provision, which implies the urgent need for quality data on recycling activities and research; as the country declared its plans and strategies towards green and sustainable development. The informal sector should be considered carefully when introducing recycling programs. Moreover, they have the expertise and knowledge on the waste composition and materials that are recyclables. Therefore, the existing informal sector recycling should be utilized and integrated into the formal waste management system. Thus, it requires extensive research on this point.
Financial Sustainability (5F) scored average within the same range as other developing countries, since the lack of financial instruments is one of the biggest bottlenecks in these countries. Therefore, international influence and involvement account for the greater portion of the investment in SWM. However, to have successful projects and collaborations, first and foremost specific needs of local communities should be met and prioritized in accordance with the local features. The example of KOICA’s RDF facility is an example of not complying with the local needs and not considering the impact of the facility on the system as a whole, although the site is now used as a material sorting facility. This in turn implies that local municipalities and government (6N, 6L) officials need to be knowledgeable about the problems at hand and recognize the areas with the most favourable outcomes and significant impacts on the system. Policies and strategies need to be realistic based on sufficient research and data; moreover, prioritizing smaller goals on a consistent basis is far more effective. Clear roles and responsibilities of stakeholders should be further elucidated, as well as engaging all stakeholders in the decision-making process.

6. Conclusions

The current state of SWM varies greatly in developed and developing countries. There are several factors for such discrepancies. The problem of waste is more complex in developing countries, due to their current socio-economic and cultural distinctions, lack of financial resources, capacity of municipal and local governments and the public’s attitude. Systems perspective can help construct the situation in developing countries by taking into account all present complexities.
Among the complexities that are faced by UB, as well as other developing countries, lack of data and lack of appropriate data collection is the foremost critical issue that needs to be tackled. Reliable and up-to-date data are the cornerstone for further progress, which in turn demands improved data collection and reporting. These include waste generation; waste composition (by households and other sources coming to landfill sites); other properties (such as waste moisture, density and calorific value); and waste flow taking into account recycling at various stages that is conducted by the informal recycling sector. The results reveal that the percentage of recyclables is high (mostly extracted by informal sector waste pickers, whose roles and contributions are rarely noted). By utilizing all the recyclables and building on the existing informal sector recycling activities, UB has a great potential of becoming resource efficient while eliminating the negative impact of waste on human health and the environment.
Behavioural change and raising awareness must go hand in hand with the targets set for sustainable and green development goals by guiding the public with clear and actionable steps. Without knowing the impact of their actions, the public is less motivated and less likely to respond to any new policies and programs. Therefore, presenting the public with educational programs that reflect the current situation of waste in a holistic way (i.e., the actual waste composition of a household and its impacts) can help to create a shift towards achieving behavioural change. Nonetheless, engagement of all stakeholders is required in order to make further progress in the modernization of waste management.
Our study brought significant contributions by filling the existing literature gaps for UB and identified its key strengths and areas for improvement. “Wasteaware” benchmark indicators are accompanied by a material flow diagram (MFD). However, due to uncertainties in waste flow and insufficient data on recycling aspects, the MFD was constructed based on the available data. It is recommended to address these limitations in future research.

Acknowledgments

The authors would like to thank the anonymous reviewers for their constructive comments and suggestions that helped improve the quality of the paper. The authors would also like to thank the Public Service Department of Ulaanbaatar for their cooperation and all of the interviewees that contributed tremendously to the research, including TUK workers, landfill site staff, district officers, UBPUA staff, public inspectors, MNRA heads and members, the Asia Foundation and other NGOs.

Author Contributions

Bolorchimeg Byamba conceived and designed the research. Mamoru Ishikawa supervised the research. Bolorchimeg Byamba conducted the fieldwork and analysed the data. Bolorchimeg Byamba drafted the manuscript while Mamoru Ishikawa reviewed it.

Conflicts of Interest

The authors declare no conflict of interest.

References

  1. Wilson, D.C. Global Waste Management Outlook (GWMO); UNEP DTIE International Environmental Technology Centre: Osaka, Japan, 2015. [Google Scholar]
  2. Hoornweg, D.; Bhada-Tata, P.; Kennedy, C. Waste production must peak this century. Nature 2013, 502, 615–617. [Google Scholar] [CrossRef] [PubMed]
  3. Marshall, R.E.; Farahbakhsh, K. Systems approaches to integrated solid waste management in developing countries. Waste Manag. 2013, 33, 988–1003. [Google Scholar] [CrossRef] [PubMed]
  4. Scheinberg, A.; Wilson, D.C.; Rodic, L.W. Solid Waste Management in the World’s Cities; UN-HABITAT: Nairobi, Kenya, 2010. [Google Scholar]
  5. Wilson, D.C. Development drivers for waste management. Waste Manag. Res. 2007, 25, 198–207. [Google Scholar] [CrossRef] [PubMed]
  6. Guerrero, L.A.; Maas, G.; Hogland, W. Solid waste management challenges for cities in developing countries. Waste Manag. 2013, 33, 220–232. [Google Scholar] [CrossRef] [PubMed]
  7. Al Sabbagh, M.K.; Velis, C.A.; Wilson, D.C.; Cheeseman, C.R. Resource management performance in Bahrain: A systematic analysis of municipal waste management, secondary material flows and organizational aspects. Waste Manag. Res. 2012, 30, 813–824. [Google Scholar] [CrossRef] [PubMed]
  8. Vergara, S.E.; Tchobanoglous, G. Municipal solid waste and the environment: A global perspective. Ann. Rev. Environ. Resour. 2012, 37, 277–309. [Google Scholar] [CrossRef]
  9. Chen, X.; Geng, Y.; Fujita, T. An overview of municipal solid waste management in China. Waste Manag. 2010, 30, 716–724. [Google Scholar] [CrossRef] [PubMed]
  10. Mongolian Statistical Information Service. Population of Mongolia. 2015. Available online: http://www.1212.mn/statHtml/statHtml.do?orgId=976&tblId=DT_NSO_0300_001V2&conn_path=I3 (accessed on 22 August 2016).
  11. Statistics Department of Ulaanbaatar. Population by Khoroo. 2015. Available online: http://ubstat.mn/JobTables.aspx (accessed on 6 June 2016).
  12. Altantuya, D.; Zhang, Z.; Li, H. Municipal solid waste management of Mongolia: Analysis on the solid waste treatment of Ulaanbaatar city. Adv. Asian Soc. Sci. 2012, 3, 695–697. [Google Scholar]
  13. Delgermaa, G.; Matsumoto, T. A Study of Waste Management of Households in Ulaanbaatar Based on Questionnaire Surveys. Int. J. Environ. Sci. Dev. 2016, 7, 368–371. Available online: http://www.ijesd.org/show-79-1169-1.html (accessed on 17 October 2016). [CrossRef]
  14. Batkhuyag, E.U.; Sekito, T.; Tuuguu, E.; Dote, Y. Characteristics of Household Waste and Coal Ash in Ulaanbaatar, Mongolia. In Proceedings of the 27th Annual Conference of Japan Society of Material Cycle and Waste Management, Wakayama, Japan, 27–29 September 2016. [Google Scholar]
  15. Chang, N.B.; Pires, A.; Martinho, G. Empowering systems analysis for solid waste management: Challenges, trends, and perspectives. Crit. Rev. Environ. Sci. Technol. 2011, 41, 1449–1530. [Google Scholar] [CrossRef]
  16. Wilson, D.C.; Rodic, L.; Cowing, M.J.; Velis, C.A.; Whiteman, A.D.; Scheinberg, A.; Vilches, R.; Masterson, D.; Stretz, J.; Oelz, B. ‘Wasteaware’ benchmark indicators for integrated sustainable waste management in cities. Waste Manag. 2015, 35, 329–342. [Google Scholar] [CrossRef] [PubMed]
  17. World Bank. New Country Classifications by Income Level. 2016. Available online: http://blogs.worldbank.org/opendata/new-country-classifications-2016 (accessed on 17 April 2016).
  18. World Bank. New Country Classifications. 2015. Available online: http://blogs.worldbank.org/opendata/new-country-classifications (accessed on 17 April 2016).
  19. Byambadorj, T.; Amati, M.; Ruming, K.J. Twenty-first century nomadic city: Ger districts and barriers to the implementation of the Ulaanbaatar City Master Plan. Asia Pac. Viewp. 2011, 52, 165–177. [Google Scholar] [CrossRef]
  20. Uddin, S.M.N.; Li, Z.; Gaillard, J.; Tedoff, P.F.; Mang, H.P.; Lapegue, J.; Huba, E.M.; Kummel, O.; Rheinstein, E. Exposure to WASH-borne hazards: A scoping study on peri-urban Ger areas in Ulaanbaatar, Mongolia. Habitat Int. 2014, 44, 403–411. [Google Scholar] [CrossRef]
  21. Amarsaikhan, D.; Blotevogel, H.; Ganzorig, M.; Moon, T.H. Applications of remote sensing and geographic information systems for urban land-cover change studies in Mongolia. Geocarto Int. 2009, 24, 257–271. [Google Scholar] [CrossRef]
  22. Kawai, K.; Tasaki, T. Revisiting estimates of municipal solid waste generation per capita and their reliability. J. Mater. Cycles Waste Manag. 2016, 18, 1–13. [Google Scholar] [CrossRef]
  23. JICA. The Study on Solid Waste Management Plan for Ulaanbaatar City in Mongolia; Final Report; Kokusai Kogyo Co.: Ulaanbaatar City, Mongolia, 2007. [Google Scholar]
  24. JICA. Strengthening the Capacity for Solid Waste Management in Ulaanbaatar City; Final Report; Project Team for SWM in Ulaanbaatar City: Ulaanbaatar City, Mongolia, 2012. [Google Scholar]
  25. Wilson, D.C.; Rodic, L.; Scheinberg, A.; Velis, C.A.; Alabaster, G. Comparative analysis of solid waste management in 20 cities. Waste Manag. Res. 2012, 30, 237–254. [Google Scholar] [CrossRef] [PubMed]
  26. Sim, N.M.; Wilson, D.C.; Velis, C.A.; Smith, S.R. Waste management and recycling in the former Soviet Union: The City of Bishkek, Kyrgyz Republic (Kyrgyzstan). Waste Manag. Res. 2013, 31, 106–125. [Google Scholar] [CrossRef] [PubMed]
  27. Masood, M.; Barlow, C.Y.; Wilson, D.C. An assessment of the current municipal solid waste management system in Lahore, Pakistan. Waste Manag. Res. 2014, 32, 834–847. [Google Scholar] [CrossRef] [PubMed]
  28. Likert, R. A technique for the measurement of attitudes. Arch. Psychol. 1932, 22, 5–55. [Google Scholar]
  29. Carifio, J.; Perla, R. Resolving the 50-year debate around using and misusing Likert scales. Med. Educ. 2008, 42, 1150–1152. [Google Scholar] [CrossRef] [PubMed]
  30. Beigl, P.; Lebersorger, S.; Salhofer, S. Modelling municipal solid waste generation: A review. Waste Manag. 2008, 28, 200–214. [Google Scholar] [CrossRef] [PubMed]
  31. JICA. Strengthening the Capacity for Solid Waste Management in Ulaanbaatar City; Progress Report No. 4; Project Team for SWM in Ulaanbaatar City: Ulaanbaatar City, Mongolia, 2011. [Google Scholar]
  32. JICA. Strengthening the Capacity for Solid Waste Management in Ulaanbaatar City; Progress Report No. 5; Project Team for SWM in Ulaanbaatar City: Ulaanbaatar City, Mongolia, 2011. [Google Scholar]
  33. Cencic, O.; Rechberger, H. Material flow analysis with software STAN. J. Environ. Eng. Manag. 2008, 18, 3–7. [Google Scholar]
  34. Link Engine LLC. Annual performance report of landfill sites. Ulaanbaatar, Mongolia, Unpublished work. 2015. [Google Scholar]
  35. The Asia Foundation. Improving Solid Waste Management in Ulaanbaatar. 2015. Available online: http://asiafoundation.org/2015/05/27/improving-solid-waste-management-in-ulaanbaatar/ (accessed on 10 June 2016).
  36. Kamata, T.; Reichert, J.; Tsevegmid, T.; Kim, Y.; Sedgewick, B. Managing Urban Expansion in Mongolia: Best Practices in Scenario-Based Urban Planning; World Bank Publications: Washington, DC, USA, 2010. [Google Scholar]
Figure 1. (a) Mongolia is a landlocked country situated in East Asia; (b) Ulaanbaatar (UB) is the capital city; (c) UB consists of six central districts: 1, Bayangol; 2, Bayanzurkh; 3, Songinokhairkhan; 4, Sukhbaatar; 5, Khan-Uul; and 6, Chingeltei.
Sustainability 09 00896 g001
Figure 2. Population growth of UB from 2004–2015 (data obtained from [11]).
Sustainability 09 00896 g002
Figure 3. Population growth rate of UB from 2004–2015 (data obtained from [11]).
Sustainability 09 00896 g003
Figure 4. Weighbridge data of 2015 (Other waste includes: industrial waste, hospital waste, secondary raw materials and waste from summer houses; data from Link Engine LLC [34]).
Sustainability 09 00896 g004
Figure 5. Waste composition comparison of Ulaanbaatar with averages of various income level countries [1] (data for household waste composition study 2010–2011 [31,32]).
Sustainability 09 00896 g005
Figure 6. Sankey type material flow diagram (MFD) for municipal solid waste (MSW) in Ulaanbaatar, 2015. All flows are estimates in t year−1. The landfill incoming amount data are weighbridge data obtained from three landfill sites. The recycling rates were calculated based on JICA studies [24].
Sustainability 09 00896 g006
Figure 7. Summary of results for benchmark indicators of: (left) Ulaanbaatar; and UB compared to low and lower-middle-income (middle); and upper-middle- and high-income countries [8] (right).
Sustainability 09 00896 g007
Table 1. Assessment of public health, including two quantitative (1.1, 1.2) and one qualitative (1C) benchmark indicators.
No.Short NameScoreObservations
1.1Waste collection coverage92.5%
1.2Waste captured by the SWM system85%
1C.1Appearance of waste collection points10Medium incidence of littering was seen
1C.1Effectiveness of street cleaning15Low incidence of littering was seen
1C.3Effectiveness of collection in low-income districts5High incidence of littering was seen
1C.4Efficiency and effectiveness of waste transport10Medium compliance
1C.5Appropriateness of service planning and monitoring 10Medium compliance
1C.6Health and safety of collection workers10Medium compliance
1CQuality of waste collection and street cleaning service 50%
(Total score—normalised)
Table 2. General information on the three disposal sites of Ulaanbaatar.
DescriptionNEDSMDDSTsDDS
Amount of waste received in 201547%12%37%
Reception and general site management
Vehicular access (paved roads)
Traffic management
Site security
Waste reception and record keeping
Waste unloading
Control over nuisance
Control of fires
Waste treatment and disposalMedium/High (Engineered facility)Medium (Controlled facility)Medium (Controlled facility)
Degree of monitoring and verification of environmental controls
Environmental Impact Assessment±±
Incoming waste volume, weights and categories
Waste composition and related properties
Control of odour, emissions (GHG)
Ground and surface water control
Leachate and landfill gas
√ indicates that there are practices in place; – indicates absence of practices or very low quality and inadequate standards; and ± indicates there are records although have not been updated.
Table 3. Assessment of environmental control, including one quantitative (2) and one qualitative (2E) benchmark indicators.
No.Short NameScoreObservations
2Controlled treatment or disposal (%)100%
2E.1Degree of control over waste reception and general site management15Medium/High level of control
2E.2Degree of control over waste treatment and disposal10Medium (Controlled facility)
2E.3Degree of monitoring and verification of environmental controls10Medium compliance
2E.4Efficiency of energy generation and use (Used for energy recovery facilities only)NA
2E.5Degree of technical competence in the planning, management and operation of treatment and disposal10Medium compliance
2E.6Occupational health and safety5Low compliance
2EDegree of environmental protection in waste treatment and disposal 50%
(Total score—normalised)
Table 4. Assessment of resource value, including one quantitative (3) and one qualitative (3R) benchmark indicators.
No.Short NameScoreObservations
3Recycling rate (%)5.5%
3R.1Source separation of “dry recyclables”0All recycling is extracted from mixed waste
3R.2Quality of recycled organic materials0Little or no separation
3R.3Focus on the top levels of the waste hierarchy10Medium focus
3R.4Integration of the community and/or informal recycling sector (IRS) with the formal solid waste management system5Low focus
3R.5Environmental protection in recycling5Low compliance
3R.6Occupational health and safety5Low compliance
3RQuality of 3Rs—reduce, reuse, recycle—provision21%
(Total score—normalised)
Table 5. Qualitative assessment of benchmark indicator (4U) for user inclusivity.
No.Short NameScoreObservations
4U.1Equity of service provision10Medium compliance
4U.2The right to be heard15Medium/High compliance
4U.3Level of public involvement10Medium compliance
4U.4Public feedback mechanisms10Medium compliance
4U.5Public education & Awareness10Medium compliance
4U.6Effectiveness in achieving behaviour change10Low compliance
4UUser inclusivity54%
(Total score—normalised)
Table 6. Qualitative assessment of benchmark indicator (4P) for provider inclusivity.
No.Short NameScoreObservations
4P.1Legal framework10Medium compliance
4P.2Representation of the private sector10Medium compliance
4P.3Role of the “informal” and community sector10Medium compliance
4P.4The balance of public vs. private sector interests in delivering services15Medium/High compliance
4P.5Bid processes10Medium compliance
4PProvider inclusivity55%
(Total score)
Table 7. Qualitative assessment of benchmark indicator (5F) for financial sustainability.
No.Short NameScoreObservations
5F.1Cost accounting10Medium compliance
5F.2Coverage of the available budget5Covers most current operating costs
5F.3Local cost recovery—from households1550–74% of the total number of households are using and paying for waste collection services
5F.4Affordability of user charges15Medium/High compliance
5F.5Coverage of disposal costs5Charged rate covers some costs of operation
5F.6Access to capital for investment5Low compliance
5FFinancial sustainability46%
(Total score—normalised)
Table 8. Qualitative assessment of benchmark indicator (6N) for national SWM framework.
No.Short NameScoreObservations
6N.1Legislation and regulations10Medium compliance
6N.2Strategy/Policy10Medium compliance
6N.3Guidelines and implementation procedures10Medium compliance
6N.4National institution responsible for implementing solid waste management policy10Medium compliance
6N.5Regulatory control10Medium compliance
6N.6Extended producer responsibility (EPR) or product stewardship (PS)5Low compliance
6NAdequacy of national framework for solid waste management 46%
(Total score—normalised)
Table 9. Qualitative assessment of benchmark indicator (6L) for local institutional coherence.
No.Short NameScoreObservations
6L.1Organizational structure/coherence15Medium/High compliance
6L.2Institutional capacity15Medium/High compliance
6L.3City-wide SWM strategy and plan10Medium compliance
6L.4Availability and quality of SWM data10Medium compliance
6L.5Management, control and supervision of service delivery10Medium compliance
6L.6Inter-municipal (or regional) cooperation10Medium compliance
6LLocal institutional policies58%
(Total score—normalised)
Table 10. Summary results for the “Wasteaware” benchmark indicators for Ulaanbaatar and comparison to other cities.
No.CategoryIndicatorResults
CityMonrovia 1Lahore 1UlaanbaatarGuadalajara 1Belfast 1
CountryLiberiaPakistanMongoliaMexicoUK, Northern Ireland
Background information on the city
B1Country income levelWorld Bank income categoryLowLower-middleLower-middleUpper-middleHigh
GNI per capita$370$1140$3830$9640$38,250
B2PopulationTotal population of the city1,021,7688,160,0001,277,1374,664,924218,000 city only
B3Waste generationMSW generation (tonnes per year)287,0001,916,000522,0002,000,000149,000
Key waste-related data
W1Waste per capitaMSW per capita (kg per year)230219408440683
W2Waste composition4 key fractions—as of % of total waste generated
W2.1OrganicOrganics (food and green wastes)50%65%33.7%53%35.1%
W2.2PaperPaper and card5%2%7.7%9%21%
W2.3PlasticsPlastics13%12%14%10%6%
W2.4MetalsMetals2%0.1%2.1%1.4%3.3%
Physical components
1.1Public health—waste collectionWaste collection coverage33% (M) 77% (M) 92.5% (M/H) 95% (M/H) 100% (H)
1.2Waste captured by the system30% (L) 80% (M) 85% (M) 95% (M/H) 98% (M/H)
1CQuality of waste collection serviceM (58%) M (58%) M (50%) M (50%) H (100%)
2Environmental control—waste treatment and disposalControlled treatment and disposal70% (L/M) 8% (L) 100% (H) 95% (H) 98% (H)
2EDegree of environmental protection in waste treatment and disposalM (45%) L/M (37%) M (50%) M (60%) H (100%)
3Resource management—reduce, reuse and recycleRecycling rate8% (L) 35% (M) >5.5% (L) 12% (L/M) 35% (M)
3RQuality of 3Rs—Reduce, reuse, recycle—provisionL/M (33%) L (17%) L/M (21%) L (13%) H (83%)
Governance factors
4UInclusivityUser inclusivityM/H (67%) L/M (37%) M (54%) M (46%) M/H (79%)
4PProvider inclusivityM (60%) M (50%) M (55%) L/M (40%) M/H (80%)
5FFinancial sustainabilityFinancial sustainabilityM (46%) M (54%) M (46%) L/M (40%) H (100%)
6NSound institutions, proactive policiesAdequacy of national SWM frameworkL (17%) L/M (29%) M (46%) M/H (67%) M/H (66%)
6LLocal institutional policiesM (46%) M/H (62%) M (58%) M (46%) H (100%)
GNI, Gross National Income; MSW, Municipal solid waste; B, Background info; W, Waste information; 1 1C, Public health; 2, 2E, Environmental control; 3, 3R, Resource value; 4U, User inclusivity; 4P, Provider inclusivity; 5F, Financial sustainability; 6N, National framework; and 6L, Local institutions. Indicators were assessed into five categories and colour coded: low performance (L), red; low/medium (L/M), red-amber; medium (M), amber; medium-high (M/H), amber-green; and high (H), green. 1 Wilson et al. [8].

