1. Introduction
In recent years, with rapid economic development, the ever-accelerating urbanization and motorization, and the constant improvement of people’s living standards in China, the number of cars across the country has been growing quickly [
1] and reached 105 million cars by the end of 2013 [
2]. Yet the frequent and extensive use of cars not only brings life convenience, but also results in traffic jams, air pollution, resource depletion, and ecological damage [
3]. In order to alleviate these problems, green travel is imperative [
4].
Facing the prominent consequences of traffic jam and air pollution resulting from urban transportation, some Chinese cities began to carry out a series of exploration activities to promote green travel. For example, in 2001, Chengdu, one of the large cities in China, initiated the first Car Free Day event. In 2006, the China Association for NGO Cooperation (CANGO) and Environmental Defense in Beijing issued a joint proposal calling for Beijing residents to select green travel for the blue skies of Beijing and their own health. In 2008, the Beijing municipal government and civil society organizations launched a number of green travel activities to support the Beijing Olympics as the Green Olympics. In 2010, on the basis of the Shanghai World Expo and Guangzhou Asian Games, the corresponding themes of green travel activities were respectively conducted such as the Green Travel Tour of the Expo and the Low Carbon of the Asian Games. In 2011, new energy vehicles were put into use in Shenzhen for the Shenzhen University Games. In 2013, Green travel day was started in Shenyang to support the National Games of China. Thus, the concept of green travel gradually enters urban residents’ vision through holding activities during large international events.
However, according to the data of the China Council for International Cooperation on Environment and Development in 2013, in most Chinese urban cities, the implementation effect of green travel is not satisfactory. Specifically, the ever-increasing proportion of motorized travel is mainly due to car travel. While the proportion of public transport grows slowly, the proportion of walking and cycling declines rapidly. For example, the proportion of cycling drops 2–5% every year on average [
5]. This is because green travel-related policies and measures are so wide and untargeted that they do not effectively promote urban residents to conduct green travel. Thus, developing different policies and measures for different groups of urban green travelers is necessary. To achieve this, studying the characteristics of urban residents’ green travel is important. However, the travel behavior of urban residents is a very complex process, and travelers would consider values, personal norms, economic conditions, traffic conditions, as well as their own travel purposes when they choose travel modes [
6]. Furthermore, most research on urban residents’ green travel mainly focuses on travel mode choice [
7] and its influence factors from the perspective of psychology and sociology [
7]. Few studies are concerned about the characteristics and differences of different groups of urban residents’ travel behavior. However, only when understanding the characteristics and differences of urban residents can effective and targeted policies and measures be made to promote them to choose green travel. Therefore, the aim of this study is to categorize urban residents into different social groups based on their values, attitudes, and behavior characteristics on green travel, to analyze the features, similarities, and differences of different groups, and then to propose suggestions for the transformation of non-green travelers into green travelers.
2. Literature Review
2.1. Green Travel
Green travel, which comes from the concept of green transport, aims to guide residents to choose travel modes that are energy-efficient, reduce pollution, and beneficial to residents’ health, including taking a bus, taking the subway, ridesharing, walking, riding a bicycle, etc. [
8]. With rapid economic development and the expansion of urbanization, car pollution can result in serious consequences without proper management. To overcome such difficulties, some researchers have paid attention to green travel. The majority of the research focuses on green travel behavior. Some studies indicate that socio-demographic characteristics are important contributors that affect green travel behavior. For example, Golob and Hensher [
9] found that green travel behavior varied according to demographic characteristics, such as female travelers under 30 years old and over 50 years old, highly educated, with low car ownership, and with high incomes were more inclined to participate in green travel behavior. Plaut [
10] indicated that age was considered a prominent influencing factor of green travel behavior. Valkila and Saari [
11] used a case study to determine whether there are differences in energy attitudes and energy behavior between residents from different urban densities of residential districts and found that there was a gap between residents’ attitudes and behavior. Mathew and Eric [
12] found that green ideology was associated with green travel behavior, and residents with green values were more likely to support environmentally friendly travel. Chen and Guo [
13], by applying the structure equation model, established the concept model of psychological factors on green travel and developed measurement instruments of the factors based on a large-scale sample survey. The result indicated that both the intention and the perceived behavioral control had a direct effect on conducting green travel. So due to the environmental and social benefits of green travel, many researchers have studied it, yet still more research is needed.
2.2. Travel Behavior
Many studies about green travel have explored the travel behavior of urban residents. Peattie [
14] considered that according to different travel purposes, travel behavior can be divided into the following two categories. One is the daily traffic behavior, including work, shopping, and leisure. Another is tourist traffic behavior. This study mainly focuses on the daily traffic behavior of urban residents. Grdzelishvili and Sathre [
15] conducted a study among car drivers and public transport users in order to find the reasons why private car usage is increasing dramatically. They found that time, comfort, and safety are important factors that cause residents to select private automobiles rather than public transport. Differences in accessibility [
16] and residential dissonance [
17] also influenced resident travel behavior. Susilo et al. [
18] found that residents’ car availability decreased walking, cycling, and public transport trips. Gatersleben and Uzzell [
19] viewed resistance including past habits, past behavior, and psychological reaction as a barrier that impeded residents’ travel behavior change towards sustainable behavior. Structural equation modeling was used by Silva et al. [
20] to reveal the connection between land use patterns and travel behavior. Notably, car ownership, commuting distance, and the amount of mobility by mode (car, transit, and non-motorized modes) were included in travel behavior variables. They found that land use variables clearly influence travel behavior. Drivers’ travel behavior change was affected by changes in company car taxation [
21]. From these, it can be seen that the travel behavior of urban residents is affected by many factors, such as time, comfort, safety, availability, past habits, and past behavior.
2.3. Travel Mode Choice
In order to further study urban residents’ green travel, there are some studies which focus on the influence factors of urban residents’ travel mode choice. The survey conducted by Limtanakool et al. [
22] indicated that socioeconomic characteristics of urban travelers, travel time considerations, and land use attributes influence travel mode choice, and their roles vary along with the travel purpose which is business, commuting, or leisure. The study by Wu and Yang [
23] indicated that commuting distance significantly affects commuters’ travel pattern choice and different types of residents have distinct reactions to distance when choosing the mode of transport. Zhao et al. [
24] found that residents’ attitudes towards service quality travel have an important influence on travel choice intention. Buys and Miller [
25] demonstrated that utilitarian and psycho-social elements such as travel purpose and time-efficiency were strongly related to urban residents’ travel mode choice. Parking charges [
26], activity participation [
27], and multiple identities [
28] also had an effect on residents’ travel mode. Paulssen et al. [
29] suggested that personal values and individual attitudes impact travel mode choices. Notably, Cairnsa et al. [
30] found that establishing sustainable travel patterns needs not only individual values and behavior changes, but also the change of social practices, cultures, and institutions.
2.4. Population Characteristics
The studies on urban residents’ green travel are not limited to travel behavior and travel mode choice. A few studies have investigated the population characteristics of urban residents’ green travel from different aspects. For example, from the perspective of gender, Scheiner and Holz-Rau [
31] argued that gender differences exist in travel pattern choice. Dickinson et al. [
32] indicated that compared with men, women commute shorter distances and cycle less. Hsu and Saphores [
33] found that mothers are more inclined to chauffeur children to school than fathers, so interventions that encourage children to walk and bike to school should focus on the concerns and traffic characteristics of the mothers.
As for age, Mackett [
34] found that the policy of concessionary bus travel for older people can improve older people’s access to public transport services. From the point of socio-economic conditions, land use, and urban structures, Figueroa et al. [
35] studied older and younger adults’ travel mode. The results showed that for the older and younger adults, there are prominent differences between their travel modes and spatial structural conditions, such as regional accessibility and density. There are also some studies about the characteristics of employees’ green travel. Coleman [
36] suggested the small business employers play a role in decreasing car-based employee travel. Lo et al. [
37] suggested that social norms affect employees’ work-related travel behavior. Marcus et al. [
38] found that four mechanisms, namely regulation, information and exhortation, fiscal reform, and subsidies in commercial sector organizations, contribute to changing their employees’ travel behavior. Due to the differences in attitude and personal income, organizational measures did not have similar effects on employee behavior [
37].
In addition, Guella et al. [
39] used a social practice theory framework to explore commuters’ travel behavior through their commuting experiences and decisions. They found that choice and decisions are affected by commuters’ reasoning, ambitions, and identities. The study of Cheng et al. [
40] examined the travel characteristics and trip chain characteristics of urban low-income residents, and found that they have lower mobility than the non-low-income residents. Furthermore, Susilo et al. [
41] argued that for certain traveler groups, such as women, young and low-income or unemployed travelers, there are distinctive determinants of satisfaction with trip stages for various travel modes.
3. Method and Data
In order to explore the different characteristics of different Chinese urban residents from the perspective of green travel behavior, it is required that residents with similar characteristics be categorized into one group. Thus the Q method, a method used to group people by their subjectivity [
42], is applied in this study.
3.1. Q Method
The Q method was invented by British physicist/psychologist William Stevenson in a letter to <Nature> in 1935 and provided a foundation for the systematic study of subjectivity, a person’s viewpoint, opinion, beliefs, attitude, and so on [
42]. The Q method treats respondents as the variable and the statement of a theme as the sample, and takes the respondents’ standpoint and understanding as being central to its investigative procedure.
3.2. Definition of the Concourse and Development of the Q Sample
In the Q method, the flow of communicability surrounding any topic in the ordinary conversation, commentary, and discourse of everyday life is referred to as a concourse, which contains words, pieces of art, collections of paintings, musical selections, photographs, etc. [
43]. In order to ensure that the concourse covers as many views about green travel as possible, the concourse is obtained through a number of ways, such as journal articles, academic papers, research reports, newspaper articles, expert interviews, participant observations, and policy documents. The concourse involves the topics of environmental attitudes, personal values, the impact of individual travel behavior on the environment, travel mode choice, public transport, transport policies and measures, and so on. Then, the concourse of this study, including 100 statements, is obtained.
The Q sample (Q set) is a subset of statements, which is drawn from the concourse, and it is presented to the subjects [
43]. The selection of statements from the concourse to form the Q set is of crucial importance [
44]. First, 50 representative statements were selected through a Delphi procedure, which contains a group of experts, namely two university professors working in the environmental fields, two researchers from environmental research institutes, and one government officer from the environmental department. Second, in order to make the Q set comprehensive and applicable, 50 representative statements were put into preliminary investigation performed at Dalian University of Technology. Specifically, 15 master students and 10 doctoral students, who are in environmental majors, were invited to finish the original Q set. According to their advice, several statements they thought were important were added and they adjusted those they thought were unreasonable. Meanwhile, a few statements were rephrased and refined so as to make them brief, clear, and understandable to participants. Finally, a set of 40 Q statements was gained in the final Q sample for this research.
3.3. Selection of the P Set and Q Sorting
A Q study does not require numerous participants (P sets), and a P set is not selected randomly [
45]. P sets should have different and well-formed opinions to cover a wide variety of views, and represent the breadth of opinions in a target population under study [
46]. Thus, in this study, P sets are chosen from engineers, public officials, researchers, company employees, and college students in two urban cities in China, Dalian and Yantai, because these two cities are both medium-sized coastal cities with ever-increasing family cars and are now also facing the severe transportation problem of traffic jams [
7].
After selecting the P set, the second step of a Q study is Q sorting. However, the general Q sorting procedure based on face-to-face interviews is complex, time-consuming, and unfamiliar to the public. At the same time, Van Tubergen and Olins [
47] believed that Q studies may be carried out by mail, and their research revealed that the results of Q sort self-administration are highly identical with in-person interviews. Reber et al. [
48]found that the reliability or validity of computer-based Q sorts of administration have no apparent difference with the reliability or validity of interview-based Q sorts of administration. Consequently, this Q study is conducted online based on WebQ. According to the reference[
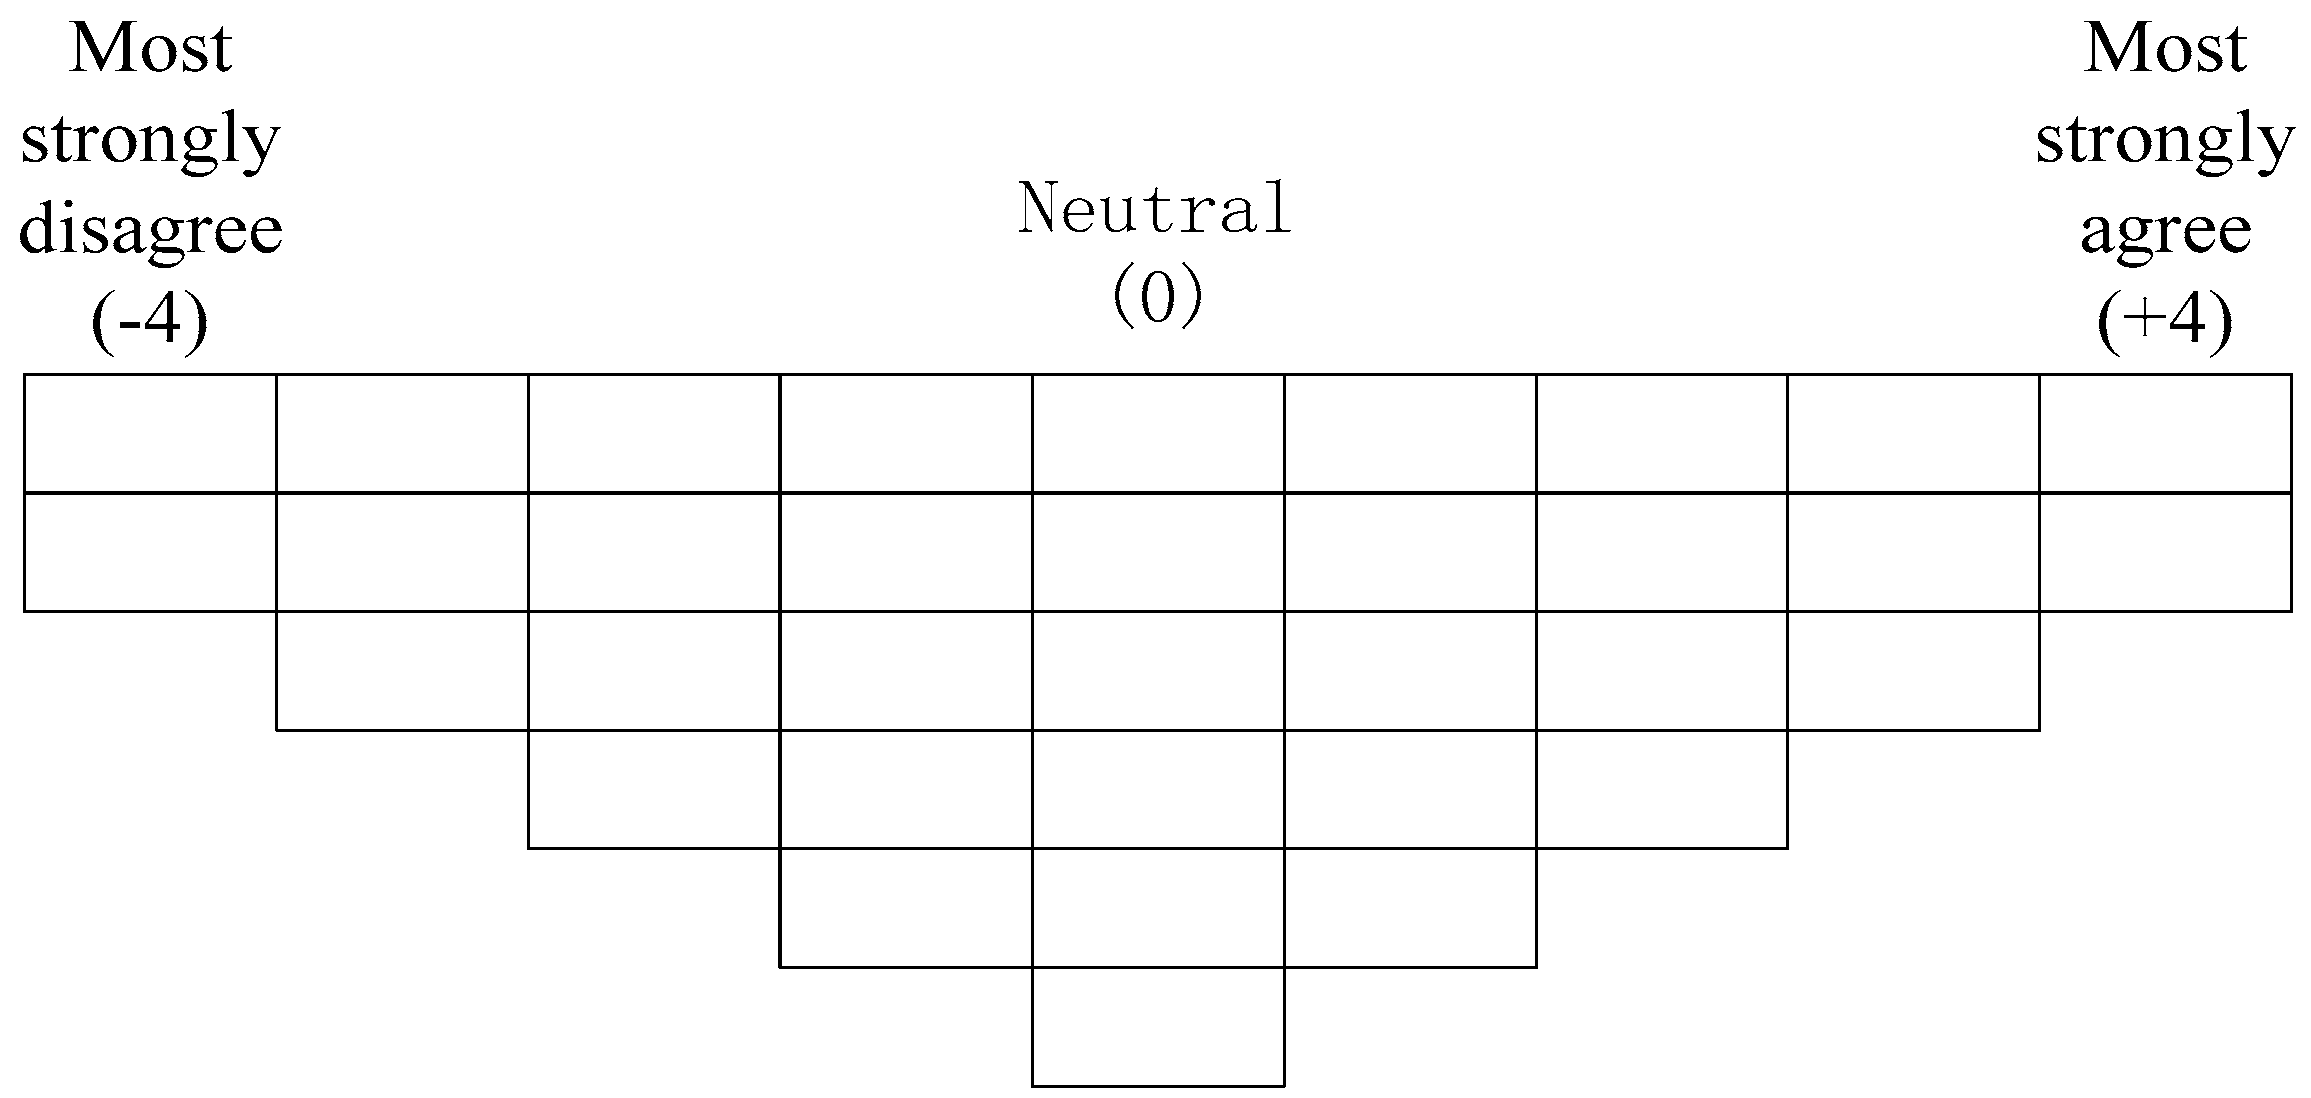
49], the statements of the Q set need to be classified into three parts, “agree”, “disagree”, and “neutral”. Then, based on the degree of “agree” and “disagree”, these three parts are further detailed into nine or eleven levels from strongly agree to strongly disagree, with equal positive and negative levels, such as 5 positive and 5 negative, or 4 positive and 4 negative. The respondents in this study are instructed to rank 40 statements along a continuum from “most strongly agree” (+4) on one end to “most strongly disagree” (−4) on the other end. The distribution is similar to a normal distribution, but is actually not a normal distribution. Hence it is called a quasi normal distribution. The quasi-normal distribution in this study is shown in
Figure 1. From November 2013 to January 2014, 60 questionnaires were sent to participants, and 53 questionnaires were collected. P sets should not more than 50 [
43]. Thus, 50 effective P sets (50 Q sorts) were selected for this study.
3.4. Data Analysis
The software used for analyzing data is PCQ for Windows Academic Edition. First, a correlation relationship analysis is performed to calculate the correlation matrix of 50 Q sorts, which represents the degree of similarity or dissimilarity in perspectives between the individual Q sorters. The correlation matrix is simply a necessary way station and a condition through which the data must pass on the way to revealing their factor structure [
43]. The correlation matrix is subject to factor analysis, which identifies the number of natural types of Q sorts [
42]. In the factor analysis, Principal Components Analysis (PCA) is adopted to extract the factors of this study and varimax rotation is used to rotate the factors. According to the principles of eigenvalues greater than one [
50] and the variance contribution rate above 10% [
51], three factors were selected for further analysis.
In order to identify which factor of Q sorts belongs to the same group, factor loading is calculated by the Q method. A factor loading needs to be determined for each Q sort so as to express the extent to which Q sort is associated with each other [
52]. The factor loading evaluated by the standard of “factor loading value over 3/
(n is the number of Q statements) is taken as the criteria to determine that only those with factor loading value in some factor over 3/
can be categorized into this factor” [
53]. In this study, n is 40, so factors with loadings above 0.474(3/
= 0.474) are significant. Thus, according to the standard of the absolute value of factor loading in excess of 0.474, 42 Q sorts are classified into these three factors. The Q sorts and their factor loadings are shown in
Table 1. Factor 1 includes 11 Q sorts, factor 2 includes thirteen Q sorts and factor 3 includes eighteen Q sorts. In this study, the research of Straughan and Roberts [
54] were referred to, which used the different shades of green to represent different categories of consumers’ green consumption behavior, to rename the three factors as the green traveler group, light green traveler group, and brown traveler group.
Before describing and interpreting the three factors, factor scores and difference scores must be calculated. A statement’s factor score, quite similar to the beta coefficient in regression analysis, reflects the degree that the statement contributes to the factor [
7] and the difference score is the magnitude of the difference between factor scores of a statement on any two factors that is required for it to be statistically significant [
55]. According to their factor scores, 40 Q statements can be placed in the original quasi-normal distribution, forming a composite Q sort for any one of the three factors. Generally, when a statement ranks at any extreme end of a composite sort, it is called a characterizing statement, which is used to reveal a first description of the composite point of view represented by that factor [
55]. The difference score is based on the standard error (SE) for a factor score and the multiplier of a statistical significance level. The multiplier is 3.29 when the statistical significance level is at
p < 0.001. The SE is calculated by the expression 1/
, where n equals the number of items (Q statements) [
56]. The standard error of the difference (SED) is calculated by the expression SE, so the difference score for this study is 0.73 (3.29 × SED = 3.29 × 1/
) [
44]. When a statement’s factor score between any of the identified factors does not surpass this difference score, it is called a consensus statement. A statement that is distinctive on two factors is called a distinguishing statement. The consensus and the distinguishing statements can be used to illustrate the similarities and differences between any two factors [
55].
4. Results
4.1. Demographics of the Respondents
The demographics of the respondents in this study include sex, age, education, occupation, and income.
For sex, this survey includes 33 males and 17 females, accounting for 66% and 34% of the total respondents, respectively.
For age, 22 respondents are between 20–29 years old, 12 are between 30–39 years old, 10 are between 40 ± 49 years old, and 6 are over 50 years old.
For education, 15 respondents have a Junior college degree, 17 have a Bachelor’s degree, and 13 have a Master’s or PhD degree.
For occupation, seven respondents are engineers, eight are government staff, two are doctors, two are lawyers, 14 are company employees, five are professionals, seven are researchers, and five are college students.
For monthly income, 31 respondents earn a monthly income of RMB ¥3000–8000 (about US $440–1180), nine earn less than RMB ¥3000 (about US $440), and ten earn more than RMB ¥8000 (about US $1180) monthly.
4.2. Type Analysis
The characterizing statements of each group are shown in
Table 2.
According to
Table 2, in the green traveler group (Group 1), items 1, 4, 19, 16, and 26 have the highest positive factor scores, and items 12, 40, 38, 31, and 7 have the highest negative factor scores. Hence, these items are the characterizing statements of Group 1. Item 12 (I do not intend to choose public transport to travel after owning a private car) and item 26 (Even if I have a car, I will try to take public transport to travel) express the same meaning from negative and positive perspectives, and they obtain the negative (–3) and positive (+3) scores, which indicates that the Q sample used in this study is credible.
From those characterizing statements, we find that Group 1 chooses green travel in order to live in harmony with nature and protect the environment. Their behavior is not affected by others. Even if they own a car, they still try to use public transport to travel. They are particularly against driving their cars to travel for the sake of showing individual’s social status or for individual’s convenience and comfort. At the same time, they are concerned about green travel-related information and knowledge. In short, they care about the environment, have rich green travel knowledge, oppose non-green travel behavior, and hold a positive environmental attitude on green travel. Just like what Paulssen et al. [
57] found, personal values and individual attitudes have a great impact on travel mode choices. So people in this group conduct green travel due to their positive environmental values and attitudes. The greatest feature of Group 1 is that they have a comprehensive and profound understanding on green travel, and they insist on green travel actively and firmly in their daily lives.
In the light green traveler group (Group 2), items 1, 4, 8, 30, 28, 12, 15, 11, 3, and 7 are the characterizing statements. Group 2 strongly agrees with the statement that “In order to live in harmony with nature, we should choose green travel.”, while they disagree with the opinion that driving a private car to travel is a reflection of social status. Meanwhile, they have some knowledge of green travel, for example, the importance of green travel for environmental conservation, green travel methods, green drivers, and so on. Even though they have a car, they will actively choose public transport to travel. In a word, they are worried about environmental issues and have positive environmental attitudes. However, froms item 4, 30, and 28, it is clear that the convenience of public transport, government incentives, and relevant policies will affect the travel behavior of Group 2. Actually many researchers such as Susilo et al. [
18] and Shiftan et al. [
21] indicated that the travel behavior of urban residents is affected by factors of time, comfort, safety, availability, and past habits or past behaviors, and these factors impede residents’ travel behavior change towards green behaviors. So on the one hand, Group 2 accepts the concept of green travel, and on the other hand, their travel behavior is susceptible to external factors. Therefore, for Group 2, the appropriate incentives and the improvement of conditions will promote them to transform thier behavior from light green to green travel.
For the brown traveler group (Group 3), the characterizing statements are items 4, 31, 1, 6, 17, 37, 15, 24, 39, and 38. Group 3 recognizes that they should choose green travel so as to protect the environment, and travel mode choice has nothing to do with the symbol of status. At the same time, they express their concerns about green travel and have some knowledge of green travel. However, from items 4, 31, and 6, it can be found that although the convenience of public transport will make Group 3 choose public transport, they usually select their travel mode on the basis of their personal habits and they use private cars more generally for convenience and comfort. In fact, comfort and convenience are very important factors that affect residents to select private automobiles rather than public transport [
15,
20]. Moreover, they do not believe that personal travel mode choice plays an important role in environmental protection. In brief, the travel behavior of Group 3 is subject to individual needs and habits rather than environmental conservation.
4.3. Consistency Analysis
The consensus statements of the three groups are shown in
Table 3.
According to
Table 3, the difference of the factor scores of items 1, 4, 7, and 40 in any two factors is below 0.73, indicating that they are the consensus statements of the three groups. First, all three groups know about the necessity to select green travel and the positive role that green travel plays in environmental protection, which shows that for most residents, the concept of green travel has been basically established. Second, they all agree that if the public transport is convenient, they will choose public transport to travel. Thus, it can be concluded that travel convenience is an important factor for residents when selecting their travel patterns. Finally, most urban travelers rationally hold a negative attitude regarding the view that driving private cars to travel can reflect personal wealth and status.
4.4. Difference Analysis
The distinguishing statements of any two groups are shown in
Table 4.
The differences between Group 1 and Group 2 are mainly reflected in the following four aspects. First, from item 19 and item 33, it can be found that the travel behavior of Group 2 is easily influenced by others, while Group 1 has a firm attitude about green travel in that they are not affected by others. Second, item 28 and item 30 express that government policies and incentives have more positive and greater impacts on Group 2 than Group 1. Thus, Group 2 is sensitive to others’ travel behavior transformation and environmental policies. Third, according to item 5, item 14, and item 23, compared with Group 2, Group 1 holds a more positive attitude about green travel and is more willing to learn about green travel-related knowledge, regulations, and policies. Finally, Group 1 believes that personal travel mode has an effect on the environment. This belief will promote Group 1 to choose green travel mode and also to affect the travel mode choice of others around.
The differences between Group 1 and Group 3 are shown in three aspects. First, the different scores on items 31, 6, 12, 26, and 19 indicate that Group 1 and Group 3 hold diametrically opposite attitudes on travel mode choice. Group 3 selects a travel mode on account of personal comfort and habits, and they seldom take environmental factors into consideration. Whereas Group 1 is a firm practitioner of green travel, and their green travel behavior is not affected by owning a private car or others’ travel behavior. Second, according to item 35, Group 1 responds to green travel-related publicity more actively than Group 3. Finally, item 36 expresses that Group 3 thinks that green travel policies, such as car restrictions, bring inconvenience to their lives, while Group 1 does not think so.
The differences between Group 2 and Group 3 are as follows. Group 2 has more environmental and friendly travel motivations and behaviors. In addition, compared with Group 2, the travel patterns of Group 3 are usually not affected by others’ behavior, incentives, and other external factors. Thus, although Group 3 expresses concerns for green travel, they do not put it into practice.
In a word, all three groups have a good understanding on green travel-related knowledge and the positive role of green travel regarding environmental aspects. However, compared with the other two groups, the essential difference of Group 3 is that they do not put green travel into practice, and individualistic value is obvious in their travel mode selection. Meanwhile, the distinct feature of Group 2 is that their travel behavior is susceptible to external factors such as incentives and policies.
5. Discussion
Based on the analysis, urban residents can be classified into the three groups, green, light green, and brown travelers, and different groups of travelers hold different values and attitudes about green travel. Their specific travel behavior is also affected by different factors. Group 1 understands green travel comprehensively and profoundly, and they insist on green travel actively and firmly in their daily lives, due to the positive environmental values and attitudes [
29]. Therefore, making suitable policies and measures to the targeted groups will effectively prompt all residents to perform green travel. For brown travelers, personal habits have hindered the implementation of green travel, so personal habit changes will guide this group to conduct green travel. Similarly, although light green travelers hold favorable environmental values and attitudes, the implementation of specific green travel actions are usually susceptible to interpersonal and environmental factors. Based on the research by Susilo et al. [
18] and Shiftan et al. [
21], factors like time, comfort, safety, or availability could be obstacles that impede them from adopting green travel behavior. Consequently, for this group of residents, social condition improvement is of great importance. As for the green travelers, they have a good environmental attitude and stable green travel behavior. Hence, in this study, we mainly discuss how to make brown and light green travelers transform into green travelers.
The results shows that brown travelers usually have egoistic values. Their travel behavior is subject to personal habits, and environmental factors are rarely considered in their behavior decision-making process. Once their travel habits are formed, it is hard to change their behavior through external factors. Brown travelers view travel convenience and comfort as important factors in travel mode choice. Based on the transtheoretical model of behavior change, ten processes consisting of five stages are needed to form a new behavior by getting rid of an old one; they are consciousness raising, self-liberation, social liberation, self-reevaluation, environmental reevaluation, counterconditioning, stimulus control, reinforcement management, dramatic relief, and helping relationships [
57]. Considering the characteristics of brown travelers, low environmental consciousness, and being seriously affected by external conditions, this study mainly focuses on the following three stages in order to convince brown travelers to transform to green travelers.
The first stage is enhancing their environmental values. To achieve this, travelers need to understand environmental information to improve environmental awareness. Governments can carry out green travel-related propaganda and practices in schools, enterprises, and communities. Governments can also release green travel reports regularly to the public, to increase public participation. After environmental values and the sense of responsibility are improved, travelers begin to try new travel modes and make green travel choices in practice. Therefore in stage two, travelers require a lot of travel information to help them make optimal judgments about green travel mode choices. Therefore, governments can provide the public with the information they need, such as the roadmaps for walking and cycling or the timetables of public transport. The third stage is strengthening green travel behavior. Green travel behavior calls for continual consolidation to ultimately form a green travel habit. In this process, governments can establish green travel behavior incentive mechanisms in the whole society to reward travelers who actively participate in green travel activities. The rewards can be a water bottle or a backpack for walking or cycling, and so on.
As is mentioned above, a primary feature of light green travelers is that their travel behavior is susceptible to physical and socio-cultural environmental factors. Remarkably, physical environmental factors mean the convenience and comfort of public transport at the infrastructure level. In the meantime, socio-cultural environmental factors point to the green travel-related laws, regulations, and incentives made by governments. More importantly, good physical and socio-cultural environments will encourage light green travelers to perform green travel. Therefore, the behavior transformation of light green travelers largely depends on the improvement of the physical and socio-cultural environment.
In terms of improving the physical environment, governments should take concrete measures to perfect transportation infrastructure, for instance by optimizing bus lines, recovering urban slow travel systems, and encouraging companies to increase the number of shuttle buss. Governments also need to consider how to make the public transport service system better, specifically regarding the aspects of providing accurate information on public transport travel, improving public transport comfort, and implementing integrated public transport systems. As for improving the socio-cultural environment, governments may establish a special fund for public transport development to support urban public transport construction.
6. Conclusions and Implications
Combined with the status quo of green travel in China, this paper uses the Q method to study the green travel behavior of urban residents. Based on the group classifications, it summarize the attitudes, behaviors, and characteristics of different groups of travelers, analyzes the consistency and differences among those groups, and discusses the behavior transformation of non-green into green travelers. The main conclusions of this study are as follows. First, based on different values and travel attitudes regarding green travel, three groups of travelers are classified, namely green travelers, light green travelers, and brown travelers. Green travelers are concerned about environmental issues, have positive environmental attitudes and values, and have rich green travel knowledge. Most importantly, they put green travel into practice in their daily lives actively and firmly. Brown travelers, however, hold egoistic values and their green travel behavior, with little consideration of the environment, is mainly affected by individual travel habits. Thus, promoting brown travelers to transform into green travelers requires changing their egoistic values and overcoming their inherent bad travel habits. Third, light green travelers have certain knowledge on green travel and have good environmental attitudes, but their travel behavior is substantially affected by external factors such as the convenience of public transport and government incentives. Therefore, to promote light green travelers to transform into green travelers requires providing them with good environmental conditions and some incentives.
By applying the Q method, this study groups Chinese urban residents into three different groups, green, light green, and brown travelers, based on their subjectivity regarding green travel. The results show the implication of green travel and suggest how to foster green travel behavior. However, limitations of this study still exist. The characteristics of each group are identified and the implications are also provided in order to encourage each group to perform green travel behavior. Although this study tries to survey diverse respondents with different identities, still many other identities such as doctors and lawyers are not included in this study. Therefore in future research, more respondents need to be surveyed to more precisely reflect urban residents and their traits. Furthermore, the factors affecting light green and brown travelers need to be identified, and methods of encouraging light green and brown travelers to transform into green travelers merits further study.


