
Effects of Pros and Cons of Applying Big Data Analytics to Consumers’ Responses in an E-Commerce Context

Abstract
:1. Introduction
2. Theoretical Background and Hypotheses Development
2.1. Big Data and Its Characteristics
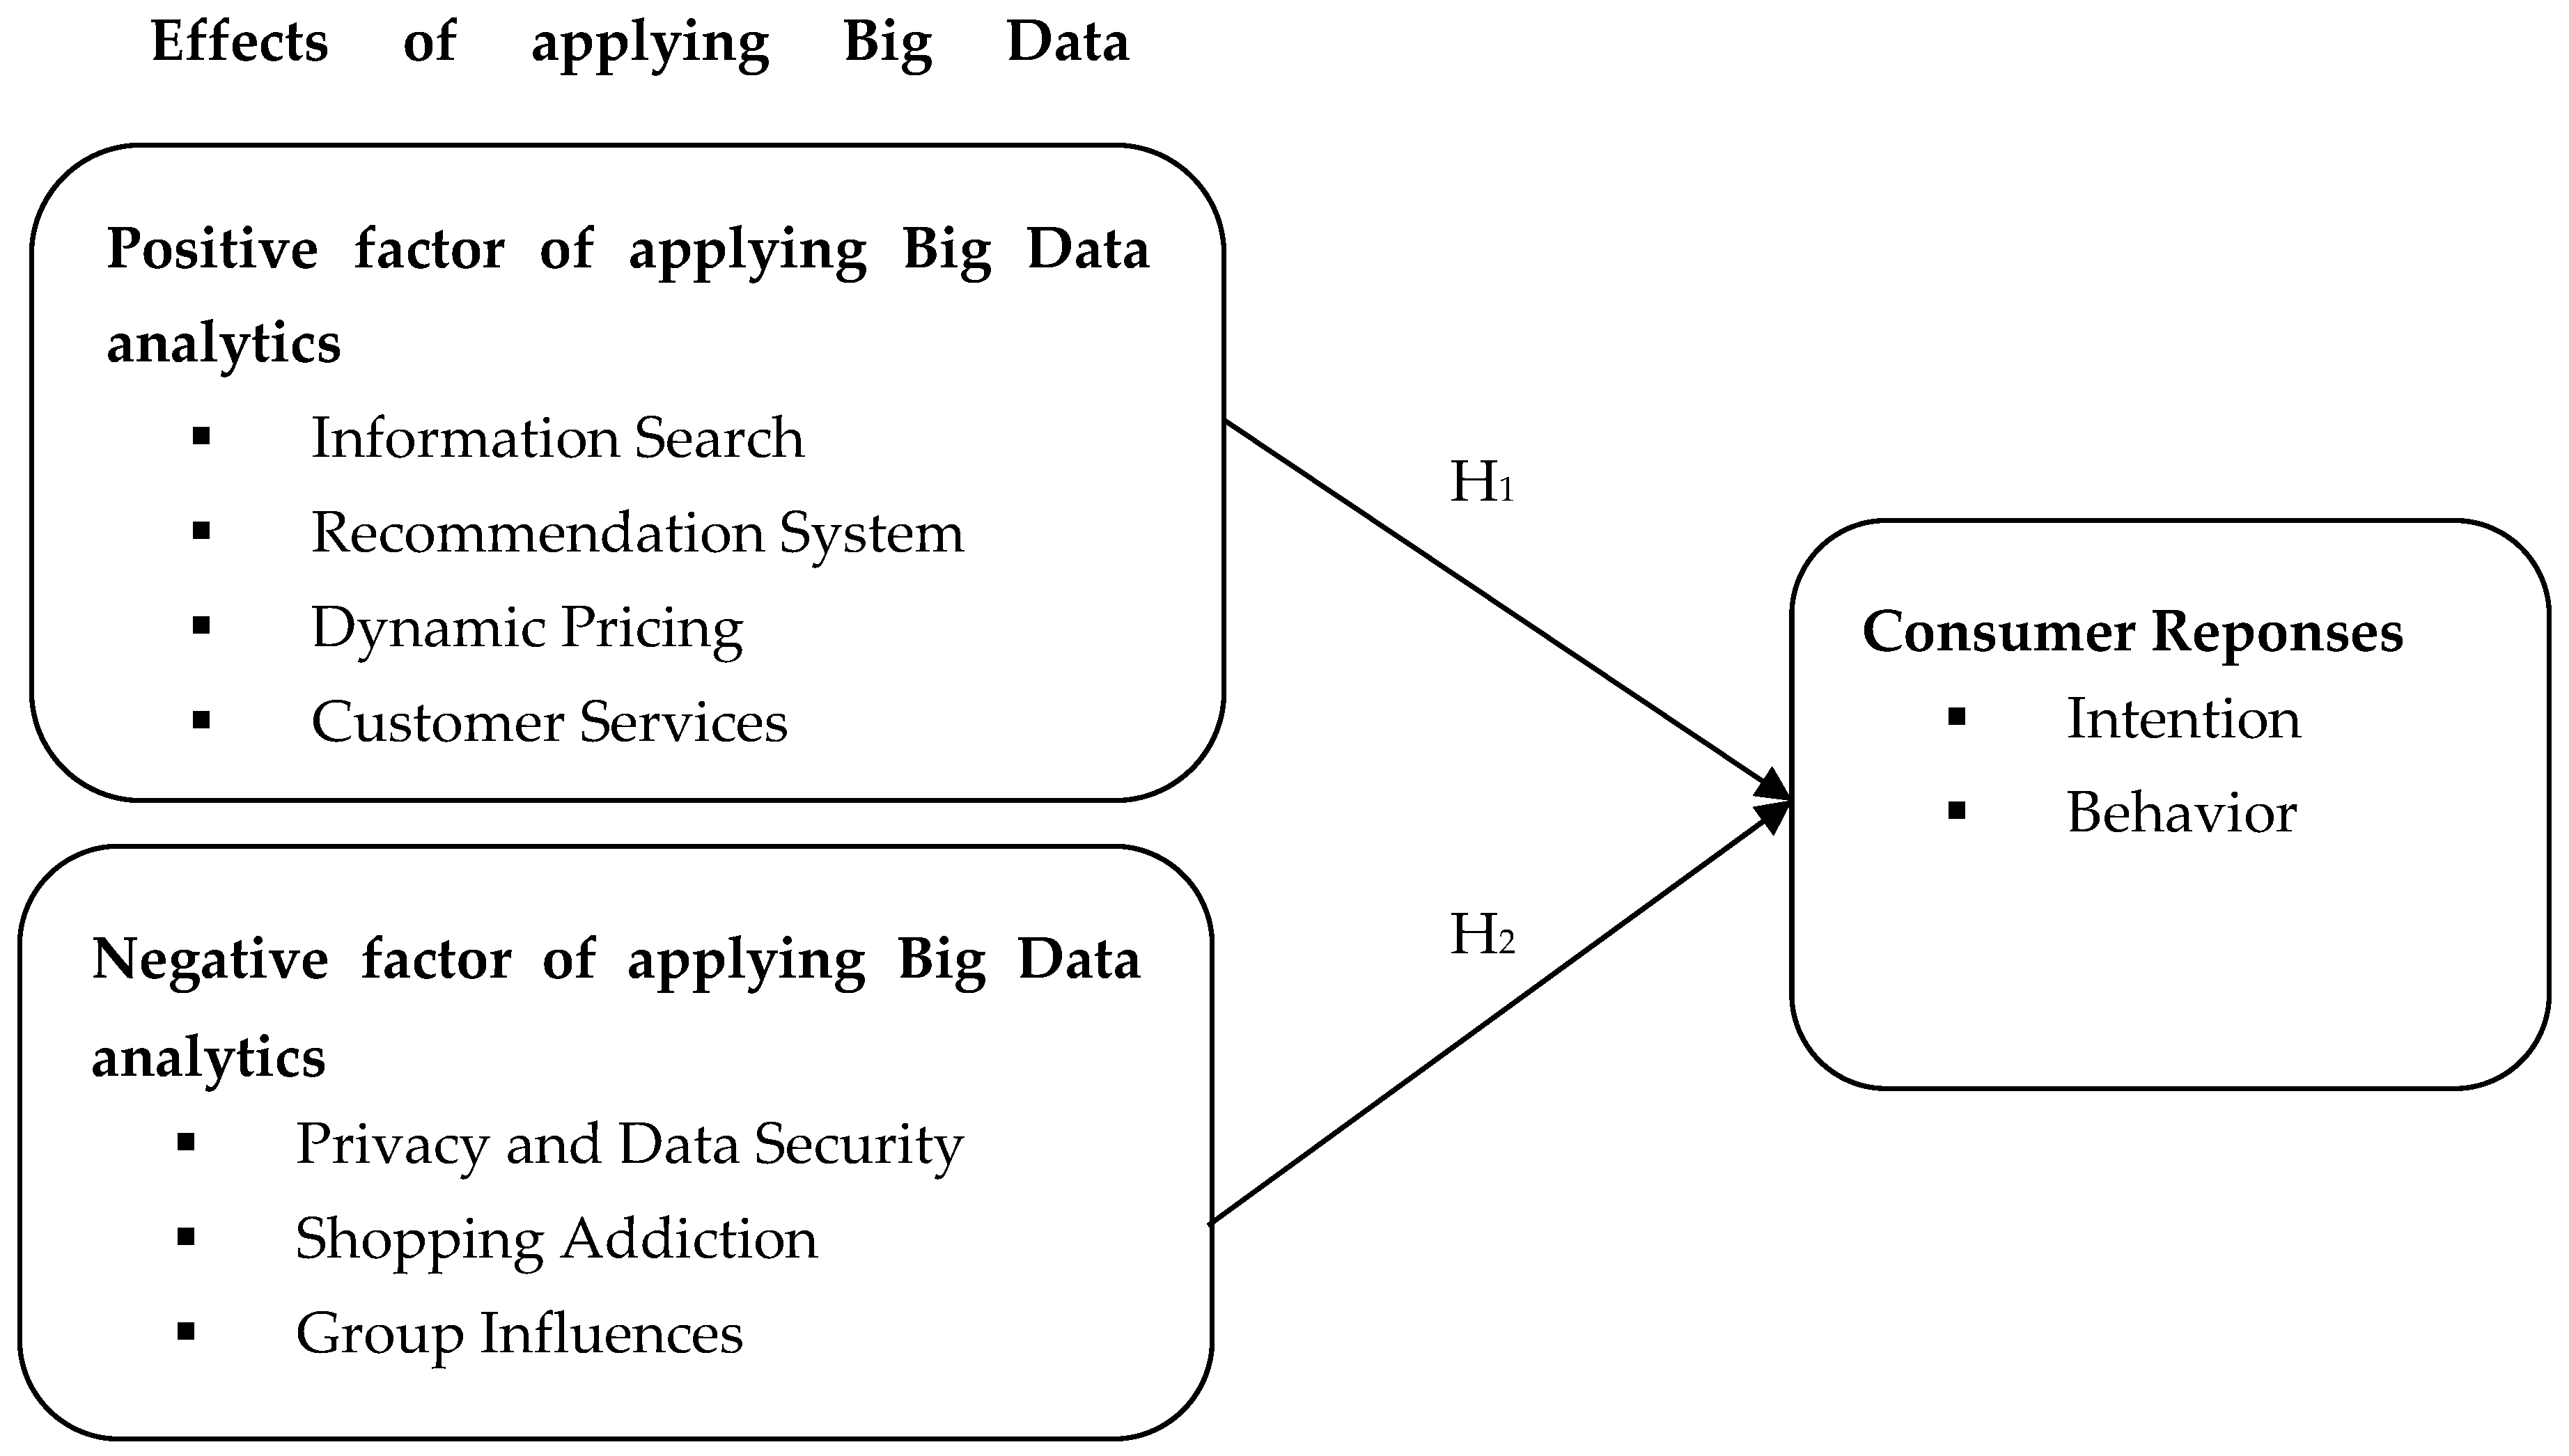
2.2. Positive Factor of Applying Big Data Analytics
2.2.1. Information Search
2.2.2. Recommendation System
2.2.3. Dynamic Pricing
2.2.4. Customer Services
2.3. Negative Factor of Applying Big Data Analytics
2.3.1. Privacy and Data Security
2.3.2. Shopping Addiction
2.3.3. Group Influences
2.3.4. Behavior Consumer Responses Hierarchy Models
3. Research Methodology
3.1. Pilot Test
3.2. Sample Size and Data Collection Procedure
3.2.1. Sample Size
3.2.2. Data Collection Procedure
3.3. Measurement
3.4. Statistical Data Analyses
4. Results
4.1. Measurement Model
4.2. Structural Equation Model
5. Discussion and Conclusions
6. Limitations and Future Research
Acknowledgments
Author Contributions
Conflicts of Interest
References
- Gantz, J.; Reinsel, D. Extracting Value from Chaos. Available online: https://www.emc.com/collateral/analyst-reports/idc-extracting-value-from-chaos-ar.pdf (accessed on 10 May 2017).
- Manyika, J.; Chui, M.; Brown, B.; Bughin, J.; Dobbs, R.; Roxburgh, C.; Byers, A.H. Big Data: The Next Frontier for Innovation, Competition, and Productivity; McKinsey Global Institute: Washington, DC, USA, 2011. [Google Scholar]
- George, G.; Haas, M.R.; Pentland, A. Big Data and management. Acad. Manag. J. 2014, 57, 321–326. [Google Scholar] [CrossRef]
- McAfee, A.; Brynjolfsson, E.; Davenport, T.H.; Patil, D.; Barton, D. Big Data: The management revolution. Harv. Bus. Rev. 2012, 90, 61–67. [Google Scholar]
- Bose, R. Advanced analytics: Opportunities and challenges. Ind. Manag. Data Syst. 2009, 109, 155–172. [Google Scholar] [CrossRef]
- Lo, H.Y.; Harvey, N. Effects of shopping addiction on consumer decision-making: Web-based studies in real time. J. Behav. Addict. 2012, 1, 162–170. [Google Scholar] [CrossRef] [PubMed]
- Chu, T.H.; Chen, Y.Y. With Good We Become Good: Understanding e-learning adoption by theory of planned behavior and group influences. Comput. Educ. 2016, 92, 37–52. [Google Scholar] [CrossRef]
- Akter, S.; Wamba, S.F. Big Data analytics in E-commerce: A systematic review and agenda for future research. Electron. Mark. 2016, 26, 173–194. [Google Scholar] [CrossRef]
- Barton, D.; Court, D. Making advanced analytics work for you. Harv. Bus. Rev. 2012, 90, 78–83. [Google Scholar]
- Ehrenberg, A.S. Repetitive advertising and the consumer. J. Advert. Res. 2000, 40, 39–48. [Google Scholar] [CrossRef]
- Lee, T.R.; Lin, J.H.; Liao, L.W.C.; Yeh, T.H. Managing the positive and negative characteristics of enterprise microblog to attract user to take action through the perspective of behavioural response. Int. J. Manag. Enterp. Dev. 2013, 12, 363–384. [Google Scholar] [CrossRef]
- Ishwarappa, K.; Anuradha, J. A Brief Introduction on Big Data 5Vs Characteristics and Hadoop Technology. Procedia Comput. Sci. 2015, 48, 319–324. [Google Scholar]
- Kahneman, D.; Thaler, R.H. Anomalies: Utility maximization and experienced utility. J. Econ. Perspect. 2006, 20, 221–234. [Google Scholar] [CrossRef]
- Trifu, M.R.; Ivan, M.L. Big Data: Present and future. Data. Syst. J. 2014, 5, 32–41. [Google Scholar]
- Astudillo, C.; Bardeen, M.; Cerpa, N. Editorial: Data mining in electronic commerce-support vs. confidence. J. Theor. Appl. Electron. Commer. Res. 2014, 9, I–VII. [Google Scholar] [CrossRef]
- Guangting, Z.; Junxuan, Z. The Study of Impact of “Big Data” to Purchasing Intention. Int. J. Bus. Soc. Sci. 2014, 5, 91–95. [Google Scholar]
- Bharati, P.; Chaudhury, A. An empirical investigation of decision-making satisfaction in web-based decision support systems. Decis. Support Syst. 2004, 37, 187–197. [Google Scholar] [CrossRef]
- Delone, W.H.; McLean, E.R. The DeLone and McLean model of information systems success: A ten-year update. J. Manag. Inf. Syst. 2003, 19, 9–30. [Google Scholar]
- Luo, X.; Seyedian, M. Contextual marketing and customer-orientation strategy for e-commerce: An empirical analysis. Int. J. Electron. Commer. 2003, 8, 95–118. [Google Scholar]
- Huang, Z.; Zeng, D.; Chen, H. A comparative study of recommendation algorithms in e-commerce applications. IEEE Intell. Syst. 2007, 22, 68–78. [Google Scholar] [CrossRef]
- Lee, J.; Sun, M.; Lebanon, G. Prea: Personalized recommendation algorithms toolkit. J. Mach. Learn. Res. 2012, 13, 2699–2703. [Google Scholar]
- Resnick, P.; Varian, H.R. Recommender systems. Commun. ACM, 1997; 40, 56–58. [Google Scholar] [CrossRef]
- Shardanand, U.; Maes, P. Social information filtering: Algorithms for automating “word of mouth”. In Proceedings of the SIGCHI Conference on Human Factors in coMputing Systems, Denver, CO, USA, 7–11 May 1995. [Google Scholar]
- Chevalier, J.A.; Mayzlin, D. The effect of word of mouth on sales: Online book reviews. J. Mark. Res. 2006, 43, 345–354. [Google Scholar] [CrossRef]
- Hongyan, L.; Zhenyu, L. E-Commerce Consumer Behavior Information Big Data Mining. Int. J. Database Theor. Appl. 2016, 9, 135–146. [Google Scholar] [CrossRef]
- Kotler, P.; Armstrong, G. Principles of Marketing; Pearson Education: Upper Saddle River, NJ, USA, 2010. [Google Scholar]
- Garbarino, E.; Lee, O.F. Dynamic pricing in internet retail: Effects on consumer trust. Psychol. Mark. 2003, 20, 495–513. [Google Scholar] [CrossRef]
- Erevelles, S.; Fukawa, N.; Swayne, L. Big Data consumer analytics and the transformation of marketing. J. Bus. Res. 2016, 69, 897–904. [Google Scholar] [CrossRef]
- Haws, K.L.; Bearden, W.O. Dynamic pricing and consumer fairness perceptions. J. Consum. Res. 2006, 33, 304–311. [Google Scholar] [CrossRef]
- Bolton, L.E.; Warlop, L.; Alba, J.W. Consumer perceptions of price (un)fairness. J. Consum. Res. 2003, 29, 474–491. [Google Scholar] [CrossRef]
- Jiang, Z.; Benbasat, I. Virtual Product Experience: Effects of Visual Functionality Control of Products on Perceived Diagnosticity in Electronic Shopping. J. Manag. Inf. Syst. 2004, 21, 111–147. [Google Scholar]
- Daugherty, T.; Li, H.; Biocca, F. Experiential Ecommerce: A Summary of Research Investigating the Impact of Virtual Experience on Consumer Learning. Available online: https://pdfs.semanticscholar.org/3bff/92a2028f0ed5997b2687ba5924f5cb30ef16.pdf (accessed on 12 January 2005).
- Kshetri, N. Big Data’s impact on privacy, security and consumer welfare. Telecommun. Policy 2014, 38, 1134–1145. [Google Scholar] [CrossRef]
- King, N.J.; Jessen, P.W. Profiling the mobile customer–Privacy concerns when behavioural advertisers target mobile phones–Part I. Comput. Law Secur. Rev. 2010, 26, 455–478. [Google Scholar] [CrossRef]
- Lejoyeux, M.; Weinstein, A. Shopping Addiction; Academic Press: Cambridge, MA, USA, 2013. [Google Scholar]
- Nawaz, A.; Vveinhardt, J.; Ahmed, R.R. Impact of Word of Mouth on Consumer Buying Decision. Eur. J. Bus. Manag. 2014, 6, 394–403. [Google Scholar]
- Al Mana, A.M.; Mirza, A.A. The impact of electronic word of mouth on consumers’ purchasing decisions. Int. J. Comput. Appl. 2013, 82, 23–31. [Google Scholar]
- Li, J.; Yu, H. An Innovative Marketing Model Based on AIDA: A Case from E-bank Campus-marketing by China Construction Bank. iBusiness 2013, 5, 47–51. [Google Scholar] [CrossRef]
- Hair, J.F. Multivariate Data Analysis; Pearson Education: Upper Saddle River, NJ, USA, 2010. [Google Scholar]
- Gravetter, F.; Forzano, L. Research Methods for the Behavioral Sciences; Cengage Learning: Boston, MA, USA; 2012. [Google Scholar]
- Kline, R.B. Principles and Practice of Structural Equation Modeling; Guilford Publications: New York, NY, USA, 2015. [Google Scholar]
- Gefen, D. Customer loyalty in e-commerce. J. Assoc. Inf. Syst. 2002, 3, 27–51. [Google Scholar]
- Kuo, Y.F.; Wu, C.M.; Deng, W.J. The relationships among service quality, perceived value, customer satisfaction, and post-purchase intention in mobile value-added services. Comput. Hum. Behav. 2009, 25, 887–896. [Google Scholar] [CrossRef]
- Zhang, Y.; Fang, Y.; Wei, K.K.; Ramsey, E.; McCole, P.; Chen, H. Repurchase intention in B2C e-commerce—A relationship quality perspective. Inf. Manag. 2011, 48, 192–200. [Google Scholar] [CrossRef]
- Vietnam E-commerce and Information Technology Agency. Vietnam E-commerce Report 2015; Ministry of Industry and Trade: Hanoi, Vietnam, 2016.
- Vietnam E-commerce and Information Technology Agency. Vietnam E-commerce Report 2013; Ministry of Industry and Trade: Hanoi, Vietnam, 2014.
- Vietnam E-commerce and Information Technology Agency. Vietnam E-commerce Report 2014; Ministry of Industry and Trade: Hanoi, Vietnam, 2015.
- Tang, M.; Wu, Z. Research on the mechanisms of Big Data on consumer behavior using the models of C2C e-commerce and countermeasures. Afr. J. Bus. Manag. 2015, 9, 18–34. [Google Scholar]
- Maichum, K.; Parichatnon, S.; Peng, K.-C. Application of the Extended Theory of Planned Behavior Model to Investigate Purchase Intention of Green Products among Thai Consumers. Sustainability 2016, 8, 1077. [Google Scholar] [CrossRef]
- Kaiser, H.F. The varimax criterion for analytic rotation in factor analysis. Psychometrika 1958, 23, 187–200. [Google Scholar] [CrossRef]
- Fornell, C.; Larcker, D.F. Evaluating structural equation models with unobservable variables and measurement error. J. Mark. Res. 1981, 18, 39–50. [Google Scholar] [CrossRef]
- Tabachnick, B.G.; Fidell, L.S.; Osterlind, S.J. Using Multivariate Statistics; Pearson Education: Upper Saddle River, NJ, USA, 2001. [Google Scholar]
- Hair, J.F.; Sarstedt, M.; Ringle, C.M.; Mena, J.A. An assessment of the use of partial least squares structural equation modeling in marketing research. J. Acad. Mark. Sci. 2012, 40, 414–433. [Google Scholar] [CrossRef]
- Hoe, S.L. Issues and procedures in adopting structural equation modeling technique. J. Appl. Quant. Methods 2008, 3, 76–83. [Google Scholar]
- Stoicescu, C. Big Data, the perfect instrument to study today’s consumer behavior. Database Syst. J. 2016, 6, 28–42. [Google Scholar]
- Komiak, S.Y.; Benbasat, I. A two-process view of trust and distrust building in recommendation agents: A process-tracing study. J. Assoc. Inf. Syst. 2008, 9, 727–747. [Google Scholar]
- Lewicki, R.J.; McAllister, D.J.; Bies, R.J. Trust and distrust: New relationships and realities. Acad. Manag. Rev. 1998, 23, 438–458. [Google Scholar]
- McKnight, D.H.; Kacmar, C.J.; Choudhury, V. Dispositional trust and distrust distinctions in predicting high-and low-risk internet expert advice site perceptions. E-Serv. J. 2004, 3, 35–55. [Google Scholar] [CrossRef]


| Variables | Valid | Frequency | Percent (%) |
|---|---|---|---|
| Gender | Male | 103 | 37.7 |
| Female | 170 | 62.3 | |
| How many times per month have you accessed in e-commerce website? | Not at all | 47 | 17.2 |
| 1–2 times | 79 | 28.9 | |
| 3–4 times | 57 | 20.9 | |
| More than 4 times | 90 | 33.0 | |
| Kind of product was chosen for survey | Fashion item | 140 | 51.3 |
| Electronics item | 133 | 48.7 |
| Construct | Variable | Items | Measurement | References |
|---|---|---|---|---|
| Positive factor | Information Search (IS) | IS1 | I am able to search the useful information in the e-shopping website | [48] |
| IS2 | The information I search in the e-shopping site are detailed and completed | |||
| IS3 | The result is provided quickly and fit to my need | |||
| IS4 | Search result provided by shopping website is very realistic. | |||
| Recommendation System (RS) | RS1 | Shopping website can recommend substitute goods for the product I want to buy. | [48] | |
| RS2 | Shopping website can recommend complementary goods for the product I want to buy. | |||
| RS3 | Shopping website can recommend for you some product may be you like or best sellers of website | |||
| RS4 | I believe that the recommendation information is an act of kindness. | |||
| Dynamic Pricing (PD) | PD1 | Providing different prices for individual customer at the same time | New measurement | |
| PD2 | Offer different prices at different time | |||
| PD3 | Providing different prices with different substitute products | |||
| PD4 | Providing different prices with different conditions on the same product | |||
| Customer Services (CS) | CS1 | The website provides channel to support customers | [48] | |
| CS2 | I expect that I am able to track my order | |||
| CS3 | The shopping website which provides virtual experience can let me choose more suitable goods. | |||
| CS4 | I can refer to the reviews of customers who bought the products before | |||
| Negative factor | Privacy and data Security (PS) | PS1 | Attracting a great deal of attention from cybercriminals | New measurement |
| PS2 | Customer’s personal information will be stolen | |||
| PS3 | My information about payment method will be stolen | |||
| Shopping Addiction (SA) | SA1 | Spending a lot of time to review products | [35] | |
| SA2 | I have often bought a product that I did not need, while knowing that I had very little money left | |||
| SA3 | As soon as I enter a shopping website, I have an irresistible urge to go into a shop and buy something | |||
| SA4 | I have felt somewhat guilty after buying a product, because it seemed unreasonable | |||
| Group Influences (GI) | GI1 | When I buy a product online, the reviews presented on the website are helpful for my decision making | [37] | |
| GI2 | Reviews posted on the website affect my purchase decision | |||
| GI3 | Reviewers’ rating of usefulness of the review affects my purchase decision | |||
| GI4 | Popularity of web site that present the reviews affect my purchase decision | |||
| Customer Responses (CR) | Customer Intention (CI) | CAI1 | The applications on website catches my attention | [10,11] |
| CAI2 | I had trying to read that information | |||
| CI1 | Continuously pay attention | |||
| CI2 | I want to get more information | |||
| Customer Behavior (CB) | CD1 | I want to buy the product | ||
| CD2 | I will continue to use this webpage for shopping. | |||
| CAC1 | I will have action to buy | |||
| CAC2 | I will introduce this webpage to my friends and family. |
| Mean | Std | IS | RS | PD | CS | PS | SA | GI | CI | CB | |
|---|---|---|---|---|---|---|---|---|---|---|---|
| IS—Information Search | 5.138 | 0.872 | 1 | ||||||||
| RS—Recommendation System | 5.217 | 0.858 | 0.871 ** | 1 | |||||||
| PD—Dynamic Pricing | 5.293 | 0.871 | 0.807 ** | 0.819 ** | 1 | ||||||
| CS—Customer Services | 5.202 | 0.883 | 0.806 ** | 0.818 ** | 0.802 ** | 1 | |||||
| PS—Privacy and Security | 3.651 | 1.035 | −0.157 ** | −0.141 * | −0.133 * | −0.108 | 1 | ||||
| SA—Shopping Addiction | 3.823 | 0.970 | −0.110 | −0.104 | −0.120 * | −0.084 | 0.690 ** | 1 | |||
| GI—Group Influence | 3.696 | 0.887 | −0.115 | −0.135 * | −0.093 | −0.094 | 0.679 ** | 0.584 ** | 1 | ||
| CI—Customer Intention | 5.606 | 0.890 | 0.675 ** | 0.662 ** | 0.645 ** | 0.617 ** | −0.127 * | −0.130 * | −0.140 * | 1 | |
| CB—Customer Behavior | 5.656 | 0.937 | 0.629 ** | 0.608 ** | 0.575 ** | 0.579 ** | −0.280 ** | −0.201 ** | −0.214 ** | 0.754 ** | 1 |
| Component | Factor Loading | |
|---|---|---|
| 1 (Positive Factor) | 2 (Negative Factor) | |
| IS—Information Search | 0.934 | |
| RS—Recommendation System | 0.941 | |
| PD—Dynamic Pricing | 0.919 | |
| CS—Customer Services | 0.920 | |
| PS—Privacy and Security | 0.900 | |
| SA—Shopping Addiction | 0.862 | |
| GI—Group Influence | 0.857 | |
| Construct | Item | Standardized Factor Loading | Composite Reliability (CR) | Average Variance Extracted (AVE) |
|---|---|---|---|---|
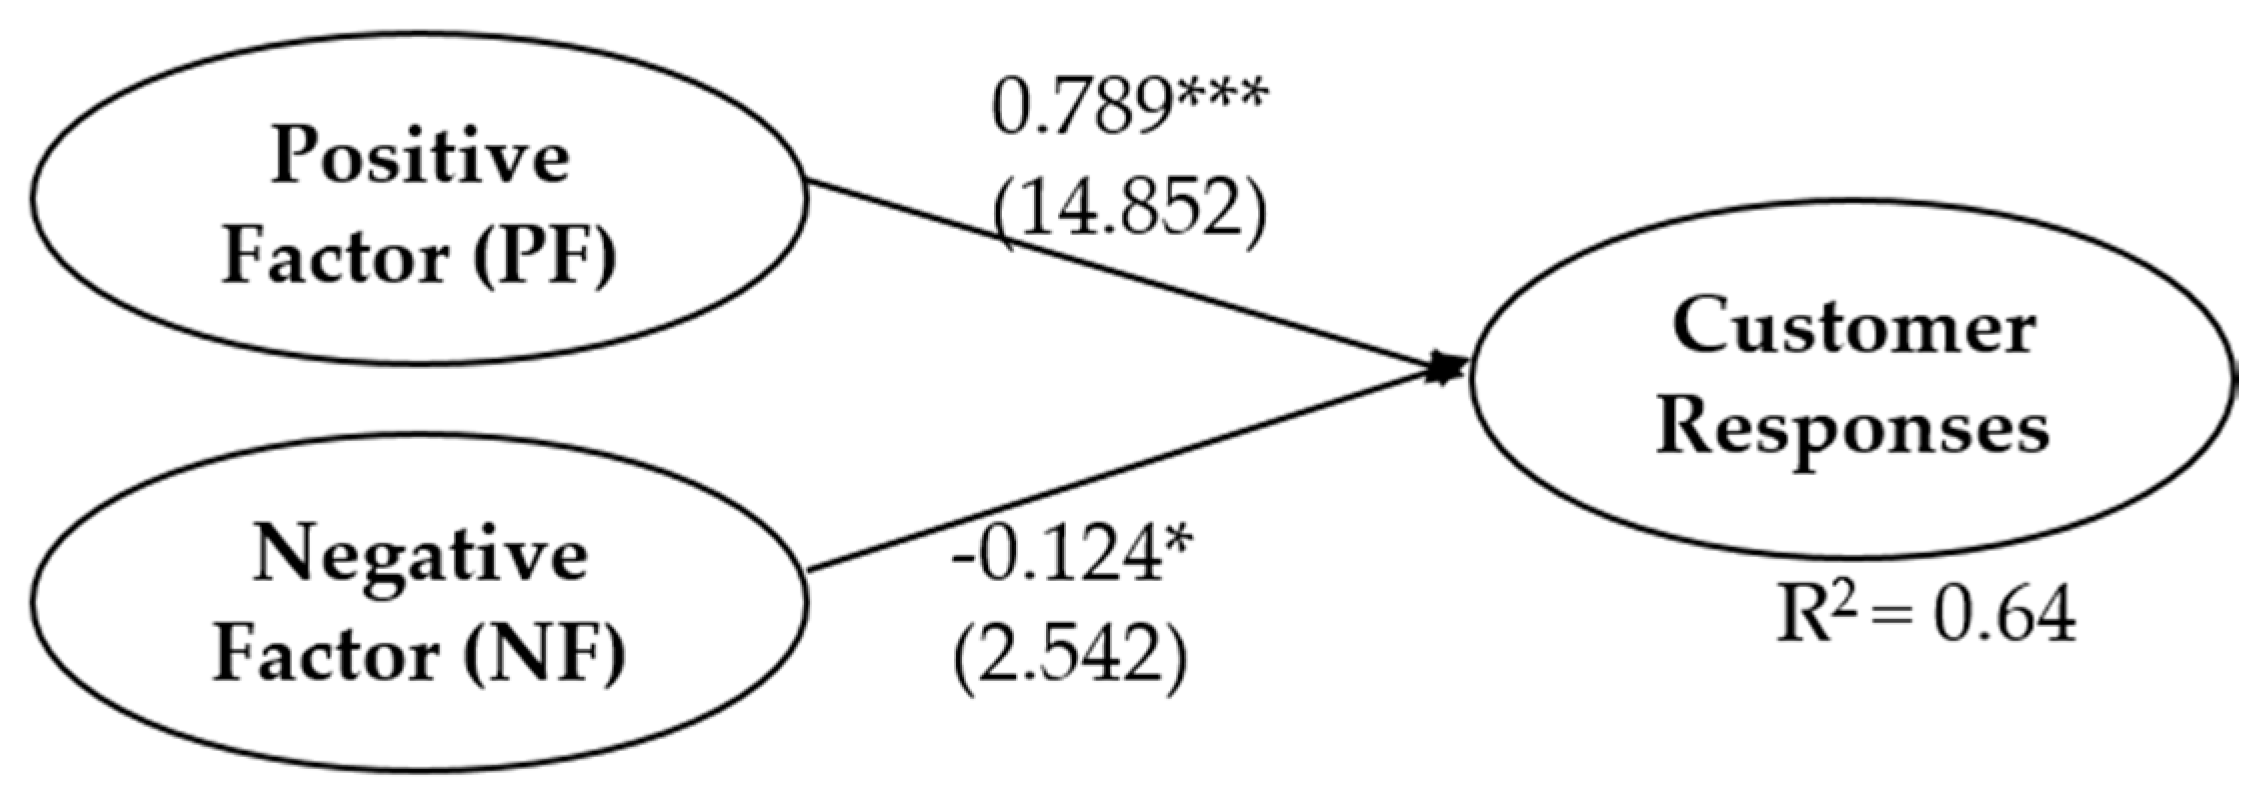
| Positive Factors (PF) | IS | 0.789 *** | 0.927 | 0.762 |
| RS | 0.933 a | |||
| PD | 0.883 *** | |||
| CS | 0.881 *** | |||
| Negative Factors (NF) | PS | 0.895 *** | 0.851 | 0.657 |
| SA | 0.771 a | |||
| GI | 0.759 *** | |||
| Customer Responses (CR) | CATI | 0.888 a | 0.857 | 0.749 |
| CDAC | 0.843 *** |
| Positive Factors (PF) | Negative Factors (NF) | Customer Responses (CR) | |
|---|---|---|---|
| Positive Factors (PF) | 0.87 | ||
| Negative Factors (NF) | −0.16 | 0.81 | |
| Customer Responses (CR) | 0.80 | −0.24 | 0.86 |
| Fit indicates | Criteria | Indicators | Sources |
|---|---|---|---|
| Chi-square/df (degree of freedom) | 5.000 | 1.571 | [53,54] |
| Goodness of Fit Index (GFI) | 0.900 | 0.970 | |
| Adjusted Goodness of Fit Index (AGFI) | 0.900 | 0.947 | |
| Normed Fit Index (NFI) | 0.900 | 0.979 | |
| Comparative Fit Index (CFI) | 0.950 | 0.992 | |
| Root Mean Square Error of Approximation (RMSEA) | 0.080 | 0.046 |
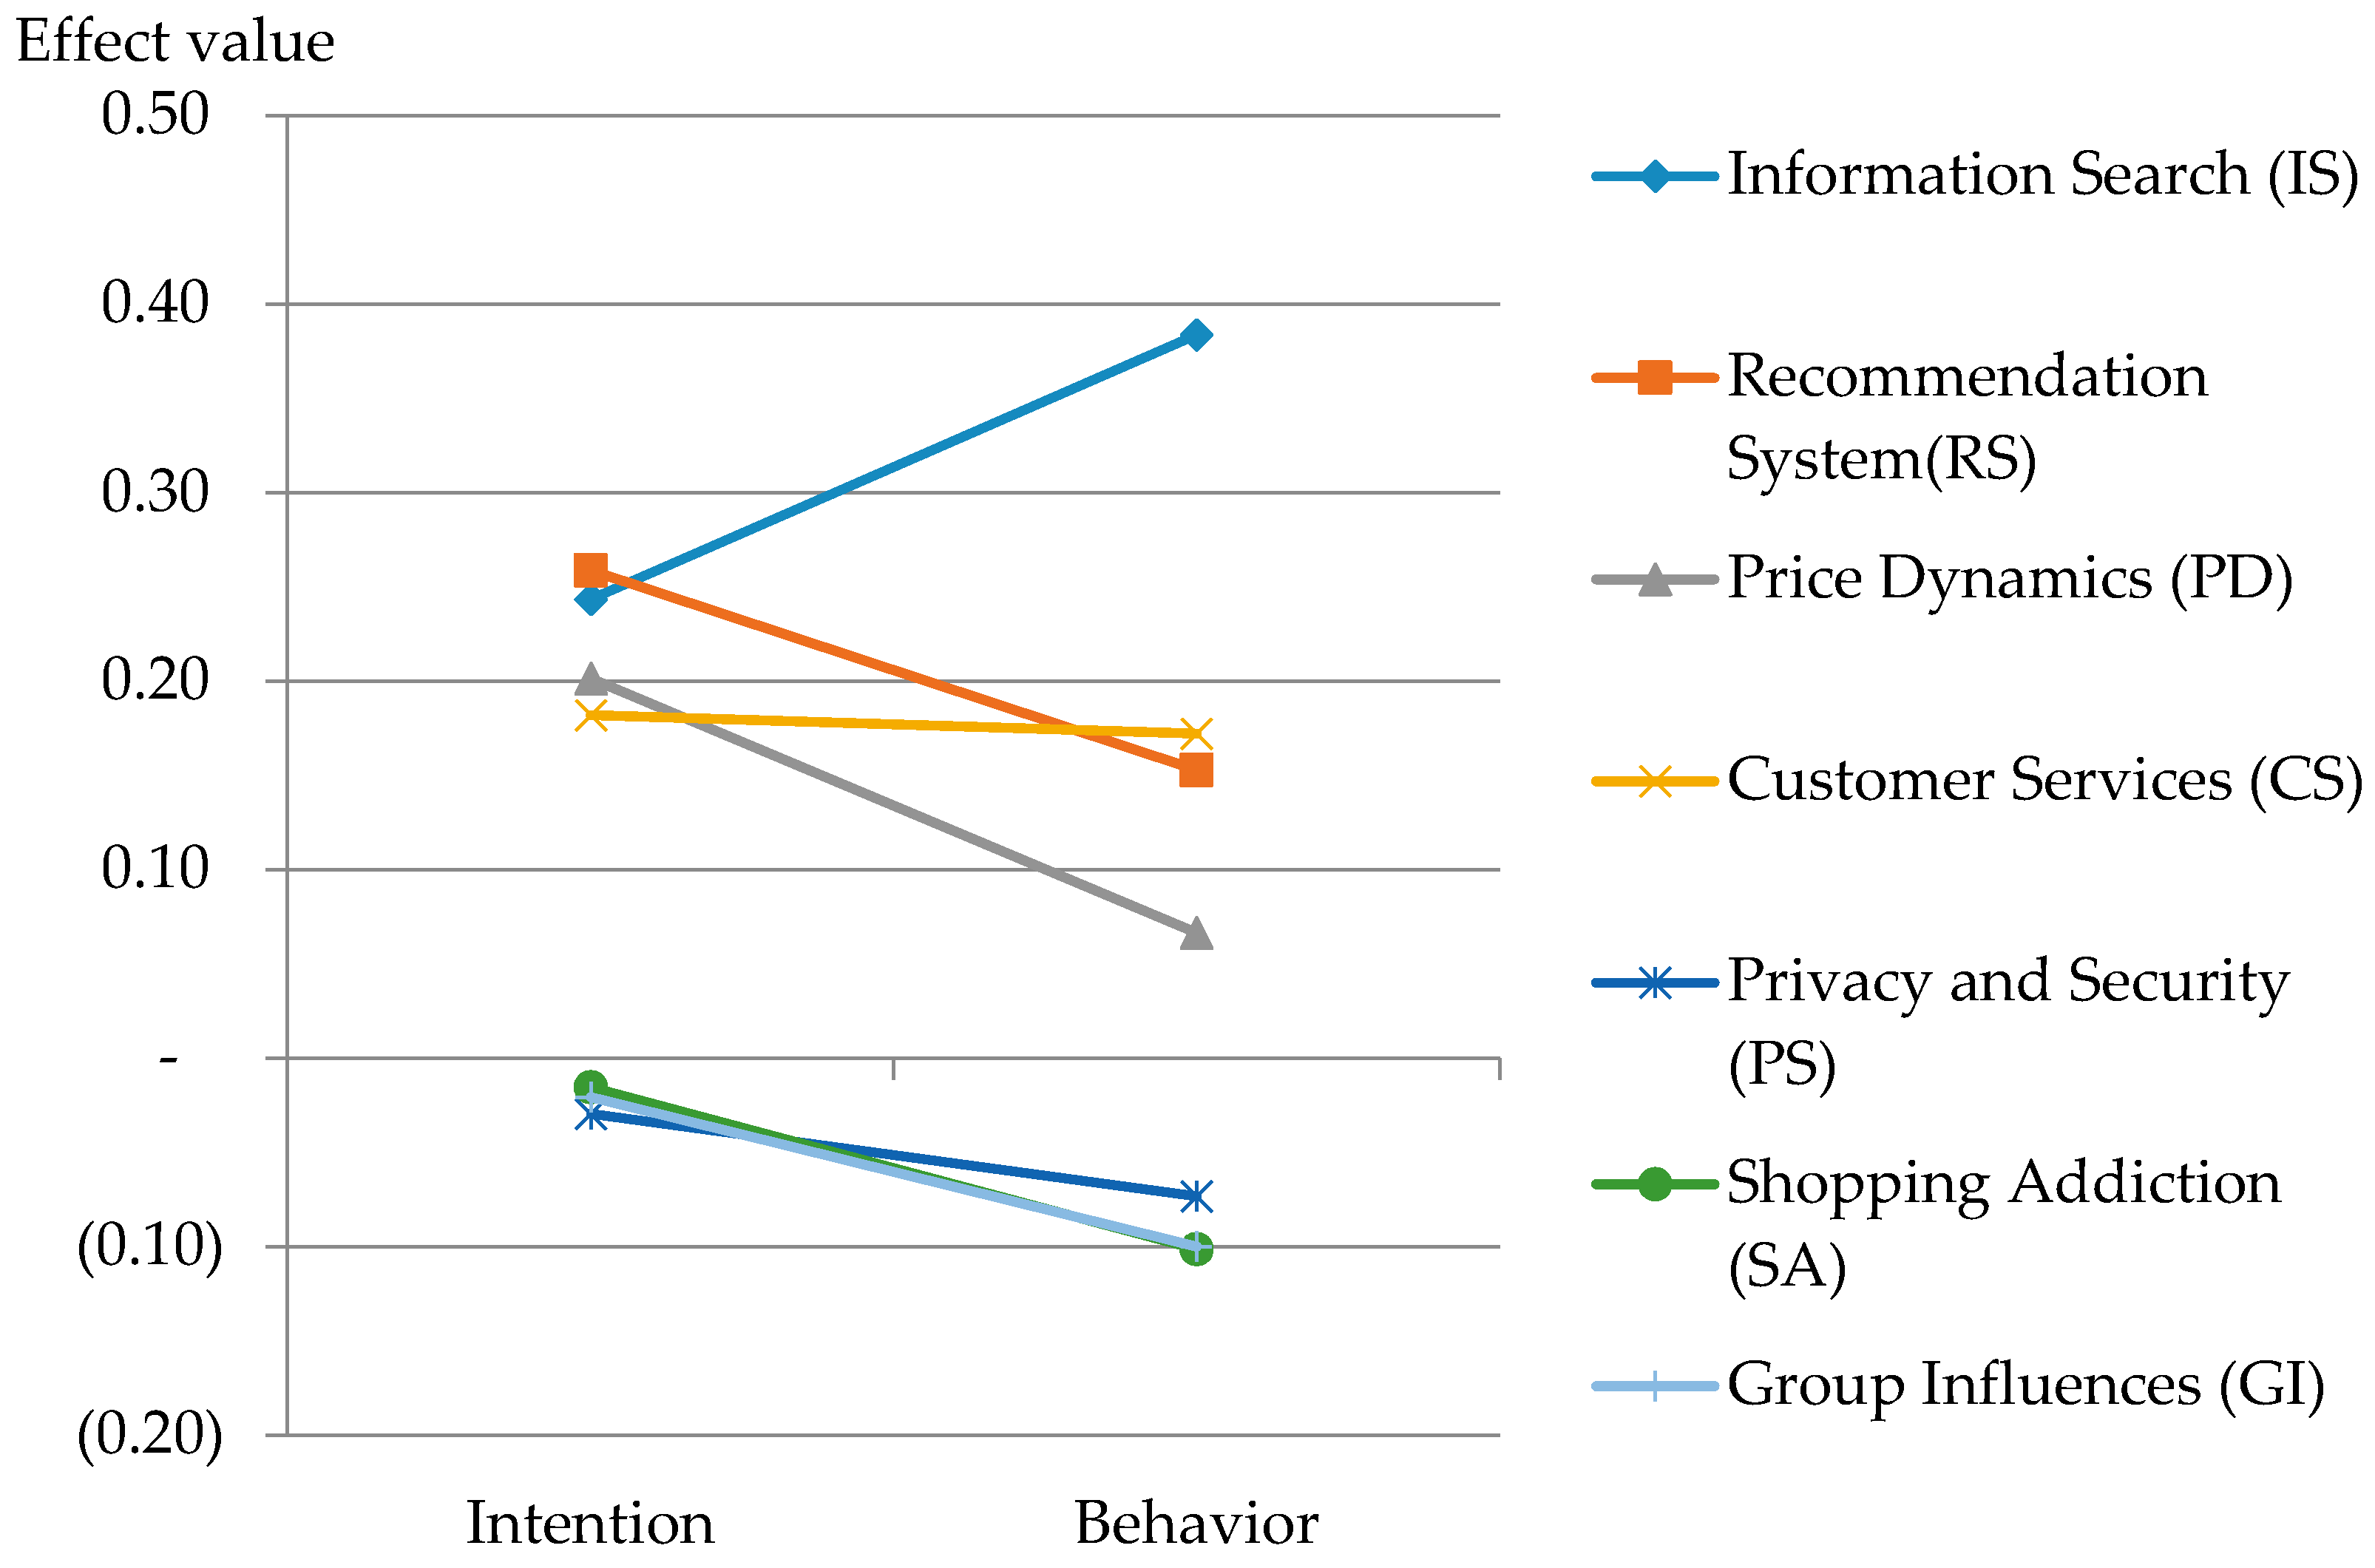
| Intention | Behavior | ||
|---|---|---|---|
| Positive Factor | Information Search (IS) | 0.244 *** | 0.384 *** |
| Recommendation System (RS) | 0.259 *** | 0.153 *** | |
| Dynamic Pricing (PD) | 0.201 *** | 0.066 ** | |
| Customer Services (CS) | 0.182 *** | 0.172 | |
| Negative Factor | Privacy and Security (PS) | −0.030 *** | −0.073 ** |
| Shopping Addiction (SA) | −0.016 *** | −0.101 * | |
| Group Influences (GI) | −0.021 *** | −0.100 * | |
| R2 | 0.493 | 0.474 |
© 2017 by the authors. Licensee MDPI, Basel, Switzerland. This article is an open access article distributed under the terms and conditions of the Creative Commons Attribution (CC BY) license (http://creativecommons.org/licenses/by/4.0/).
Share and Cite
Le, T.M.; Liaw, S.-Y. Effects of Pros and Cons of Applying Big Data Analytics to Consumers’ Responses in an E-Commerce Context. Sustainability 2017, 9, 798. https://doi.org/10.3390/su9050798
Le TM, Liaw S-Y. Effects of Pros and Cons of Applying Big Data Analytics to Consumers’ Responses in an E-Commerce Context. Sustainability. 2017; 9(5):798. https://doi.org/10.3390/su9050798
Chicago/Turabian StyleLe, Thi Mai, and Shu-Yi Liaw. 2017. "Effects of Pros and Cons of Applying Big Data Analytics to Consumers’ Responses in an E-Commerce Context" Sustainability 9, no. 5: 798. https://doi.org/10.3390/su9050798
APA StyleLe, T. M., & Liaw, S.-Y. (2017). Effects of Pros and Cons of Applying Big Data Analytics to Consumers’ Responses in an E-Commerce Context. Sustainability, 9(5), 798. https://doi.org/10.3390/su9050798