
Impact of Boundary Conditions on a Groundwater Heat Pump System Design in a Shallow and Thin Aquifer near the River


Abstract
:1. Introduction
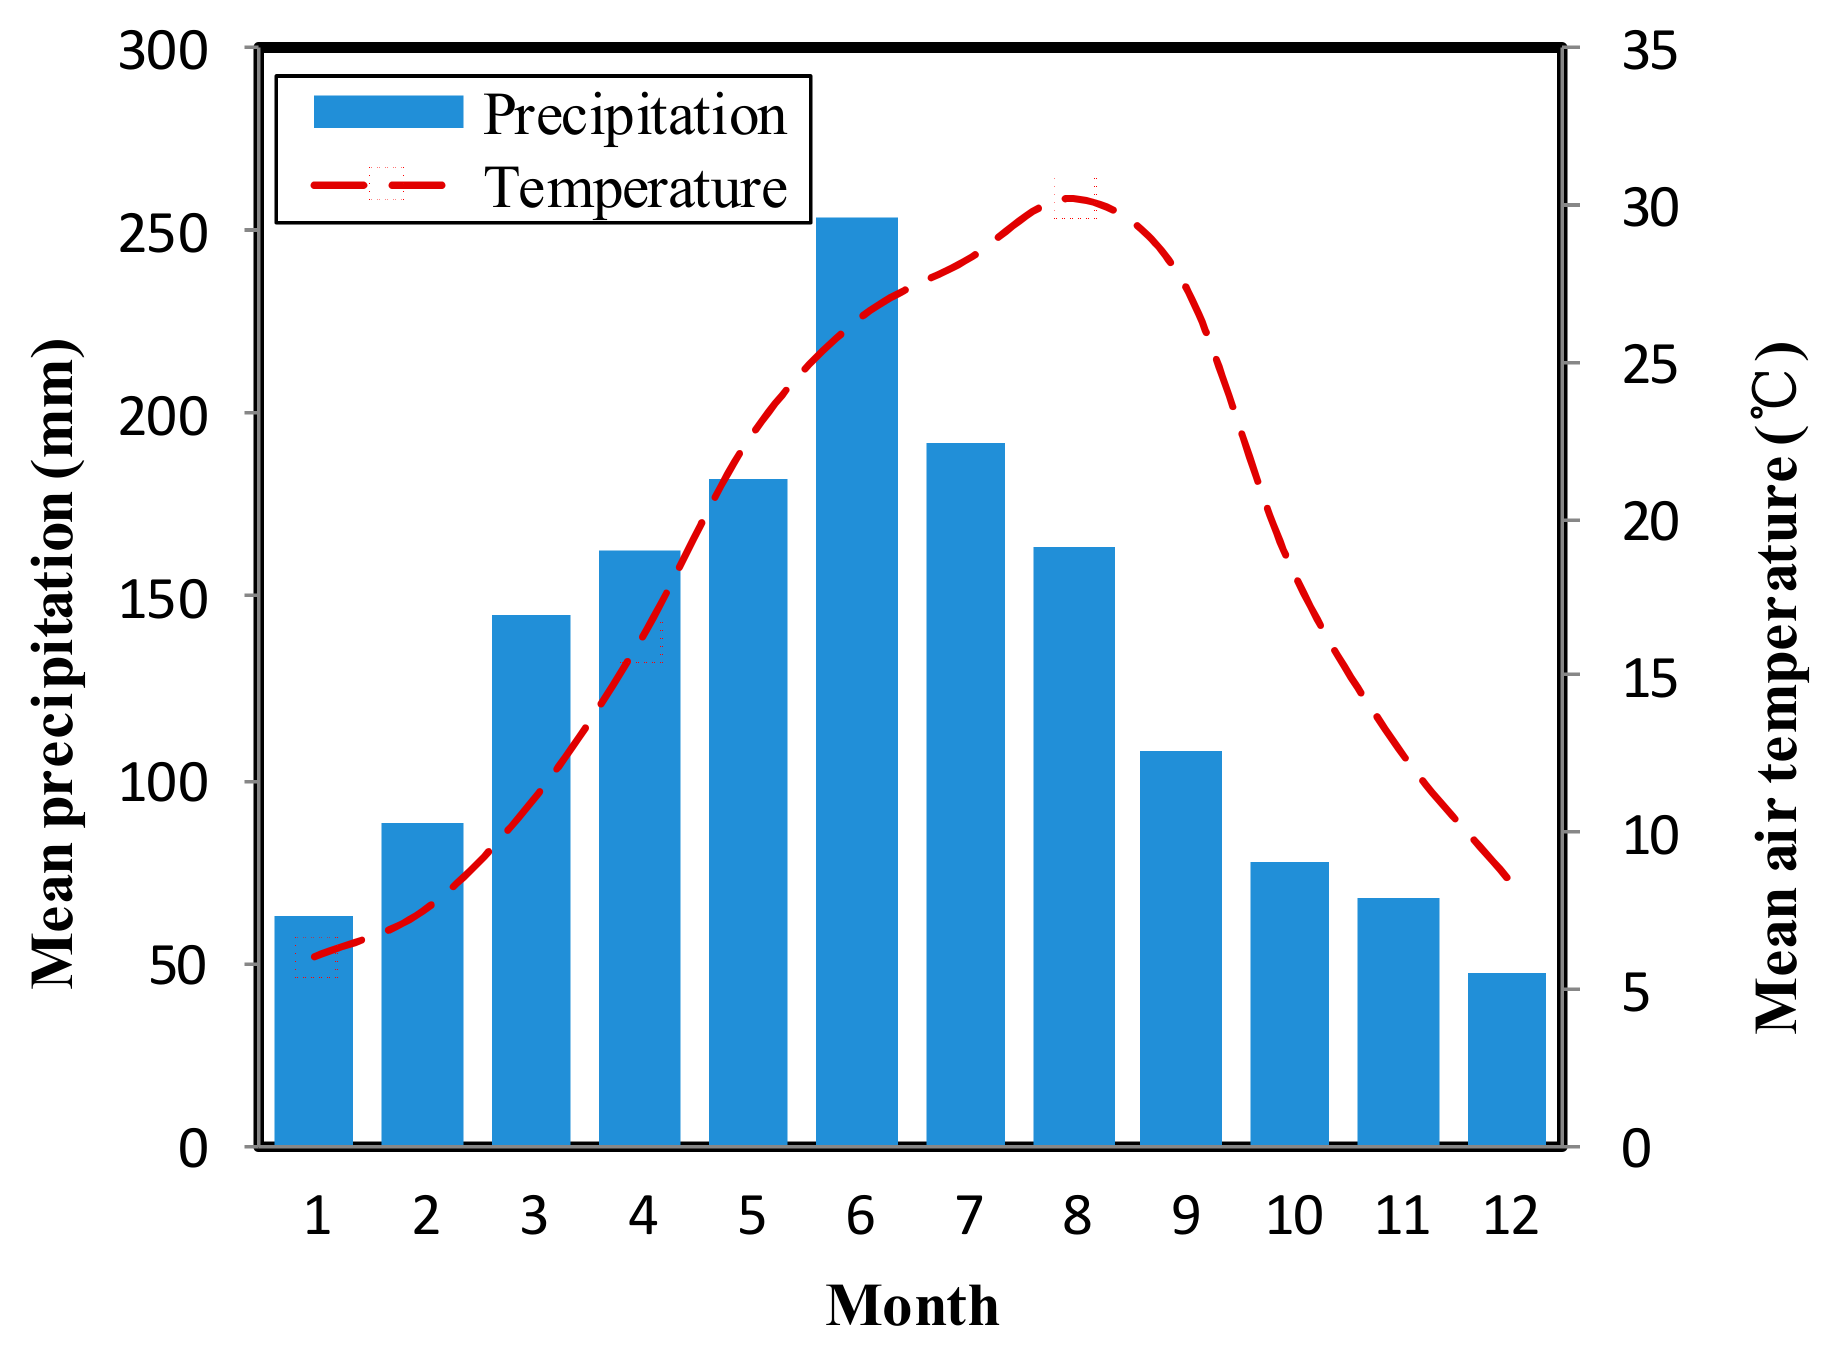
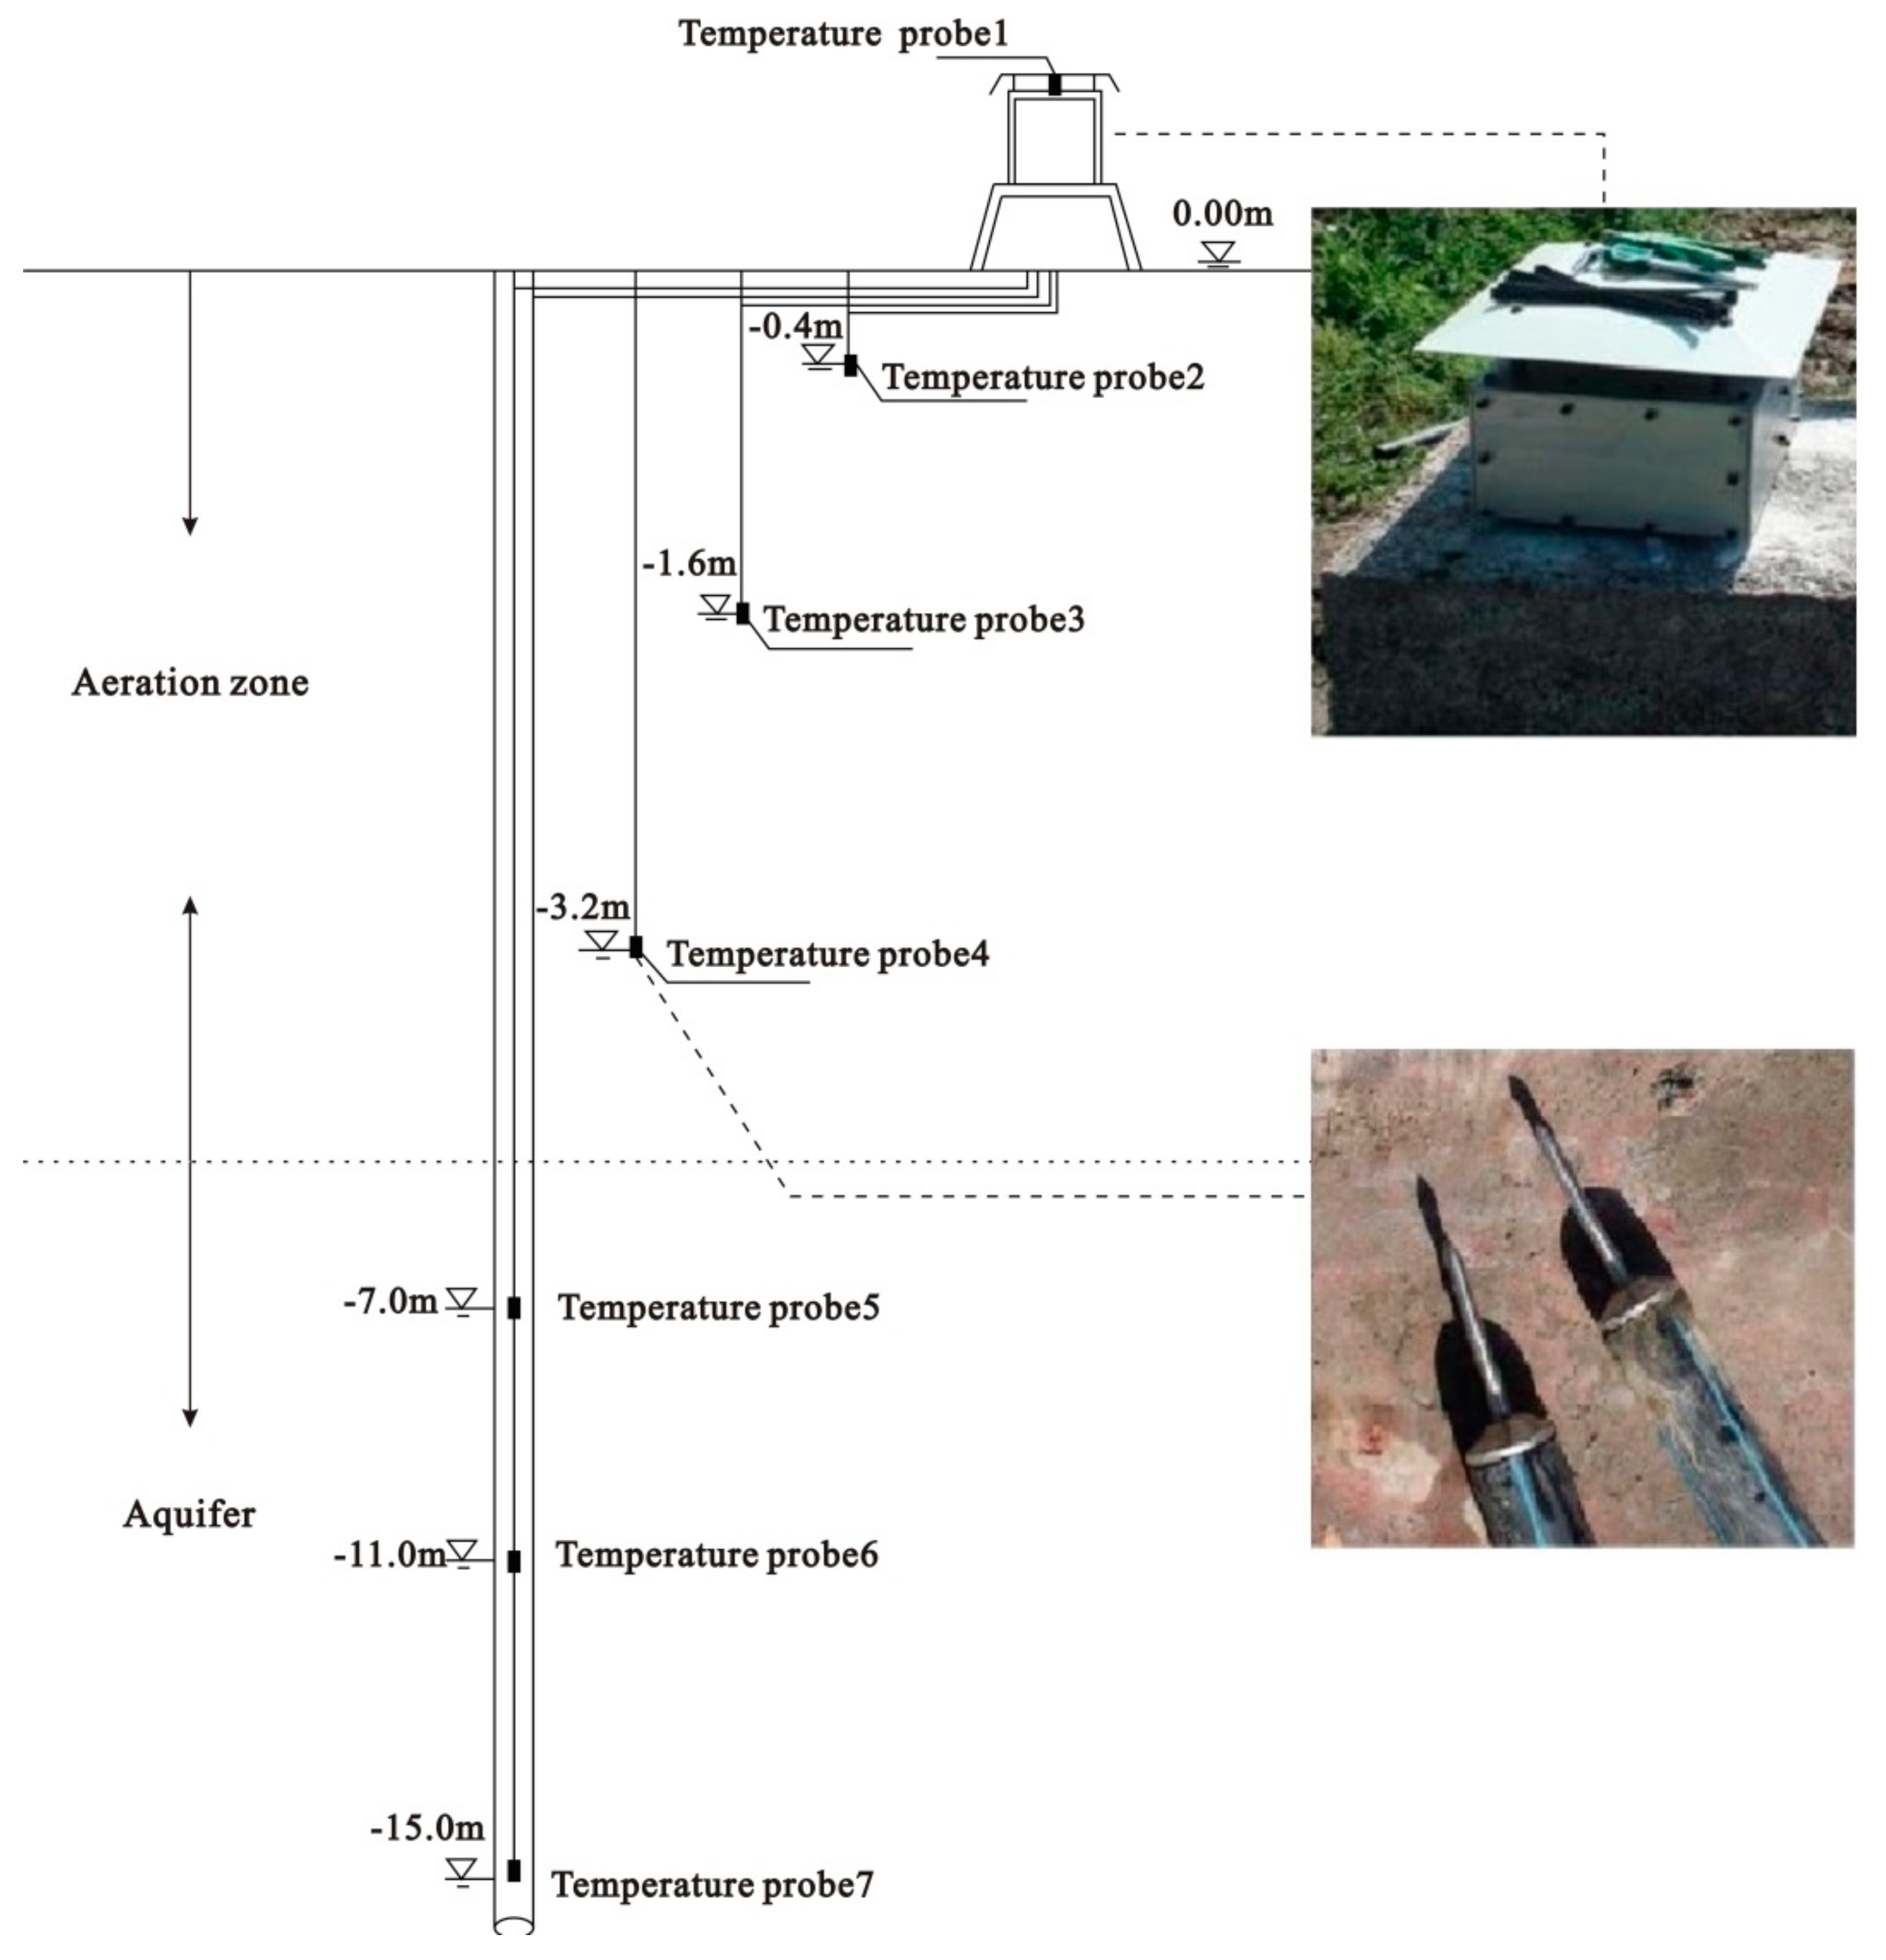
2. Study Site
3. Numerical Simulation of Groundwater Flow and Heat Transfer
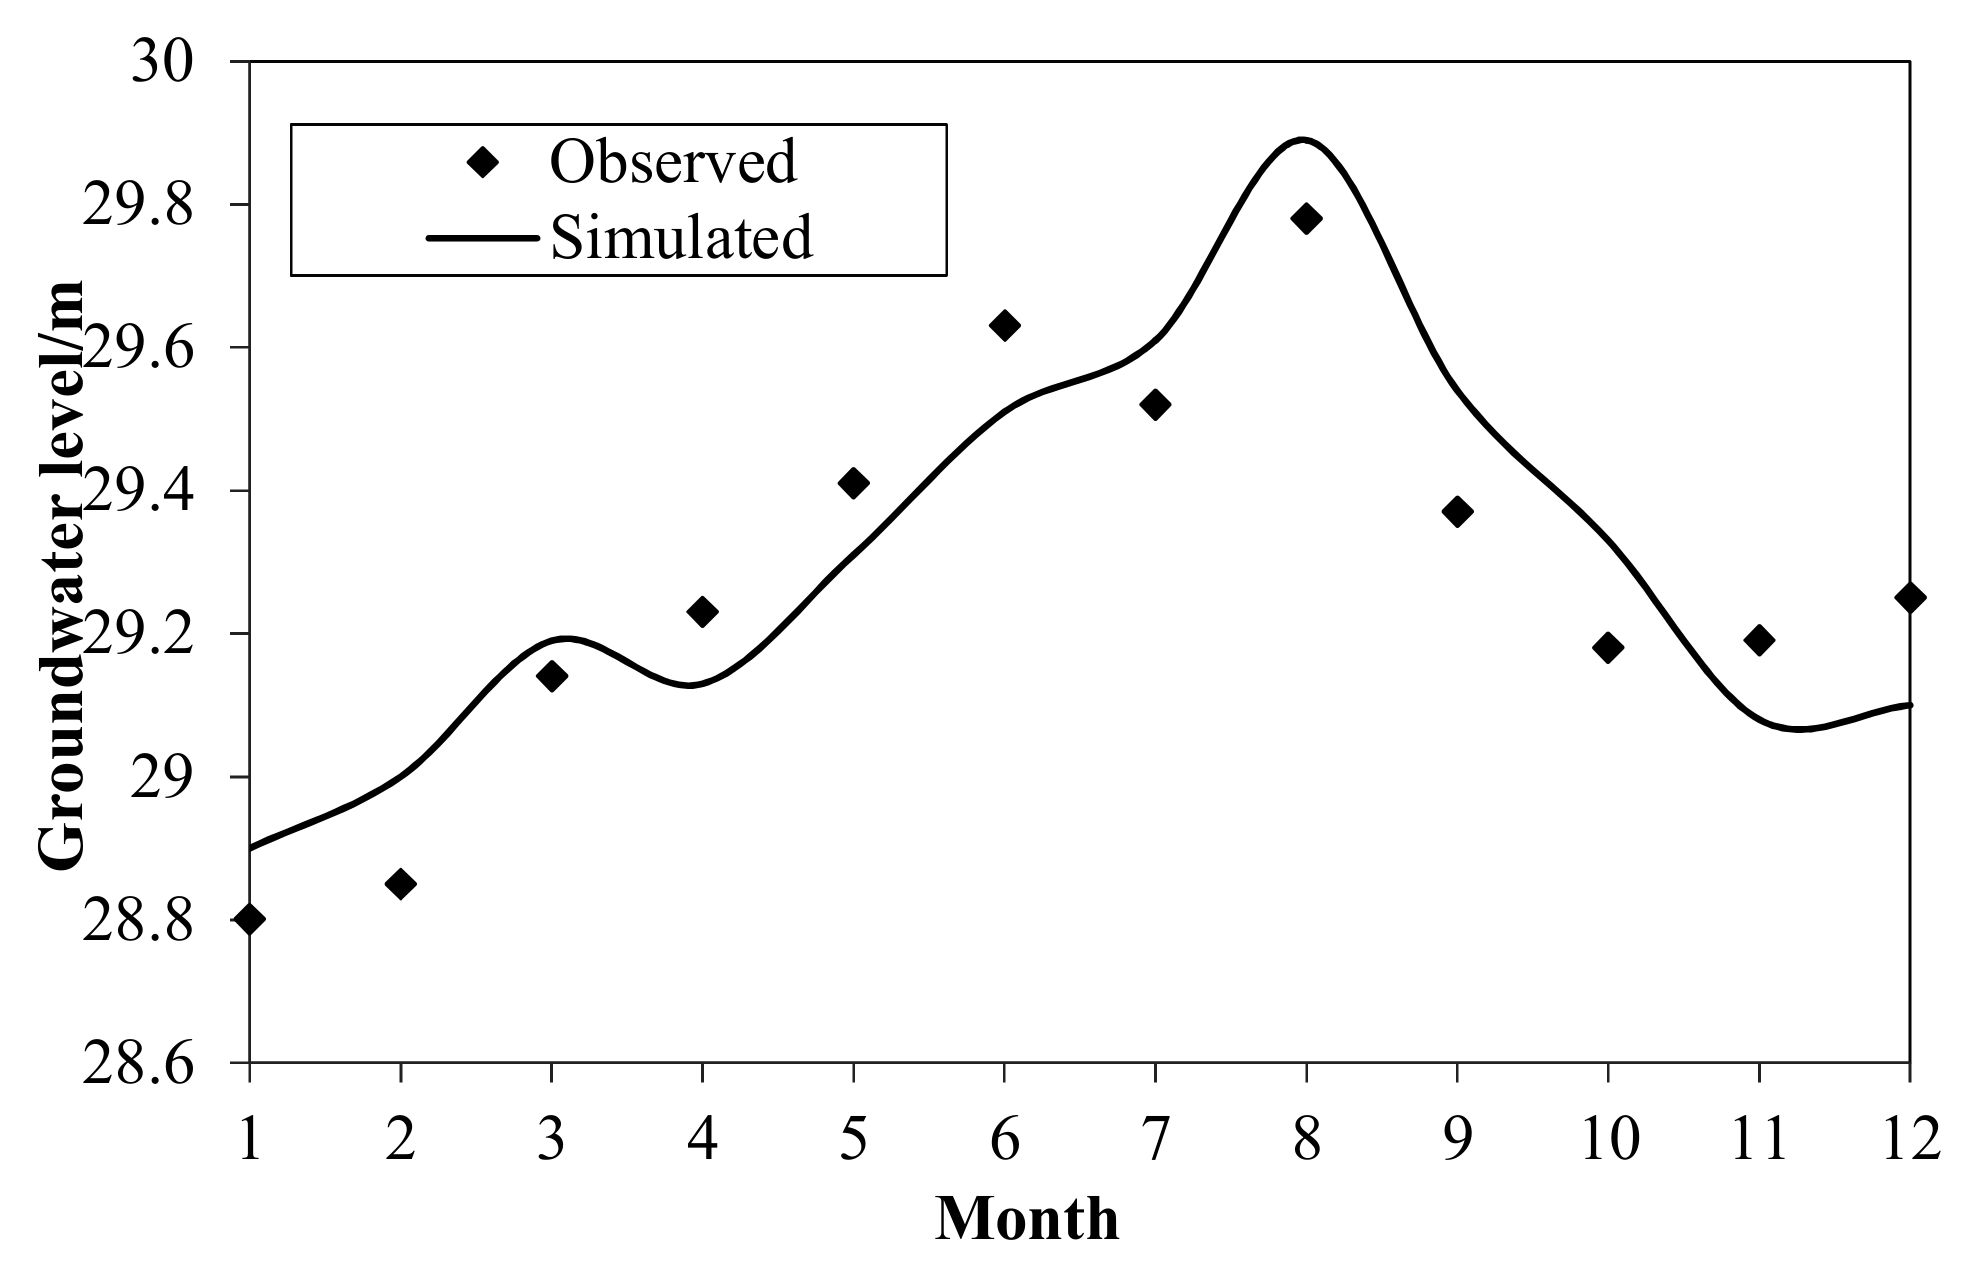
3.1. Numerical Simulation
3.2. Geological Model Generalization and Discretization
3.3. Initial and Boundary Conditions
3.4. Design Scheme of the GWHP System
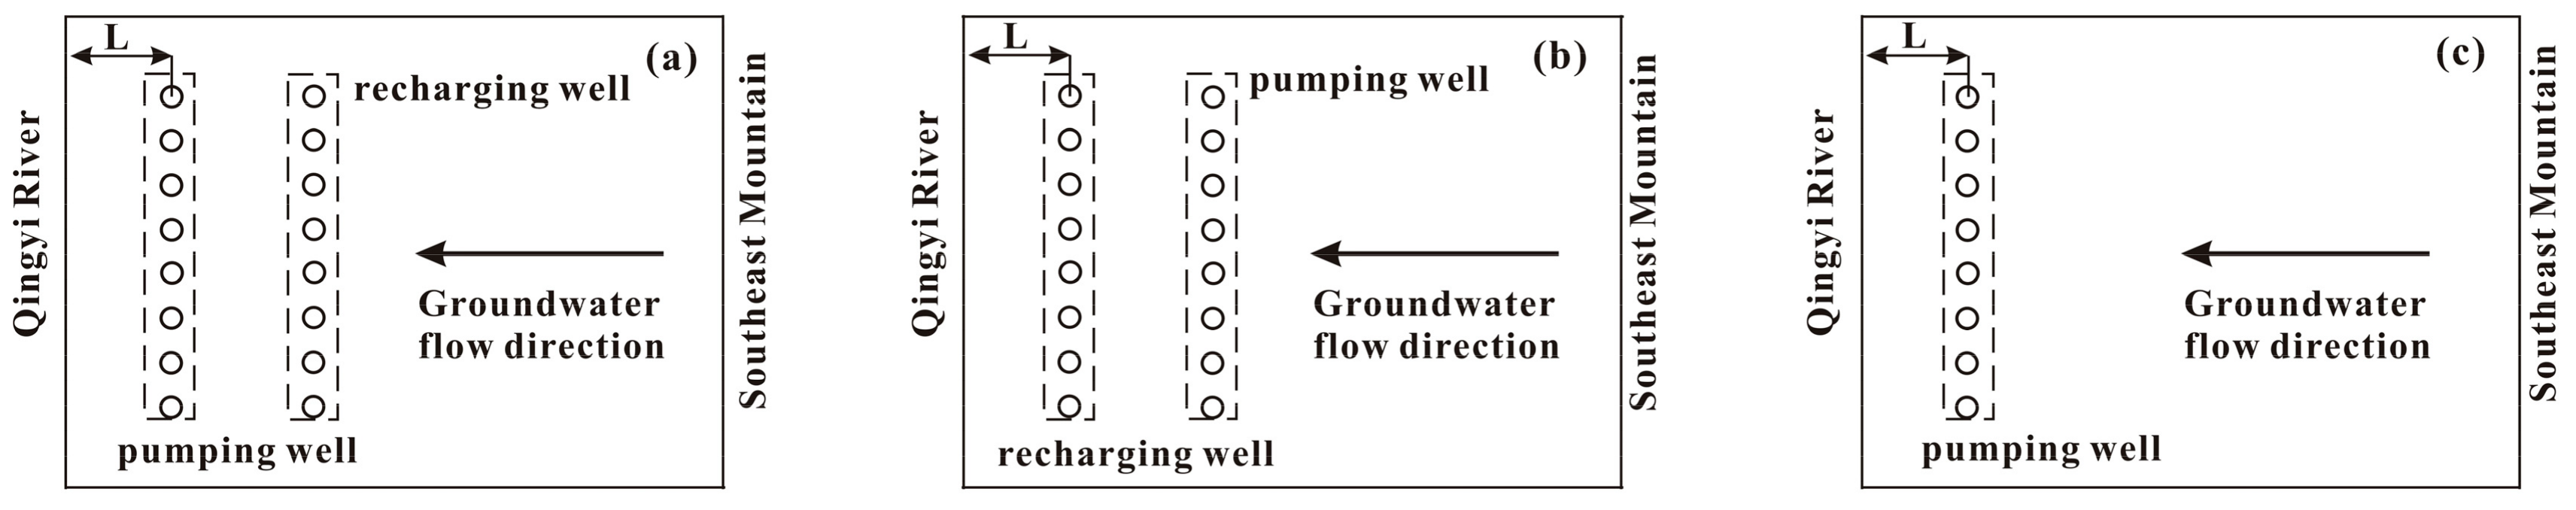
3.5. River Levels and the Positions of the Pumping-Recharging Well Group
4. Results and Discussion
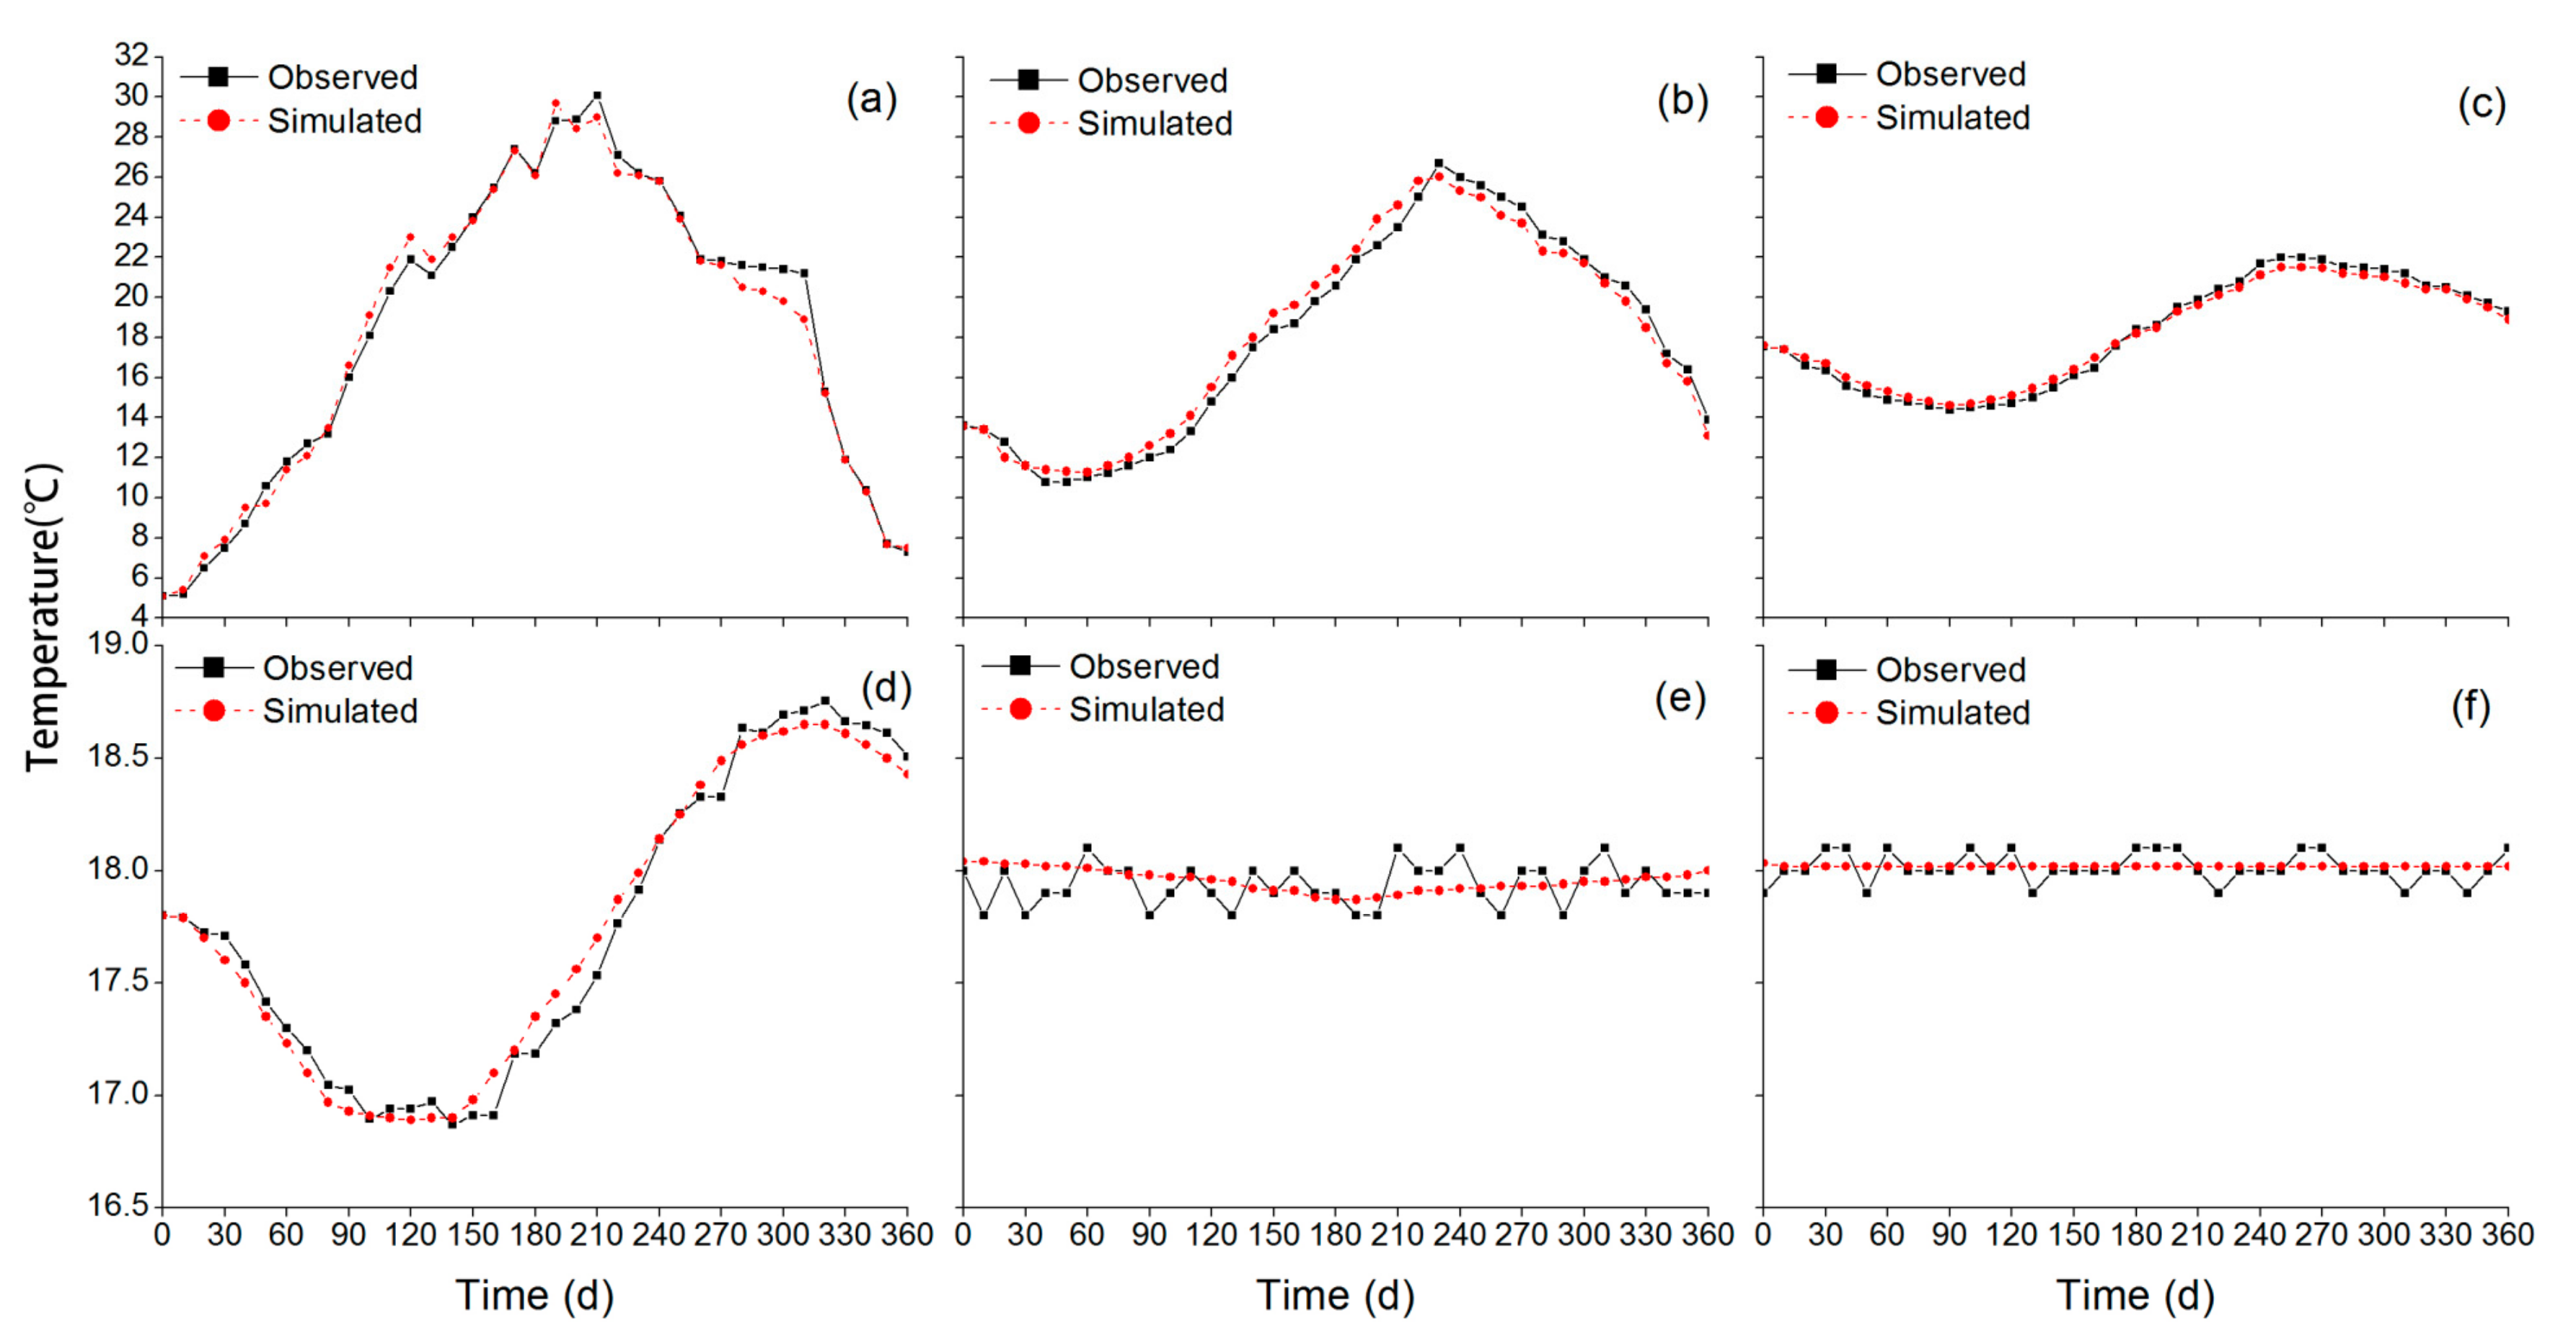
4.1. Effect of the Atmospheric Temperature
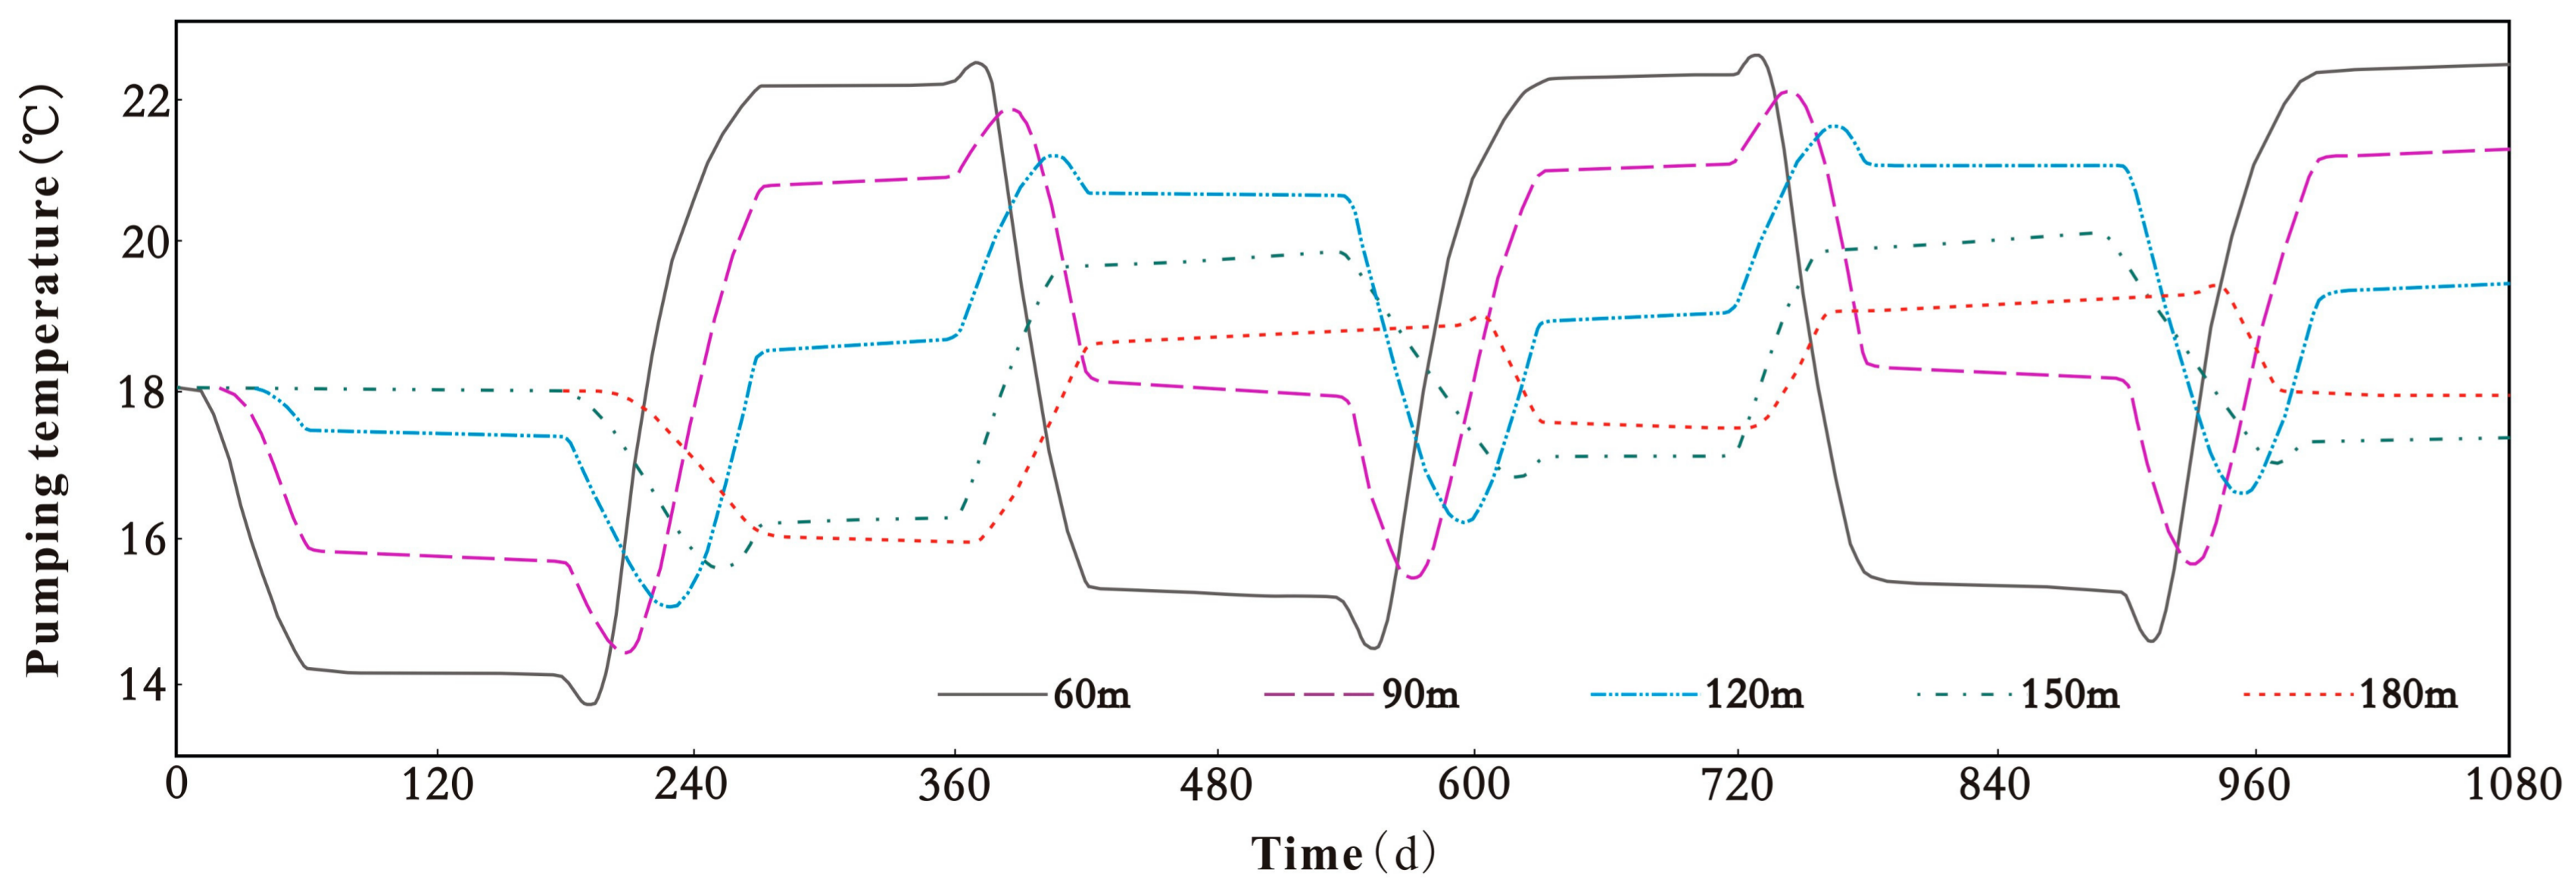
4.2. Optimal Distance between Pumping and Recharging Well Group
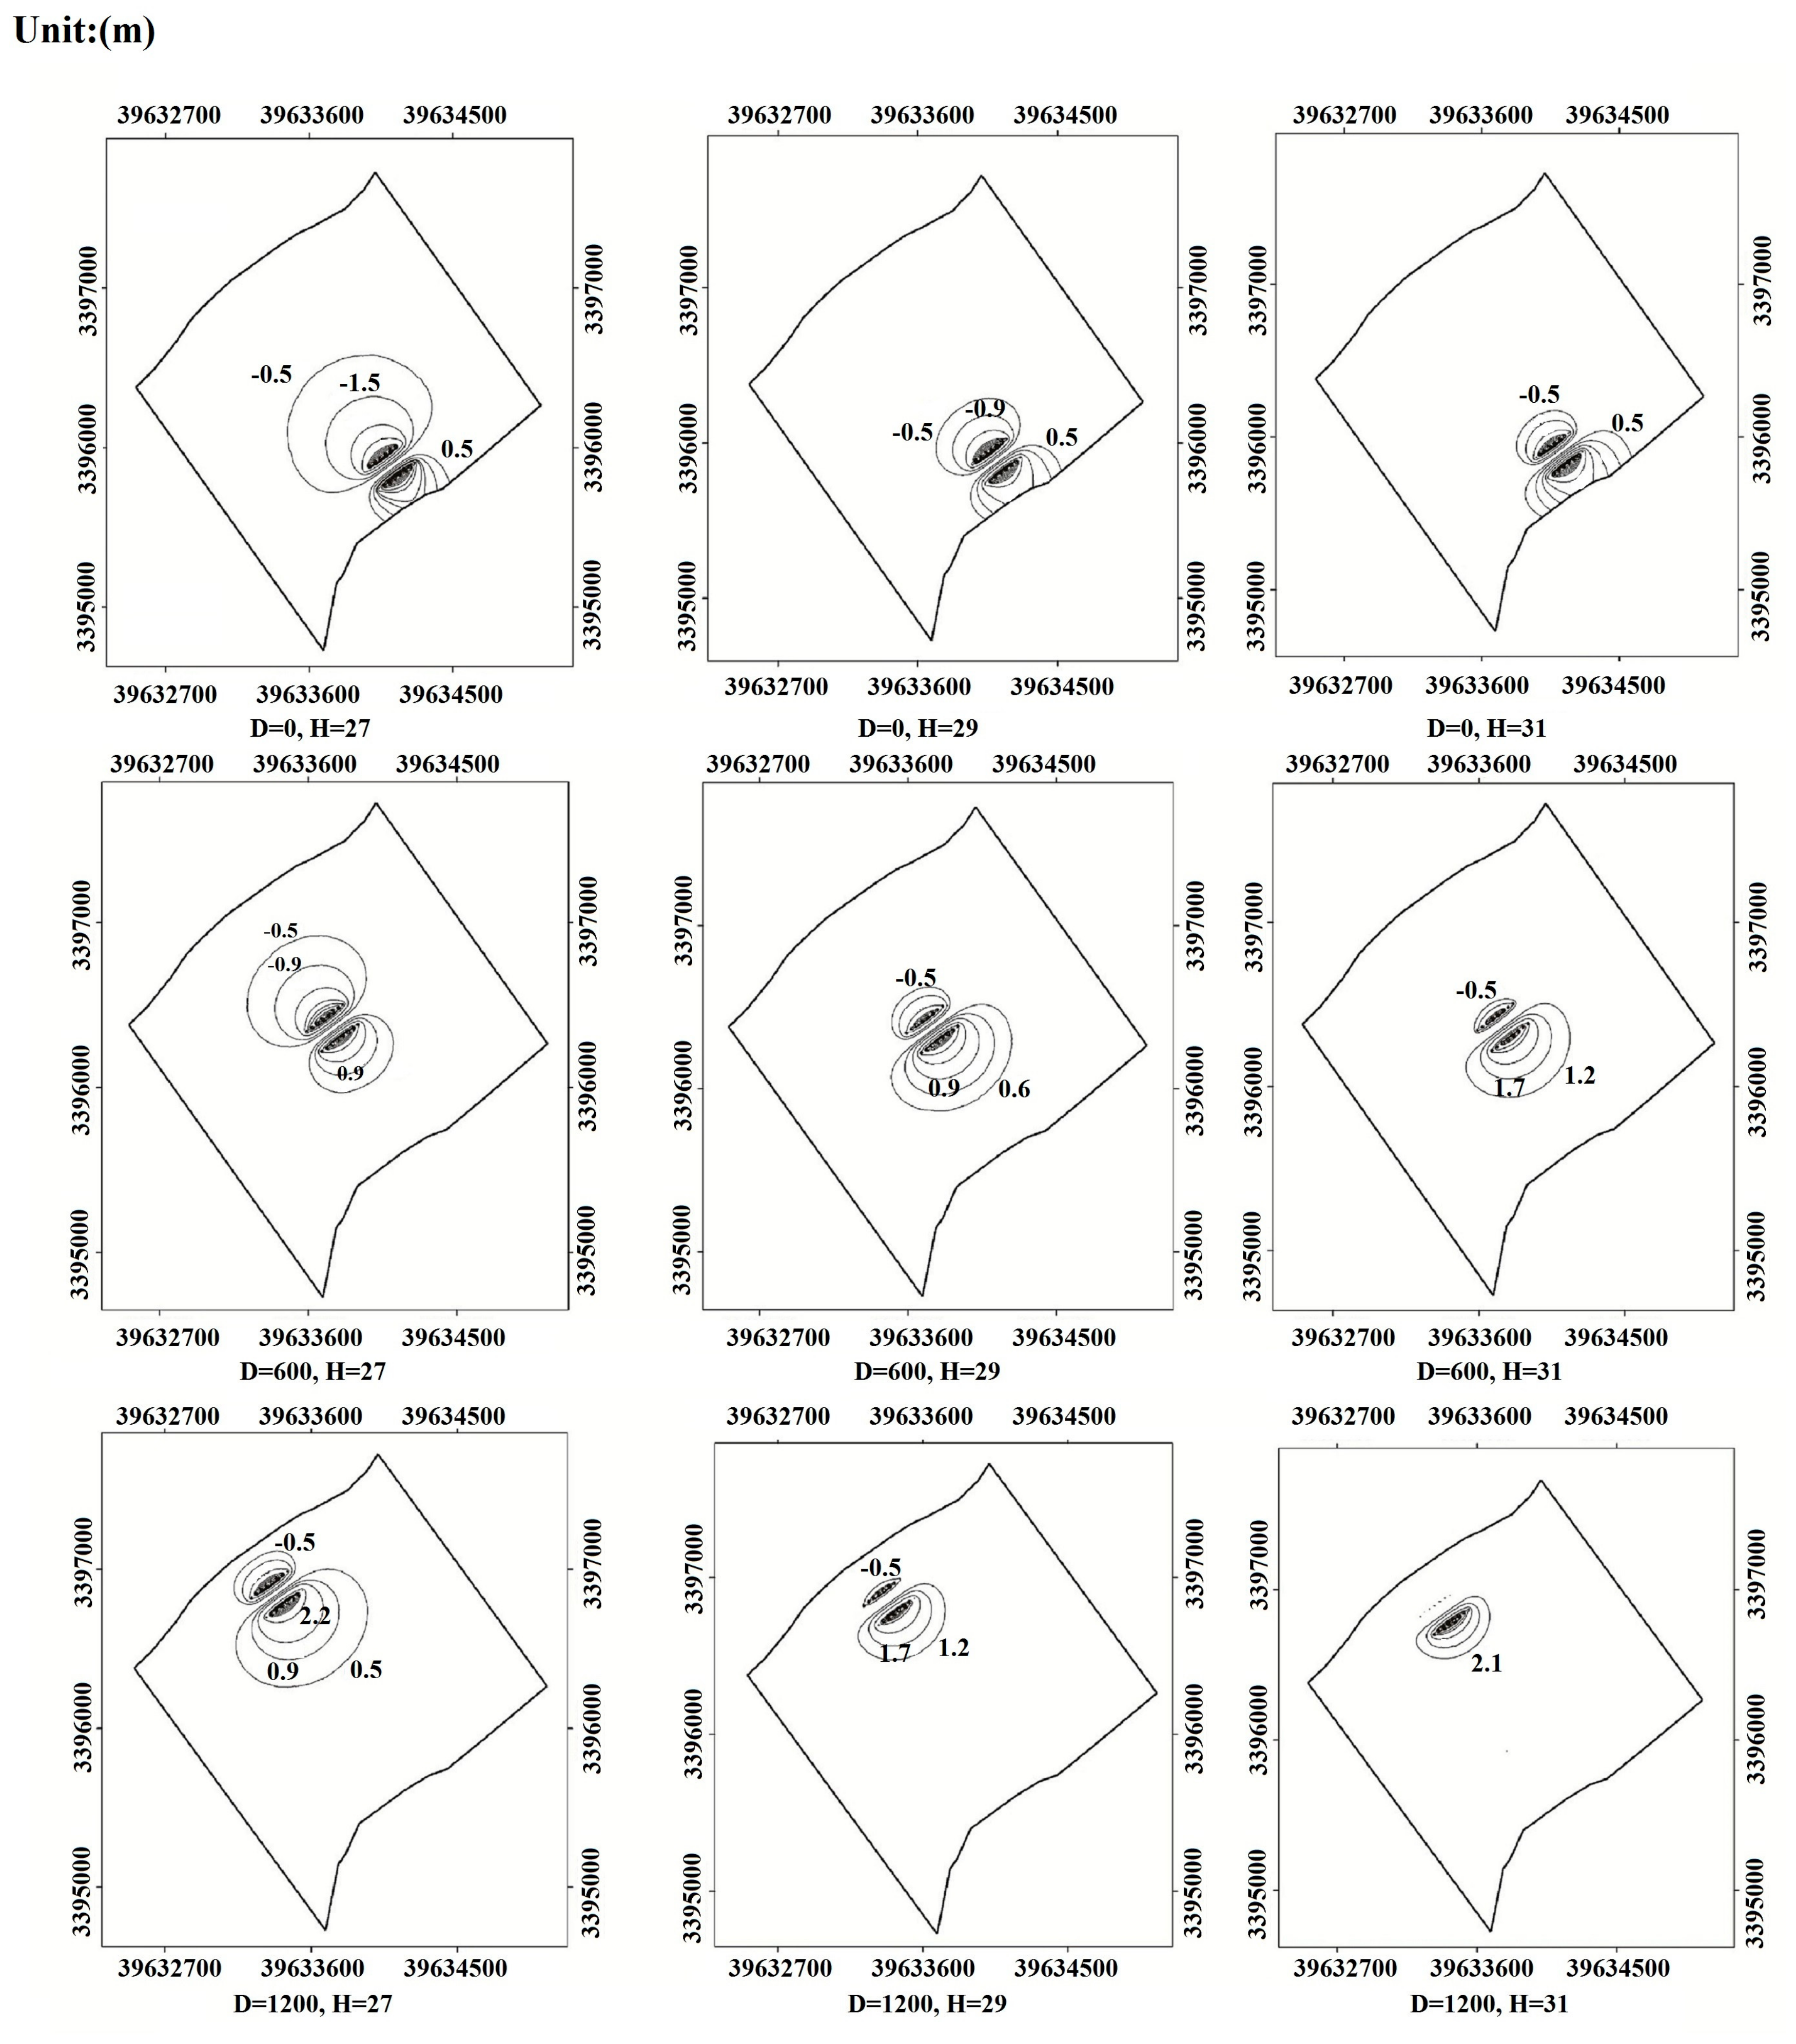
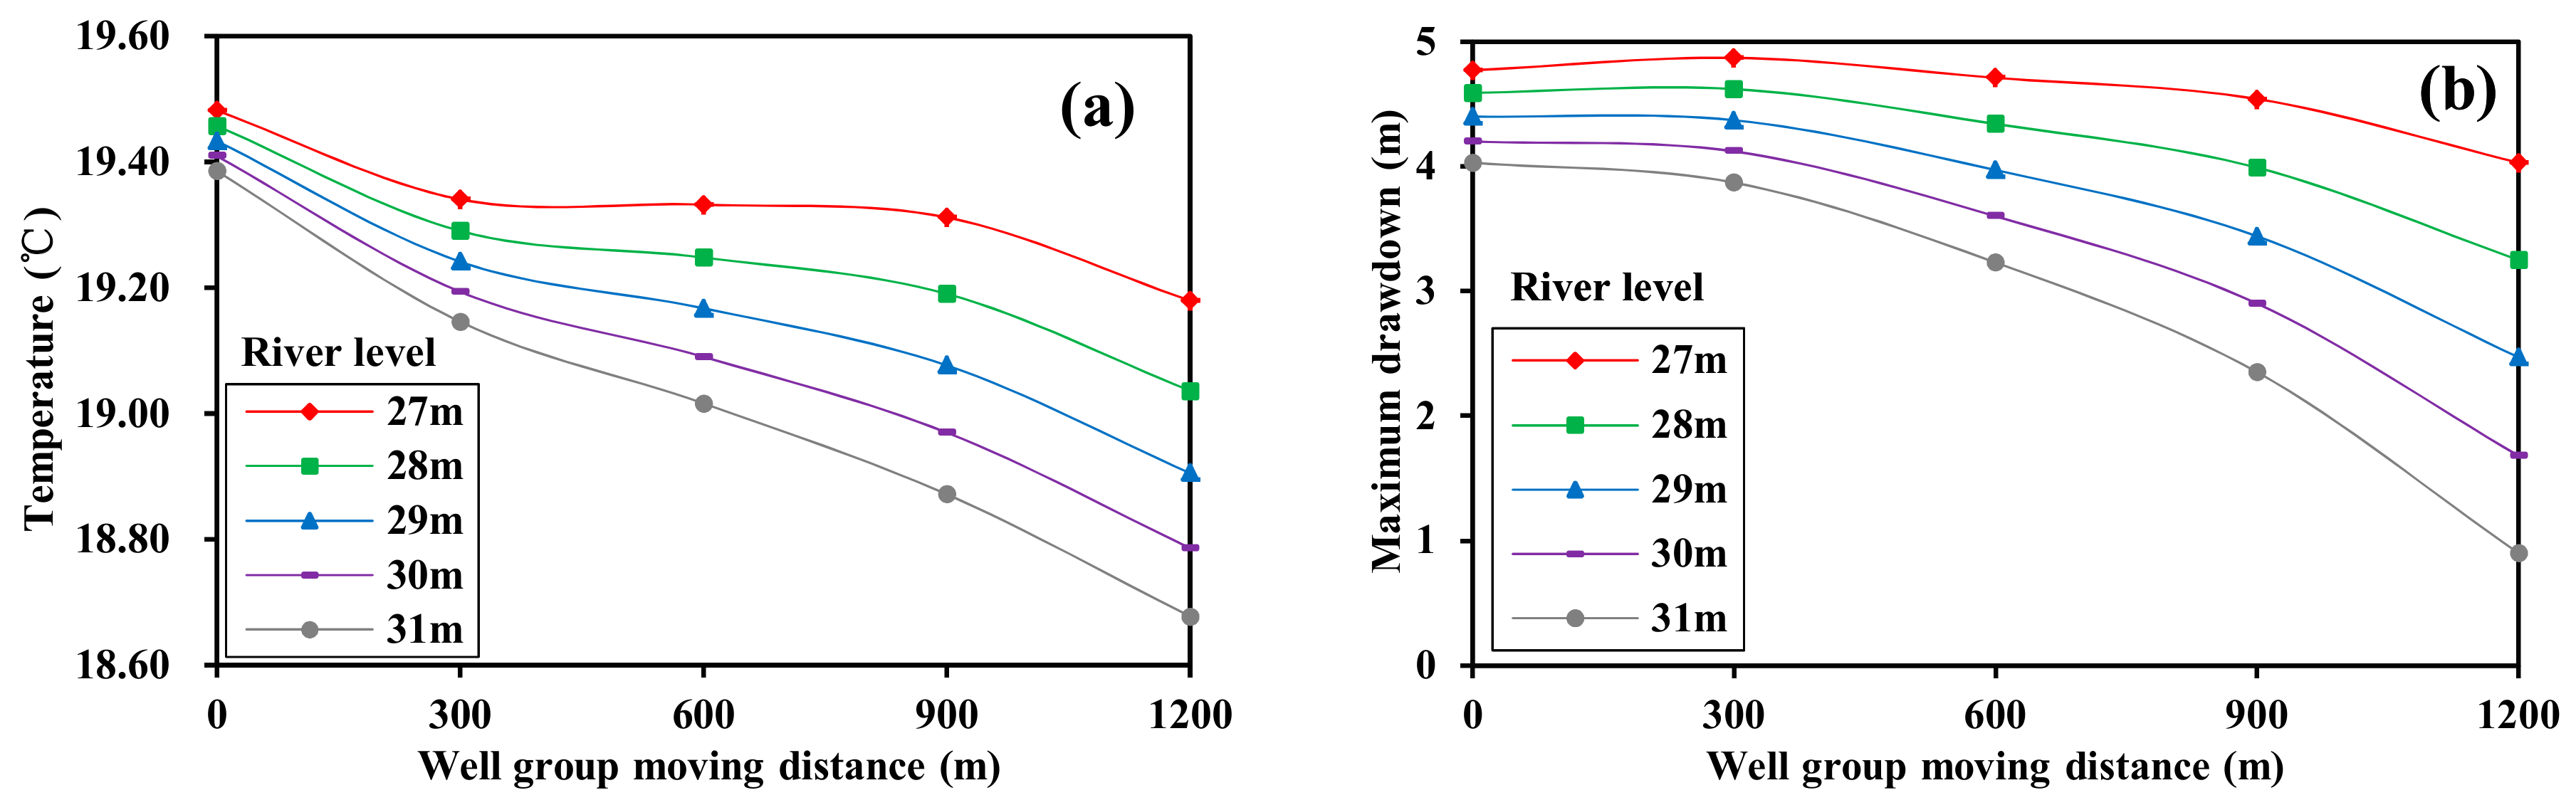
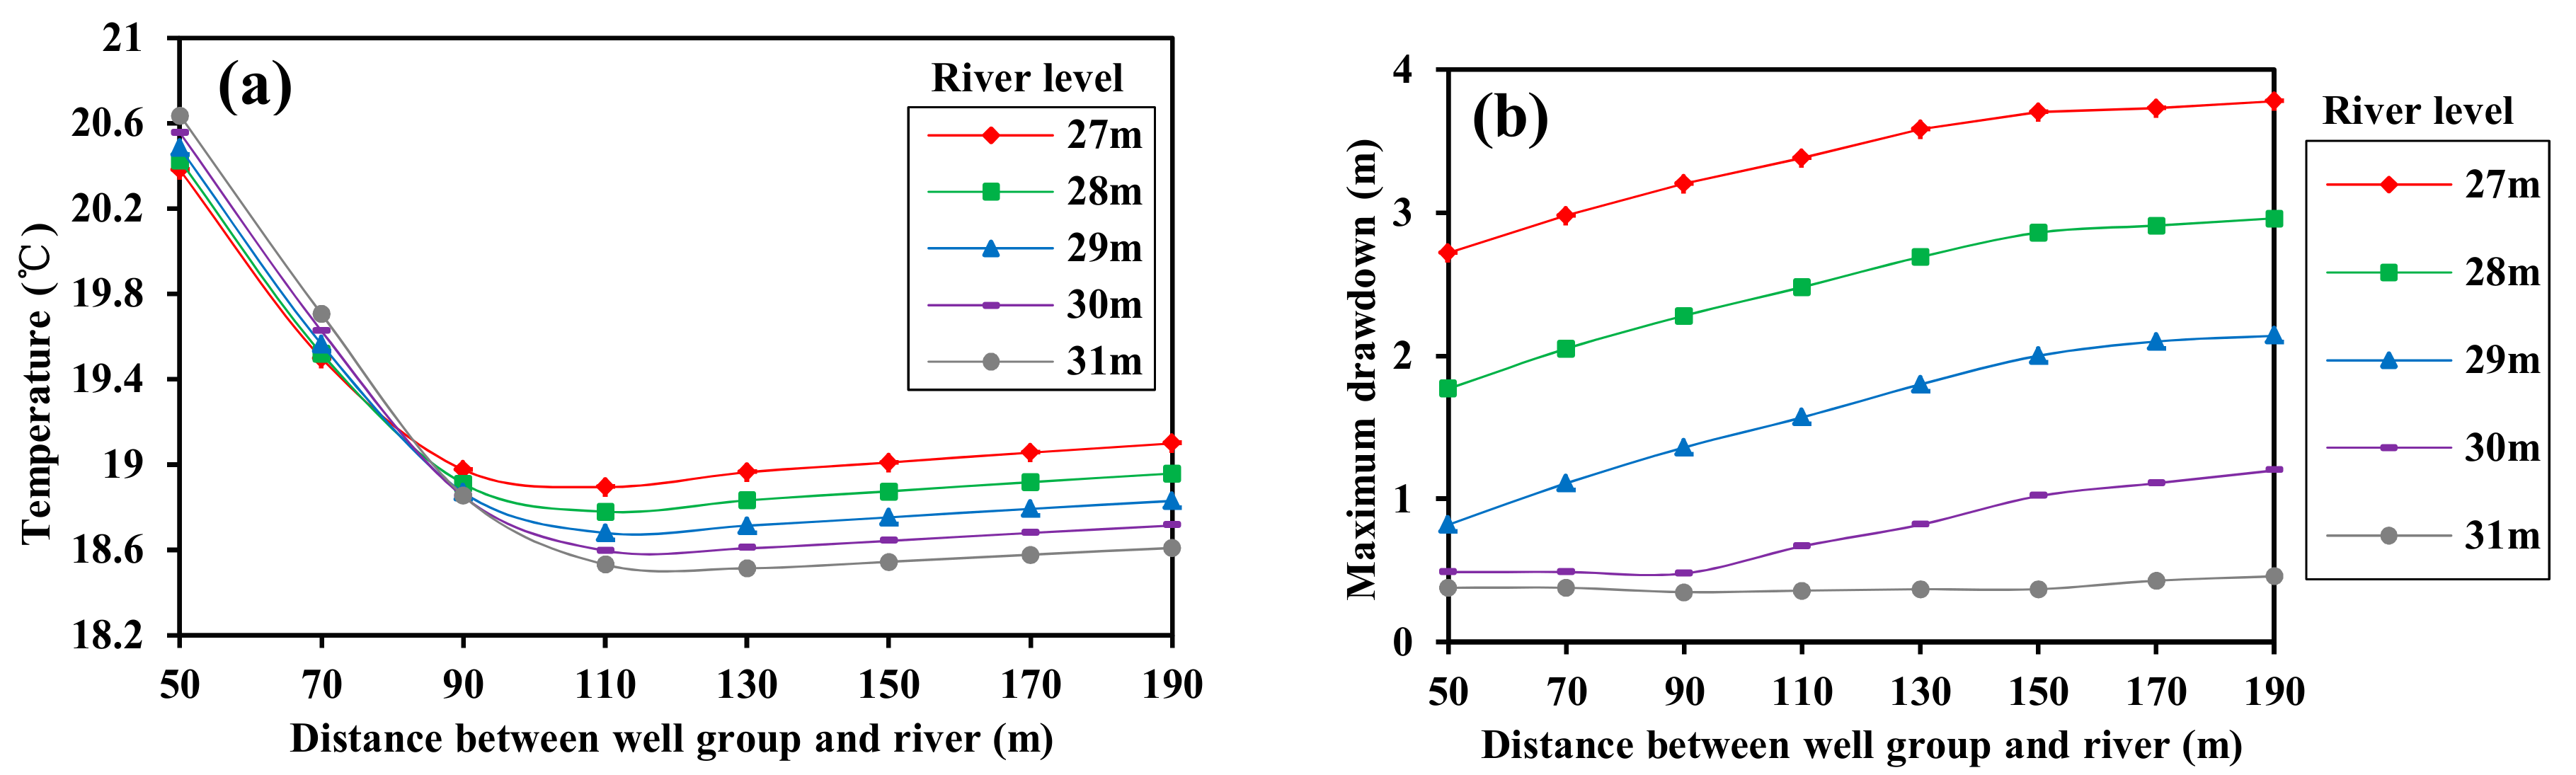
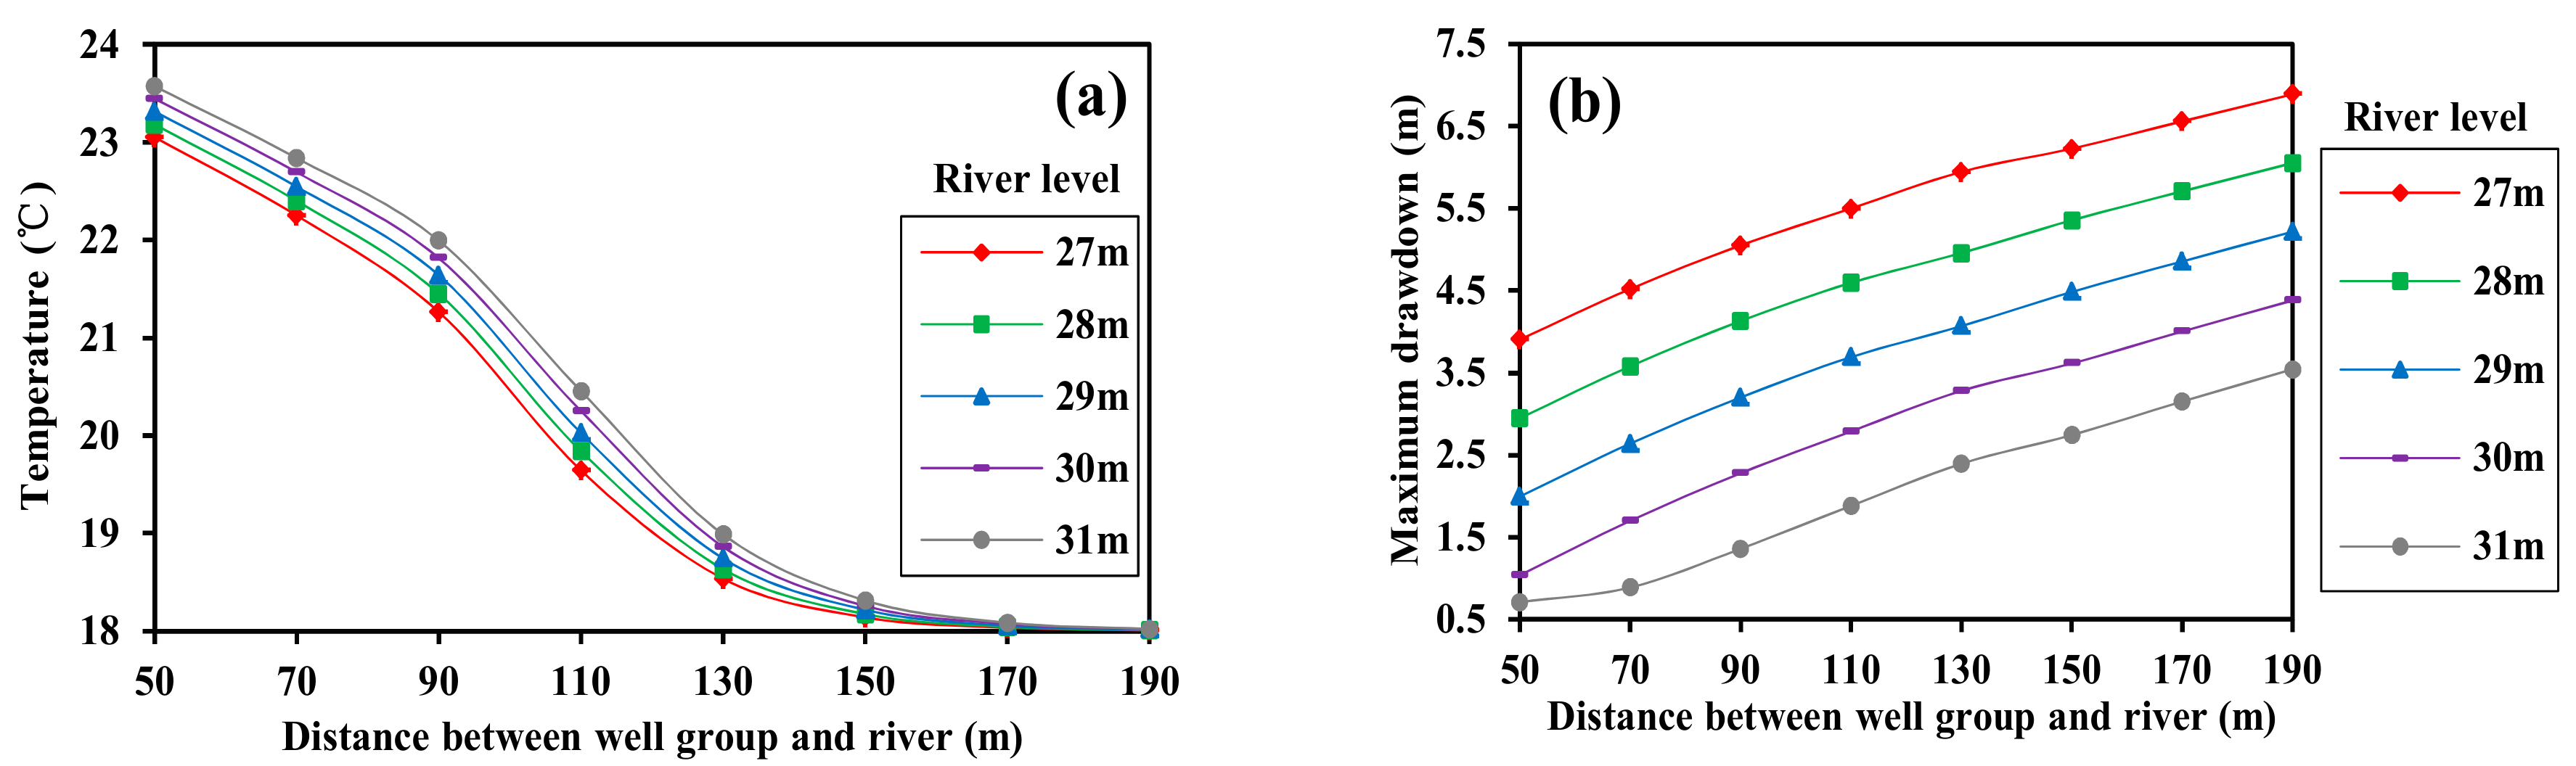
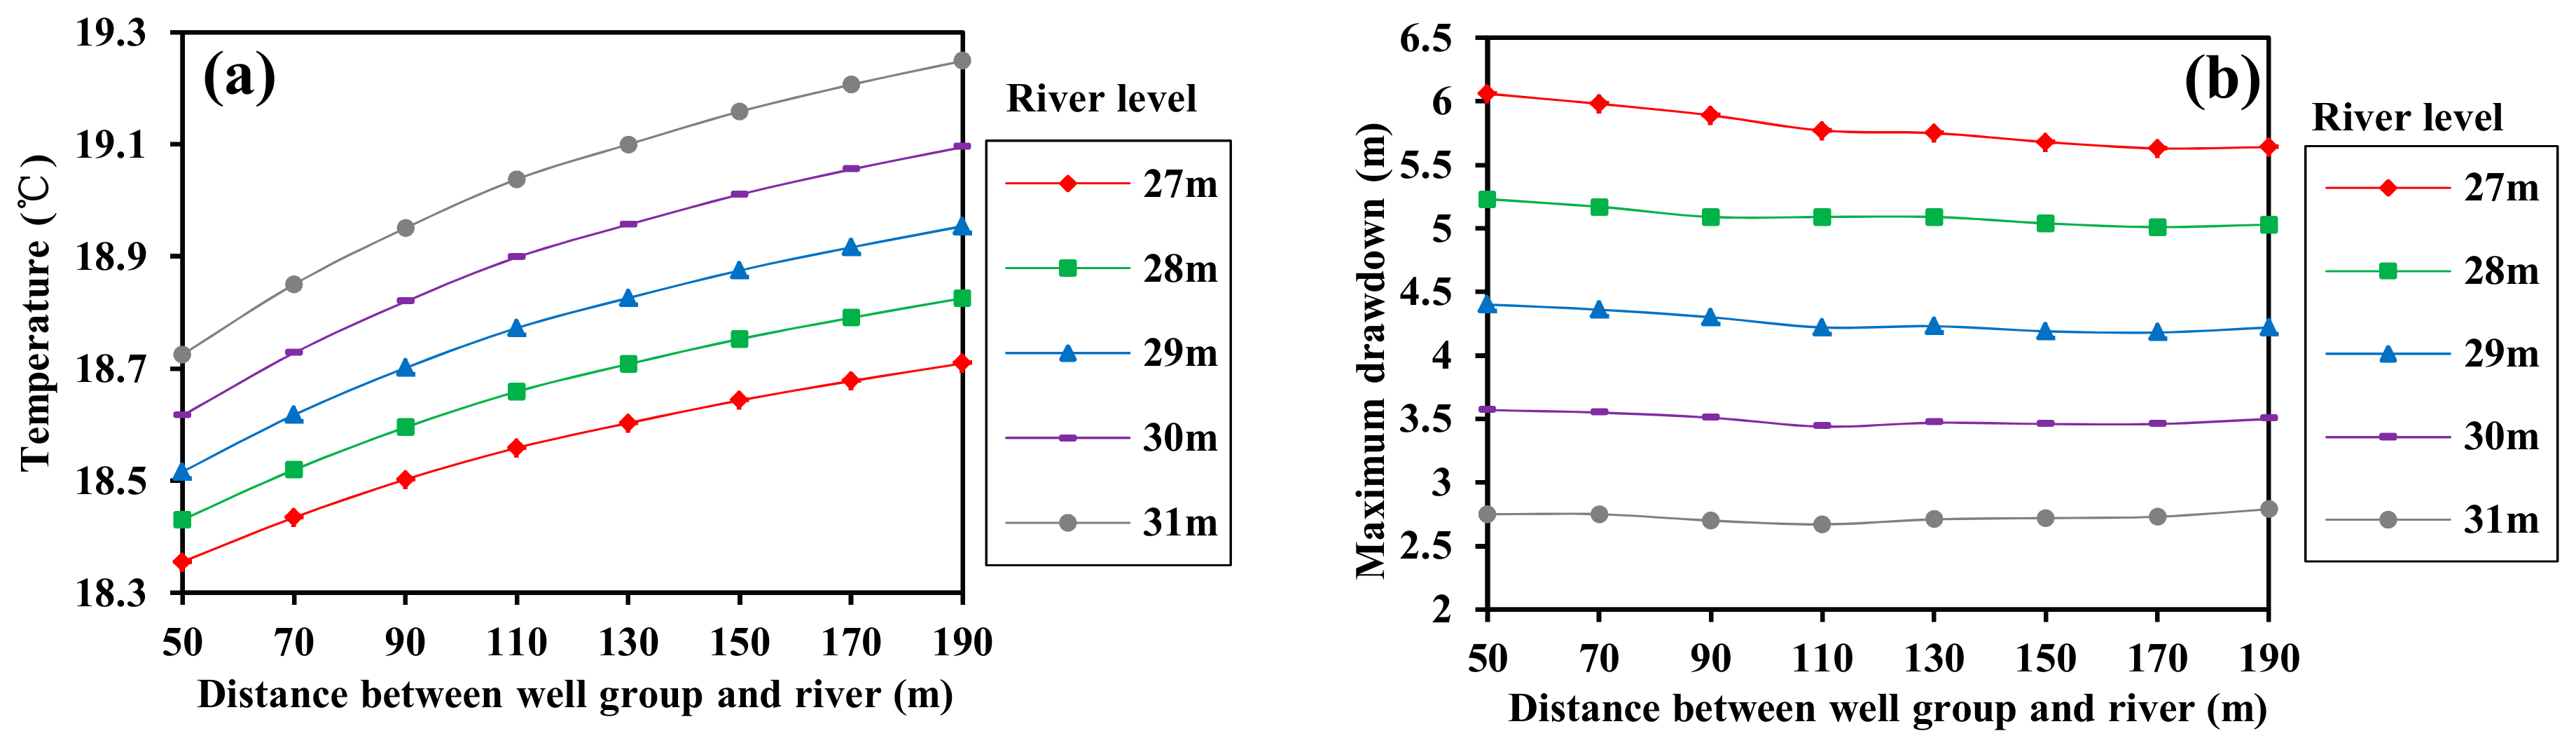
4.3. Effect of the River Level and the Pumping-Recharging Well Group Location
4.3.1. Mode A
4.3.2. Mode B
4.3.3. Mode C
5. Conclusions
Acknowledgments
Author Contributions
Conflicts of Interest
References
- Zhang, Q.; Zhang, Y.J.; Gao, P.; Yu, Z.W. Effect of natural cold source on groundwater source heat pump according to laboratory and field geotechnical thermal physical tests. Energy Build. 2014, 84, 557–566. [Google Scholar] [CrossRef]
- Koohi-Fayegh, S.; Rosen, M.A. On thermally interacting multiple boreholes with variable heating strength: Comparison between analytical and numerical approaches. Sustainability 2012, 4, 1848–1866. [Google Scholar] [CrossRef]
- Diao, N.; Li, O.; Fang, Z. Heat transfer in ground heat exchangers with groundwater advection. Int. J. Therm. Sci. 2004, 43, 1203–1211. [Google Scholar] [CrossRef]
- Zhou, X.Z.; Gao, Q.; Chen, X.L.; Yan, Y.Y.; Spitler, J.D. Development status and challenges of GWHP and ATES in China. Renew. Sustain. Energy Rev. 2015, 42, 973–985. [Google Scholar] [CrossRef]
- Ramos, E.P.; Breede, K.; Falcone, G. Geothermal heat recovery from abandoned mines: A systematic review of projects implemented worldwide and a methodology for screening new projects. Environ. Earth Sci. 2015, 73, 6783–6795. [Google Scholar] [CrossRef]
- Lund, J.W.; Freeston, D.H.; Boyd, T.L. Direct utilization of geothermal energy 2010 worldwide review. Geothermics 2011, 40, 159–180. [Google Scholar] [CrossRef]
- Yang, W.; Zhou, J.; Xu, W.; Zhang, G.Q. Current status of ground-source heat pumps in China. Energy Policy 2010, 38, 323–332. [Google Scholar] [CrossRef]
- Ferguson, G. Characterizing uncertainty in groundwater-source heating and cooling projects in Manitoba, Canada. Energy 2012, 37, 201–206. [Google Scholar] [CrossRef]
- Händel, F.; Liedl, R.; Fank, J.; Rock, G. Regional modeling of geothermal energy systems in shallow aquifers: The Leibnitzer Feld case study (Austria). Environ. Earth Sci. 2013, 70, 3433–3446. [Google Scholar] [CrossRef]
- Liang, J.; Yang, Q.C.; Liu, L.C.; Li, X.Y. Modeling and performance evaluation of shallow ground water heat pumps in Beijing plain, China. Energy Build. 2011, 43, 3131–3138. [Google Scholar] [CrossRef]
- Zhang, Y.D.; Wan, Y.S. Current status of groundwater source heat pump utilization in China and supervisory suggestions. China Water Resour. 2009, 21, 39–41. [Google Scholar]
- Lin, W.J.; Wu, Q.H.; Wang, G.L. Shallow geothermal energy resource potential evaluation and environmental effect in China. J. Arid Land Resour. Environ. 2012, 26, 57–61. [Google Scholar]
- Park, B.H.; Bae, G.O.; Lee, K.K. Importance of thermal dispersivity in designing groundwater heat pump (GWHP) system: Field and numerical study. Renew. Energy 2015, 83, 270–279. [Google Scholar] [CrossRef]
- Galgaro, A.; Cultrera, M. Thermal short circuit on groundwater heat pump. Appl. Therm. Eng. 2013, 57, 107–115. [Google Scholar] [CrossRef]
- Masciale, R.; Carlo, L.D.; Caputo, M.C. Impact of a very low enthalpy plant on a costal aquifer: A case study in Southern Italy. Environ. Earth Sci. 2015, 74, 1–12. [Google Scholar] [CrossRef]
- Nam, Y.; Ooka, R. Numerical simulation of ground heat and water transfer for groundwater heat pump system based on real-scale experiment. Energy Build. 2010, 42, 69–75. [Google Scholar] [CrossRef]
- Luo, Z.J.; Wang, Y.; Zhou, S.L.; Wu, X.H. Simulation and prediction of conditions for effective development of shallow geothermal energy. Appl. Therm. Eng. 2015, 91, 370–376. [Google Scholar] [CrossRef]
- Zhou, X.Z.; Gao, Q.; Chen, X.L.; Yu, M.; Zhao, X.W. Numerically simulating the thermal behaviors in groundwater wells of groundwater heat pump. Energy 2013, 61, 240–247. [Google Scholar] [CrossRef]
- Gao, Q.; Zhou, X.Z.; Yan, J.; Chen, X.L.; Yan, Y.Y. Numerical simulation of the thermal interaction between pumping and injecting well groups. Appl. Therm. Eng. 2013, 51, 10–19. [Google Scholar]
- Russo, S.L.; Taddia, G.; Verda, V. Development of the thermally affected zone (TAZ) around a groundwater heat pump (GWHP) system: A sensitivity analysis. Geothermics 2012, 43, 66–74. [Google Scholar] [CrossRef]
- Paksoy, H.O.; Andersson, O.; Abaci, S.; Evliya, H.; Turgut, B. Heating and cooling of a hospital using solar energy coupled with seasonal thermal energy storage in an aquifer. Renew. Energy 2012, 19, 117–122. [Google Scholar] [CrossRef]
- Gringarten, A.C.; Sauty, J.P.A. Theoretical study of heat extraction from aquifers with uniform regional flow. J. Geophys. Res. 1975, 80, 4956–4962. [Google Scholar] [CrossRef]
- Lubryka, E.; Malecha, Z.M. The numerical boundary conditions of the wrapping pattern of thin insulation. Int. J. Heat Mass Transf. 2017, 108, 512–518. [Google Scholar] [CrossRef]
- Malecha, Z.M.; Malecha, K. Numerical analysis of mixing under low and high frequency pulsations at serpentine micromixers. Chem. Process Eng. 2014, 35, 369–385. [Google Scholar] [CrossRef]
- Chiasson, A.D.; Rees, S.J.; Spitler, J.D. Preliminary assessment of the effects of ground-water flow on closed-loop ground-source heat pump systems. ASHRAE Trans. 2000, 106, 144–155. [Google Scholar]
- Gelhar, L.W.; Welty, C.; Rehfeldt, K.R. A critical review of data on field-scale dispersion in aquifers. Water Resour. Res. 1992, 28, 1955–1974. [Google Scholar] [CrossRef]
- Molina-Giraldo, N.; Bayer, P.; Blum, P. Evaluating the influence of thermal dispersion on temperature plumes from geothermal systems using analytical solutions. Int. J. Therm. Sci. 2011, 50, 1223–1231. [Google Scholar] [CrossRef]
- Hans, J.G. DHI-WASY Software FEFLOW Reference Manual; DHI WASY GmbH: Berlin, Germany, 2005. [Google Scholar]
- Zyoud, S.A.; Rühaak, W.; Sass, I. Dynamic numerical modeling of the usage of groundwater for cooling in north east Jordan—A geothermal case study. Renew. Energy 2014, 62, 63–72. [Google Scholar] [CrossRef]
- Luo, J.; Rohn, J.; Bayer, M.; Priess, A.; Wei, X. Analysis on performance of borehole heat exchanger in a layered subsurface. Appl. Energy 2014, 123, 55–65. [Google Scholar] [CrossRef]
- Wagner, V.; Bayer, P.; KÜbert, M.; Blum, P. Numerical sensitivity study of thermal response tests. Renew. Energy 2012, 41, 245–253. [Google Scholar] [CrossRef]
- Sheldon, H.A.; Schaubs, P.M.; Rachakonda, P.K. Groundwater cooling of a supercomputer in Perth, Western Australia: Hydrogeological simulations and thermal sustainability. Hydrogeol. J. 2015, 23, 1831–1849. [Google Scholar] [CrossRef]
- Zhang, R.; Wu, L.G. Groundwater Resources Assessment and Management; Tongji University Press: Shanghai, China, 1997. [Google Scholar]
- Chen, X.; Zhang, G.; Peng, J.G.; Liu, T.T. The performance of an open-loop lake water heat pump system in south China. Appl. Therm. Eng. 2006, 26, 2255–2261. [Google Scholar] [CrossRef]


| Parameter | Unit | Value | ||
|---|---|---|---|---|
| Layer 1 (Silty Day) | Layer 2 (Gravel) | Layer 3 (Argillaceous Conglomerate) | ||
| Horizontal hydraulic conductivity (Kxx = Kyy) | m/d | 0.02 | 25 | 0.001 |
| Vertical hydraulic conductivity (Kzz) | m/d | 0.002 | 2.5 | 0.0001 |
| Specific storage (Ss) | 1/m | 0.0001 | 0.0001 | 0.0001 |
| Porosity (n) | 0.3 | 0.15 | 0.01 | |
| Thermal conductivity of the solid (λs) | W/mk | 1.13 | 1.5 | 1.4 |
| Thermal conductivity of the fluid (λf) | W/mk | 0.65 | 0.65 | 0.65 |
| Volumetric heat capacity of the solid (ρscs) | MJ/m3k | 2.09 | 2.9 | 1.99 |
| Volumetric heat capacity of the fluid (ρfcf) | MJ/m3k | 4.2 | 4.2 | 4.2 |
| Longitudinal thermal dispersivity (αL) | m | 5 | 5 | 5 |
| Transverse thermal dispersivity (αT) | m | 0.5 | 0.5 | 0.5 |
| Variables | Unit | Value |
|---|---|---|
| The range of the river level (H) | m | 27, 28, 29, 30, 31 |
| Moving distance of well group (D) | m | 0, 300, 600, 900, 1200 |
| Distance between well group and river (L) | m | 50, 70, 90, 110, 130, 150, 170, 190 |
| Optimal Location (m) | River Level (m) | 27 | 28 | 29 | 30 | 31 |
|---|---|---|---|---|---|---|
| Mode | ||||||
| Mode A | 88 < L < 144 | 87 < L < 190 | 86 < L < 190 | 86 < L < 190 | 85 < L < 190 | |
| Mode B | \ | \ | 50 < L < 190 | 50 < L < 147 | 50 < L < 101 | |
| Mode C | \ | 123 < L < 131 | 124 < L < 179 | 128 < L < 190 | 129 < L< 190 | |
© 2017 by the authors. Licensee MDPI, Basel, Switzerland. This article is an open access article distributed under the terms and conditions of the Creative Commons Attribution (CC BY) license (http://creativecommons.org/licenses/by/4.0/).
Share and Cite
Shu, L.; Xiao, R.; Wen, Z.; Tao, Y.; Liu, P. Impact of Boundary Conditions on a Groundwater Heat Pump System Design in a Shallow and Thin Aquifer near the River. Sustainability 2017, 9, 797. https://doi.org/10.3390/su9050797
Shu L, Xiao R, Wen Z, Tao Y, Liu P. Impact of Boundary Conditions on a Groundwater Heat Pump System Design in a Shallow and Thin Aquifer near the River. Sustainability. 2017; 9(5):797. https://doi.org/10.3390/su9050797
Chicago/Turabian StyleShu, Longcang, Rui Xiao, Zhonghui Wen, Yuezan Tao, and Peigui Liu. 2017. "Impact of Boundary Conditions on a Groundwater Heat Pump System Design in a Shallow and Thin Aquifer near the River" Sustainability 9, no. 5: 797. https://doi.org/10.3390/su9050797
APA StyleShu, L., Xiao, R., Wen, Z., Tao, Y., & Liu, P. (2017). Impact of Boundary Conditions on a Groundwater Heat Pump System Design in a Shallow and Thin Aquifer near the River. Sustainability, 9(5), 797. https://doi.org/10.3390/su9050797