Article

Influence of Organic Farming on the Potato Transcriptome

1
Council for Agricultural Research and Economics Analysis—Research Centre for Cereal and Industrial Crops (CREA-CI), Via di Corticella, 133, 40128 Bologna, Italy
2
Cancer Genomics Laboratory, Fondazione Edo ed Elvo Tempia Valenta, Via Malta 3, 13900 Biella, Italy
*
Author to whom correspondence should be addressed.
Sustainability 2017, 9(5), 779; https://doi.org/10.3390/su9050779
Submission received: 22 February 2017 / Revised: 2 May 2017 / Accepted: 3 May 2017 / Published: 9 May 2017
(This article belongs to the Section Sustainable Agriculture)

Abstract

:
Organic agriculture sparks a lively debate on its potential health and environmental benefits. Comparative studies often investigate the response of crops to organic farming through targeted approaches and within a limited experimental work. To clarify this issue, the transcriptomic profile of a cultivar of the potato grown for two years under organic and conventional farming was compared with the profile of an experimental clone grown in the same location of Southern Italy for one year. Transcriptomic raw data were obtained through Potato Oligo Chip Initiative (POCI) microarrays and were processed using unsupervised coupling multivariate statistical analysis and bioinformatics (MapMan software). One-hundred-forty-four genes showed the same expression in both years, and 113 showed the same expression in both genotypes. Their functional characterization revealed the strong involvement of the farming system in metabolism associated with the nutritional aspects of organic tubers (e.g., phenylpropanoid, flavonoid, glycoalcaloid, asparagine, ascorbic acid). Moreover, further investigation showed that eight of 42,034 features exhibited the same trend of expression irrespective of the year and genotype, making them possible candidates as markers of traceability. This paper raises the issue regarding the choice of genotype in organic management and the relevance of assessing seasonal conditions effects when studying the effects of organic cultivation on tuber metabolism.

1. Introduction

The potato is one of the most important food sources for human consumption, with a worldwide production of 368,096 thousand tonnes in 2013, following only cereals, which include wheat, rice, and maize [1]. As public opinion has started to demonstrate a belief that organic food is healthier than conventional food, the current consumer trends in organic food consumption have greatly increased (5–11% per year in the United States and nearly 10% per year in Europe; [2,3]). However, scientific knowledge still cannot address the question regarding the supposed additional benefit, although it is well established that environmental factors, including farming practices, may greatly influence the transcriptome, proteome, and chemical composition of tubers and, ultimately, their nutritional and organoleptic quality [3,4,5,6,7,8]. From this perspective, very few studies are available concerning proteomic [9], metabolomic [10], and transcriptomic [11] approaches that investigate the impact of agricultural practices on tuber composition, and no previous study was replicated for more years or compared more genotypes. Because the response to organic farming is still largely unknown, it is advisable to carry out studies that exploit the complex molecular pathways and key factors underlying them.
Transcriptomics have been extensively applied to many food systems. In the potato, the complex response to the environment that can influence the overall gene expression [12] and starch synthesis [13] has been investigated using microarray techniques. The Potato Oligo Chip Initiative (POCI) microarray (a 4 × 44 K platform based on Agilent 60-mer oligo synthesis technology comprising a total of 42,034 features) was proposed as a promising non-targeted analytical technique to investigate and characterize a wide portion of the potato transcriptome because each probe is designed on a potato unigene set of more than 246,000 EST reads [14]. Nevertheless, the POCI microarray has only been used in a few studies regarding flavonoid profiling [15], geographic origin traceability [16], tuber development [14], and quality trait determination [17]. Although transcriptome analysis based on deep-sequencing technologies (RNA-seq) is an alternative to hybridization tools, microarray analysis remains a good choice in terms of time and money [18].
This paper investigated the effect of crop management practices, deepening and expanding NMR (Nuclear Magnetic Resonance)-based metabolomics data obtained from the same experimental design carried out in Southern Italy [10]. This study identified a potentially employable marker for the method of cultivation using wide-mapping expression data sets concordant in both years and genotypes. Such a marker could be employed to certify organically grown potatoes and is therefore a useful tool in protecting consumers from food fraud. Where possible, differences in gene expression were interpreted by comparing the data to relevant biological pathways using the necessary statistic and bioinformatics tools to manage the complex and vast datasets generated by microarray hybridization. To obtain further insights into the raw data set, hierarchical clustering was used to identify the correlation between variables in an unsupervised way, and MapMan software, which provides a means to plot and visualize genomic data, was used to display them in diagrams of metabolic pathways and other biological processes.

2. Materials and Methods

2.1. Plant Material and Farming Site

An Austrian early cultivar widely employed in European organic farming (Ditta) and an experimental clone (MN 1404 O5) were grown in Southern Italy on a commercial farm near Siracusa (Cassibile—37°01’N, 15°12’E, 30 m above sea level). The potatoes were grown under both organic [8] and conventional management and were monitored during 2007 and 2008 (Ditta) and only 2008 (MN 1404 O5). A randomized block design with three replications for each variety and treatment was used. All the genotypes were planted on the same date in random plots with a plot size of 42 × 45 m, each including 101 plants and harvested at the end of their respective cycles. Nitrogen regime was 50 Kg ha−1 N in presowing and 83 Kg ha−1 N at the tuber induction. The fungicide treatments consisted only of copper (Cu), as allowed from EU legislation on organic management, in a limit of 6 Kg ha−1, with the addition to propolis used to heal Phytophtora lesions; conventionally grown potatoes were treated with cymoxanil (11 Kg ha−1). Additional agronomic parameters and management details were described in Pacifico et al. [10] and Lombardo et al. [8]. Each condition (farming system) was investigated with three independent experiments and was analyzed separately. At harvest, three tubers for each experiment were randomly picked, peeled, cut into small pieces, pooled, freeze-dried in liquid nitrogen, and ground with a homogenizer (Stomacher 400 Pbi, Waring Blender, Milan, Italy), followed by storage at –80 °C until analysis.

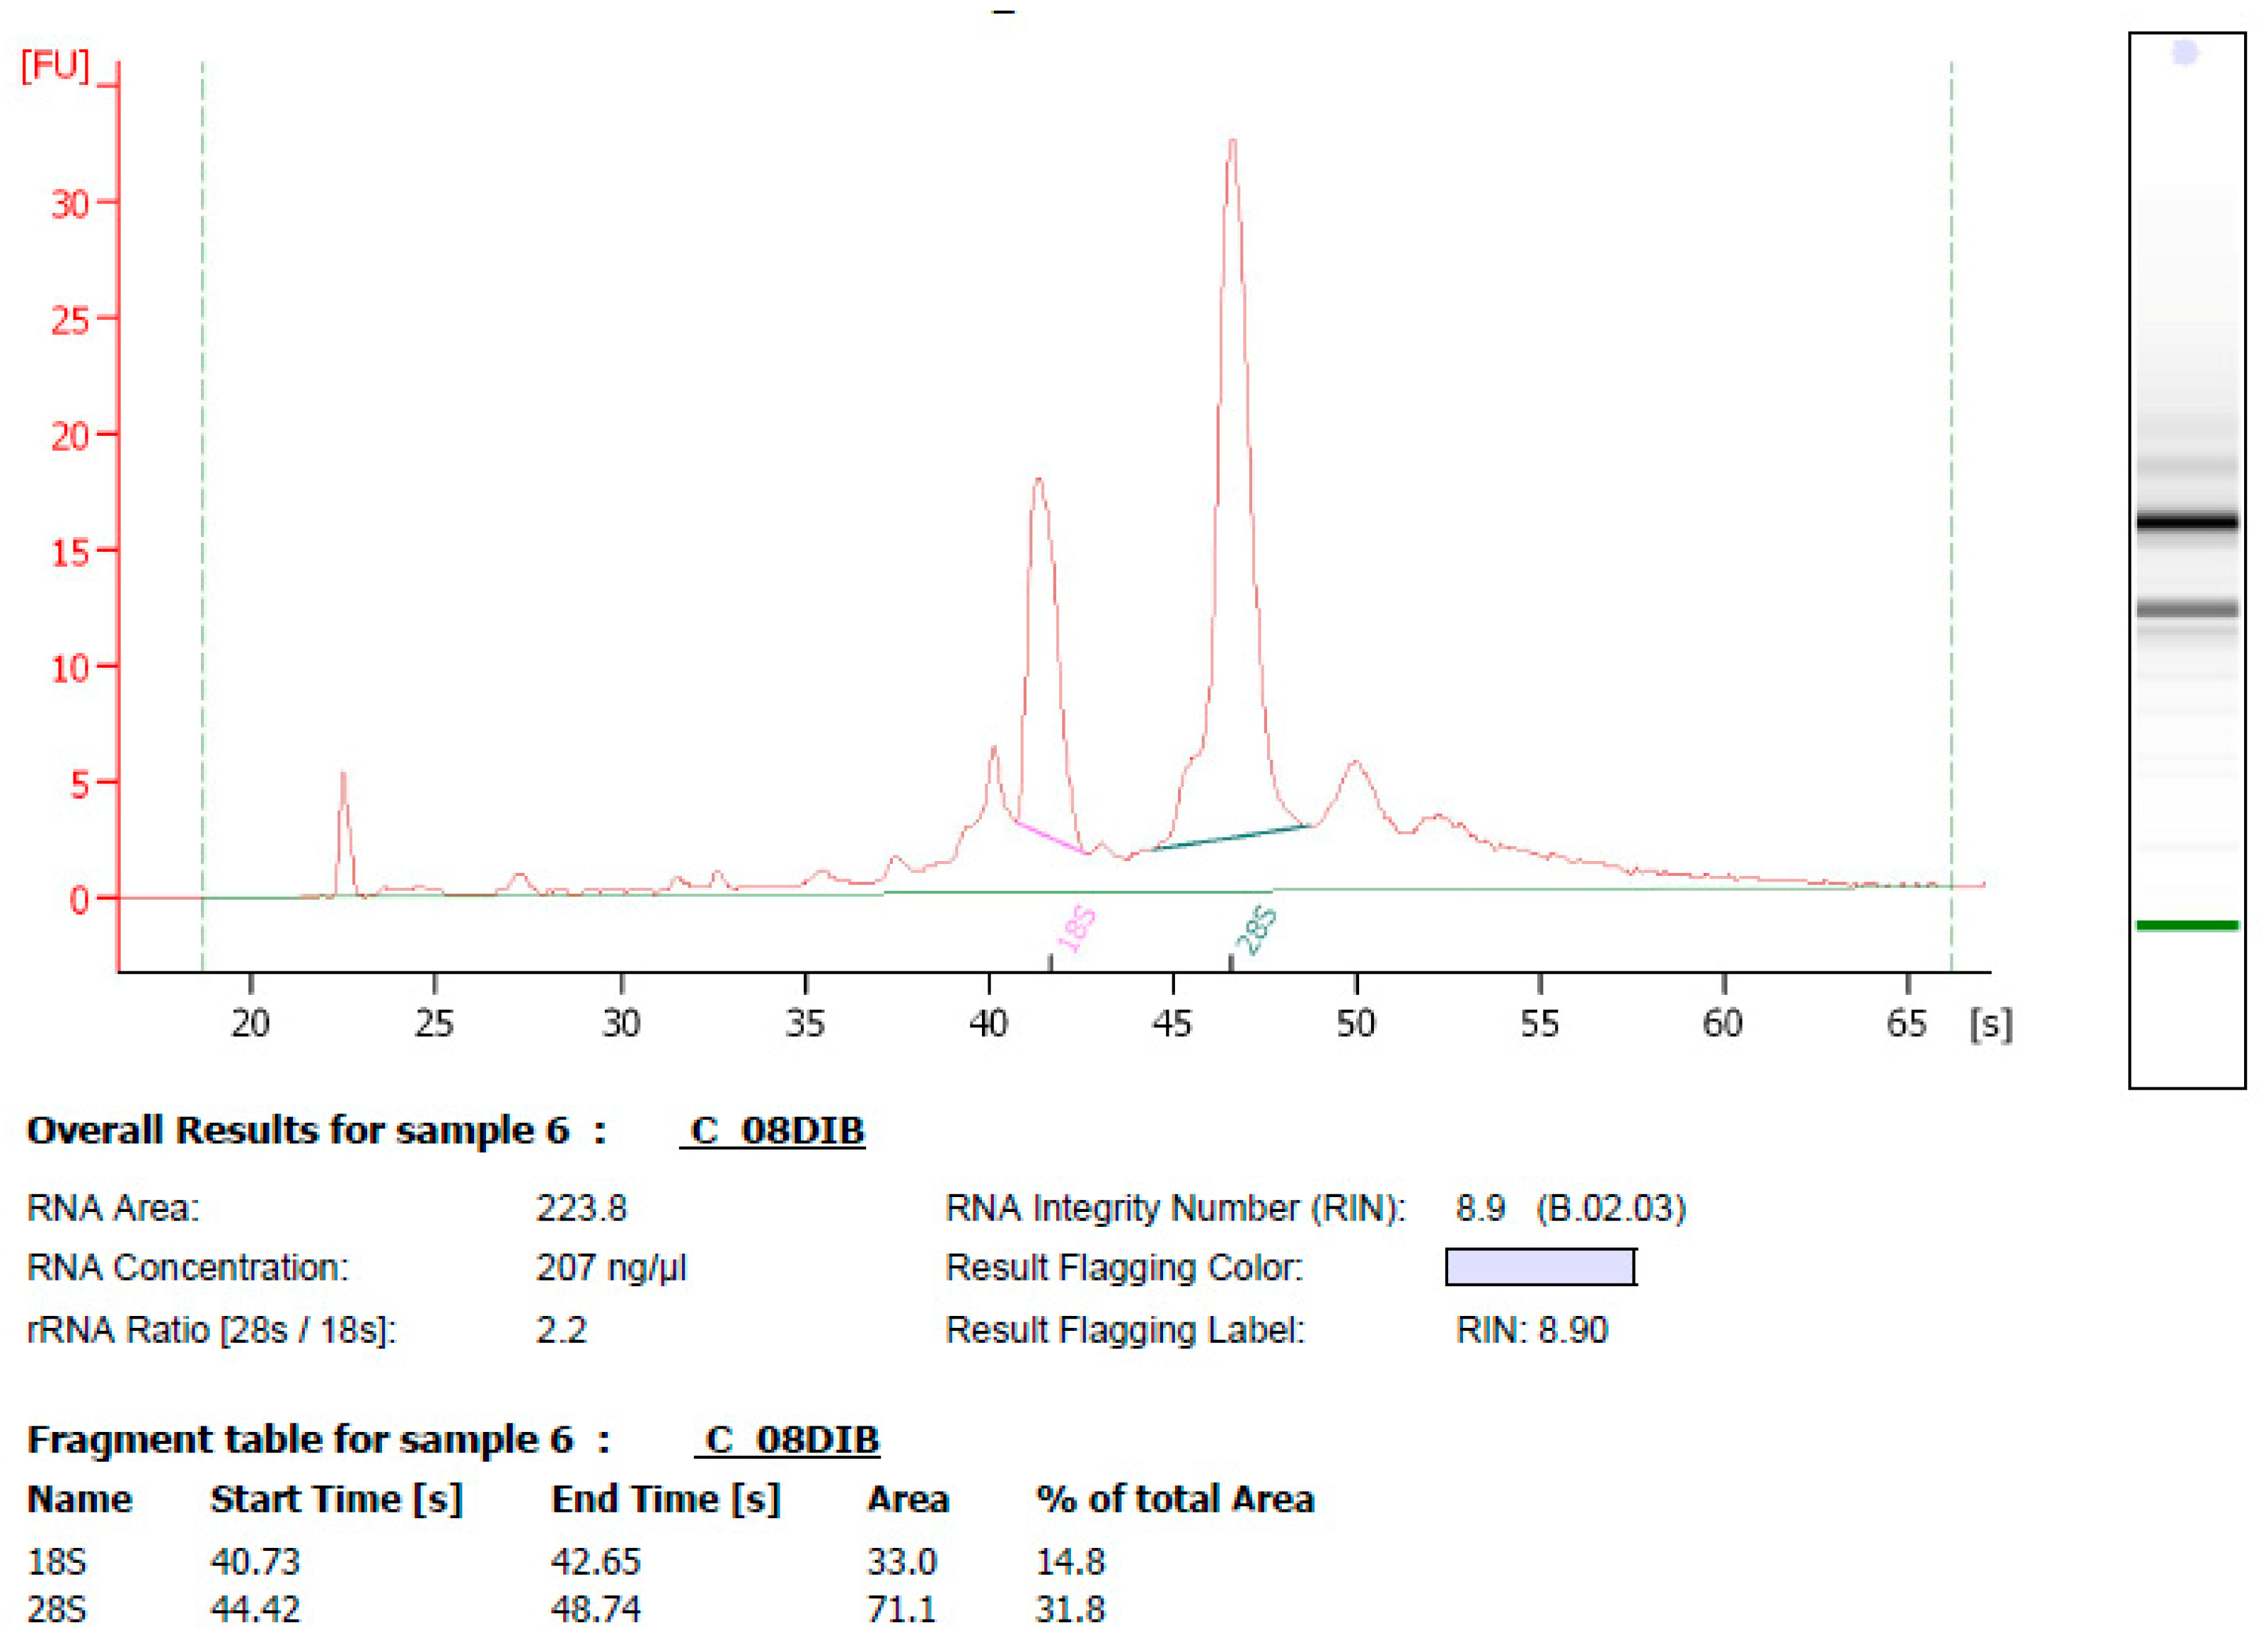
2.2. Total RNA Isolation from Potato Tubers and Fluorescent Labelling of cRNA

Total RNA was purified using the RNeasy Plant Mini Kit (Qiagen, Germantown, MD, USA). The protocol provided by the manufacturer was modified to improve both the quality and yield of total RNA: 1.5 mL of a mixed buffer (RLC buffer: Milk buffer 1:1; Appendix A Table A4) was added to 0.5 g of freeze-dried tuber powders instead of the exclusive use of RLC buffer. An elution in 50 μL of water guaranteed a yield up to ca. 50 µg of RNA with a purity, measured as the 260/280 nm ratio, of 2.0. Treatment with RNase-free DNase I Amplification Grade (Life Technologies Italia, Milan, Italy) without the final thermal treatment was performed to avoid possible RNA degradation, followed by cleaning with RNeasy Minielute Cleanup kit (Qiagen). The total RNA integrity and quantity were checked using the 2100 Bioanalyser (Agilent Technologies, Palo Alto, CA, USA) and NanoDrop 1000 Spectrophotometer (Thermo Scientific, Wilmington, DE, USA), respectively. Only good-quality RNA samples (RIN > 7) were considered adequate for microarray analysis, as shown in Figure A1. The mRNA was amplified through cDNA synthesis and was transcribed in vitro into complementary RNA (cRNA) by the incorporation of aminoallyl-UTP (Amino Allyl Message Amp II kit; Ambion, Austin, TX, USA). Antisense cRNA was labelled with Cy3 dye (Amersham Bioscience, Buckinghamshire, UK) and was used for hybridization on 4 × 44 K POCI oligo arrays (Agilent Technologies). Gene expression profiling was carried out using the one-colour labelling method and performing two technical replicates for each biological replicate. After the hybridization step, slides were washed according to Agilent protocols and were scanned using the G2505C scanner (Agilent Technologies). Images were analysed using the Feature extraction software package (version 10.7, Agilent Technologies, Santa Clara, CA, USA).

2.3. Microarray Data Mining

Multiexperiment Viewer application (MeV version 4.8.116) was used to perform unsupervised hierarchical clustering on the entire raw array data set and on subsets of genes according to their pattern of expression. Euclidean distance was used as the similarity metric, and complete linkage was used as the linkage method. Log2 expression values, median-centred and divided by the standard deviation (SD), were represented in the heatmaps.
Linear Models for the Microarray Analysis (LIMMA) package [19] was used to identify differentially expressed genes between different comparisons: initially, a comparison of the features showing differential hybridization signals was made between years and within the same farming system (conventional or organic); subsequently, conventional vs. organic comparisons were made within each year [20,21]. Raw intensity values were background-corrected through Normexp with an offset of 100. Array normalization was performed using the quantile method. Empirical Bayes-moderated t-statistics were employed, and p-values were adjusted for multiple testing using false discovery rate (FDR) correction [22]. Transcripts with a log2-fold change (logFC) greater than 1 or lower than −1 and an adjusted p-value lower than 0.01 were considered as differentially expressed.
MapMan software (version 3.5.1) was used for the following analyses: (i) a list of genes modulated concordantly in the two experimental years and in the two genotypes was compiled and used to design Venn diagrams; and (ii) functional annotation for these genes was assigned through the information on Gene Ontology (GO) terms available in the POCI mapping file [23] based on the MapMan pathway classification, a graphical view of pathway analysis was obtained, and Over-Representation Analysis (ORA) was performed. Comparing the list of differentially expressed probes (test set) to all features present on the POCI chip (reference test), ORA analysis identified over- or under-represented biological categories. When the probe sequence was unknown, further analysis through a search on the database [24] was carried out.

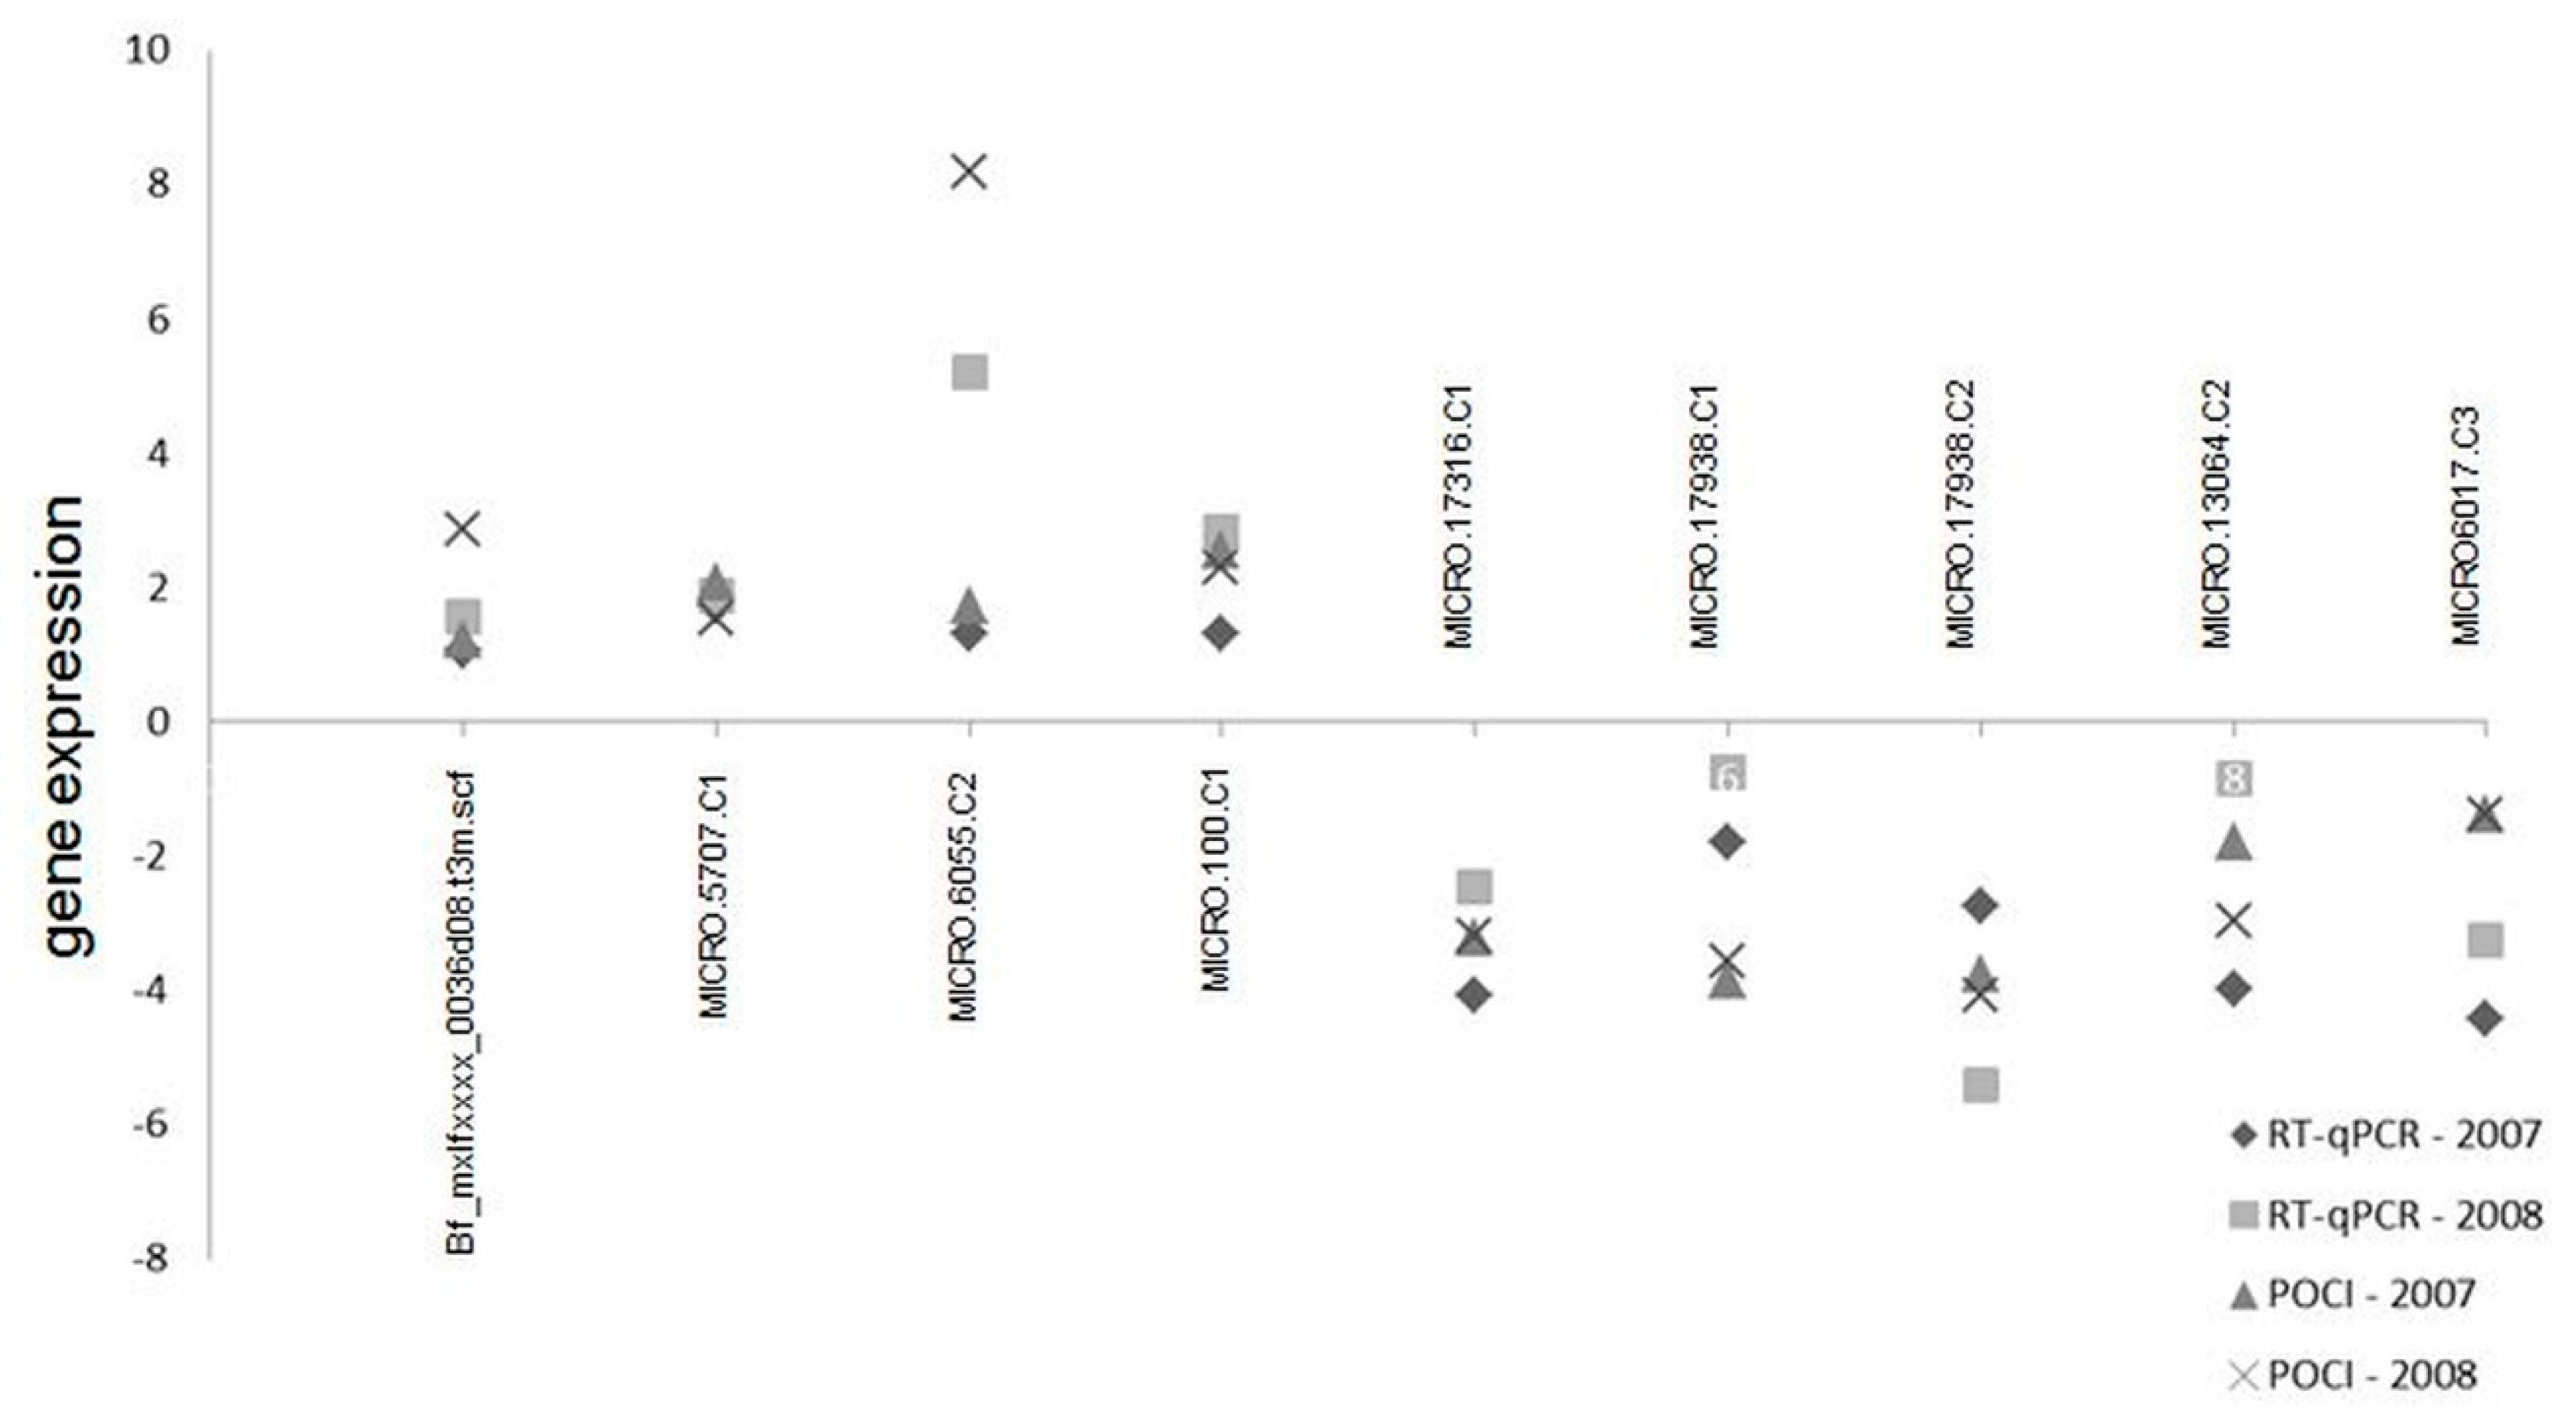
2.4. Quantitative Real-Time PCR Analysis

One microgram of RNA was reverse transcribed using the High-Capacity cDNA Archive Kit (Applied Biosystems) and was treated with DNase I, Amplification Grade (Life Technologies). The cDNA obtained was used as a template for real-time PCR analyses conducted on a Rotor Gene 6000 (Qiagen). The PCR program run consisted of the following parameters: 95 °C for 5 min followed by 40 cycles at 95 °C for 5 s and 60 °C for 10 s. All the samples were amplified in triplicate, and negative controls, RT minus (absence of reverse transcription) and NTC (no template), were also run. To attain confirmation of the up- or down-regulation of a subset of differentially expressed probes (identified by microarray analysis), ten assays were designed on the sequence of the probes (4 up-, 5 down-regulated, and 1 housekeeping gene) and their flanking regions, retrieving the whole-transcript sequences from the potato genome database. All primers used for validation assays are reported in Table A5. Amplification of serial 1:10 dilutions of cDNA templates was included to estimate PCR efficiencies [25]. The fold change in gene expression was calculated by the relative quantitation method of comparative Ct (2–ΔΔCt) according to Livak and Schmittgen [26]. RNA from organically grown tubers was used as the calibrator for relative quantification, and the target gene expression was normalized to elongation factor 1α [15].

3. Results

The microarray data obtained in this study were deposited in Array Express with the accession number E-MTAB-3367. The dendrogram obtained from unsupervised hierarchical clustering using Pearson’s correlation as similarity metrics and complete linkage as linkage method based on all the raw data available shows that the second and third clusters were closer than the first cluster; 2008 Organic Ditta and 2008 Conventional Ditta clustered together in the second cluster, as 2007 Ditta Org and 2007 Ditta Conv (third cluster), resulting in these samples be clustered closer together than samples cultivated under the same agronomic practice (Figure 1).

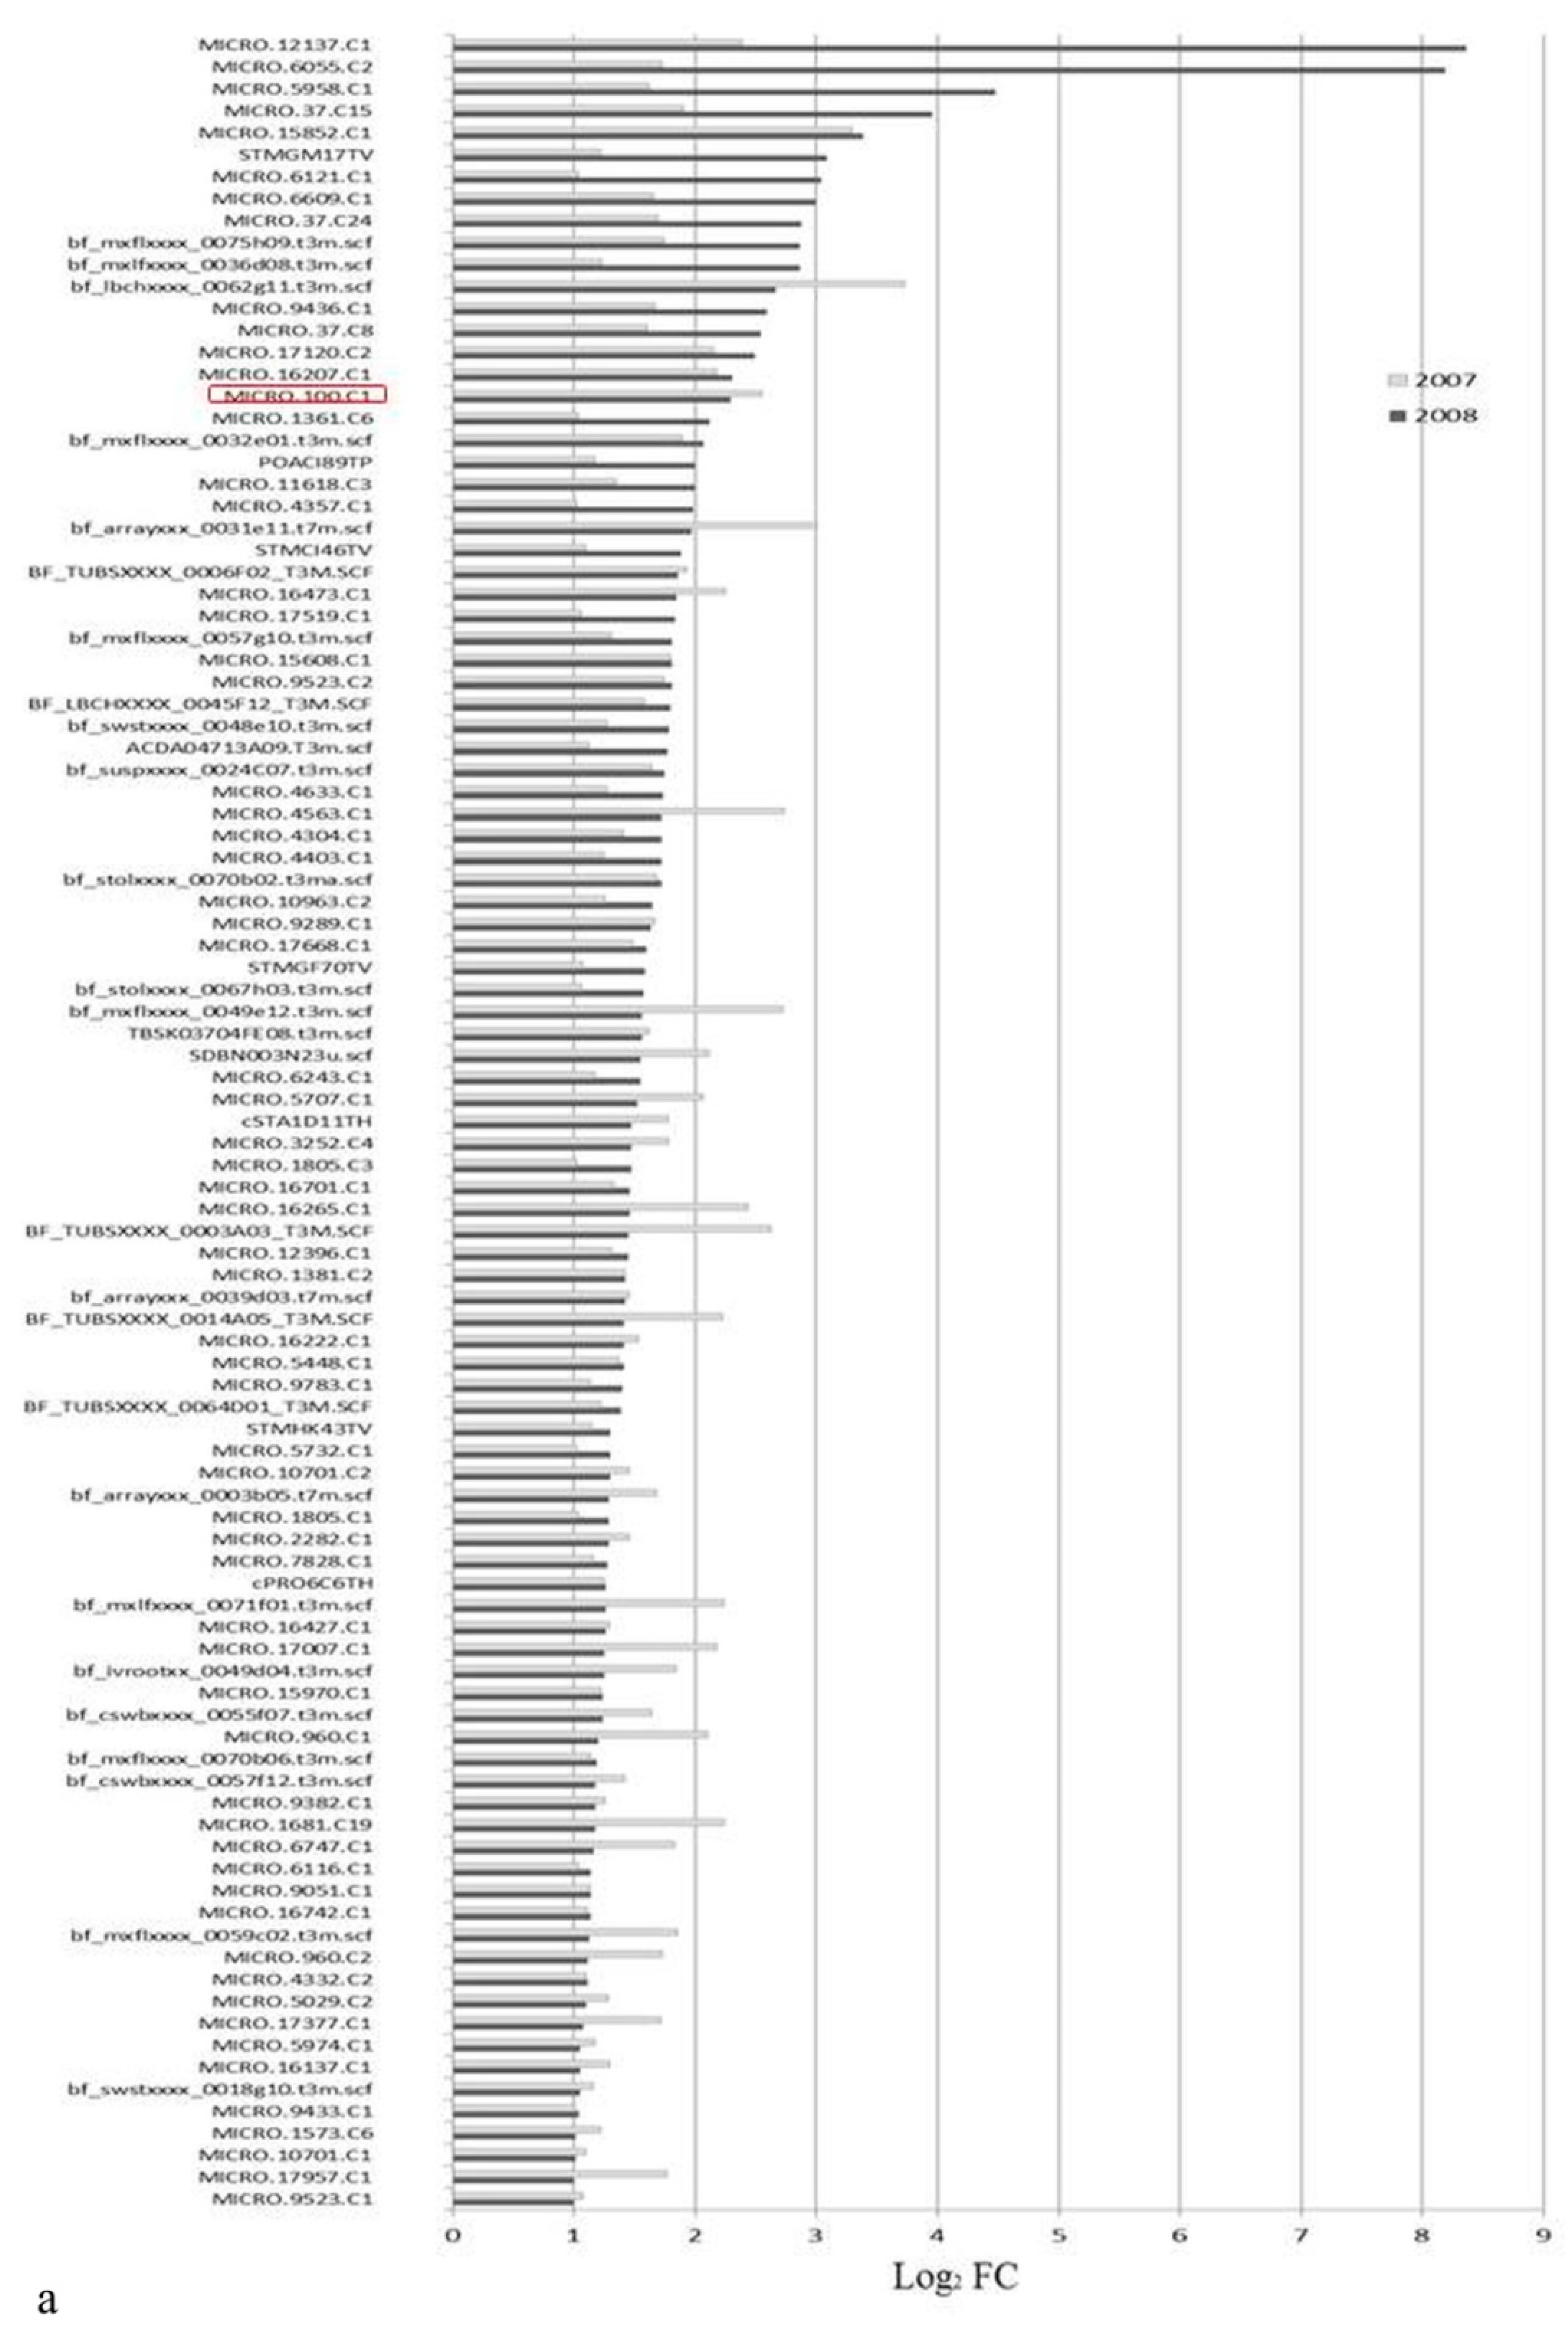
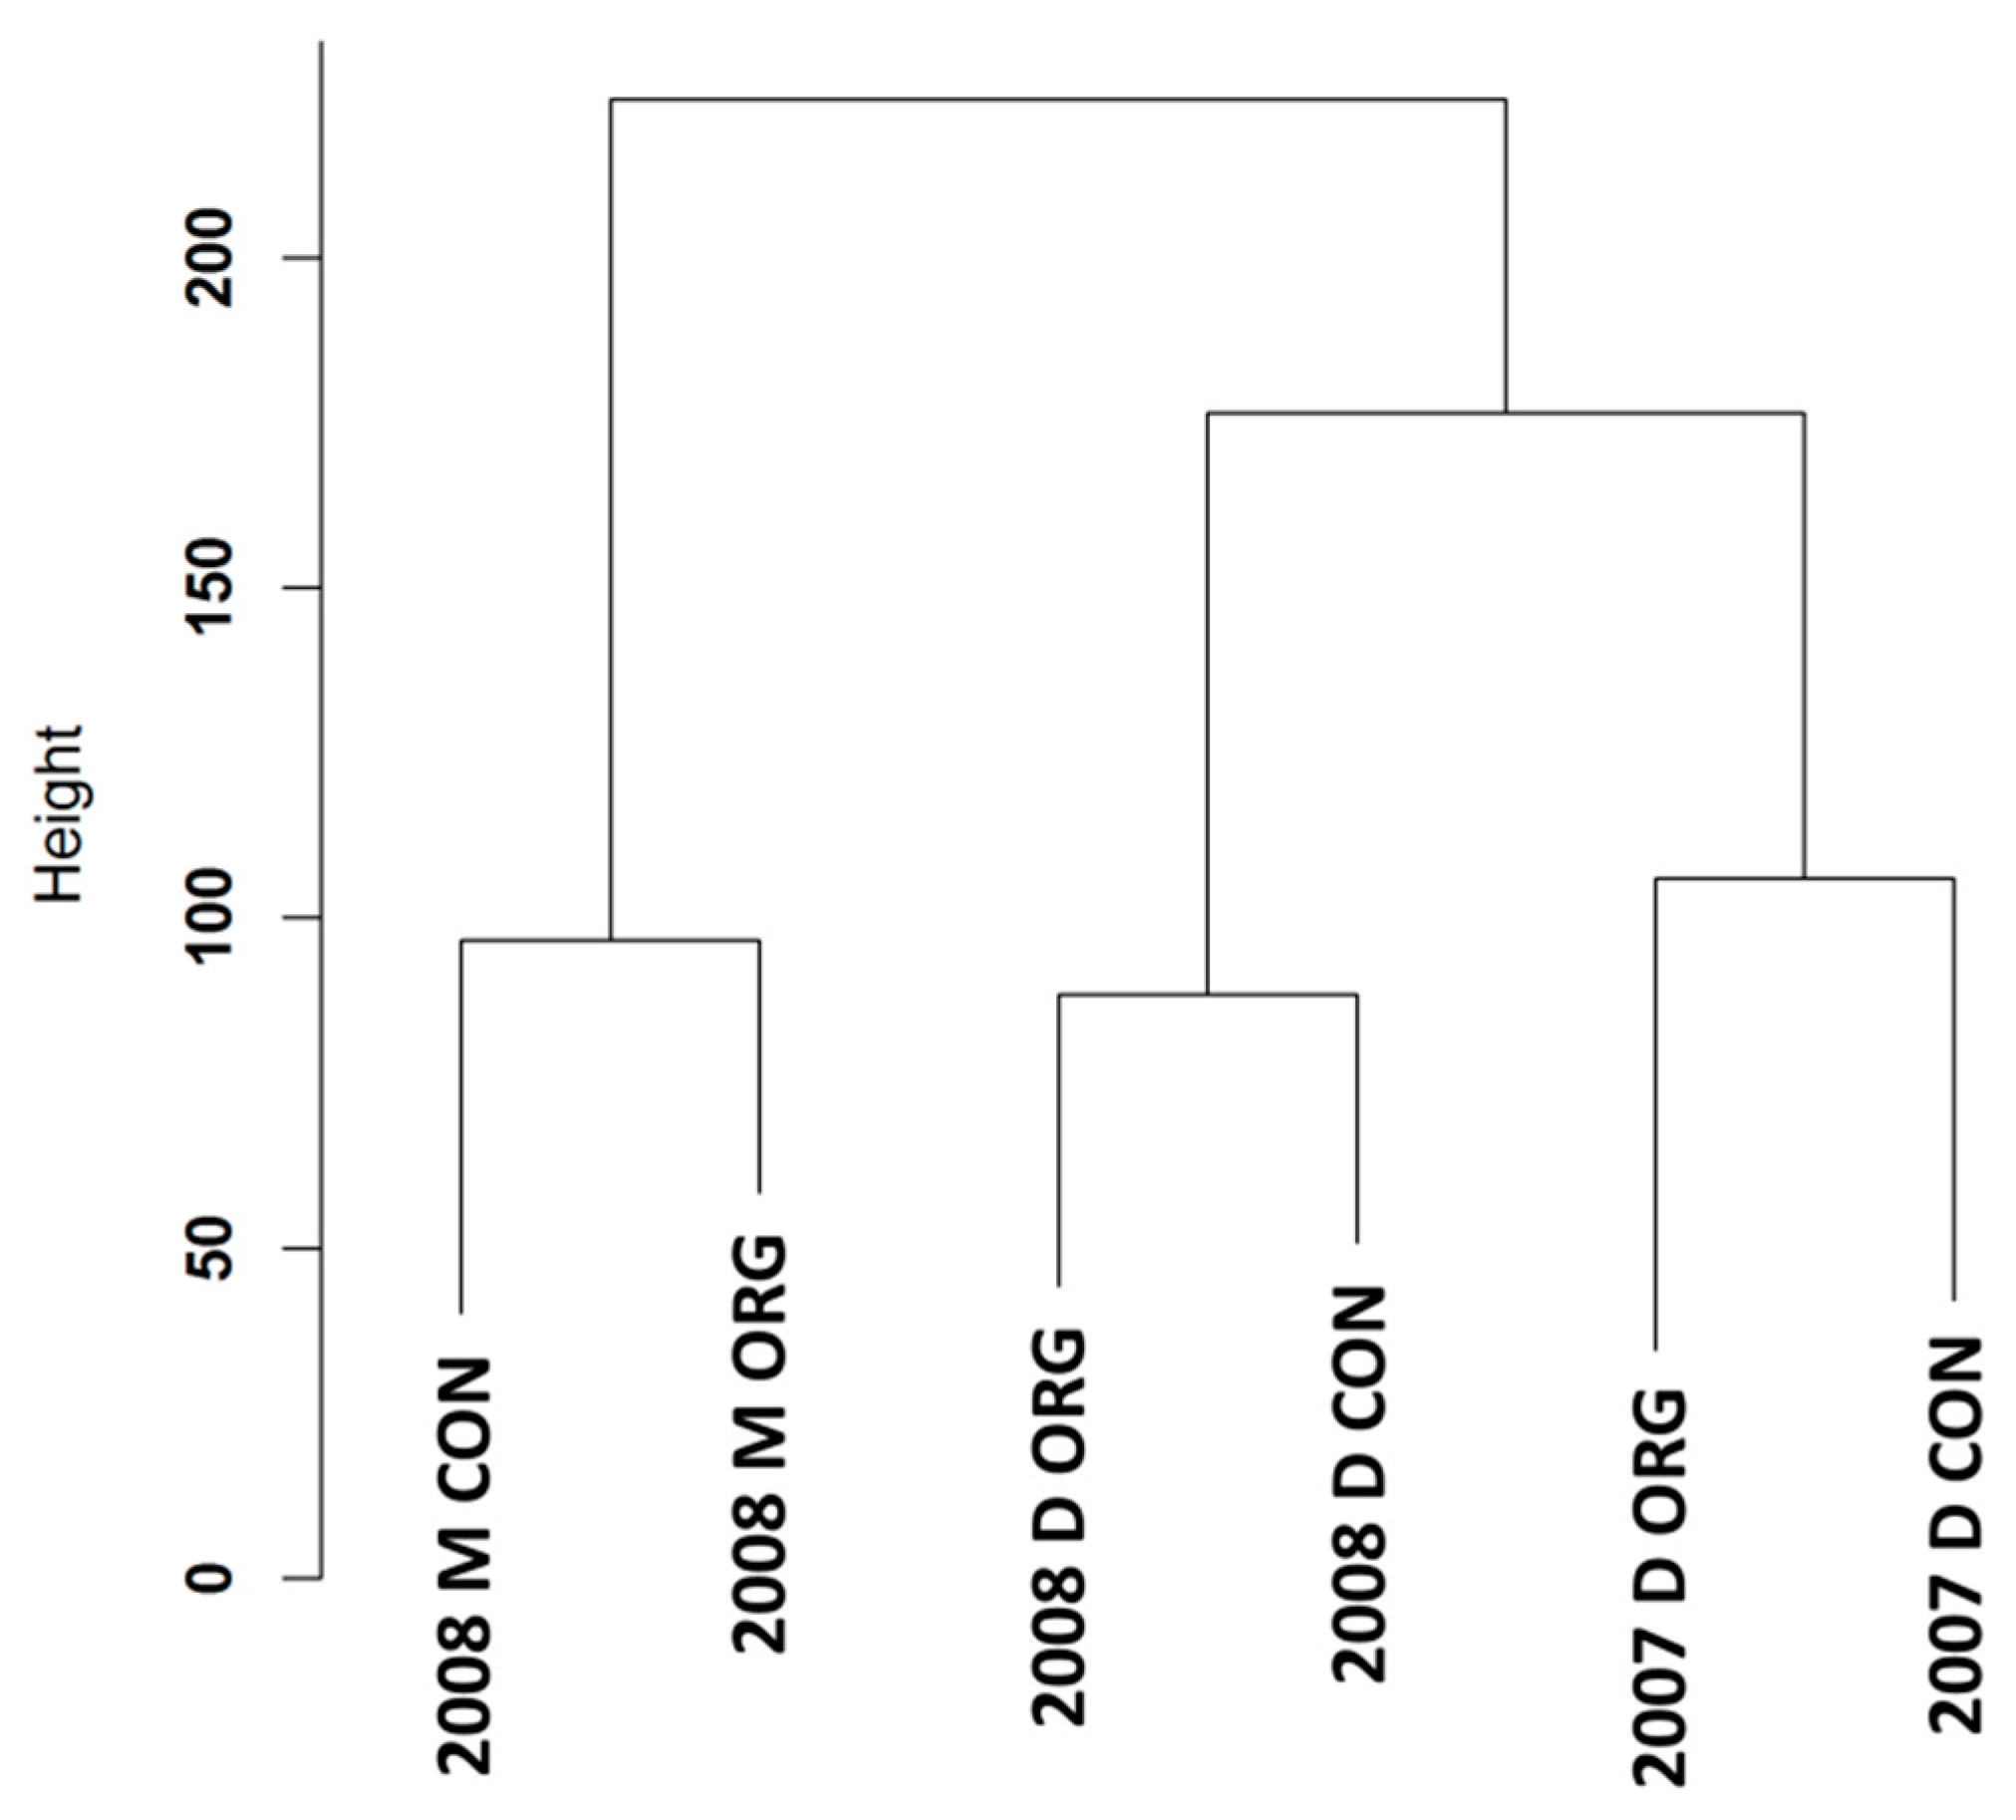
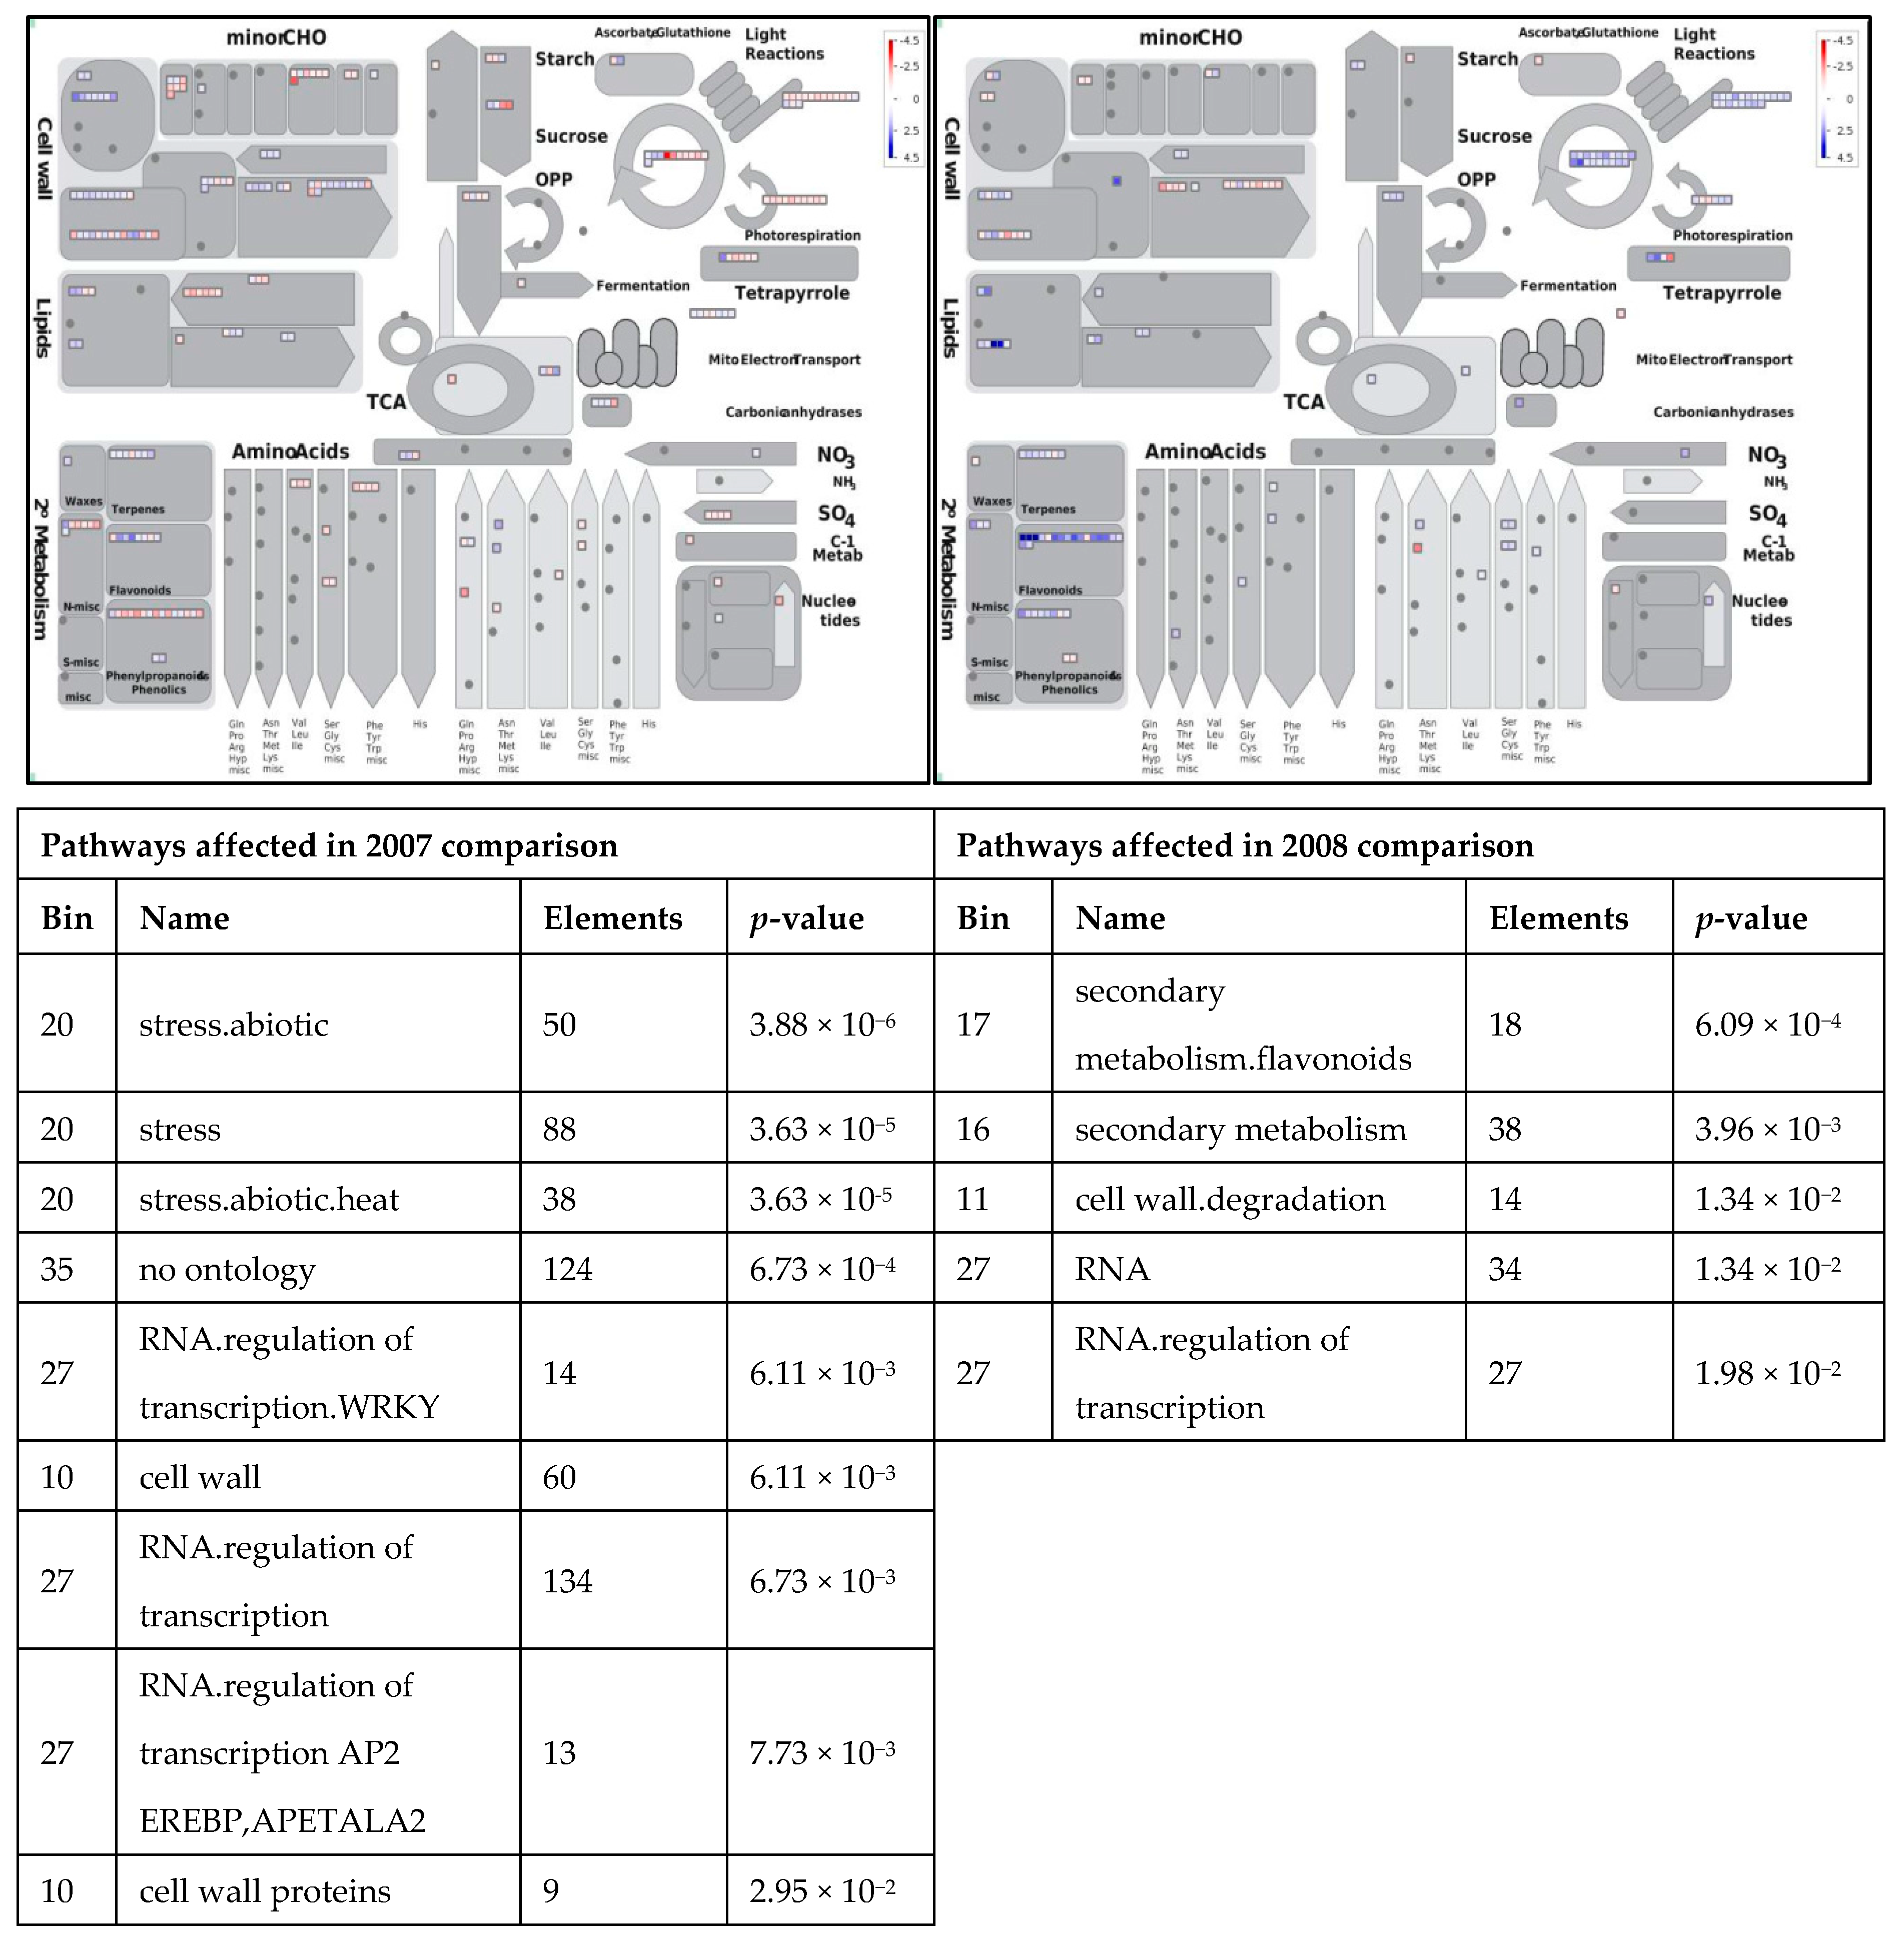
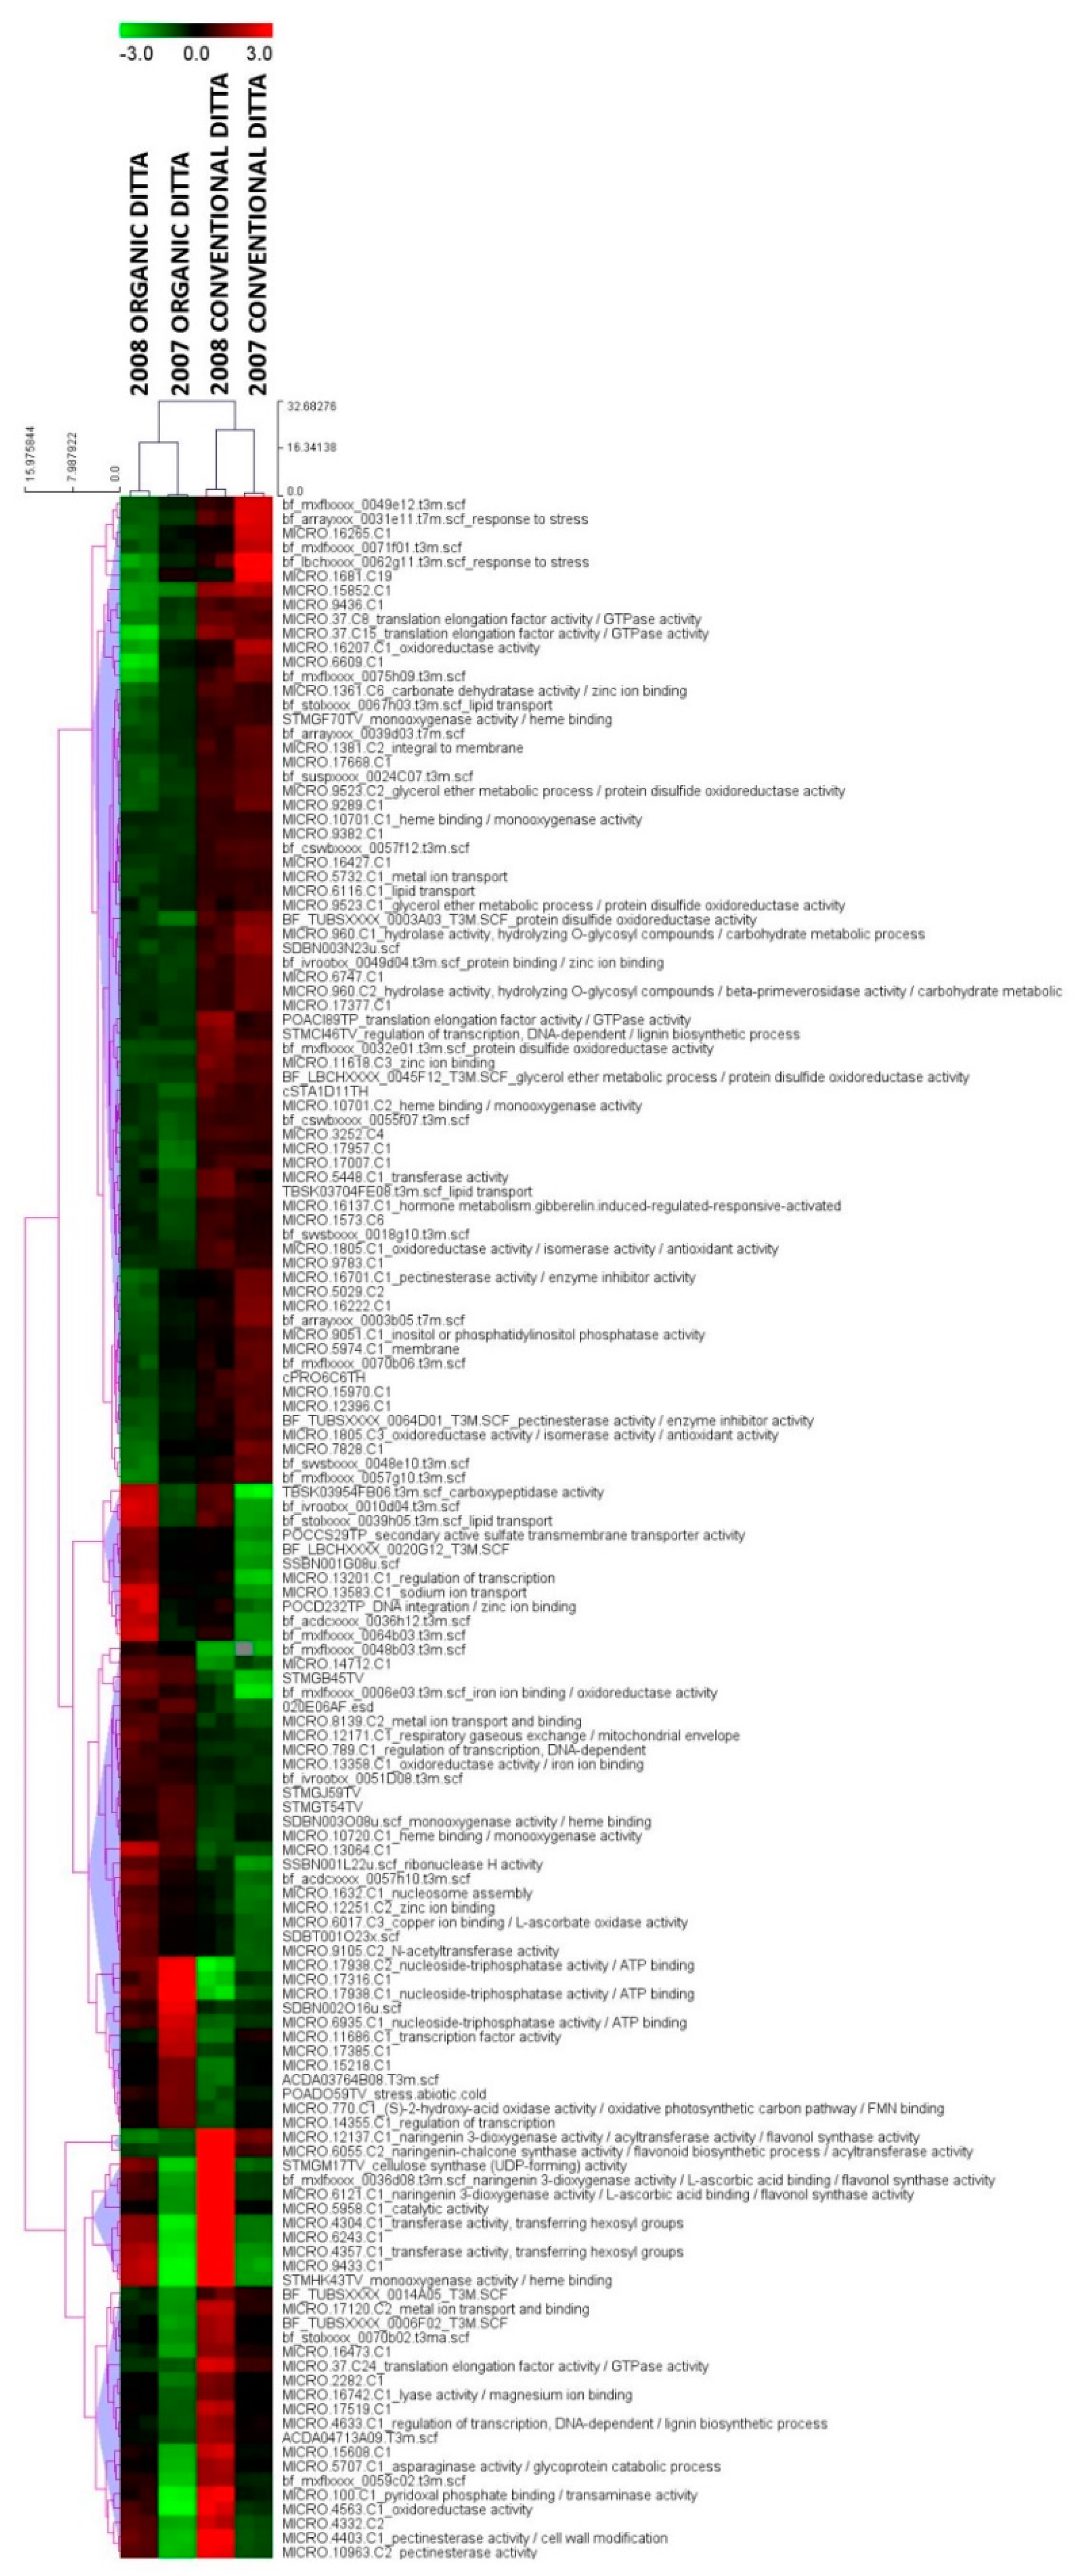
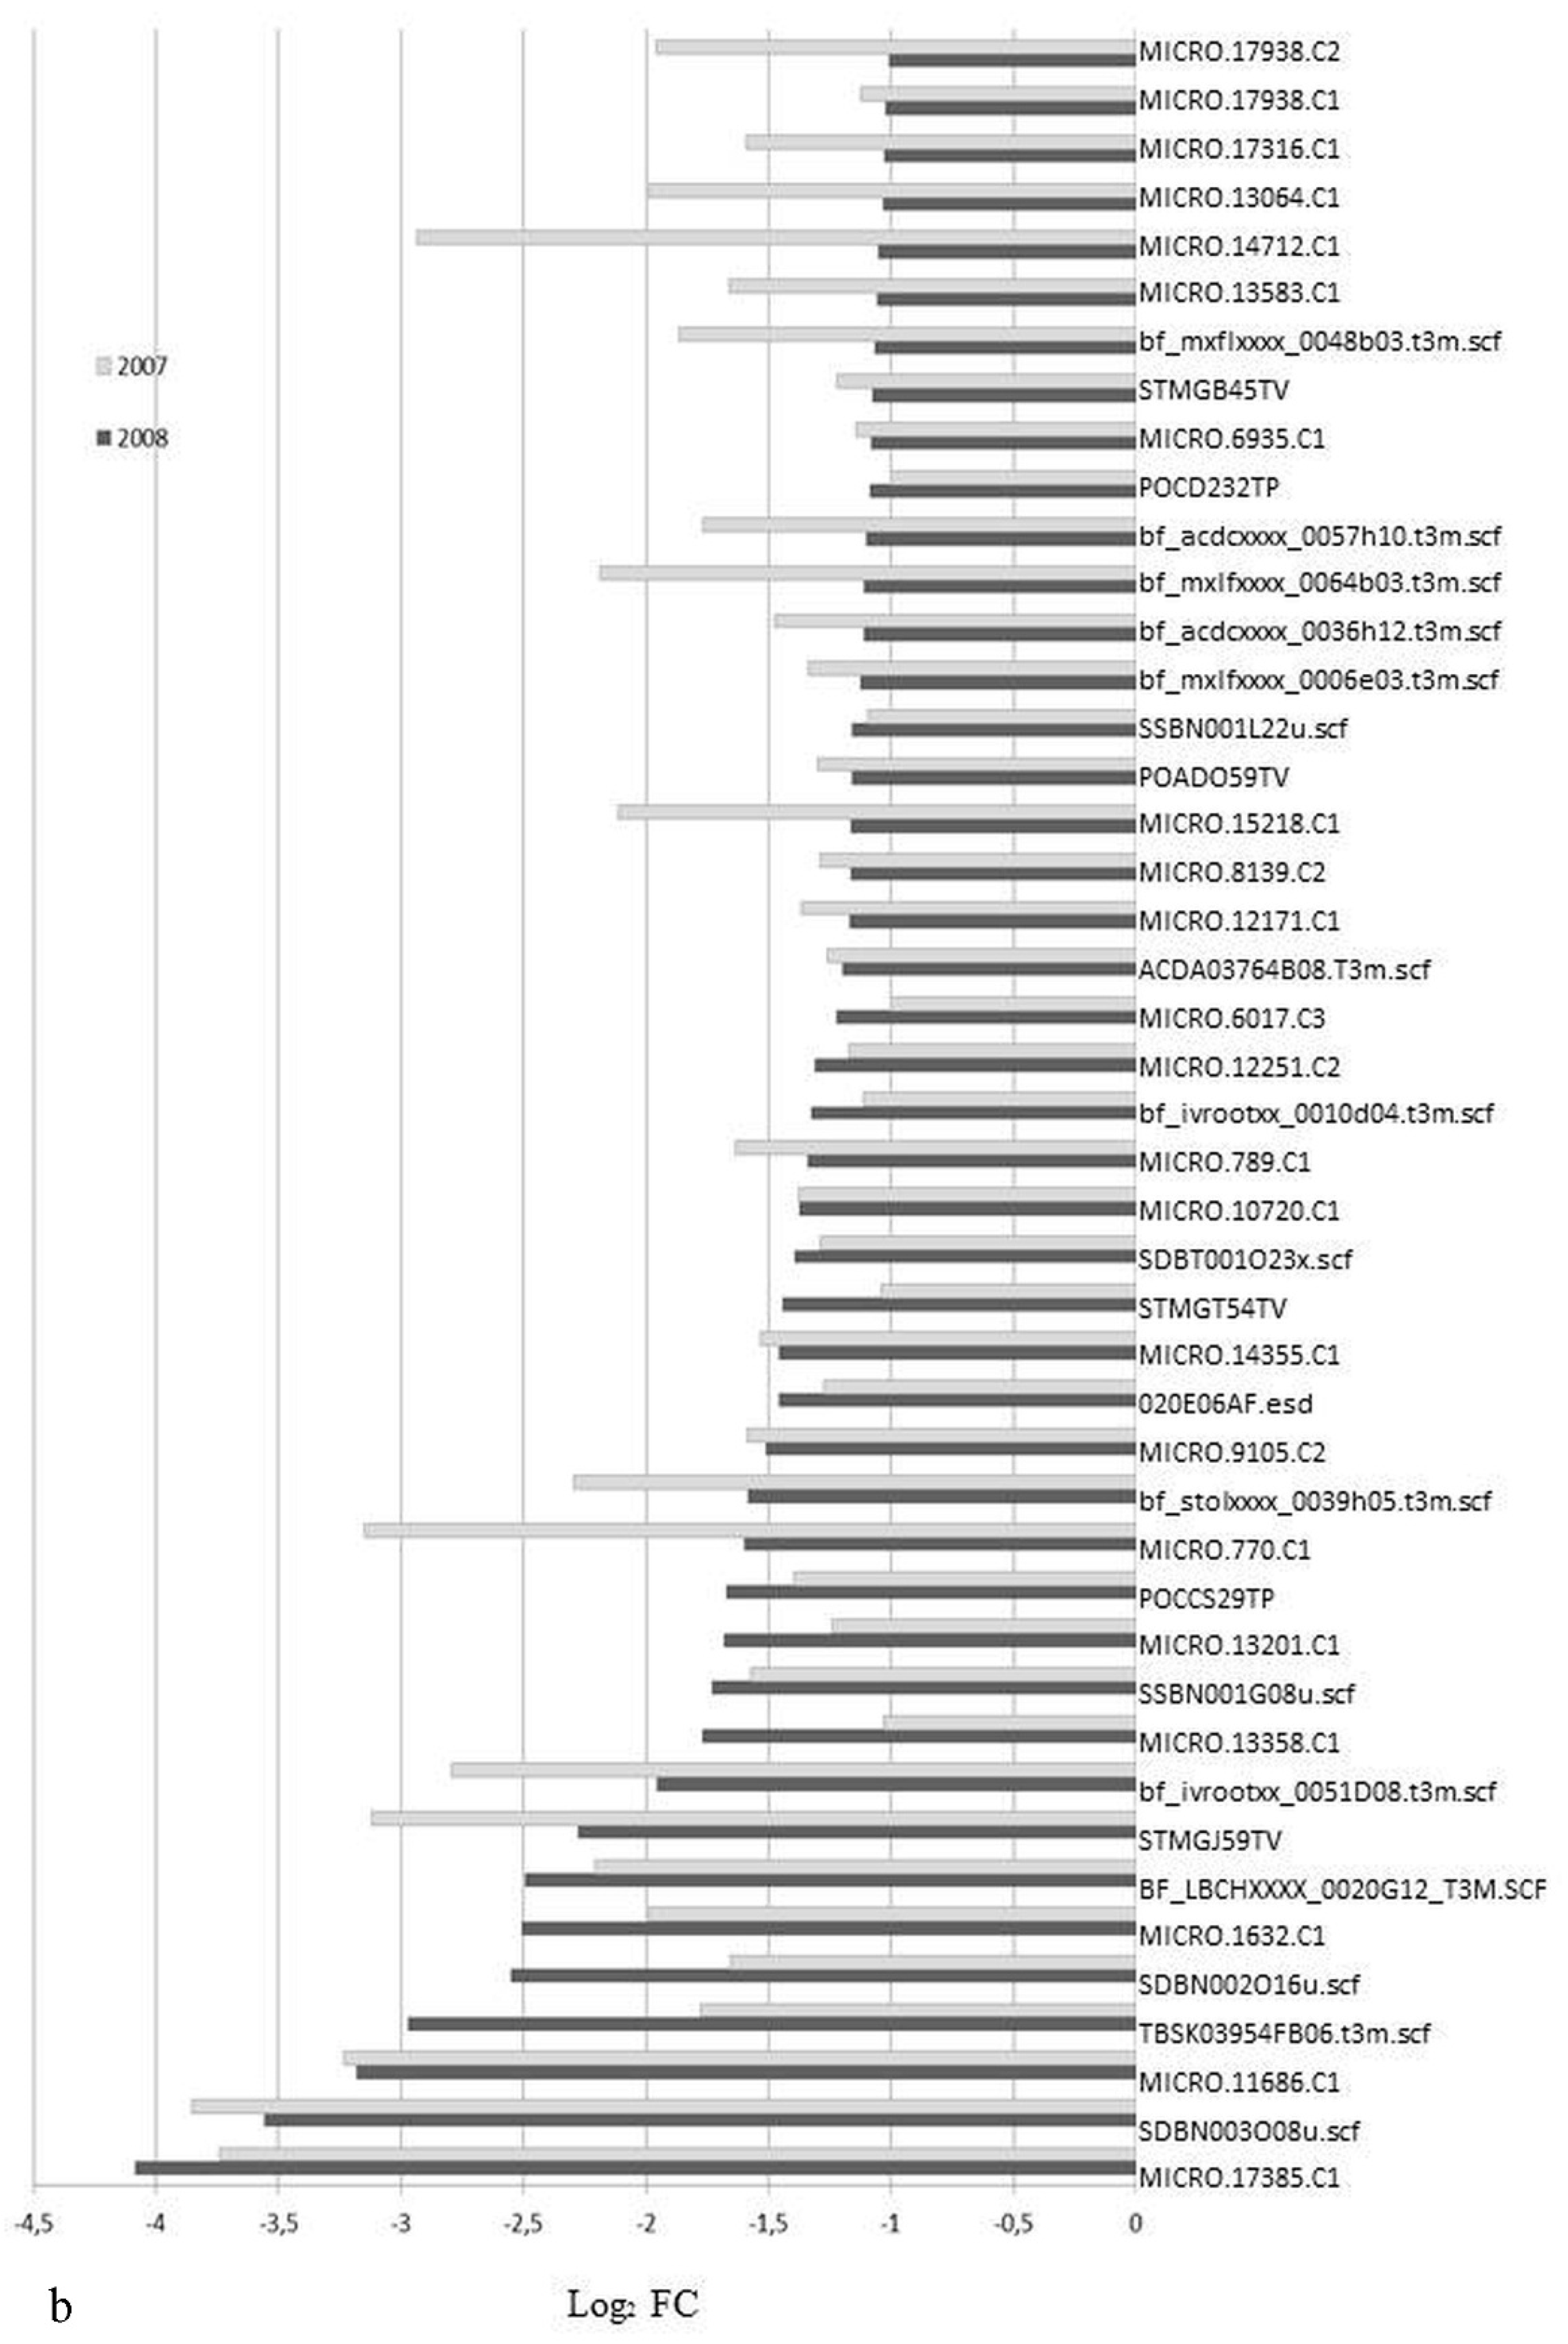
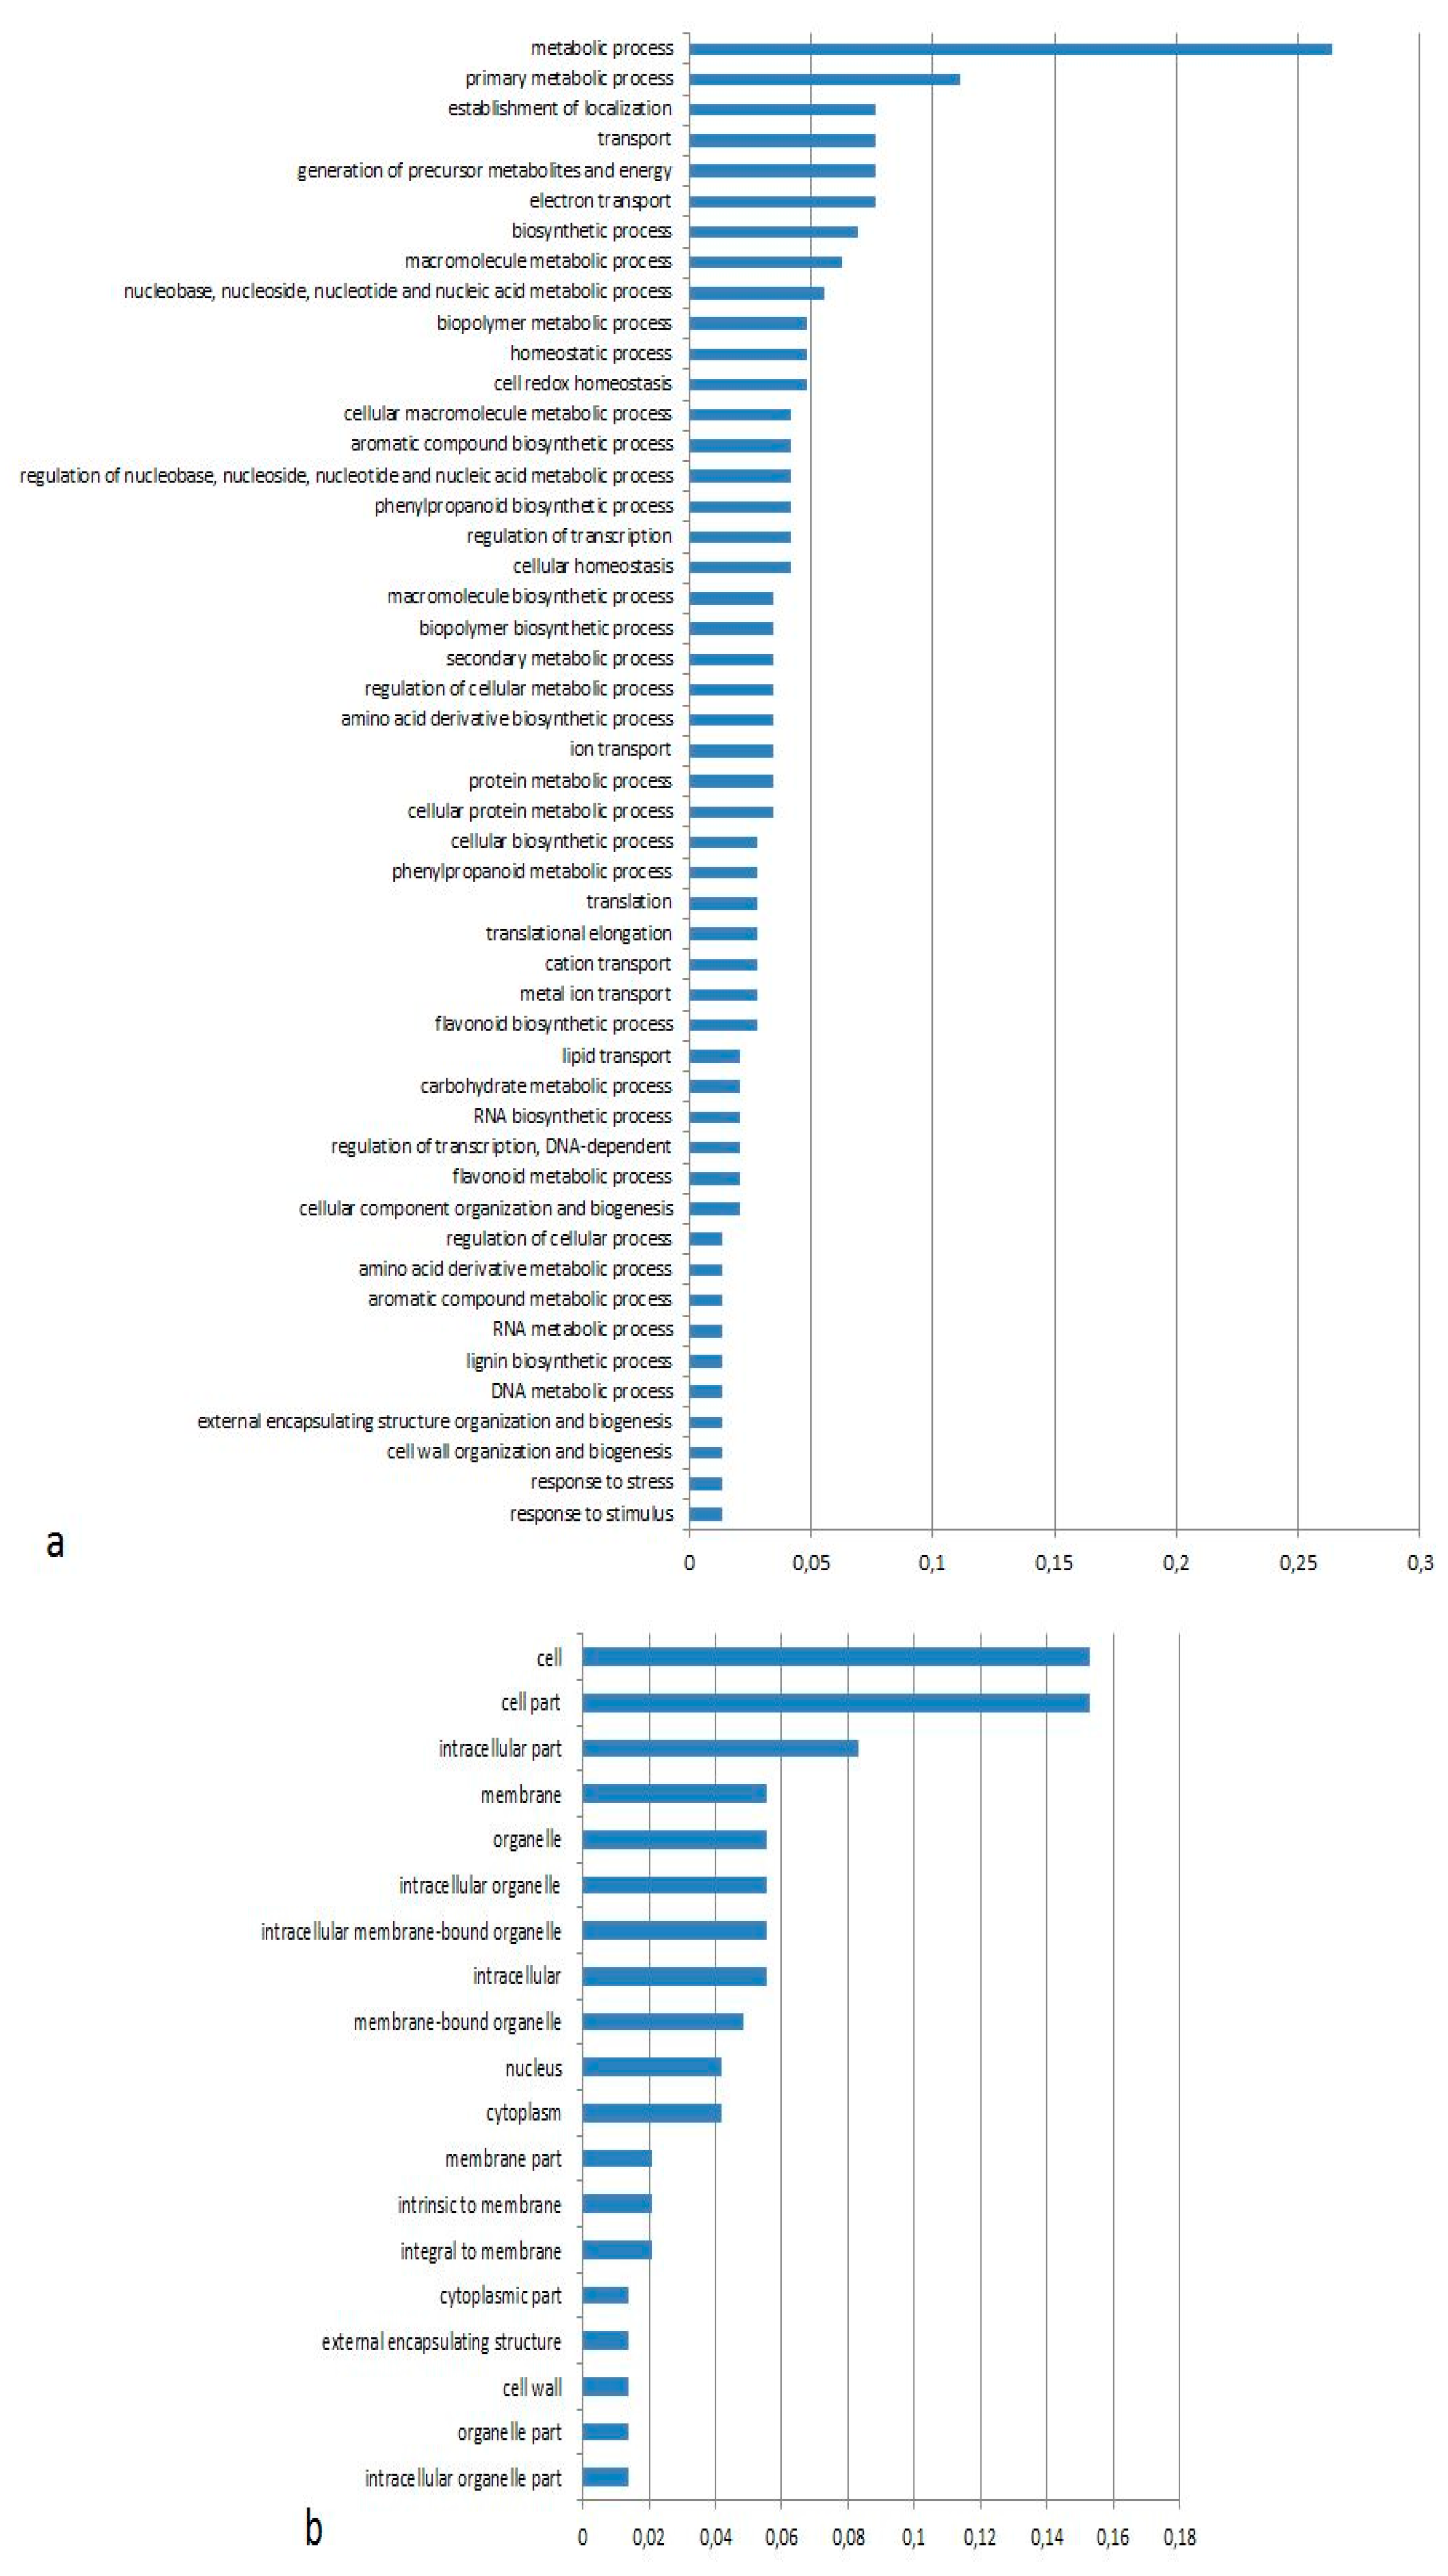
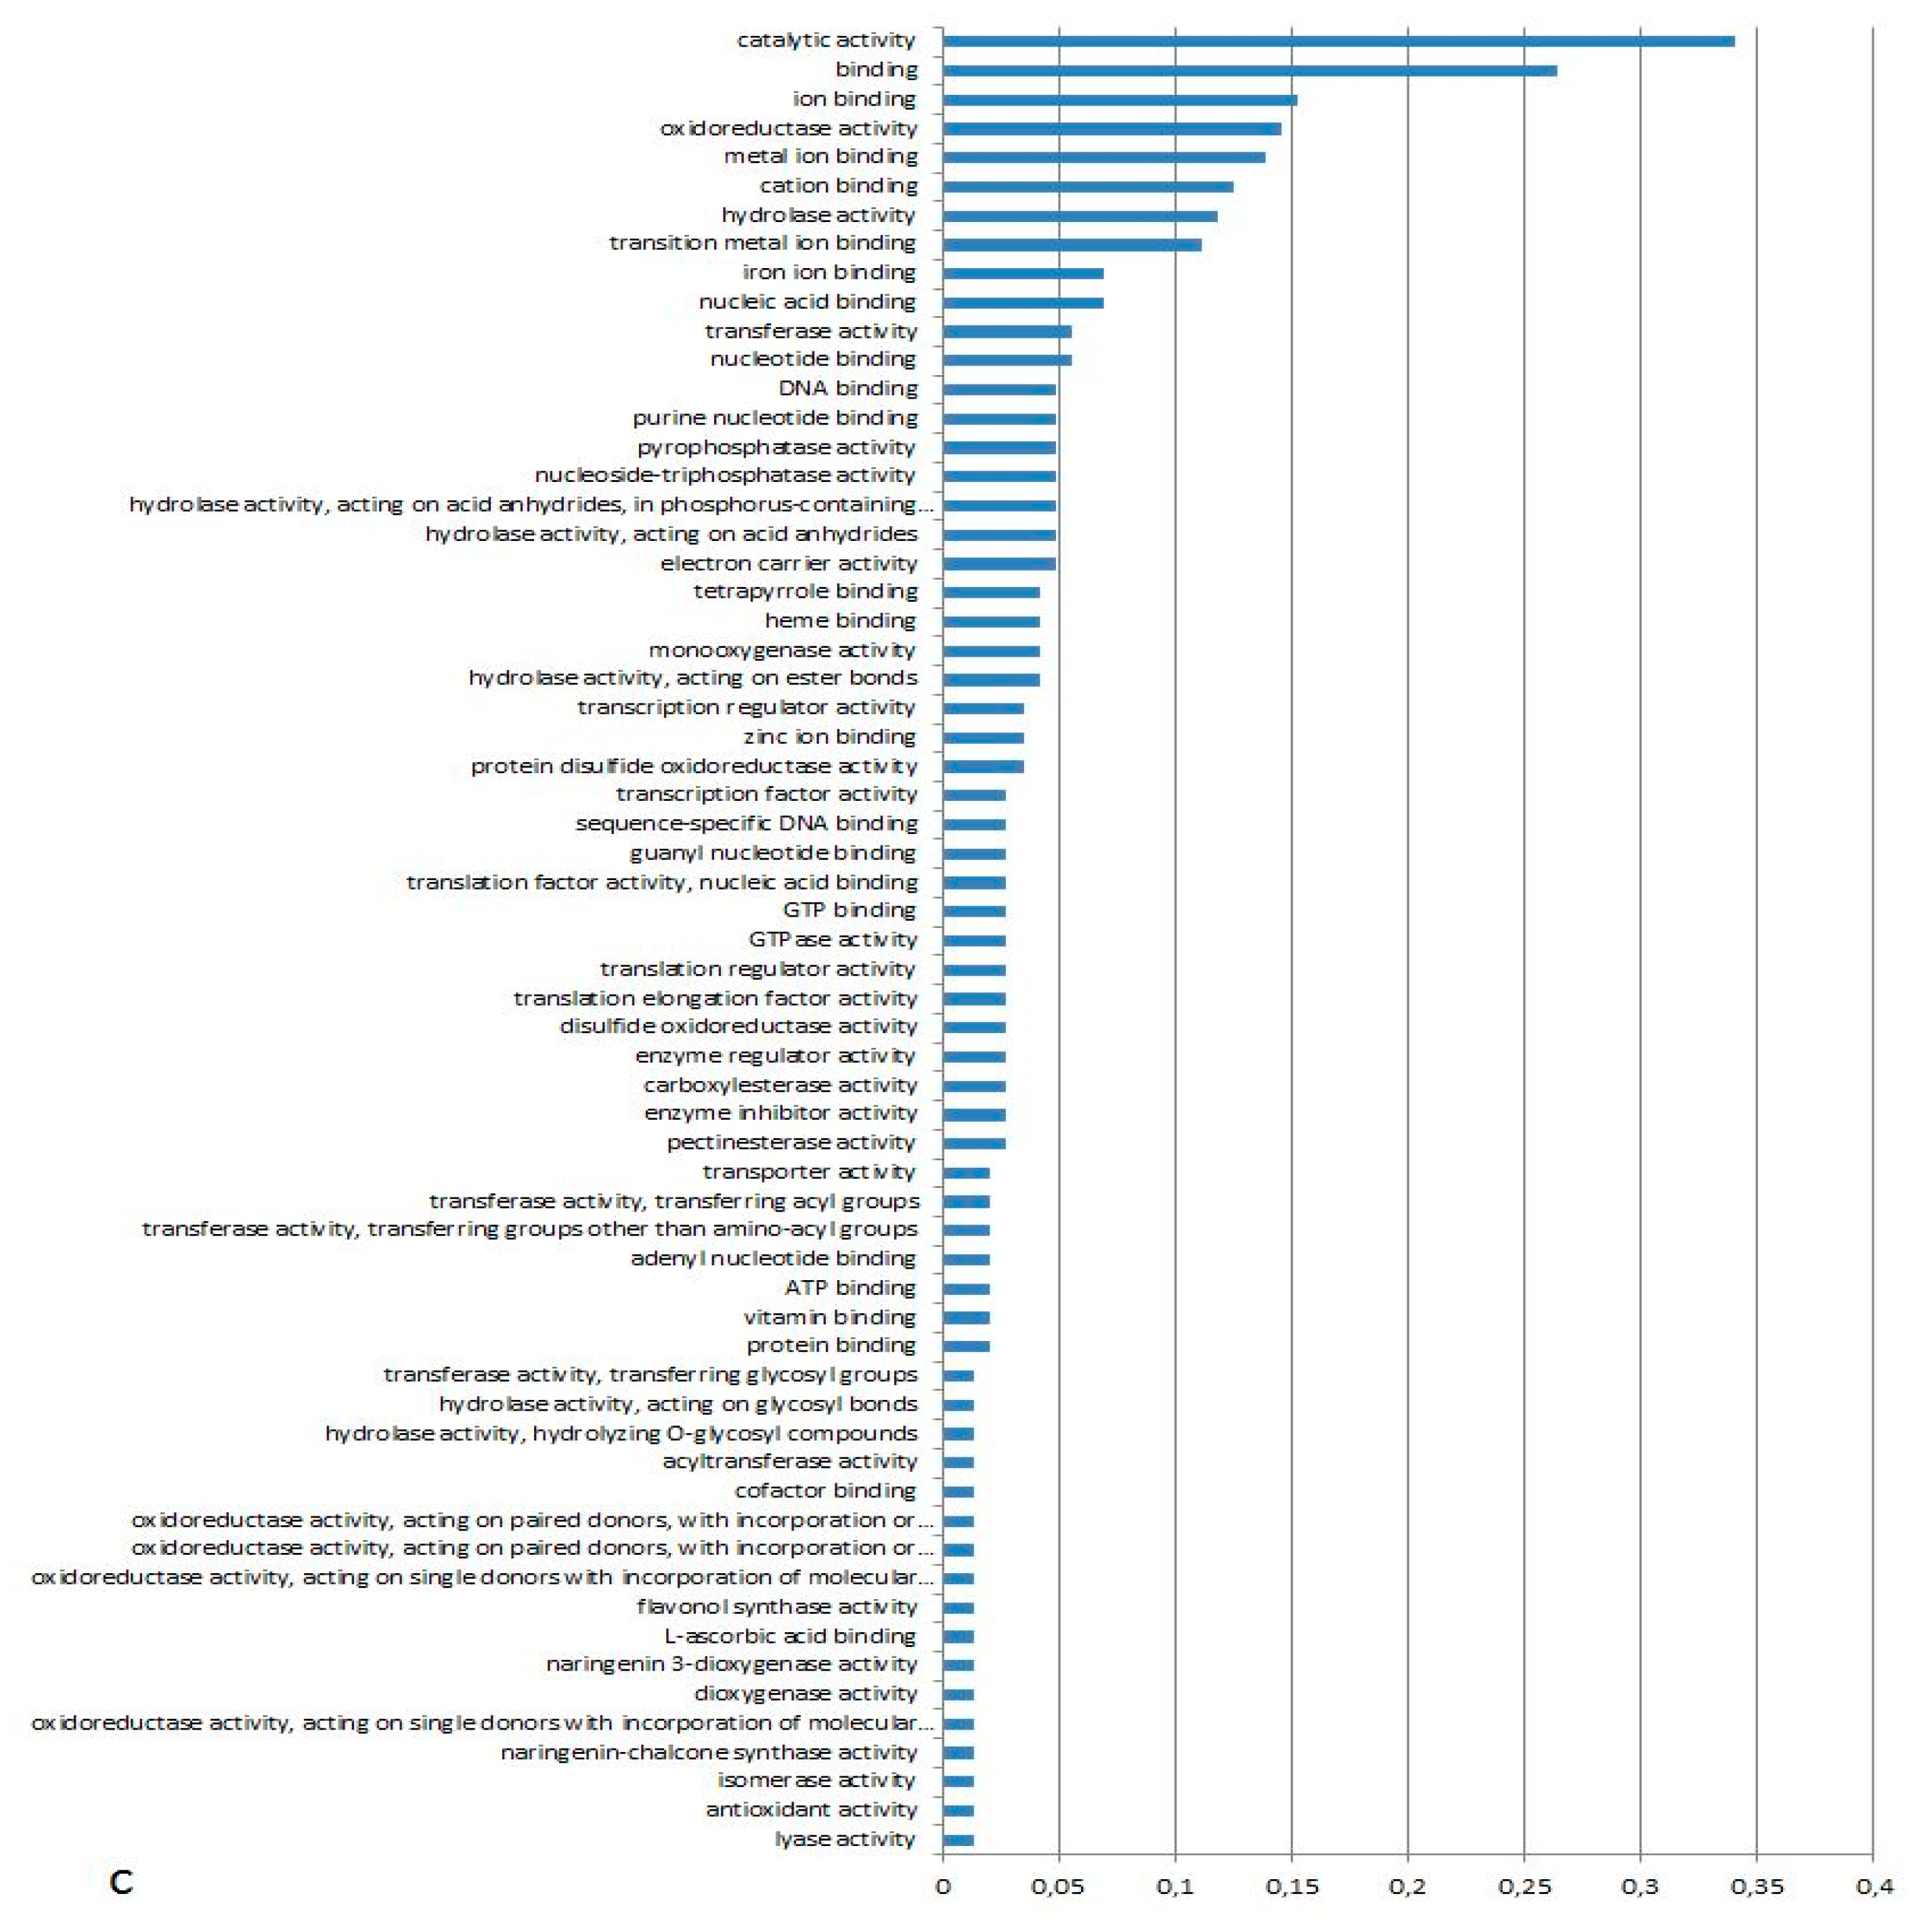
3.1. Expression Profiling and Functional Classification of Differentially Expressed Features Modulated in cv. Ditta over Two Years

Comparison within the same cultivation method of the microarray data from 2007 and 2008 revealed many differentially expressed features: 4188 (1515 up- and 2673 down-regulated) when conventional tubers from 2007 and 2008 from the two years were compared and 7213 (3267 up- and 3946 down-regulated) when organic tubers from the two years were compared. Among the 42,034 probes on the chip, 1996 (in 2007) and 697 (in 2008) microarray features had an absolute value of log2 transformed fold-change greater than one and significantly different (p < 0.01) comparing the conventional and organic tubers. Supplementary materials Table S1 shows the set of significant differentially expressed features grouped based on their fold-change value, into up- and down-regulated features. In 2007, 1020 features were significantly up-regulated, and 976 were significantly down-regulated in the conventional vs. organic comparison; however, in 2008, 485 features were up-regulated and 212 were down-regulated. The graphic views of MapMan analysis are reported in Figure 2 where the pathways were mapped through GO ontology terms and their significance was based on their p-values obtained by the Wilcoxon rank-sum test corrected for multiple testing using the Benjamini Hochberg procedure [21]. In 2007, the biological process most affected by the farming system was “stress-related”, and the Kegg representation showed strong activation of phenylpropanoid metabolism under organic farming. In 2008, “secondary metabolism” was the most affected, particularly flavonoid metabolism strongly repressed under organic farming. “Energy metabolism”, “cell wall metabolism”, “signalling”, and “RNA regulation” were identified by ORA analysis as the categories over represented in both years (Figure 3). ORA analysis was performed separately for up- and down-regulated genes. Among the genes involved in “response to stimulus and stress”, a blight resistance gene (SDBN002O16) was found with a log2FC three times higher in organic tubers than in conventional tubers in 2007.
A subset of 144 features exhibiting the same trend of expression in both years was obtained (Table S2): 99 up-regulated and 45 down-regulated probes. A graphical view of the co-expression values of each probe is reported in Figure A2. MapMan assigned a GO term to 78 sequences only (55%). When possible, the functional annotation was retrieved through individual gene analysis to obtain a more exhaustive biological meaning from the microarray data: 20 probes significantly matched annotated sequences either in the potato database [24] or in the NCBI non-redundant Solanaceae database. Genes that were significantly differentially regulated in both years in the conventional vs. organic comparison were categorized according to biological process (BP), molecular function (MF) and cellular component (CC) and in accordance with the GO terms available (Figure A3). In the first categorization, many genes were seen to be involved in “metabolic process” (27%) and “movement or maintenance of molecules” (16%), including “establishment of localization” and “transport”, “energy process” (16%), including “generation of precursor metabolites and energy”, and “electron transport”. Among the MF terms related to catalytic activity and protein with binding function, hydrolase activity, ion binding and DNA-binding, respectively, were the highest ranking. Many genes were identified as regulatory based on their annotation: zinc finger ring family protein (bf_ivrootxx_0049d04.t3m.scf and MICRO.12251.C2), heat shock protein transcription factor (MICRO.4633.C1; ACDA04713A09.T3m.scf; STMCI46TV), WRKY DNA-binding protein (MICRO.11686.C1; MICRO.789.C1), basic helix-loop-helix (bHLH; MICRO.13201.C1), transcription factor TGA6-like (bZIP) (MICRO.17519.C1), jasmonic acid regulatory protein (MICRO.14355.C1), and histone H4 (MICRO.1632.C1). The majority of the probes belonging to the category “energy process” were annotated as “protein disulphide oxidoreductase” (MICRO9523.C1; MICRO9523.C2; bf_tubsxxxx_0003A03_mscfbf_stolxxxx_0032e01.t3m.scf; bf_lbchxxxx0045F12_t3m.scf) and cytochrome P450 (MICRO.10701.C1; MICRO.10701.C2; SDBN003O08u.scf; STMGF70TV; STMHK43TV). Among the probes annotated as “binding”, proline-rich protein (bf_stolxxxx_0067h03.t3m.scf; MICRO.6116.C1; TBSK03704FE08.t3m.scf), ubiquitin (MICRO.11618.C3), iron ion binding (MICRO.13358.C1), magnesium ion binding (MICRO.16742.C1), metal ion binding (MICRO.17120.C2 MICRO.8139.C2), and copper ion binding (MICRO.5732.C1) were identified. Concerning the CC terms, those indicating differentially expressed probes active in intracellular milieu and in the organelle occurred most frequently (Figure A3).
The changes in global gene expression in potato tubers under different crop management and growing seasons are shown in Figure 4. Genes were grouped into five clusters sharing similar expression patterns: clusters A and D comprised genes repressed in the organic crop system, whereas induced genes grouped into cluster C. Although clusters B and E included genes that exhibited the same expression trend, they also seemed to be strongly influenced by the growing year. Likewise, most of the probes were classified into the “energy” category clustered in group A, identifying global repression of this biological process in organic farming. MICRO.17316 (unknown), MICRO.17938.C1, MICRO.17938.C2, and MICRO.6935.C1 (annotated as “nucleoside triphosphatase binding proteins”) belonged to group C. Their specific annotation was found through the combination of functional characterization and the clustering approach because they all were found to be homologues to XM00634852 encoding FIGL1 (100%, 96%, 95%, and 98% of similarity, respectively). Within groups D and E, 6 probes were identified as related to secondary metabolism: four were involved in flavonoid metabolism (MICRO.12137.C1 and MICRO.6055.C2, corresponding to chalcone synthases, [27]; bf_mxlfxxxx_0036d08.t3m.scf and MICRO.6121.C1, corresponding to flavonol synthases); two were related to anthocyanin metabolism: MICRO.4304.C1_1071 and MICRO.4357.C1_1392 (anthocyanidin-3-glucoside rhamnosyltransferase and anthocyanidin 3-O-glucosyltransferase). Four pectinesterases (bf TUBxxxx0064D01_T3M; MICRO.4403; MICRO.10963; MICRO.16701) and one glutathione S-transferase (GST) (MICRO.5448) were found to be down-regulated in organic tubers, while one ascorbate oxidase (AO) MICRO.6017) and one 1-myoinositol phosphatase (MICRO 9051.C1) were found to be up-regulated. Regarding gibberellin biosynthesis, our data indicate that this pathway is differently regulated in the conventionally vs. organically grown tubers: cytochrome P450 monooxygenase (MICRO.6892.C1), which oxidizes ent-kaurene to GA, ent-kaurene oxidase (MICRO.10720.C1), which catalyses the late steps of GAs biosynthesis, a gibberellin 3-beta-hydroxylase (bf_mxlfxxxx_0006e03.t3m.scf), and a metabolism-related gibberellin induced-regulated-responsive factor (MICRO.13238.C1) were found to be regulated (both up- or down-) in organically grown tubers [28].
Nine assays were designed on the 60-mer probe sequence, thus reducing the probability of amplifying orthologues or alleles of the gene identified by the probe on the microarray. Overall, results showed good accordance between the data obtained by microarray and real-time PCR (Figure 5). Their annotation, their ID, and the cluster to which they belong are reported in Table A5.

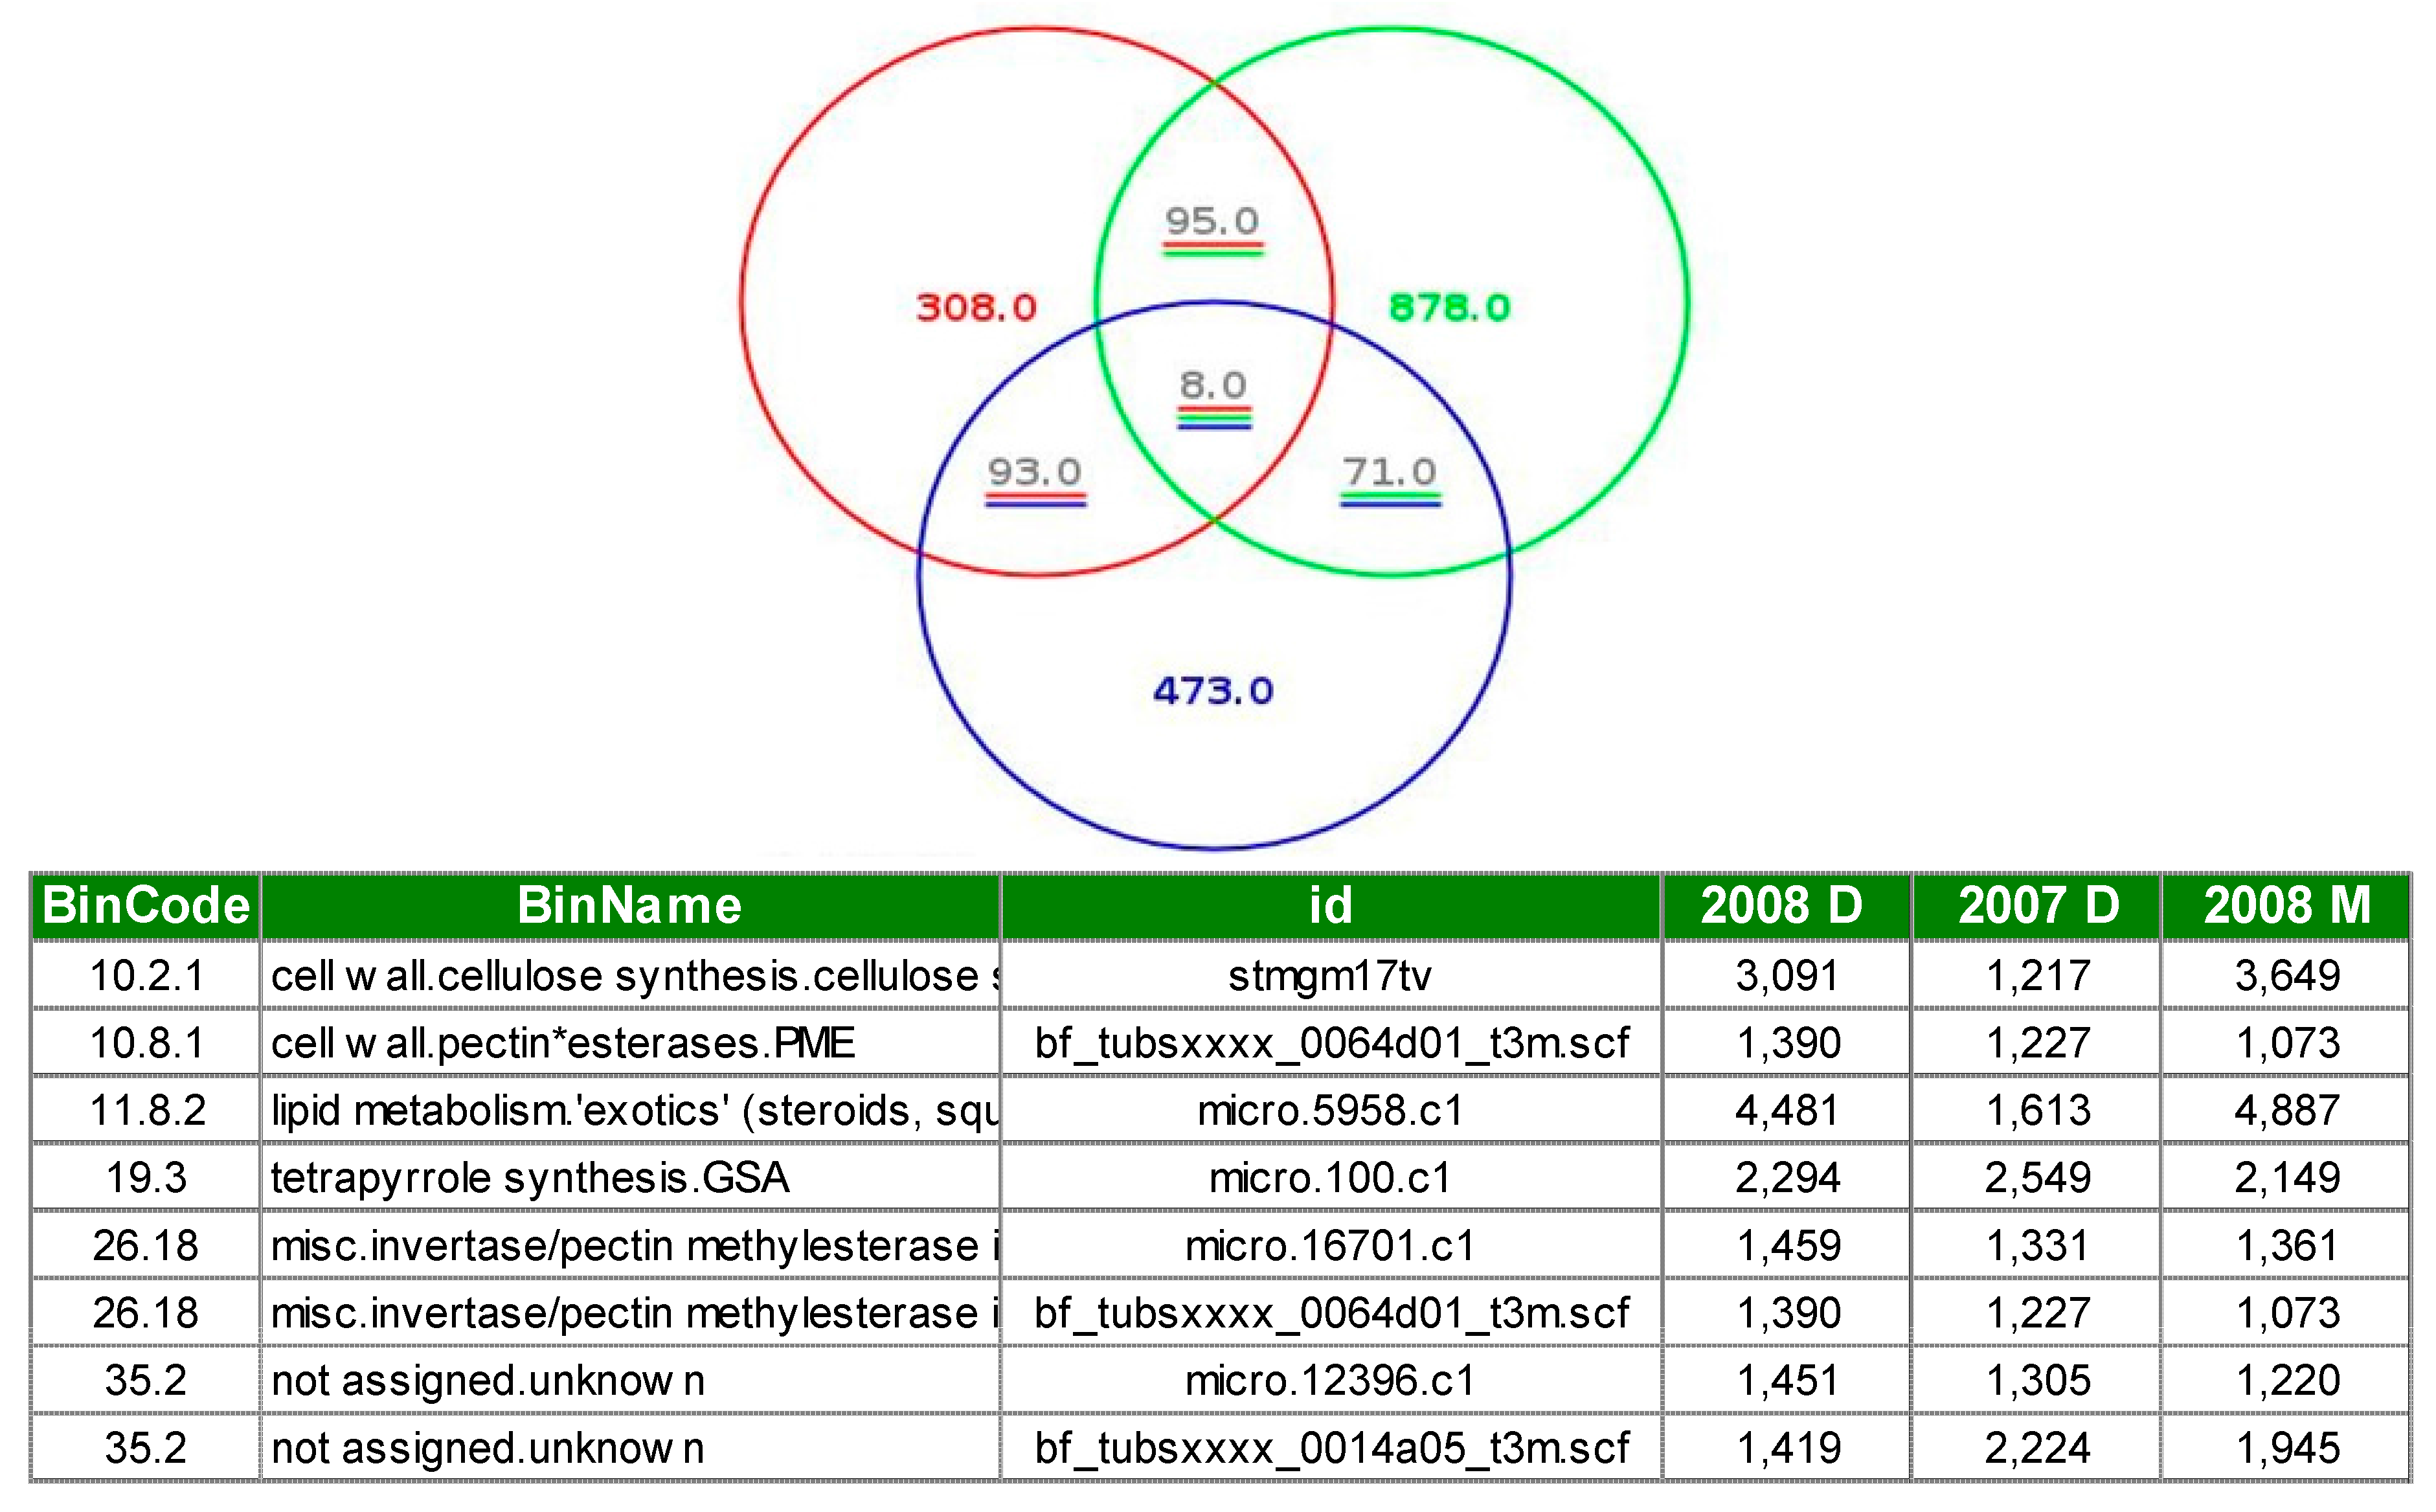
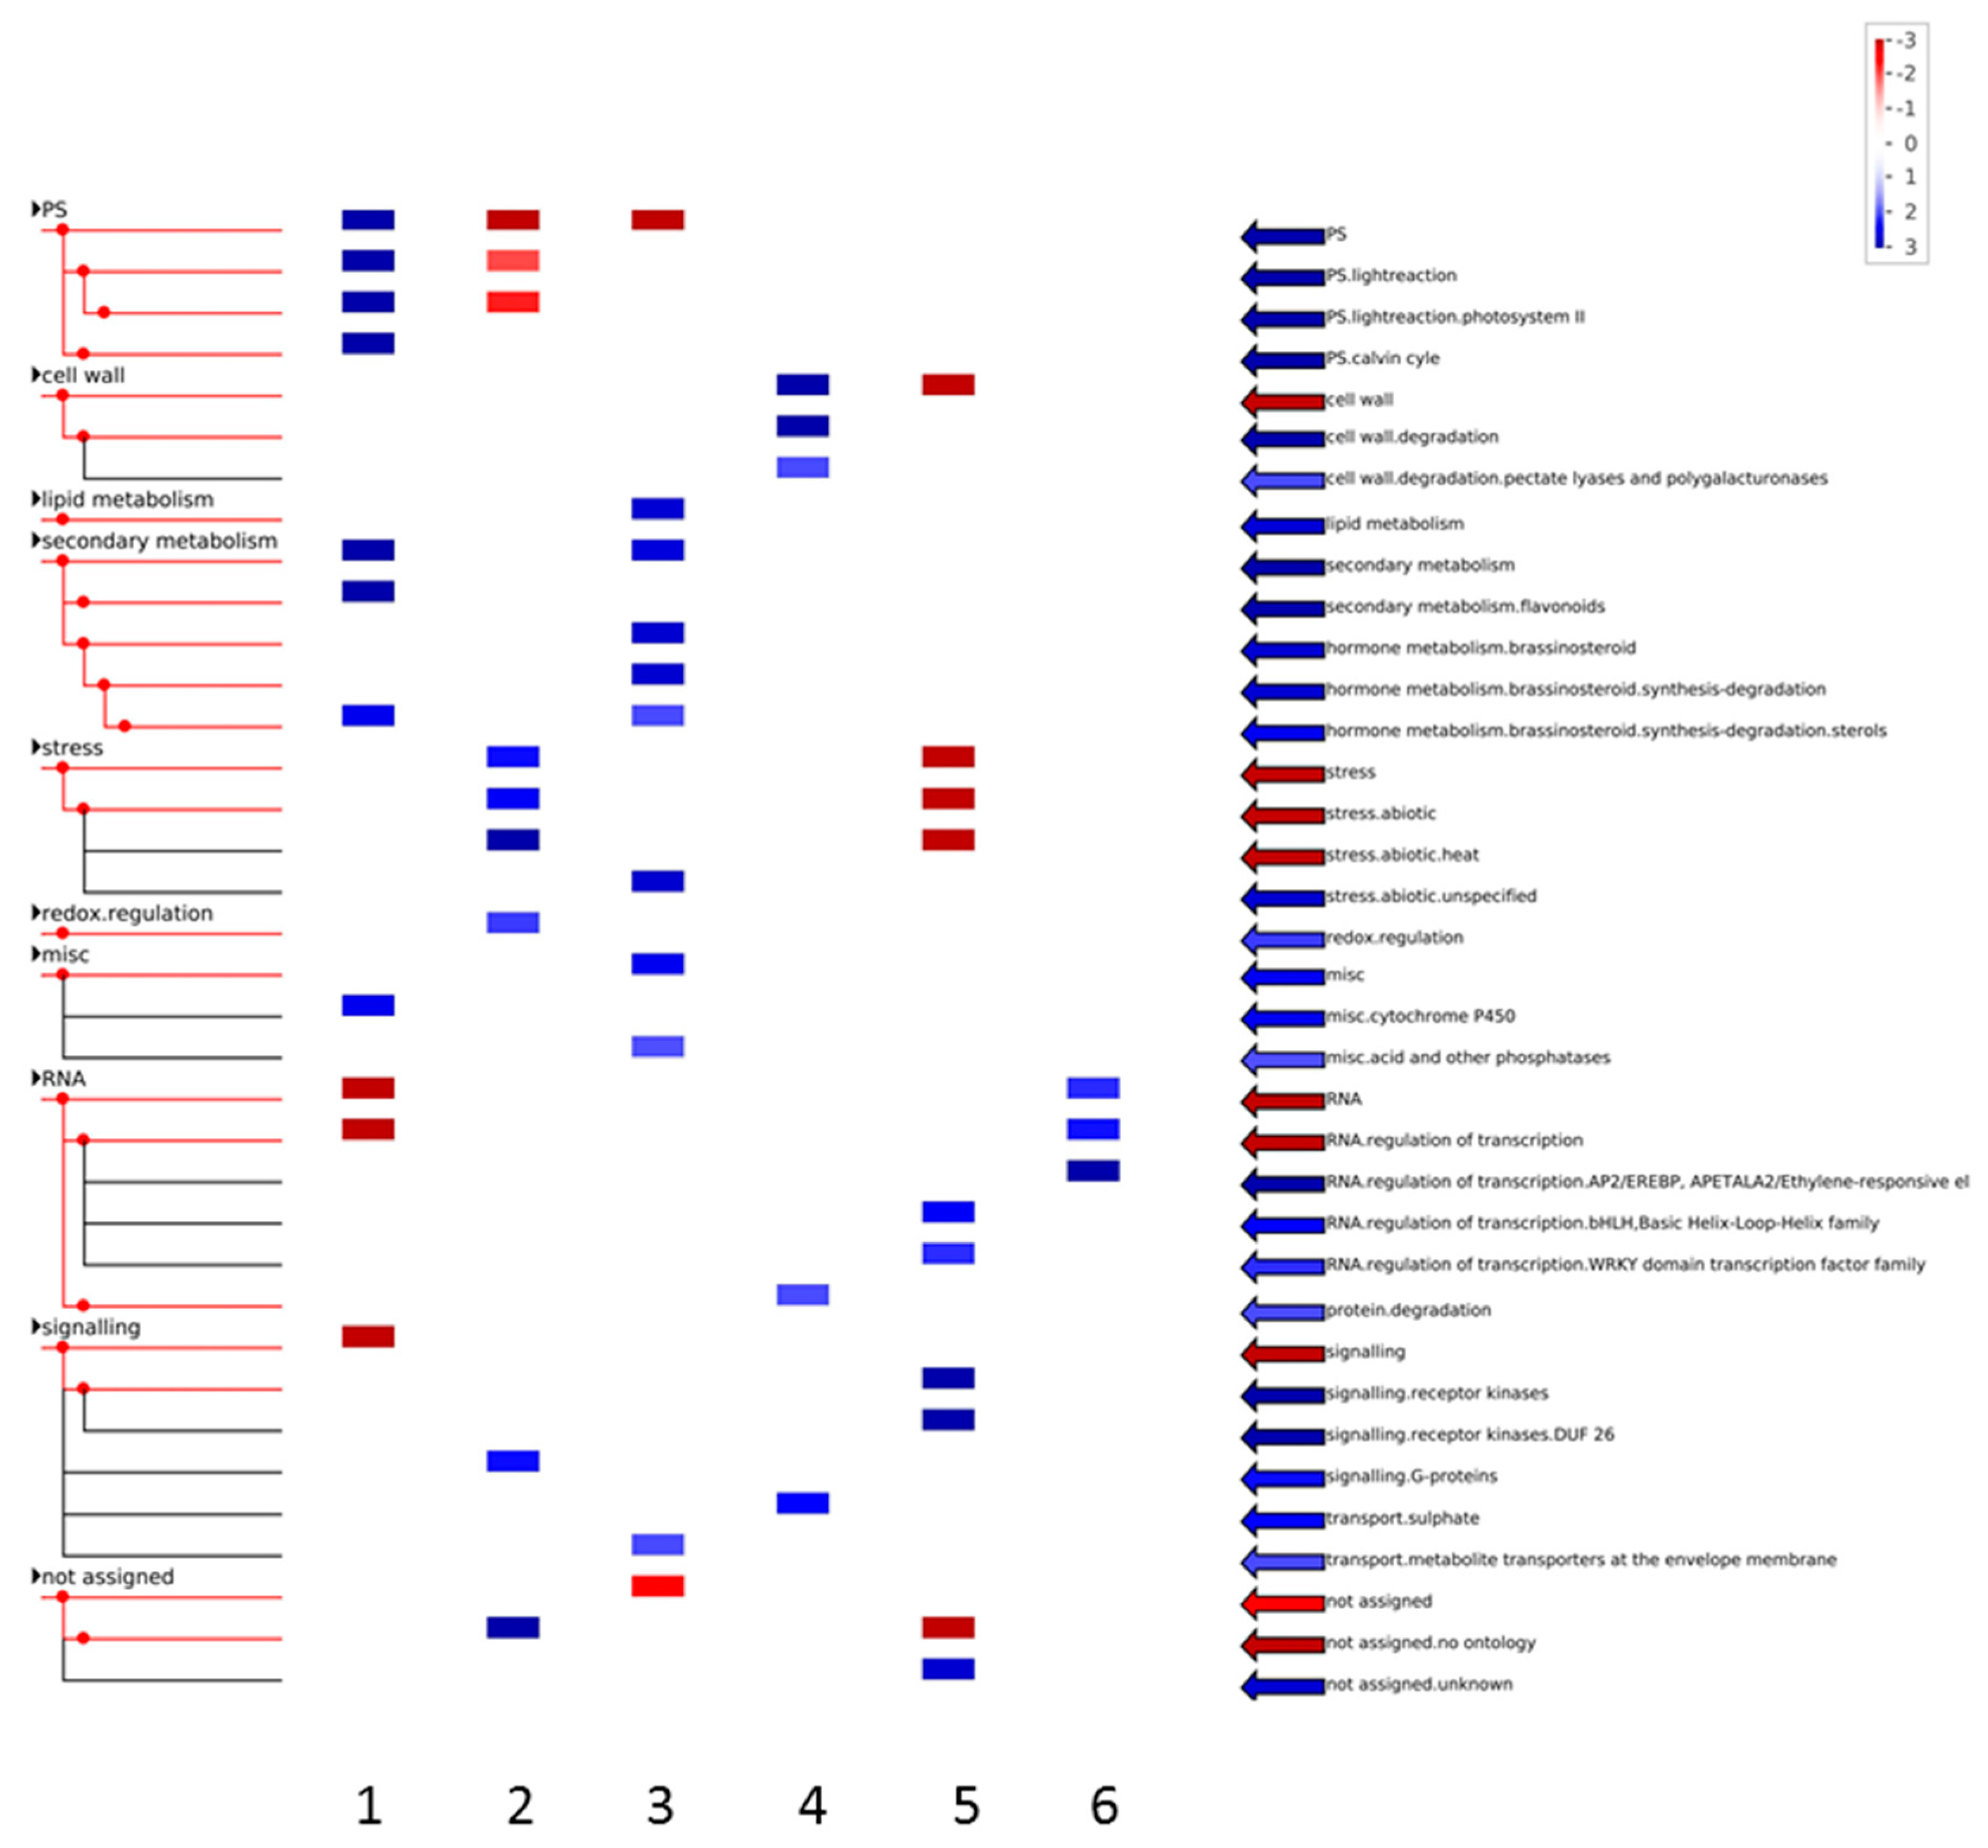
3.2. Expression Profiling and Functional Classification of Differentially Expressed Features Modulated in Clone Ditta and Clone MN1404 O5

Microarray analysis of the genotype MN1404 O5 resulted in 897 microarray features fulfilling a log2-transformed fold change greater than one that was significantly different (p < 0.01), whereas 618 genes resulted in up- and 279 down-regulated features (Table S3). The transcriptomic response to organic farming in the same location was evaluated in two genotypes and two years through three independent experiments. One hundred thirteen features showed the same trend of expression in both genotypes and one year (96 up-regulated and 17 down-regulated probes). Among them, only eight differentially expressed probes showed the same trend in two genotypes and two years—i.e., they were found to be up-regulated in conventionally grown tubers of cv. Ditta both in 2007 and 2008 and confirmed in the clone MN 1404 O5 in 2008 (Figure 6). All of them were up-regulated in conventional farming.
Among these probes, micro.100.C1 corresponded to GABA transaminase isoform 2. Figure A2 shows that it was the most regulated gene confirmed in all the experiments and was validated by real-time PCR, showing 20 times lower transcription in organic farming (Figure 5).
Nine features corresponding to five genes of glycoalkaloid metabolism were identified as regulated: stg3 (β-solanine/β-chaconine rhamnosyl transferase 3; MICRO.11.C1 and MICRO.11.C2), stg1 (UDPgalactose:solanidine galactosyltransferase; MICRO.2681.C1), hmgr (3-Hydroxy-3-methylglutaryl coenzyme A reductase; MICRO.6420.C1), stg2 (UDPglucose:solanidine glucosyltransferase; MICRO.212.C5, MICRO.212.C3, MICRO.212.C7, STMJM96TV), and pss (squalene synthase; MICRO.2146.C1). Stg1, stg3 and hmgr exhibited the same expression profiling, showing up-regulation in conventional tubers with an FC from 20 to 35 times (Table S3) in both genotypes (2008). Stg2 and pss were significantly differentially expressed in most features (p < 0.01) but did not pass the log2FC filter. Comparing the expression profiling of both probes annotated as stg3, they resulted up regulated in 2007 irrespective of farming system (by nearly 65-times in coventional tubers and 40-times in organic tubers).

4. Discussion

To address the impact on tuber metabolism and its nutritional value, the approach of associating functional characterization and pathway analysis with large-scale transcriptome analysis was used. Although the POCI array is an effective platform for potato transcriptome characterization, the attribution of functional roles to differentially expressed probes was complex because the functional annotation of the unigenes used in the probe design is quite limited and covers a restricted percentage of the 42,034 features on the array. The combination of the functional classification approach and clustering method enabled the identification of putative functions for many of the differentially expressed sequences that remain undetermined. Four probes lacking annotation grouped together with FIGL1 in cluster C (Figure 4). They probably represented either allelic variations of the same gene or homologues with a redundant function or new role. The biological function of FIGL1 remains unknown: it belongs to the ATPase AAA superfamily, chaperones involved in the assembly and disassembly of various macro-protein complexes in response to various cellular activities and to stress [12].
Transcriptome changes occur in potato tubers in response to organic management. As reported previously [4], crop management affected biological processes and pathways related to the quality of the tuber. Herein, transcriptional induction of the phenylpropanoid pathway, known for its important role in the interaction between plants and the environment, was found in organically grown tubers in 2007 (Figure 2), when the plants exhibited, to some extent, the symptoms of Phytophtora infestans infection, with a high severity at the 15th week after planting (1, in the Malcomson 1−9 scale; data not shown). As reported in a review by Brandt et al. [29], the plants managed by organic practices have necessarily to cope more frequently with pathogens, and accordingly accumulate more defence-related compounds than conventionally produced tubers. Among these defence compounds, phenylpropanoids are extensively studied because of their association with health-promoting effects, mainly related to their antioxidant activity [30]. Accordingly, in 2008, when pathogen attacks occurred with a low severity, phenylpropanoid metabolism was scarcely modulated (Figure 2). By contrast, flavonoid metabolism was repressed in organic tubers in both years: four corresponding to naringerin-chalcone synthetic genes were down regulated in organic tubers (p < 0.01); two of them showed high homology with potato chalcone synthase 1 (CHS1; GenBank accession number CAA63092) and two with chalcone synthase 2 (CHS2; GenBank accession number U47738). Interestingly, the comparison of tubers grown under the same farming practice but in different year, resulted in no significant differences in gene expression between the two years under conventional farming, but in strong gene expression induction in 2007 under organic farming, in accordance with a previous study [25].
An influence of the farming system on genes involved in glycoalkaloid (GA) metabolism was observed. These compounds are known to participate in defence mechanisms, to be induced upon biotic and abiotic stresses in plants, and are known to be antinutritional compounds, especially concentrated in the tuber skin. Stg3 plays a key role in the conversion of beta-GA to alpha-GA (95% of the total GA content). Irrespective of the farming system, stg3 expression was strongly higher during 2007 than in 2008, indicating a strong influence of the year and possibly explaining why the literature regarding the incidence of organic farming on glycoalkaloid metabolism is often contradictory [7,31]. However, during season 2007, stg3 expression remained unchanged between organic and conventional tuber, in accordance with the GA content evaluated in the same tubers [10], while during 2008, its expression was lower in organic than in conventional tubers, as previously observed [11]. Among the anti-nutritional compounds assumed to have a possible relevance in tubers, the asparagine content was shown to decrease in organic tubers in a previous study involving the same materials and conditions used here [10]. Microarray data revealed that organic tubers exhibited a log2FC expression two times higher for l-asparaginase, in accordance with the metabolome data. This enzyme contributes to the reduction of acrylamide synthesis [32] because it catalyzes the conversion of asparagine to aspartic acid and ammonium, decreasing the tuber content of asparagine, the presence of which is strictly correlated with acrylamide synthesis through the Maillard reaction [33].
The ascorbic acid (ASA) content of organically-grown tubers remains object of debate [7,8]. ASA is a key component of the plant antioxidant system and is often associated with the stress response. Three pathways have been suggested to generate ASA in plants: the Wheeler-Smirnoff pathway as the primary route [33], the myo-inositol pathway [34] and cell wall degradation [35]. Our microarray data suggested an involvement of ASA pathways in response to the farming system, in both 2007 and 2008 (Figure 4). The expression profile of 4 pectinesterase, ascorbate oxidase (AO), 1-mioinositol phosphatase, and glutathione S-transferase (GST) suggested a decay of ASA levels, rather than an accumulation, driven by an inhibition of cell wall pectin degradation, due to down-regulation in organic tubers of the 4 pectinesterase transcription, and repression of the myo-inositol pathway. AO activation and GST inhibition confirmed this hypothesis. The process known as the ascorbate–glutathione cycle plays a crucial role in protecting plants against oxidative stress, and the conversion of ASA to monodehydroascorbate is the first step mediated by AO. This enzyme is primarily responsible for the apoplastic signalling to response to biotic and abiotic stimuli since it controls the ASA redox state but needs to be accompanied to ASA regeneration deriving from GST activity. However, these differences in the transcript levels of the enzymes involved did not translate into differences of ascorbic acid content in organically grown tubers [10].
The conjunction of microarray with unsupervised analysis laid the groundwork to achieving some considerations. Comparing this data with other similar studies, the total number of differentially expressed features was similar to what previously reported [11]. The results obtained in different years showed that in 2007, the differentially expressed features (1996) were more consistently higher than those in 2008 (697 for the cultivar Ditta and 897 for the breeding clone). This distance was a probable consequence of the high disease pressure, as confirmed by the functional analysis that identified many probes to be stress related when comparing the 2007 conventional and organic crop farming (Figure 2). Transcription-related genes (WRKY DNA-binding protein, HSP factor, bHLH, bZIP, zinc finger ring family protein) and binding proteins (proline-rich protein) were also found to be modulated, in response to Phytophthora infestans, according to a microarray study [12]. Under organic regime, the only fungicide allowed from EU law is the copper (Cu), but in a rainy year as 2007, when potatoes were very exposed to this kind of attack, copper was not highly effective as synthetic chemicals admitted in conventional farming.
Hierarchical clustering performed on the entire data set without applying any type of filtering to normalized data revealed considerable representative data clustering, despite the huge variability of the individual data discriminating crop management strategies, and confirmed the similarity of samples from the same genotypes irrespective of the year and farming system (Figure 1). The consequence is that the choice of genotypes to use in organic production should be considered the main frontier to pursue; many papers have described the influence of the farming system on the chemical profile of the tubers, but attention should be paid to always estimate how the cultivar-specific genetic differences and the cultivation system can interact to influence the chemical composition of potato tubers. Even though genotype and season explain more of the gene expression than the farming system, the heatmap carried on the years overlapping 144 DEG had highlighted the differences due only to farming system. This reduction of the putative significant trancriptomic differences to only few genes showed also the importance to perform genetic expression analysis in more than one year. This number is also fully comparable to the 113 genes showing a similar pattern of expression in both genotypes during the same year.
Among the 144 DEG, only eight were differentially regulated in both the genotype and year comparisons. The GABA transaminase gene was one of the most up-regulated in conventional tubers in both growing seasons, exhibiting nearly 60-fold higher gene expression, according to both hybridization signals and real-time PCR analysis (Figure A2 and Figure 5). The expression data presented here are in good agreement with the NMR-based analysis of the same material [10], showing strong accumulation of GABA in the organic tubers of Ditta, and confirming a putative key role of GABA shunting as the primary response to changing environmental conditions. The most evident variation in response to the cultivation regimen, consisting of GABA accumulation in organic tubers, is probably correlated with the decreased expression of the GABA transaminase gene in this crop management system. Therefore, this study proposes GABA transaminase as a putative marker for farming systems, even though this raises the issue regarding the necessity of wider investigation on this candidate marker.
It is difficult to draw meaningful conclusions concerning the supposed superiority of organic foods. Often the reason is the lack of repeated studies by season and genotype as well as the difference in investigation methodologies. For these reasons, herein, this study offered a new perspective on previous metabolomics analysis characterizing the same experimental model. Nevertheless, when comparing the gene expression data presented here to previously reported NMR data, it appears that the tuber system is partially “buffered”, even though, in most cases, the transcription levels translate into quality variation of the tubers. It is clear that genotype and season should always to be carefully considered in any comparative study, and their effects always estimated. In this paper, we showed specific differences in the gene expression levels between organic and conventional tubers dependent on the occurrence of a phytopathogen attack. Therefore, biotic stresses can contribute to the consistent differences in the results [36]. However, our results also confirm the strong influence of crop management on potato tubers irrespective of the year and genotype. This study provides a number of candidate gene, the expression of which appears to be in these conditions indicative of the “organic status” of potato tubers; among these genes, the transcription of the GABA transaminase gene seems to be particularly relevant, as it shows good correlation with the cultivation system and NMR data [11] and could serve as a possible new gene marker in farming systems.

Supplementary Materials

The following are available online at www.mdpi.com/2071-1050/9/5/779/s1, Table S1: Lists of up regulated genes according to LogFC > 1 and adj.P.Val < 0.01 in 2007 (data sheet 1) and 2008 (data sheet 3). Lists of down regulated genes according to LogFC < −1 and adj.P.Val < 0.01 in 2007 (data sheet 2) and 2008 (data sheet 4). The first column contains identifier information (probe/gene name) and the subsequent column contain the log fold change. The other column contain values of differential expression statistics related to corresponding identifier (AveExpr, t, P Value, adjP Value, B), Table S2: List of common genes that are differentially expressed both in 2007 and in 2008 experiments, Table S3: Lists of up regulated genes according to LogFC > 1 and adj.P.Val < 0.01. Lists of down regulated genes according to LogFC < −1 and adj.P.Val < 0.01. The first columns contain identifier information (probe/gene name) and the subsequent column contain the log fold change. The other column contain values of differential expression statistics related to corresponding identifier (AveExpr, t, P Value, adjP Value, B).

Acknowledgments

The research described in this paper was supported by Ministry of Agricultural, Food and Forestry Policies through the PABIOVAT II Project.

Author Contributions

Daniela Pacifico conceived, designed the experiments and wrote the paper; Chiara Onofri performed the experiments; Bruno Parisi carried on the agronomy trials; Paola Ostano performed all the statistical and bioinformatics analysis; and Giuseppe Mandolino is Project Responsible.

Conflicts of Interest

The authors declare no conflict of interest.

Appendix A

Figure A1. Spectrum and bands pattern of total RNA analyzed by 2100 Bionalyzer (Agilent) of organic tubers grown in 2008.
Sustainability 09 00779 g007
Figure A2. Expression profiling of the DEG commonly modulated in the conventional- vs. organic- grown tubers comparison in 2007 and 2008. On the x axis the Log (FC) of the probes in 2007 and 2008 and on y axis the probes resulted modulated in both years, including the 99-up regulated probes (a) and the 45 down-regulated probes (b). In the box, MICRO.100.C1 corresponding to GABA transaminase is highlighted.
Sustainability 09 00779 g008aSustainability 09 00779 g008b
Figure A3. GO functional classification of the 144 DEG modulated in both 2007 and 2008, based on Biological Process (a), Cellular Component (b) and Molecular Functions (c), as annotated by Blast2go in relation to GO categories of class 3. On y-axis the chart categories and on x-axis the percentage of genes belonging to each of them are shown.
Sustainability 09 00779 g009aSustainability 09 00779 g009b
Table A4. Milk buffer preparation.
CTABPVP40EDTATrisHCLNaCl
20 g L−120 g L−10.025 mol L−10.1 mol L−12 mol L−1
Put the solution in the water bath for 20 min at 65 °C to dissolve the PVP. Shake the solution and make sure it is at room temperature before use.
Table A5. Primers used for quantitative real-time PCR.
ProbesGenBankPGSC IDSequenze Primer (5′–3′)Size (pb)Cluster
FWREVExpected AmpiconTanscript
bf_mxlfxxxx_0036d08.t3mgb|CAA63092>PGSC0003DMT400036565TCCACATTGGTGACCAAGTTATGAGGGCTCCAAGAAAACA1201460E
MICRO.6055.C2gb|U47738.1>PGSC0003DMT400049165GTTTGCTCAGAGATCACTGCAATCACCAAAAAGGGCTTGTC871442D
MICRO 5707.C1gb|AAM23265>PGSC0003DMT400020647CACCGTGAAAAACCCAATCTGCCTCTTTGGCTAGTTTCAGC1741214F
MICRO.100.C1XM_006351918>PGSC0003DMT400062385CCACTAGAATGGGGTGTTGGTGAGACTTGAGTTCTTCCACTCT1941234F
MICRO .6017.C3gb|AAY47050>PGSC0003DMT400071763GGCAGCTTGACTGCTCTTTCTTACCACAAATGGCTCCACA1001118C
MICRO.17316.C1XM_006343852>PGSC0003DMT400031731CGATTCAGGGATGAACAGGAGAAAACAAAACGCGTCACAA1383572C
MICRO.17938.C1XM_006343852>PGSC0003DMT400031731ACCGAGTCTTGCTGACCTGTAAGAAGTACAAGCGGTTGGC2373572C
MICRO.17938.C2XM_006343852>PGSC0003DMT400031731TTCATGACTCATTGGGATGGCCGTCATCAACTCTCTCCTTG1973572C
MICRO.13064.C2XR368500>PGSC0003DMT400039114CGATCAACTCAACCCCAAGGTCCCGGGAACATCAACTC150487C
Elongation factor alpha 1AJ536671.1-------ATTGGAAATGGATATGCTCCTCCTTACCTGAACGCCTGTCA1021753-

References

  1. FAO Statistical Pocketbook 2015. Available online: http://www.fao.org/3/a-i4691e.pdf (accessed on 4 April 2017).
  2. Organic Food Sales Growth in the United States from 2000 to 2015. Available online: https://www.statista.com/statistics/196962/organic-food-sales-growth-in-the-us-since-2000/ (accessed on 4 April 2017).
  3. Organic in Europe. Prospects and Developments 2016. IFOAM EU Group. Available online: https://shop.fibl.org/fileadmin/documents/shop/1708-organic-europe-2016.pdf (accessed on 8 May 2017).
  4. Pacifico, D.; Paris, R. Effect of Organic Potato Farming on Human and Environmental Health and Benefits from New Plant Breeding Techniques. Is It Only a Matter of Public Acceptance? Sustainability 2016, 8, 1054. [Google Scholar] [CrossRef]
  5. Lu, C.; Hawkesford, M.J.; Barraclough, P.B.; Poulton, P.R.; Wilson, I.D.; Barker, G.L.; Edwards, K.J. Markedly different gene expression in wheat grown with organic or inorganic fertilizer. Proc. Biol. Sci. 2005, 272, 1901–1908. [Google Scholar] [CrossRef] [PubMed]
  6. Maggio, A.; Carillo, P.; Bulmetti, G.S.; Fuggi, A.; Barbieri, G.; De Pascale, S. Potato yield and metabolic profiling under conventional and organic farming. Eur. J. Agron. 2008, 28, 343–350. [Google Scholar] [CrossRef]
  7. Hoefkens, C.; Verbeke, W.; Aertsens, J.; Mondelaers, K.; Camp, J.V. The nutritional and toxicological value of organic vegetables. Br. Food J. 2009, 111, 1062–1077. [Google Scholar] [CrossRef]
  8. Lombardo, S.; Lo Monaco, A.; Pandino, G.; Parisi, B.; Mauromicale, G. The phenology, yield and tuber composition of ‘early’ crop potatoes: A comparison between organic and conventional cultivation systems. Renew. Agric. Food Syst. 2013, 28, 50–58. [Google Scholar] [CrossRef]
  9. Lehesranta, S.J.; Koistinen, K.M.; Massat, N.; Davies, H.V.; Shepherd, L.V.T.; McNicol, J.W.; Cakmak, I.; Cooper, J.; Lück, L.; Kärenlampi, S.O. Effects of agricultural production systems and their components on protein profiles of potato tubers. Proteomics 2007, 7, 597–604. [Google Scholar] [CrossRef] [PubMed]
  10. Pacifico, D.; Casciani, L.; Ritota, M.; Mandolino, G.; Onofri, C.; Moschella, A.; Parisi, B.; Cafiero, C.; Valentini, M. NMR-based metabolomics for organic farming traceability of early potatoes. J. Agric. Food Chem. 2013, 61, 11201–11211. [Google Scholar] [CrossRef] [PubMed]
  11. Van Dijk, J.P.; Cankar, K.; Hendriksen, P.J.; Beenen, H.G.; Zhu, M.; Scheffer, S.; Shepherd, L.V.; Stewart, D.; Davies, H.V.; Leifert, C. The identification and interpretation of differences in the transcriptomes of organically and conventionally grown potato tubers. J. Agric. Food Chem. 2012, 60, 2090–2101. [Google Scholar] [CrossRef] [PubMed]
  12. Siddappa, S.; Tiwari, J.K.; Sindhu, R.; Sharma, S.; Bhardwaj, V.; Chakrabarti, S.K.; Singh, B.P. Phytophthora infestans associated global gene expression profile in a late blight resistant Indian potato cv. Aust. J. Crop Sci. 2014, 8, 215–222. [Google Scholar]
  13. Kaminski, K.P.; Petersen, A.H.; Sønderkær, M.; Pedersen, L.H.; Pedersen, H.; Feder, C.; Nielsen, K.L. Transcriptome Analysis Suggests That Starch Synthesis May Proceed via Multiple Metabolic Routes in High Yielding Potato Cultivars. PLoS ONE 2012, 7, 1–8. [Google Scholar] [CrossRef] [PubMed]
  14. Kloosterman, B.; De Koeyer, D.; Griffiths, R.; Flinn, B.; Steuernagel, B.; Scholz, U.; Sonnewald, S.; Sonnewald, U.; Bryan, G.J.; Prat, S. Genes driving potato tuber initiation and growth: Identification based on transcriptional changes using the POCI array. Funct. Integr. Genom. 2008, 8, 329–340. [Google Scholar] [CrossRef] [PubMed]
  15. Stushnoff, C.; Ducreux, L.J.; Hancock, R.D.; Hedley, P.E.; Holm, D.G.; McDougall, G.J.; McNicol, J.W.; Morris, J.; Morris, W.L.; Sungurtas, J.A. Flavonoid profiling and transcriptome analysis reveals new gene-metabolite correlations in tubers of Solanum tuberosum L. J. Exp. Bot. 2010, 61, 1225–1238. [Google Scholar] [CrossRef] [PubMed]
  16. Onofri, C.; Pacifico, D.; Ostano, P.; Mello-Grand, M.; Ghimenti, C.; Parisi, B.; Mandolino, G. Strumenti di genomica funzionale per la tipizzazione dell’origine di coltivazione della patata. Minerva Biotecnol. 2012, 24, 11–23. [Google Scholar]
  17. Ducreux, J.M.L.; Morris, W.L.; Prosser, I.M.; Morris, J.A.; Beale, M.H.; Wright, F.; Shepherd, T.; Bryan, G.J.; Hedley, P.E.; Taylor, M.A. Expression profiling of potato germplasm differentiated in quality traits leads to the identification of candidate flavour and texture genes. J. Exp. Bot. 2008, 59, 4219–4231. [Google Scholar] [CrossRef] [PubMed]
  18. Perkins, J.R.; Martins, A.A.; Calvo, M.; Grist, J.; Rust, W.; Schmid, R.; Hildebrandt, T.; Kohl, M.; Orengo, C.; McMahon, S.B.; et al. A comparison of RNA-seq and exon arrays for whole genome transcription profiling of the L5 spinal nerve transection model of neuropathic pain in the rat. Mol. Pain 2014, 10, 2–26. [Google Scholar] [CrossRef] [PubMed]
  19. Bioconductor. Available online: http://www.bioconductor.org (accessed on 4 April 2017).
  20. Gentleman, R.C.; Carey, V.J.; Bates, D.M.; Bolstad, B.; Dettling, M.; Dudoit, S. Bioconductor: Open software development for computational biology and bioinformatics. Genome Biol. 2004, 5, 80. [Google Scholar] [CrossRef] [PubMed]
  21. Saeed, A.I.; Bhagabati, N.K.; Braisted, J.C.; Liang, W.; Sharov, V.; Howe, E.A.; Li, J.; Thiagarajan, M.; White, J.A.; Quackenbush, J. TM4 microarray software suite. Methods Enzymol. 2006, 411, 134–139. [Google Scholar] [PubMed]
  22. Benjamini, Y.; Hochberg, Y. Controlling the False Discovery Rate: A Practical and Powerful Approach to Multiple Testing. J. R. Stat. Soc. Ser. B (Methodol.) 1995, 57, 289–300. [Google Scholar]
  23. POCI 015425 Annotation v1. Available online: http://pgrc-35.ipk-gatersleben.de (accessed on 8 May 2017).
  24. Spud DB. Potato Genomics Resources. Available online: http://solanaceae.plantbiology.msu.edu/integrated_searches.shtml (accessed on 8 May 2017).
  25. Radonic, A.; Thulke, S.; Nackay, I.M.; Landt, O.; Siegert, W.; Nitsche, A. Guideline to reference gene selection for quantitative real-time PCR. Biochem. Biophys. Res. Commun. 2004, 313, 856–862. [Google Scholar] [CrossRef] [PubMed]
  26. Livak, K.J.; Schmittgen, T.D. Analysis of relative gene expression data using real-time quantitative PCR and the 2−ΔΔCt method. Methods 2001, 25, 402–408. [Google Scholar] [CrossRef] [PubMed]
  27. Cui, Y.; Magill, R.; Frederiksen, R.; Magill, C. Chalcone synthase and phenylalanine ammonia-lyase mRNA levels following exposure of sorghum seedlings to three fungal pathogens. Phys. Mol. Plant Pathol. 1996, 49, 187–199. [Google Scholar] [CrossRef]
  28. Helliwell, C.A.; Poole, A.; Peacock, W.J.; Dennis, E.S. Arabidopsis ent-Kaurene Oxidase Catalyzes Three Steps of Gibberellin Biosynthesis. Plant Physiol. 1999, 119, 507–510. [Google Scholar] [CrossRef] [PubMed]
  29. Brandt, K.; Leifert, C.; Sanderson, R.; Seal, C.J. Agroecosystem management and nutritional quality of plant food: The case of organic fruits and vegetables. Crit. Rev. Plant Sci. 2011, 30, 177–197. [Google Scholar] [CrossRef]
  30. Merkl, R.; Hrádková, I.; Filip, V.; Šmidrkal, J. Antimicrobial and antioxidant properties of phenolic acids alkyl esters. Czech J. Food Sci. 2010, 28, 275–279. [Google Scholar]
  31. Skrabule, I.; Muceniece, R.; Kirhnere, I. Evaluation of Vitamins and Glycoalkaloids in Potato Genotypes Grown Under Organic and Conventional Farming Systems. Potato Res. 2013, 56, 259–276. [Google Scholar] [CrossRef]
  32. Hendriksen, H.V.; Kornbrust, B.A.; Oestergaard, P.R.; Stringer, M.A. Evaluating the Potential for Enzymatic Acrylamide Mitigation in a Range of Food Products Using an Asparaginase from Aspergillus oryzae. J. Agric. Food Chem. 2009, 57, 4168–4176. [Google Scholar] [CrossRef] [PubMed]
  33. Weisshaar, R.; Gutsche, B. Formation of acrylamide in heated potato products—Model experiments pointing to asparagine as precursor. Deutsch. Lebensm. Rundsch. 2002, 98, 397–400. [Google Scholar]
  34. Laing, W.A.; Wright, M.A.; Cooney, J.; Bulley, S.M. From the cover: The missing step of the l-galactose pathway of ascorbate biosynthesis in plants, an l-galactose guanyltransferase, increases leaf ascorbate content. Proc. Natl. Acad. Sci. USA 2007, 104, 9534–9539. [Google Scholar] [CrossRef] [PubMed]
  35. Lorence, A.; Chevone, B.I.; Mendes, P.; Nessler, C.L. Myo-inositol oxygenase offers a possible entry point into plant ascorbate biosynthesis. Plant Physiol. 2004, 134, 1200–1205. [Google Scholar] [CrossRef] [PubMed]
  36. Lester, E.; Saftner, R.A. Organically versus Conventionally Grown Produce: Common Production Inputs, Nutritional Quality, and Nitrogen Delivery between the Two Systems. J. Agric. Food Chem. 2011, 59, 10401–10406. [Google Scholar] [CrossRef] [PubMed]
Figure 1. Cluster dendrogram obtained from unsupervised hierarchical clustering using Pearson’s correlation as similarity metrics (vertical axis). Each branch of the dendrogram is represented by the global gene expression profile of tubers according to genotype, year and farming system.
Sustainability 09 00779 g001
Figure 2. The metabolic pathways map showing up-regulated differentially expressed genes (blue box) and down-regulated differentially expressed genes (red box) in the comparison of conventional vs organic tubers in 2007 (left part of the panel) and 2008 (right part of the panel). The list of pathways ordered by their statistical significance (p-value) is also shown.
Sustainability 09 00779 g002
Figure 3. Biological categories showing over- or under-representation according to the differentially expressed genes in the comparison between potato tubers grown under conventional and organic systems obtained by Over-Representation Analysis (ORA) analysis. On the left side, blue boxes represent over representation, while red boxes represent under representation, of MapMan ontology after comparing the list of DEG to the complete gene list of the Potato Oligo Chip Initiative (POCI) microarray, according to the colour scale represented. Genes differentially expressed in each comparison (columns 1 and 4 for Ditta grown in 2008; 2 and 5, for Ditta grown in 2007; 3 and 6 for MN grown in 2008) were grouped into up-regulated (columns 1, 2, 3) and down-regulated (columns 4, 5, 6) categories based on the fold-change value.
Sustainability 09 00779 g003
Figure 4. Heat map profile of the 144 differentially expressed probes modulated in both 2007 and 2008 in cv. Ditta as shown in clustering analysis using MapMan software. The colour scale indicates the intensity of gene expression: higher than the median in red, lower than the median in green. GO assignments of the probes are reported on the right and coloured bars on the left identify major branches in the clustering tree, grouping genes with a similar expression pattern (from top to bottom: cluster from A to E).
Sustainability 09 00779 g004
Figure 5. Concordance between the microarray and RT-qPCR results. Nine probes showed significant differences in expression levels in the comparison between conventional and organic tubers in 2007 and in 2008 as determined by microarray and RT-qPCR analysis. For RT-qPCR results, the values were normalized to elongation factor 1 alpha.
Sustainability 09 00779 g005
Figure 6. Venn diagrams of transcripts of MN 1404 O5 (blue circle) and Ditta in 2008 (red circle) and 2007 (green circle). The eight features with the same trend in expression profiling are reported in the table with the annotation and log2FC.
Sustainability 09 00779 g006

