
Effects of Waste-to-Energy Plants on China’s Urbanization: Evidence from a Hedonic Price Analysis in Shenzhen

Abstract
:1. Introduction
1.1. Background
1.2. Contributions
2. Model
3. Data Description
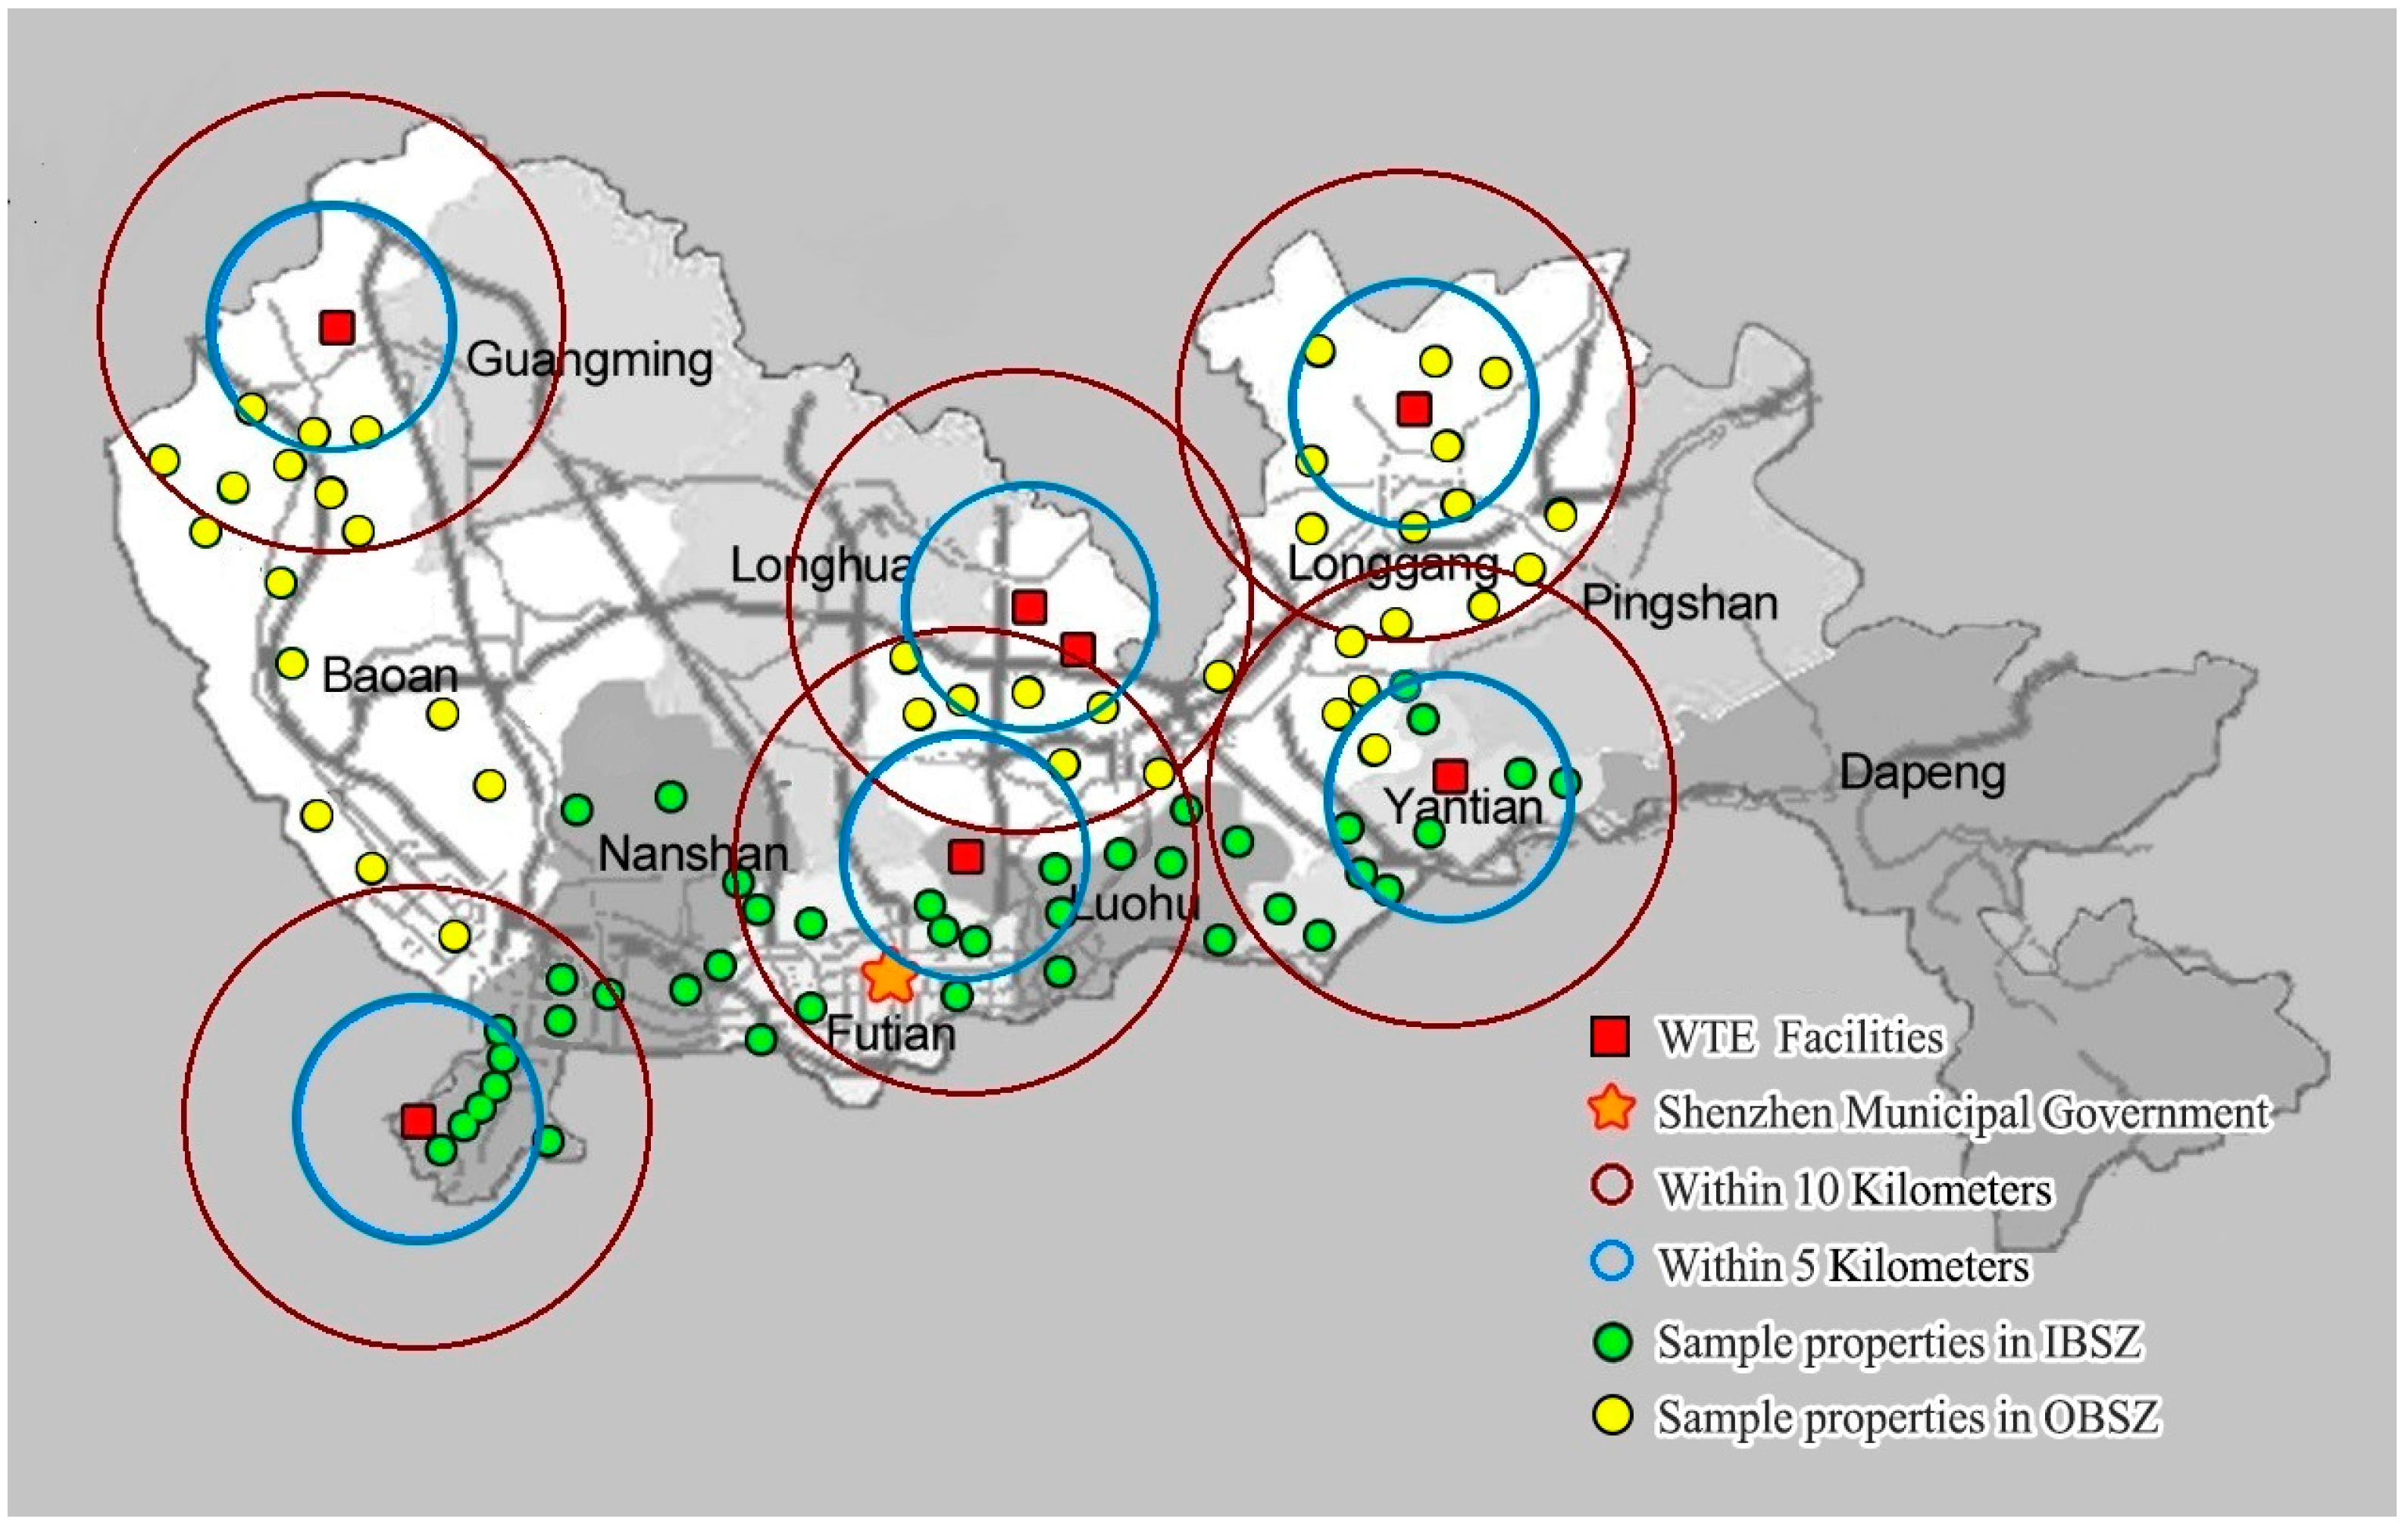
3.1. Study Area
3.2. Sales Data
4. Regression Results
5. Robust Test, Error Analysis and Cross Terms Regressions
5.1. Robust Test
5.1.1. Depreciation Effects in Different Regions
5.1.2. Robust Test of Different Trading Years
5.1.3. Robust Test of Different Distance Intervals
5.2 Analysis of Regression Error
5.3. Cross-Term Regressions
6. Conclusions and Policy Recommendations
Acknowledgments
Author Contributions
Conflicts of Interest
Appendix A
Appendix A.1. Process of Acquiring Data
Appendix A.2. Reasons for Choosing Shenzhen as the Sample City
Appendix A.3. Emission Limits in China

| GB 2001 | Shanghai 2013 | GB 2014 | |
|---|---|---|---|
| Dust (mg/m3) | 80 | 30 | 20 |
| CO (mg/m3) | 150 a | 60 | 80 |
| NOx (mg/m3) | 400 a | 300 | 200 |
| SO2 (mg/m3) | 260 a | 150 | 80 |
| HCL (mg/m3) | 75 a | 60 | 50 |
| Hg (mg/m3) | 0.2 | 0.05 | 0.05 |
| Cd+Ti (mg/m3) | 0.1 | 0.05 | 0.05 |
| Sb + As + Pb + Cr + Co + Cu + Mn + Ni (mg/m3) | 1.6 | 0.5 | 1 |
| Dioxins + furans (mg/m3) | 1 | 0.1 | 0.1 |
References
- Song, H.; Thisse, J.F.; Zhu, X. Urbanization and/or rural industrialization in China. Reg. Sci. Urban Econ. 2012, 42, 126–134. [Google Scholar] [CrossRef]
- Chen, J.; Guo, F.; Wu, Y. One decade of urban housing reform in China: Urban housing price dynamics and the role of migration and urbanization, 1995–2005. Habitat Int. 2011, 35, 1–8. [Google Scholar] [CrossRef]
- Zheng, L.; Song, J.; Li, C.; Gao, Y.; Geng, P.; Qu, B.; Lin, L. Preferential policies promote municipal solid waste (MSW) to energy in China: Current status and prospects. Renew. Sustain. Energy Rev. 2014, 36, 135–148. [Google Scholar] [CrossRef]
- China Construction News. Waste Incineration: 12th Five-Year Plan’s Pillar. 2015. Available online: http://www.chinajsb.cn/bz/content/2015-05/29/content_159696.htm (accessed on 9 July 2015).
- Wu, W.; Lux, K.H.; Hou, Z.; Feng, Q. Feasibility studies of utilizing domestic waste to refill a discarded open iron mine. Trans. Ecol. Environ. 2005, 81, 519–530. [Google Scholar]
- Yang, N.; Zhang, H.; Chen, M.; Shao, L.M.; He, P.J. Greenhouse gas emissions from MSW incineration in China: Impacts of waste characteristics and energy recovery. Waste Manag. 2012, 32, 2552–2560. [Google Scholar] [CrossRef] [PubMed]
- Cheng, H.; Hu, Y. Municipal solid waste (MSW) as a renewable source of energy: Current and future practices in China. Bioresour. Technol. 2010, 101, 3816–3824. [Google Scholar] [CrossRef] [PubMed]
- Ng, W.P.Q.; Lam, H.L.; Varbanov, P.S.; Klemeš, J.J. Waste-to-energy (WTE) network synthesis for municipal solid waste (MSW). Energy Convers. Manag. 2014, 85, 866–874. [Google Scholar] [CrossRef]
- Singh, R.P.; Tyagi, V.V.; Allen, T.; Ibrahim, M.H.; Kothari, R. An overview for exploring the possibilities of energy generation from municipal solid waste (MSW) in Indian scenario. Renew. Sustain. Energy Rev. 2011, 15, 4797–4808. [Google Scholar] [CrossRef]
- Chen, X.; Geng, Y.; Fujita, T. An overview of municipal solid waste management in China. Waste Manag. 2010, 30, 716–724. [Google Scholar] [CrossRef] [PubMed]
- Dear, M. Understanding and overcoming the NIMBY syndrome. J. Am. Plan. Assoc. 1992, 58, 288–300. [Google Scholar] [CrossRef]
- Sun, C.; Lyu, N.; Ouyang, X. Chinese Public Willingness to Pay to Avoid Having Nuclear Power Plants in the Neighborhood. Sustainability 2014, 6, 7197–7223. [Google Scholar] [CrossRef]
- Pelekasi, T.; Menegaki, M.; Damigos, D. Externalities, NIMBY syndrome and marble quarrying activity. J. Environ. Plan. Manag. 2012, 55, 1192–1205. [Google Scholar] [CrossRef]
- Gamble, H.B. Effects of Solid Waste Disposal Sites on Community Development and Residential Property Values; Final Report for the Pennsylvania Bureau of Solid Waste Management, Department of Environmental Resources; Institute for Research on Land & Water Resources: State College, PA, USA, 1982. [Google Scholar]
- Kiel, K.A.; McClain, K.T. House prices during siting decision stages: The case of an incinerator from rumor through operation. J. Environ. Econ. Manag. 1995, 28, 241–255. [Google Scholar] [CrossRef]
- Kiel, K.A.; McClain, K.T. The effect of an incinerator siting on housing appreciation rates. J. Urban Econ. 1995, 37, 311–323. [Google Scholar] [CrossRef]
- Farber, S. Undesirable facilities and property values: A summary of empirical studies. Ecol. Econ. 1998, 24, 1–14. [Google Scholar] [CrossRef]
- Sun, C.; Ouyang, X.; Cai, H.; Luo, Z.; Li, A. Household pathway selection of energy consumption during urbanization process in China. Energy Convers. Manag. 2014, 84, 295–304. [Google Scholar] [CrossRef]
- Chaliki, P.; Psomopoulos, C.S.; Themelis, N.J. WTE plants installed in European cities: A review of success stories. Manag. Environ. Qual. 2016, 27, 606–620. [Google Scholar] [CrossRef]
- Lancaster, K.J. A new approach to consumer theory. J. Political Econ. 1966, 40, 2207–2221. [Google Scholar] [CrossRef]
- Rosen, S. Hedonic prices and implicit markets: Product differentiation in pure competition. J. Political Econ. 1974, 82, 34–55. [Google Scholar] [CrossRef]
- Reichert, A.; Small, M.; Mohanty, S. The impact of landfills on residential property values. J. Real Estate Res. 1992, 7, 297–314. [Google Scholar]
- Smith, V.K.; Desvousges, W.H. The value of avoiding a LULU: Hazardous waste disposal sites. Rev. Econ. Stat. 1986, 68, 293–299. [Google Scholar] [CrossRef]
- Deaton, B.J.; Hoehn, J.P. Hedonic analysis of hazardous waste sites in the presence of other urban disamenities. Environ. Sci. Policy 2004, 7, 499–508. [Google Scholar] [CrossRef]
- Clark, D.E.; Michelbrink, L.; Allison, T.; Metz, W.C. Nuclear power plants and residential housing prices. Growth Chang. 1997, 28, 496–519. [Google Scholar] [CrossRef]
- Gawande, K.; Jenkins-Smith, H. Nuclear waste transport and residential property values: Estimating the effects of perceived risks. J. Environ. Econ. Manag. 2001, 42, 207–233. [Google Scholar] [CrossRef]
- Boxall, P.C.; Chan, W.H.; McMillan, M.L. The impact of oil and natural gas facilities on rural residential property values: A spatial hedonic analysis. Resour. Energy Econ. 2005, 27, 248–269. [Google Scholar] [CrossRef]
- Gamper-Rabindran, S.; Timmins, C. Does cleanup of hazardous waste sites raise housing values? Evidence of spatially localized benefits. J. Environ. Econ. Manag. 2013, 65, 345–360. [Google Scholar] [CrossRef]
- Grislain-Letrémy, C.; Katossky, A. The impact of hazardous industrial facilities on housing prices: A comparison of parametric and semi-parametric hedonic price models. Reg. Sci. Urban Econ. 2014, 49, 93–107. [Google Scholar] [CrossRef]
- Ihlanfeldt, K.R.; Taylor, L.O. Externality effects of small-scale hazardous waste sites: Evidence from urban commercial property markets. J. Environ. Econ. Manag. 2004, 47, 117–139. [Google Scholar] [CrossRef]
- Boes, S.; Nüesch, S.; Wüthrich, K. Hedonic Valuation of the Perceived Risks of Nuclear Power Plants. Soc. Sci. Electron. Publ. 2015, 133, 109–111. [Google Scholar] [CrossRef]
- Zabel, J.E.; Guignet, D. A hedonic analysis of the impact of LUST sites on house prices. Resour. Energy Econ. 2012, 34, 549–564. [Google Scholar] [CrossRef]
- Li, Q.; Chand, S. House prices and market fundamentals in urban China. Habitat Int. 2013, 40, 148–153. [Google Scholar] [CrossRef]
- Chen, Z.; Haynes, K.E. Impact of high speed rail on housing values: An observation from the Beijing–Shanghai line. J. Transp. Geogr. 2015, 43, 91–100. [Google Scholar] [CrossRef]
- Wang, J.; Ma, Y.J.; hen, S.J.; Tian, M.; Luo, X.J.; Mai, B.X. Brominated flame retardants in house dust from e-waste recycling and urban areas in South China: Implications on human exposure. Environ. Int. 2010, 36, 535–541. [Google Scholar] [CrossRef] [PubMed]
- Lee, J.S.; Li, M.H. The impact of detention basin design on residential property value: Case studies using GIS in the hedonic price modeling. Landsc. Urban Plan. 2009, 89, 7–16. [Google Scholar] [CrossRef]
- Liao, W.C.; Wang, X. Hedonic house prices and spatial quantile regression. J. Hous. Econ. 2012, 21, 16–27. [Google Scholar] [CrossRef]
- Song, Y.; Zenou, Y. Urban villages and housing values in China. Reg. Sci. Urban Econ. 2012, 42, 495–505. [Google Scholar] [CrossRef]
- Wen, H.; Tao, Y. Polycentric urban structure and housing price in the transitional China: Evidence from Hangzhou. Habitat Int. 2015, 46, 138–146. [Google Scholar] [CrossRef]
- Jim, C.Y.; Chen, W.Y. Consumption preferences and environmental externalities: A hedonic analysis of the housing market in Guangzhou. Geoforum 2007, 38, 414–431. [Google Scholar] [CrossRef]
- Sander, H.A.; Polasky, S. The value of views and open space: Estimates from a hedonic pricing model for Ramsey County, Minnesota, USA. Land Use Policy 2009, 26, 837–845. [Google Scholar] [CrossRef]
- Muth, R.F. Household Production and Consumer Demand Functions. Econometrica 1966, 34, 699–708. [Google Scholar] [CrossRef]
- Sirmans, S.; Macpherson, D.; Zietz, E. The composition of hedonic pricing models. J. Real Estate Lit. 2005, 13, 1–44. [Google Scholar]
- Cropper, M.L.; Deck, L.B.; McConnell, K.E. On the choice of functional form for hedonic price functions. Rev. Econ. Stat. 1988, 70, 668–675. [Google Scholar] [CrossRef]
- Goodman, A.C.; Thibodeau, T.G. Housing market segmentation. J. Hous. Econ. 1998, 7, 121–143. [Google Scholar] [CrossRef]
- Davidson, R.; MacKinnon, J.G. Estimation and Inference in Econometrics; Oxford University Press: New York, NY, USA, 1993; 874p. [Google Scholar]
- Kuminoff, N.V.; Parmeter, C.F.; Pope, J.C. Which hedonic models can we trust to recover the marginal willingness to pay for environmental amenities? J. Environ. Econ. Manag. 2010, 60, 145–160. [Google Scholar] [CrossRef]
- Malpezzi, S. Hedonic pricing models: A selective and applied review. Essays in Honor of Duncan Maclennan. Hous. Econ. Public Policy 2003. [Google Scholar] [CrossRef]
- China Statistics Press. Shenzhen Statistical Yearbook 2014; China Statistics Press: Beijing, China, 2014; (In Chinese). [Google Scholar] [CrossRef]
- Zheng, S.; Kahn, M.E. Land and residential property markets in a booming economy: New evidence from Beijing. J.Urban Econ. 2008, 2, 743–757. [Google Scholar] [CrossRef]
- Wan, Z.; Chen, J.; Craig, B. Lessons learned from Huizhou, China’s unsuccessful waste-to-energy incinerator project: Assessment and policy recommendations. Util. Policy 2015, 33, 63–68. [Google Scholar] [CrossRef]
- Schively, C. Understanding the NIMBY and LULU phenomena: Reassessing our knowledge base and informing future research. J. Plan. Lit. 2007, 21, 255–266. [Google Scholar] [CrossRef]
- García-Pérez, J.; Fernández-Navarro, P.; Castelló, A.; López-Cima, M.F.; Ramis, R.; Boldo, E.; López-Abente, G. Cancer mortality in towns in the vicinity of incinerators and installations for the recovery or disposal of hazardous waste. Environ. Int. 2013, 51, 31–44. [Google Scholar] [CrossRef] [PubMed]
- Sun, C.; Zhu, X. Evaluating the public perceptions of nuclear power in China: Evidence from a contingent valuation survey. Energy Policy 2014, 69, 397–405. [Google Scholar] [CrossRef]

| Study | Period and Region | Facilities/Activities | Effects on Property Values |
|---|---|---|---|
| Boxall et al. [27] | 1994–2001 Alberta | Oil and gas facilities | Sale prices fall for houses located within 4 km of facilities from −4% to −8%. Meanwhile, the depreciation effect can easily be expanded with more frequent extraction activities. |
| Grislain-Letrémy and Katossky [29] | 2002–2008 Bordeaux, Dunkirk, and Rouen | Chemical facilities | The impact of hazardous plants on housing values strongly differs among the three industrial areas. Chemical plants in first two areas have slight impacts on local property values. While in Rouen, prices increase by 4.2% per kilometer. |
| Zabel and Guignet [32] | 1996–2007 Maryland | Leaking underground storage tanks | When a leak site is found, local properties prices will plunge by 5%. The negative effect will increase after public inquiry. |
| Stefan et al. [31] | 2002–2013 Switzerland | Nuclear power plants | After the Fukushima nuclear explosions, prices of houses near the nuclear power plant in Switzerland decreased by 2.3%. |
| Ihlanfeldt and Taylor [30] | 1994–1998 Atlanta | Hazardous waste sites | Hazardous waste facilities in the region have been identified to have a negative impact on adjacent property value. Industrial buildings are affected least, about 57 million, while commodity houses suffer the most negative impacts, about 387 million. |
| Gamper-Rabindran and Timmins [28] | 1990–2000 America | The cleanup of hazardous waste | The cleanup of hazardous waste facilities will generally raise the prices of surrounding property by 14.7%. Properties of low prices are subject to greater impacts as they approach these facilities. |
| District | Area (Square Kilometer) | The Resident Population (Ten Thousand) | Population Density (Ten Thousand/sq km) |
|---|---|---|---|
| Baoan | 392.14 | 273.65 | 0.6978 |
| Longgang | 385.94 | 201.12 | 0.5211 |
| Futian | 78.8 | 135.71 | 1.7222 |
| Nanshan | 182 | 108.79 | 0.5977 |
| Yantian | 72.63 | 20.88 | 0.2875 |
| Luohu | 78.36 | 93.64 | 1.1950 |
| whole city | 1189.87 | 833.79 | 0.7007 |
| Variable | Description | Mean | Max | Min |
|---|---|---|---|---|
| Ln P | Property transaction price (logarithm) | 10.12 | 11.81 | 7.27 |
| Structural attributes | ||||
| Sales status | Dummy variable (new house = 1) | 0.40 | 1 | 0 |
| Floor area | Property area | 100.16 | 389.93 | 24 |
| Plot ratio | Ratio between construction area and coverage area | 3.61 | 10.35 | 0.96 |
| Bedroom | Number of bedrooms | 2.76 | 6 | 0 |
| Location attributes | ||||
| Supermarket | Number of supermarkets within 3 km | 14.51 | 19 | 3 |
| Bus station | Number of bus stations within 2 km | 9.01 | 15 | 0 |
| CBD | Distance from the CBD | 16.98 | 36 | 1.9 |
| Government | Distance from the local government | 7.22 | 25.4 | 0.5 |
| School | Number of schools within 2 km | 8.92 | 6 | 15 |
| Hospital | Number of general hospitals within 3 km | 3.80 | 1 | 9 |
| Environmental attributes | ||||
| Greening rate | Green coverage rate | 0.39 | 0.67 | 0.15 |
| Park | Number of parks within 3 km | 6.07 | 13 | 0 |
| Water body | Dummy variable (have open water body within 3 km =1) | 0.53 | 1 | 0 |
| LULU distance | Distance from WTE plants | 7.11 | 25.1 | 0.7 |
| Variables | Coef. | Std. Err. | t-Value | p > |t| |
|---|---|---|---|---|
| Constant | 9.4596 | 0.0543 | 174.20 | 0.000 |
| LULU distance | 0.0130 | 0.0013 | 10.01 | 0.000 |
| Structural attributes | ||||
| Sales status | 0.0543 | 0.0118 | 4.60 | 0.000 |
| Floor area | 0.0011 | 0.0002 | 7.06 | 0.000 |
| Plot ratio | 0.0161 | 0.0041 | 3.93 | 0.000 |
| Bedroom | 0.0283 | 0.0073 | 3.87 | 0.000 |
| Location attributes | ||||
| Supermarket | −0.0202 | 0.0016 | −13.01 | 0.000 |
| Bus station | 0.0073 | 0.0030 | 2.42 | 0.016 |
| CBD | −0.0188 | 0.0007 | −28.66 | 0.000 |
| Government | −0.0120 | 0.0010 | −11.62 | 0.000 |
| School | 0.0483 | 0.0048 | 10.13 | 0.000 |
| Hospital | −0.0253 | 0.0032 | −7.92 | 0.000 |
| Environmental attributes | ||||
| Greening rate | 0.4958 | 0.0609 | 8.14 | 0.000 |
| Park | 0. 0557 | 0.0020 | 27.62 | 0.000 |
| Water body | 0.1278 | 0.0133 | 9.63 | 0.000 |
| Sample | Whole City | Different Regions | 2013–2015 | Different Trading Years | Different Distance Intervals | ||||
|---|---|---|---|---|---|---|---|---|---|
| IBSZ | OBSZ | 2013 | 2014 | 2015 | 0–5 km | 0–10 km | |||
| Constant | 9.3403 *** (0.0562) | 9.1902 *** (0.0806) | 10.0132 *** (0.1103) | 9.4336 *** (0.0572) | 9.2090 *** (0.1230) | 9.3645 *** (0.0708) | 9.5637 *** (0.1678) | 9.6289 *** (0.1650) | 9.4528 *** (0.0614) |
| LULU distance | 0.0164 *** (0.0014) | 0.0310 *** (0.0034) | 0.0107 *** (0.0016) | 0.0172 *** (0.0013) | 0.0089 *** (0.0027) | 0.0203 *** (0.0018) | 0.0151 *** (0.0045) | 0.0861 *** (0.0114) | 0.0169 *** (0.0028) |
| IBSZ | 0.1443 *** (0.0203) | 0.1569 *** (0.0198) | 0.1023 *** (0.0368) | 0.2023 *** (0.0286) | 0.1189 * (0.0699) | 0.4567 *** (0.0505) | 0.0957 *** (0.0207) | ||
| Y2013 | −0.1724 *** (0.0191) | −0.1217 *** (0.0358) | −0.1689 *** (0..0205) | ||||||
| Y2014 | −0.0680 *** (0.0178) | −0.0579 *** (0.0327) | −0.0612 *** (0.0194) | ||||||
| Other control variables | YES | YES | YES | YES | YES | YES | YES | YES | YES |
| N | 2119 | 1260 | 859 | 2119 | 619 | 1333 | 167 | 670 | 1763 |
| Adj R-sq | 0.7667 | 0.6112 | 0.6515 | 0.7793 | 0.7402 | 0.7870 | 0.8574 | 0.8228 | 0.7879 |
| Variables | Dis IBSZ | Dis Flo | Dis Y2013 |
|---|---|---|---|
| cons | 9.5093 *** (0.0601) | 9.4268 *** (0.0572) | 9.4354 *** (0.0573) |
| DisIBSZ | 0.0128 *** (0.0032) | ||
| DisFlo | −0.00004 *** (0.0000) | ||
| DisY2013 | 0.0015 (0.0025) | ||
| LULU distance | 0.0147 *** (0.0015) | 0.0222 *** (0.0023) | 0.0168 *** (0.0015) |
| IBSZ | 0.0927 *** (0.0254) | 0.1581 *** (0.0198) | 0.1567 *** (0.0198) |
| Y2013 | −0.1697 *** (0.0190) | −0.1749 *** (0.0191) | −0.1827 *** (0.0256) |
| Y2014 | −0.0644 *** (0.0178) | −0.0701 *** (0.0178) | −0.0679 *** (0.0178) |
| Other control variables | Yes | Yes | Yes |
| N | 2119 | 2119 | 2119 |
| Adj R-squared | 0.7809 | 0.7799 | 0.7792 |
| Mean | Median | Variance | Skewness | Kurtosis |
|---|---|---|---|---|
| −3.56 × 10⁻¹¹ | −0.0021 | 0.0460 | −1.7786 | 22.2559 |
© 2017 by the authors. Licensee MDPI, Basel, Switzerland. This article is an open access article distributed under the terms and conditions of the Creative Commons Attribution (CC BY) license ( http://creativecommons.org/licenses/by/4.0/).
Share and Cite
Sun, C.; Meng, X.; Peng, S. Effects of Waste-to-Energy Plants on China’s Urbanization: Evidence from a Hedonic Price Analysis in Shenzhen. Sustainability 2017, 9, 475. https://doi.org/10.3390/su9030475
Sun C, Meng X, Peng S. Effects of Waste-to-Energy Plants on China’s Urbanization: Evidence from a Hedonic Price Analysis in Shenzhen. Sustainability. 2017; 9(3):475. https://doi.org/10.3390/su9030475
Chicago/Turabian StyleSun, Chuanwang, Xiaochun Meng, and Shuijun Peng. 2017. "Effects of Waste-to-Energy Plants on China’s Urbanization: Evidence from a Hedonic Price Analysis in Shenzhen" Sustainability 9, no. 3: 475. https://doi.org/10.3390/su9030475
APA StyleSun, C., Meng, X., & Peng, S. (2017). Effects of Waste-to-Energy Plants on China’s Urbanization: Evidence from a Hedonic Price Analysis in Shenzhen. Sustainability, 9(3), 475. https://doi.org/10.3390/su9030475