Abstract
Concerns about climate change and increasing emission costs are drivers for new sources of fuels for Europe. Sustainable hydrocarbons can be produced synthetically by power-to-gas (PtG) and power-to-liquids (PtL) facilities, for sectors with low direct electrification such as aviation, heavy transportation and chemical industry. Hybrid PV–Wind power plants can harvest high solar and wind potentials of the Maghreb region to power these systems. This paper calculates the cost of these fuels for Europe, and presents a respective business case for the Maghreb region. Calculations are hourly resolved to find the least cost combination of technologies in a 0.45° × 0.45° spatial resolution. Results show that, for 7% weighted average cost of capital (WACC), renewable energy based synthetic natural gas (RE-SNG) and RE-diesel can be produced in 2030 for a minimum cost of 76 €/MWhHHV (0.78 €/m3SNG) and 88 €/MWhHHV (0.85 €/L), respectively. While in 2040, these production costs can drop to 66 €/MWhHHV (0.68 €/m3SNG) and 83 €/MWhHHV (0.80 €/L), respectively. Considering access to a WACC of 5% in a de-risking project, oxygen sales and CO2 emissions costs, RE-diesel can reach fuel-parity at crude oil prices of 101 and 83 USD/bbl in 2030 and 2040, respectively. Thus, RE-synthetic fuels could be produced to answer fuel demand and remove environmental concerns in Europe at an affordable cost.
1. Introduction
The planet is facing a dramatic climate change problem [1] and fossil fuel-based CO2 emissions are a limiting constraint for usage of fossil fuels in the long-term [2,3]. In the past years, voluntary and mandatory regulations have been set to limit fossil fuel emissions at different levels. Based on the COP21 Paris agreement, some certain countries, if not all, have to aim to reach a net zero emissions system by 2050 [4]. This means, in these countries, fossil fuel consumption could be completely banned, in particular since natural negative emissions such as growing forests are very limited and carbon capture and storage (CCS) technology is high in cost and risky [5]. At the very least, this will result in drastic reductions in the consumption of fossil fuels. Europe has been a leader for this trend in the last decade and is expected to remain as one of the first places for the implementation of new solutions.
To reach the goal of net zero emissions, fossil fuel-based energy demand could be mainly replaced by renewable electricity (RE). However, there are sectors such as aviation, shipping, heavy transportation and non-energetic use of fossil fuels for which hydrocarbons cannot be replaced by electricity easily, or physically not at all. Biofuel production is faced with resource limitations and conflicts with food production and, therefore, offers no substantial substitute [6,7]. Net zero emissions could be achieved by a recarbonization of the energy system, whereby carbon from fossil sources is replaced by that which is created synthetically and sustainably, by the aid of RE. These RE-based fuels are carbon neutral and can be used in the current fossil fuel-based infrastructure. There are several technical options to produce hydrocarbon fuels based on hybrid PV–Wind power plants for the transport and mobility sector: mainly RE-power-to-gas (PtG) [8], liquefied natural gas (LNG) based on RE-PtG [9], and RE-power-to-liquids (PtL) [10]. Figure 1 illustrates a very simplified version of these value chains.
Figure 1.
The hybrid PV–Wind-(PtG, PtG–LNG, and PtL) value chain (very simplified).
However, either Europe may not have the RE-based power potential to answer this demand due to area limitations, or the final production cost could be too expensive. The Maghreb region (Algeria, Libya, Mauritania, Morocco, Tunisia and Western Sahara), with a high potential of solar energy and, to a lesser degree, wind power, can act as a carbon neutral oil well in the vicinity of Europe which can export a wide range of carbon neutral hydrocarbons for the least transportation cost. RE-SNG can be injected into the European gas grid through the natural gas (NG) pipelines connecting the Maghreb region to Southern Europe or liquefied into LNG and shipped to Northern Europe. RE-diesel and RE-jet fuel can be also shipped to European ports. This article investigates the production potential of these approaches and the corresponding cost, in 2030 and 2040, based on Maghreb region’s solar and wind potential. The article is structured into the following sections: Materials and Methods, Results, Discussion and Conclusions.
2. Materials and Methods
The methodology used in this article for the PtG–LNG and PtL value chains is fully explained in Fasihi et al. [9] and Fasihi et al. [10], respectively. As a summary, an updated version of the main topics has been reviewed here.
The RE-PtG–LNG simplified value chain is illustrated in Figure 2. The main components are: hybrid PV–Wind power plants, electrolyser and methanation plants, CO2 from direct air capture units, liquefaction to LNG, LNG shipping, and regasification. Electrolyser and methanation plants are coupled and will work simultaneously and with an SNG storage system; the liquefaction plant can run as base load. To have a sustainable energy system with carbon neutral products, atmospheric CO2 is used, which is independent of the location. The output heat of the electrolysis and methanation is used to fulfill the heat demand of the CO2 capture plant, which increases the overall efficiency of the system. The water demand is supplied by seawater reverse osmosis (SWRO) desalination and the recycled water from the methanation process. As a case study, Finland has been chosen as the long distance market for SNG, where the LNG value chain (liquefaction, shipping and regasification) cost has been applied.
Figure 2.
The hybrid PV–Wind–PtG–LNG value chain.
Figure 3 delineates the RE-PtL value chain. The main components are: hybrid PV–Wind power plants, electrolyser and reverse water-gas shift (RWGS) plants, CO2 from direct air capture units, Fischer–Tropsch (FT) plant, product upgrading unit and fuel shipping. Hydrogen and CO2 storage systems will guarantee the feedstock for operation of the RWGS plant and subsequently the Fischer–Tropsch plant as base load. The light fuel gases (LFG) (C1–C4) account for 5% (mass) of FT plant output [11]. The LFG and SNG produced in a methanation plant can be combusted to generate electricity via a combined cycle gas turbine (CCGT) as a backup system for the constant electricity demand of the RWGS unit. The integrated system introduces some potentials for the utilization of waste energy, which will increase the overall efficiency and will decrease the costs. Aiming for the maximum middle distillates share, the numbers provided by FVV [12] have been used for the model of this paper, and represent naphtha, jet fuel and diesel with a share of 15%, 25% and 60%, respectively.
Figure 3.
The hybrid PV–Wind–PtL value chain.
The key specification of the PtG and PtL, LNG value chain, and the feedstock (CO2 and water) plants are shown in Table 1, Table 2 and Table 3, respectively. The currency exchange rate is the long-term average 1.35 USD/€, and the currency year for all the financial numbers and generated results is 2015. Abbreviations: capital expenditures, Capex, fixed operational expenditures, Opexfix, variable operational expenditures, Opexvar, electricity, el, higher heating value, HHV, efficiency, eff., hydrogen, H2, tonne, t, barrel per day, bpd, thousand euros, k€, per annum, p.a., million, m, million cubic meter, mcm.
Table 1.
Synthetic fuels sector key specification.
Table 2.
LNG value chain specification.
Table 3.
Feedstock (CO2 and water) key specification.
The hybrid PV–Wind power plants, as the power source for all these technologies, should be located in regions of very high full load hours (FLh) to reduce the levelized cost of electricity (LCOE) of power production and subsequently the levelized cost of fuels (LCOF). Figure 4 shows the cumulative FLh for a hybrid PV–Wind power plant in the Maghreb region, where the best sites are indicated by a red color coding [31,32]. With about 7000 FLh, Western Sahara shows the highest potential of solar and wind in the region. In addition, the close distance to the coast, where the PtX plants could be located, makes the power transmission cost and, consequently, the power generation cost in total as low as possible.
Figure 4.
Maghreb’s hybrid PV–Wind power plant cumulative FLh map.
The Hourly Basis Model uses the optimized combination of PV (fixed tilted or single-axis tracking), wind power, storage options (battery, gas storage), transmission line and PtX facilities capacity to minimize the levelized cost of RE-SNG or RE-diesel. This is based on an hourly availability of the solar and wind resources in a 0.45° × 0.45° spatial resolution. The datasets for solar irradiation components and wind speed are taken from NASA databases [32,33] and partly reprocessed by the German Aerospace Center [34]. Feed-in time series for fixed, optimally tilted solar PV systems are calculated based on Gerlach et al., [35] and Huld et al., [36], and for single-axis north–south oriented continuous horizontal tracking it is calculated based on Duffie and Beckmann [37]. Feed-in time series of wind power plants are calculated for standard 3 MW wind turbines (E-101 [38]) with hub height conditions of 150 m, according to Gerlach et al., [35]. The power sector specification for the years 2030 and 2040 are shown in Table 4.
Table 4.
Power sector key specification.
The equations below have been used to calculate the LCOE of a hybrid PV–Wind power plant and the subsequent value chain, which follows respective guidelines published by the NREL [47]. Abbreviations: capital expenditures, Capex, annual operational expenditures, Opex, full load hours per year, FLh, fuel costs, fuel, efficiency, η, annuity factor, crf, weighted average cost of capital, WACC, lifetime, N, performance ratio, PR, overlap FLh, overlap. PVirradiation uses the irradiation on the module surface in units of kWh/(m2∙a), which is applied for modules under standard test conditions (STC) for 1 kW/m2. The solar PV performance ratio describes the annual performance of PV systems and is comprised of all components between the module and the point of grid access, as well as all losses due to system downtimes or reduced yields due to not fully clean modules. The overlap is defined by Gerlach et al. [35]. A WACC of 7% is used for all the calculations in the base scenario. Due to the current financing conditions and the level of stability in the region, the assumed WACC might seem low. However, it may be unlikely that such a situation would continue for decades. In addition, this is the real WACC (excluding inflation, which is typically assumed to be around 2%). For the WACC of 7% in the base scenario, assuming an equity share of 30% and an interest rate of 4%, this would lead to a return on equity of 14%, which is rather high. The volatility of prices in a renewable energy dominated energy system could be much lower, since all cost are fixed for decades. Hence, the price and respective returns can also be very stable for a long term, assuming stable political conditions. For a WACC of 5%, the corresponding numbers would lead to a return on equity of about 7.3%, which is still higher than expected in most feed-in tariff laws in Europe. However, it is obvious that such a de-risking strategy would require a respective policy framework.
3. Results
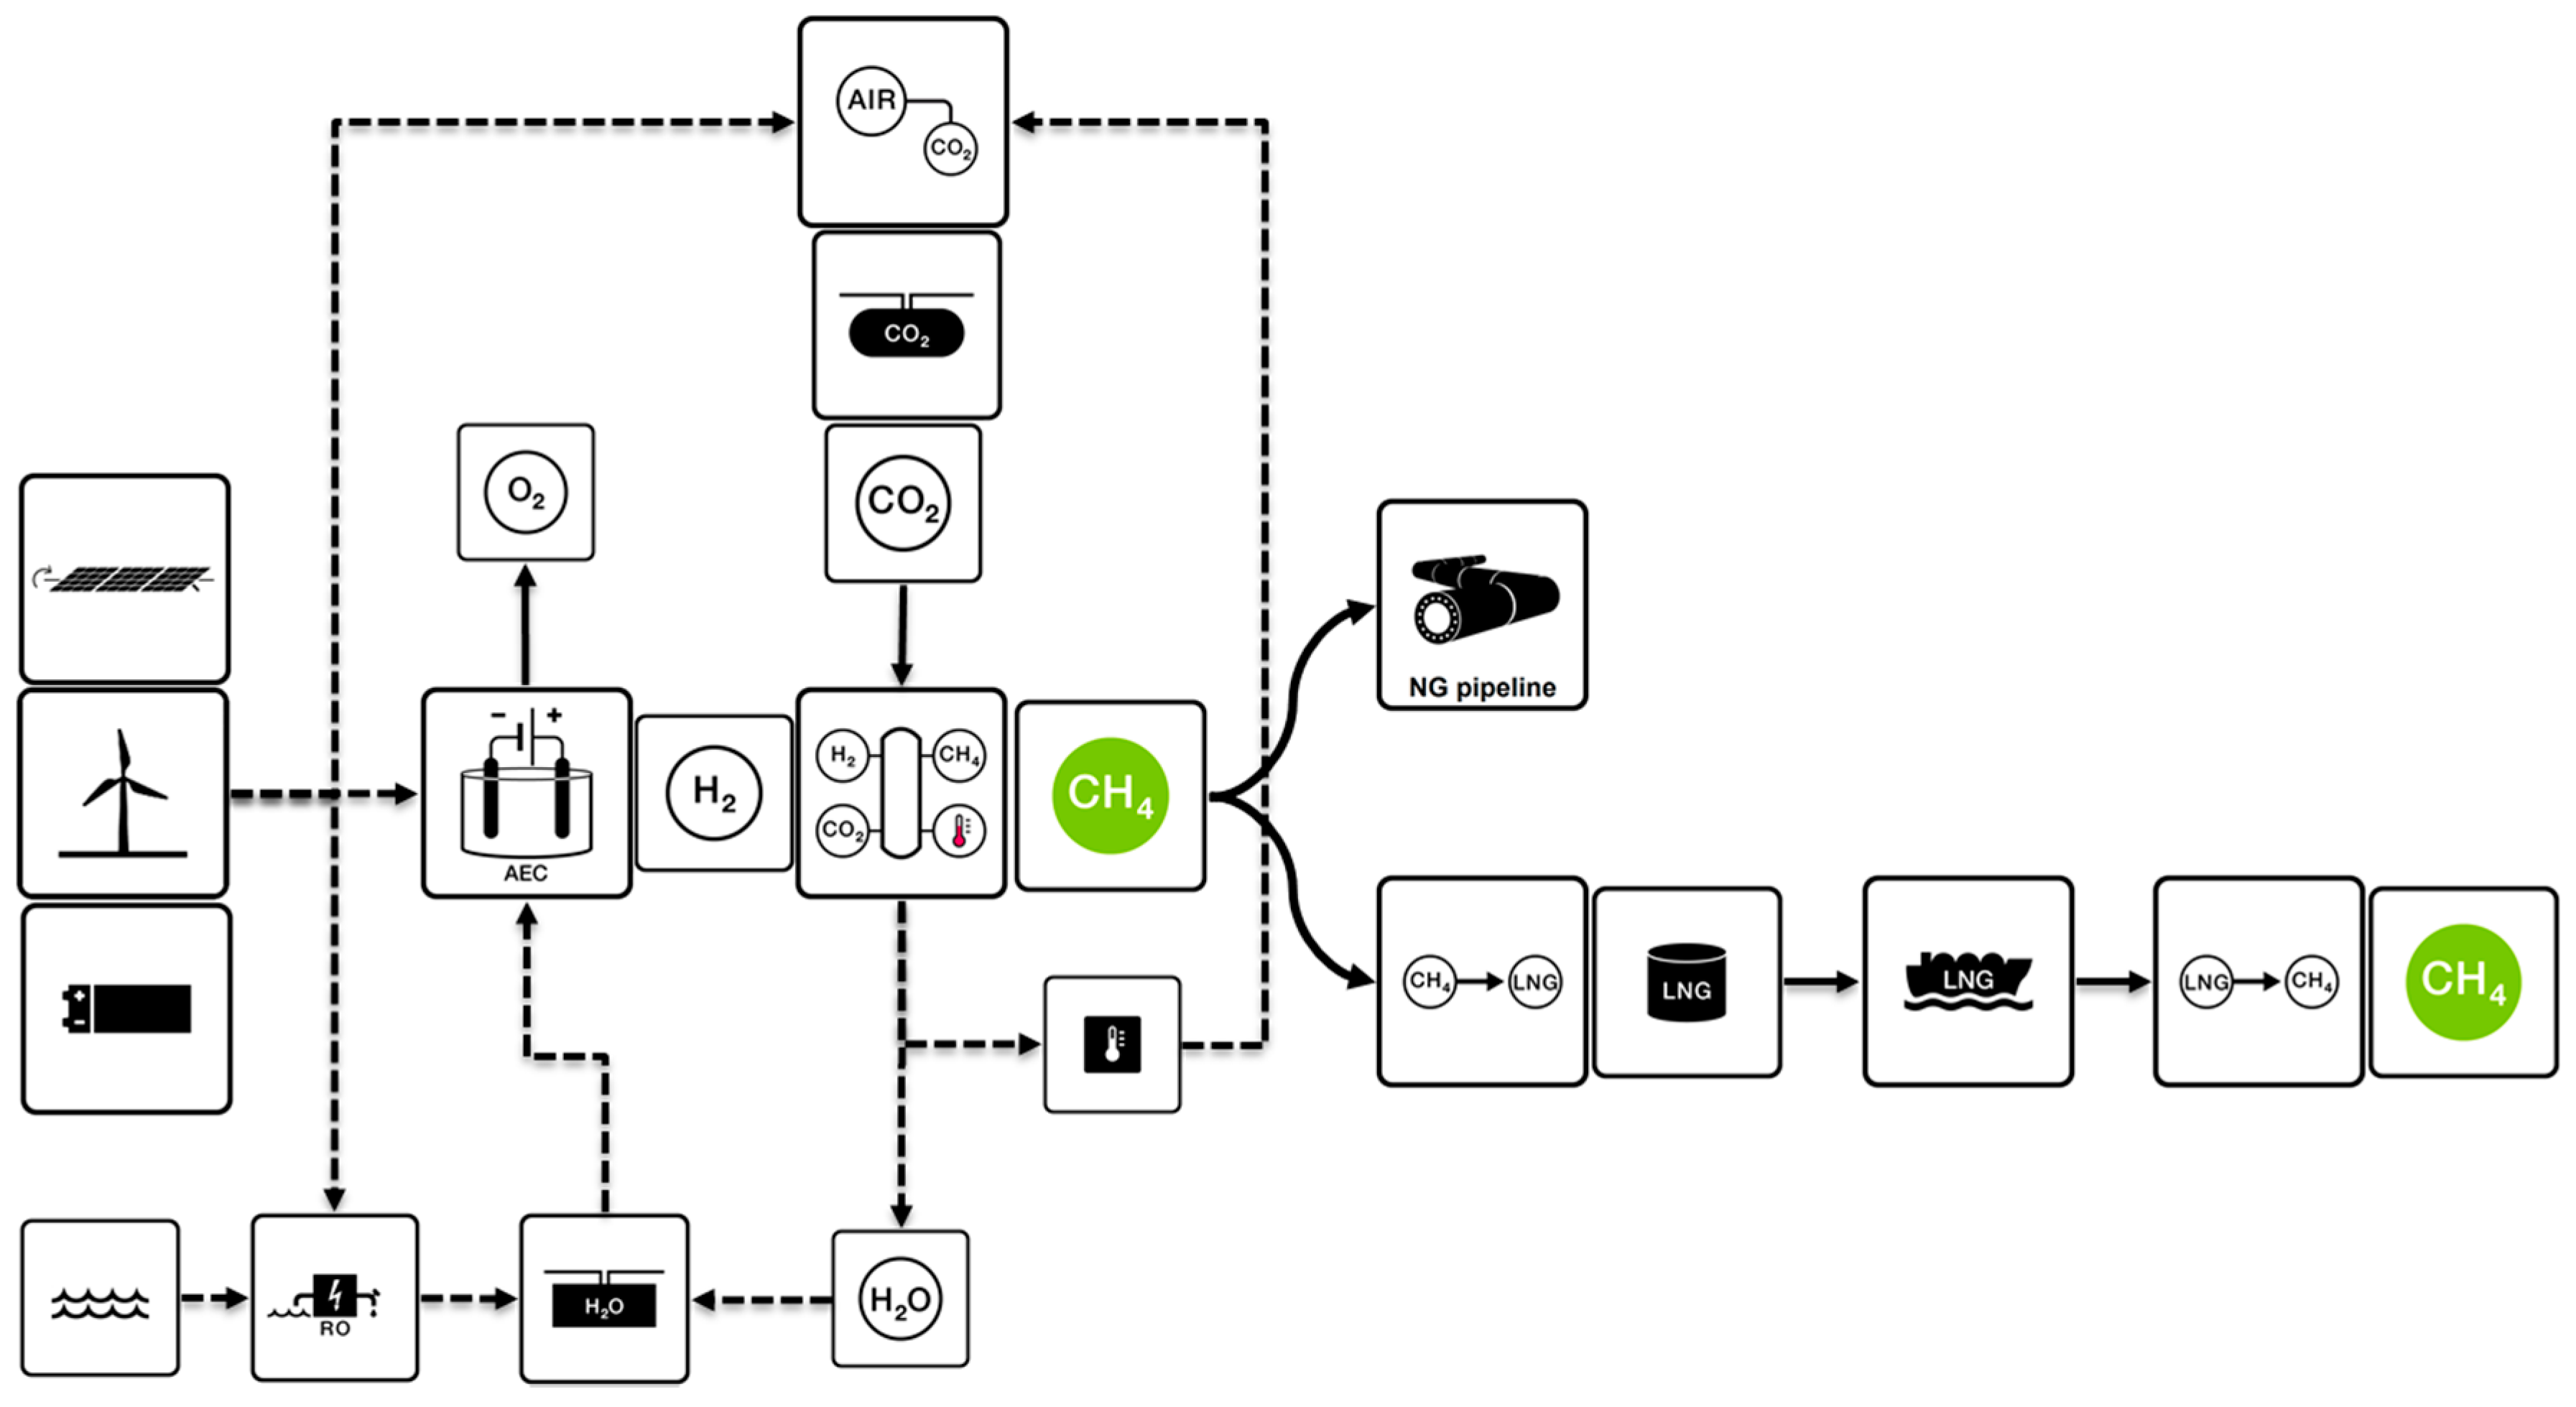
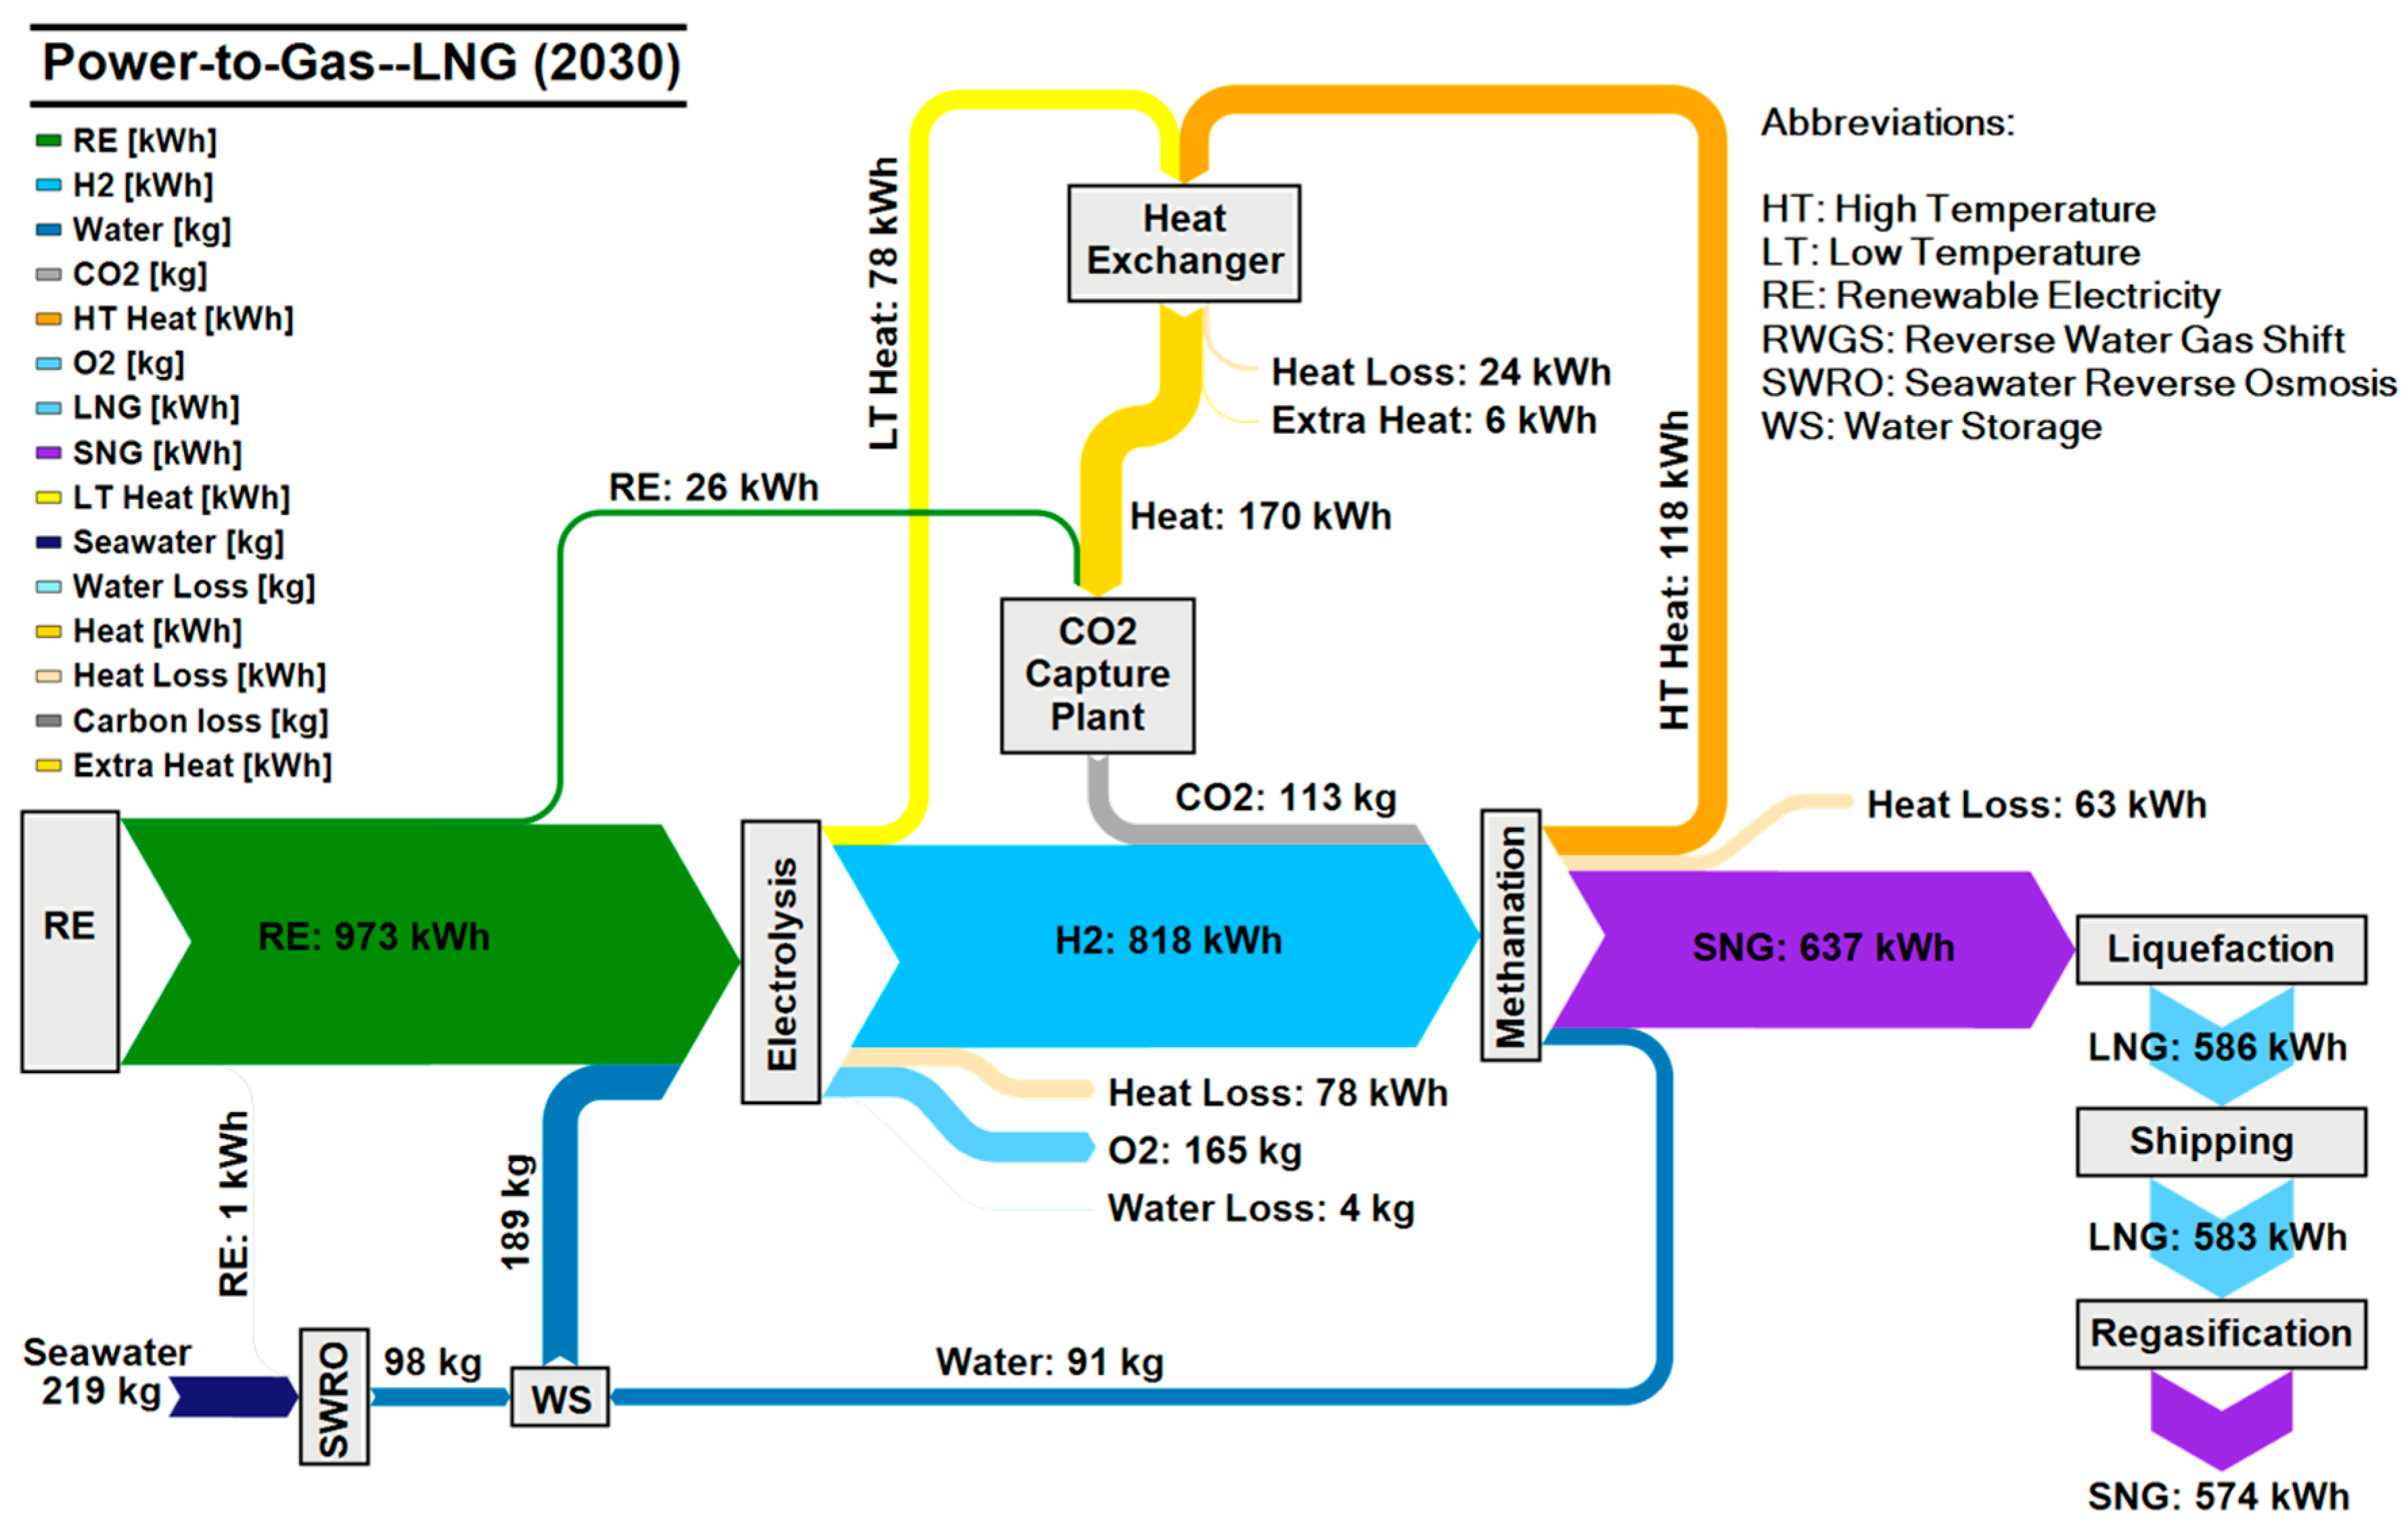
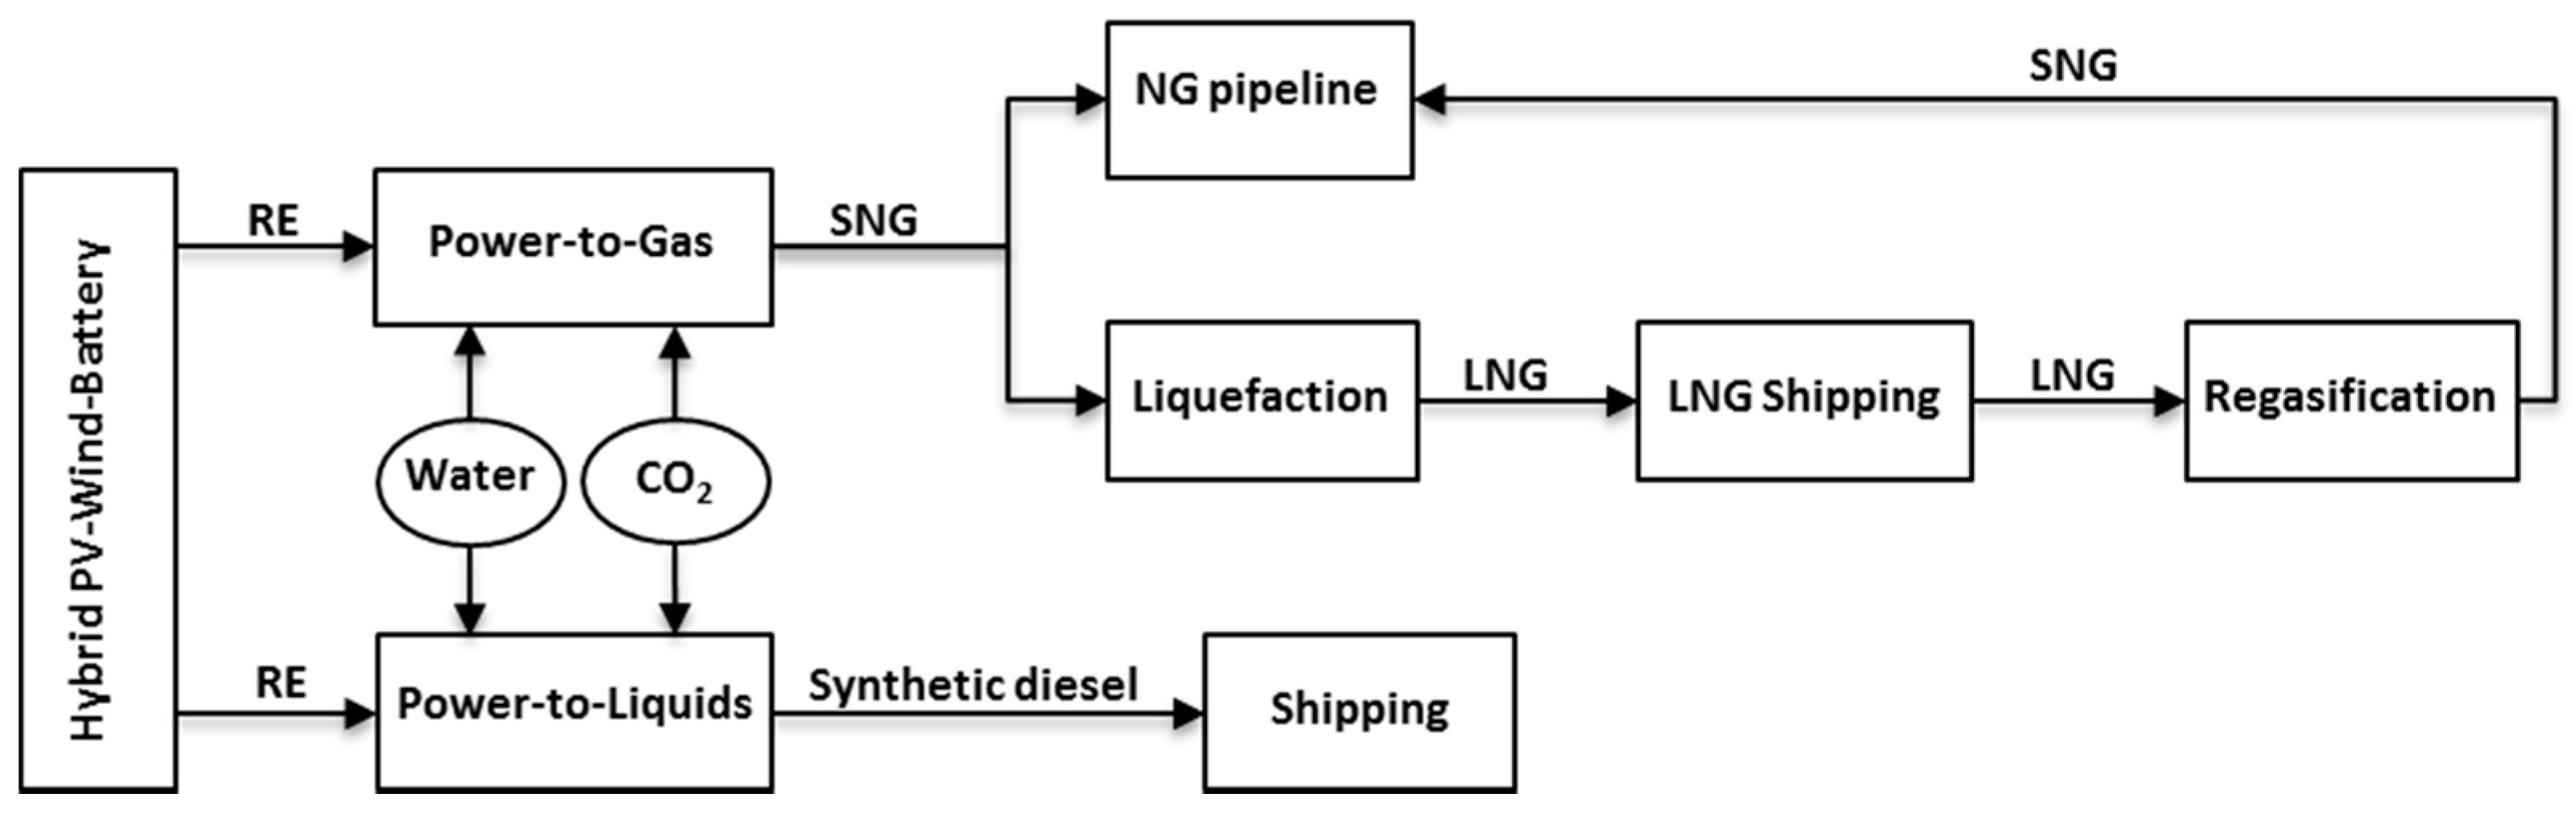
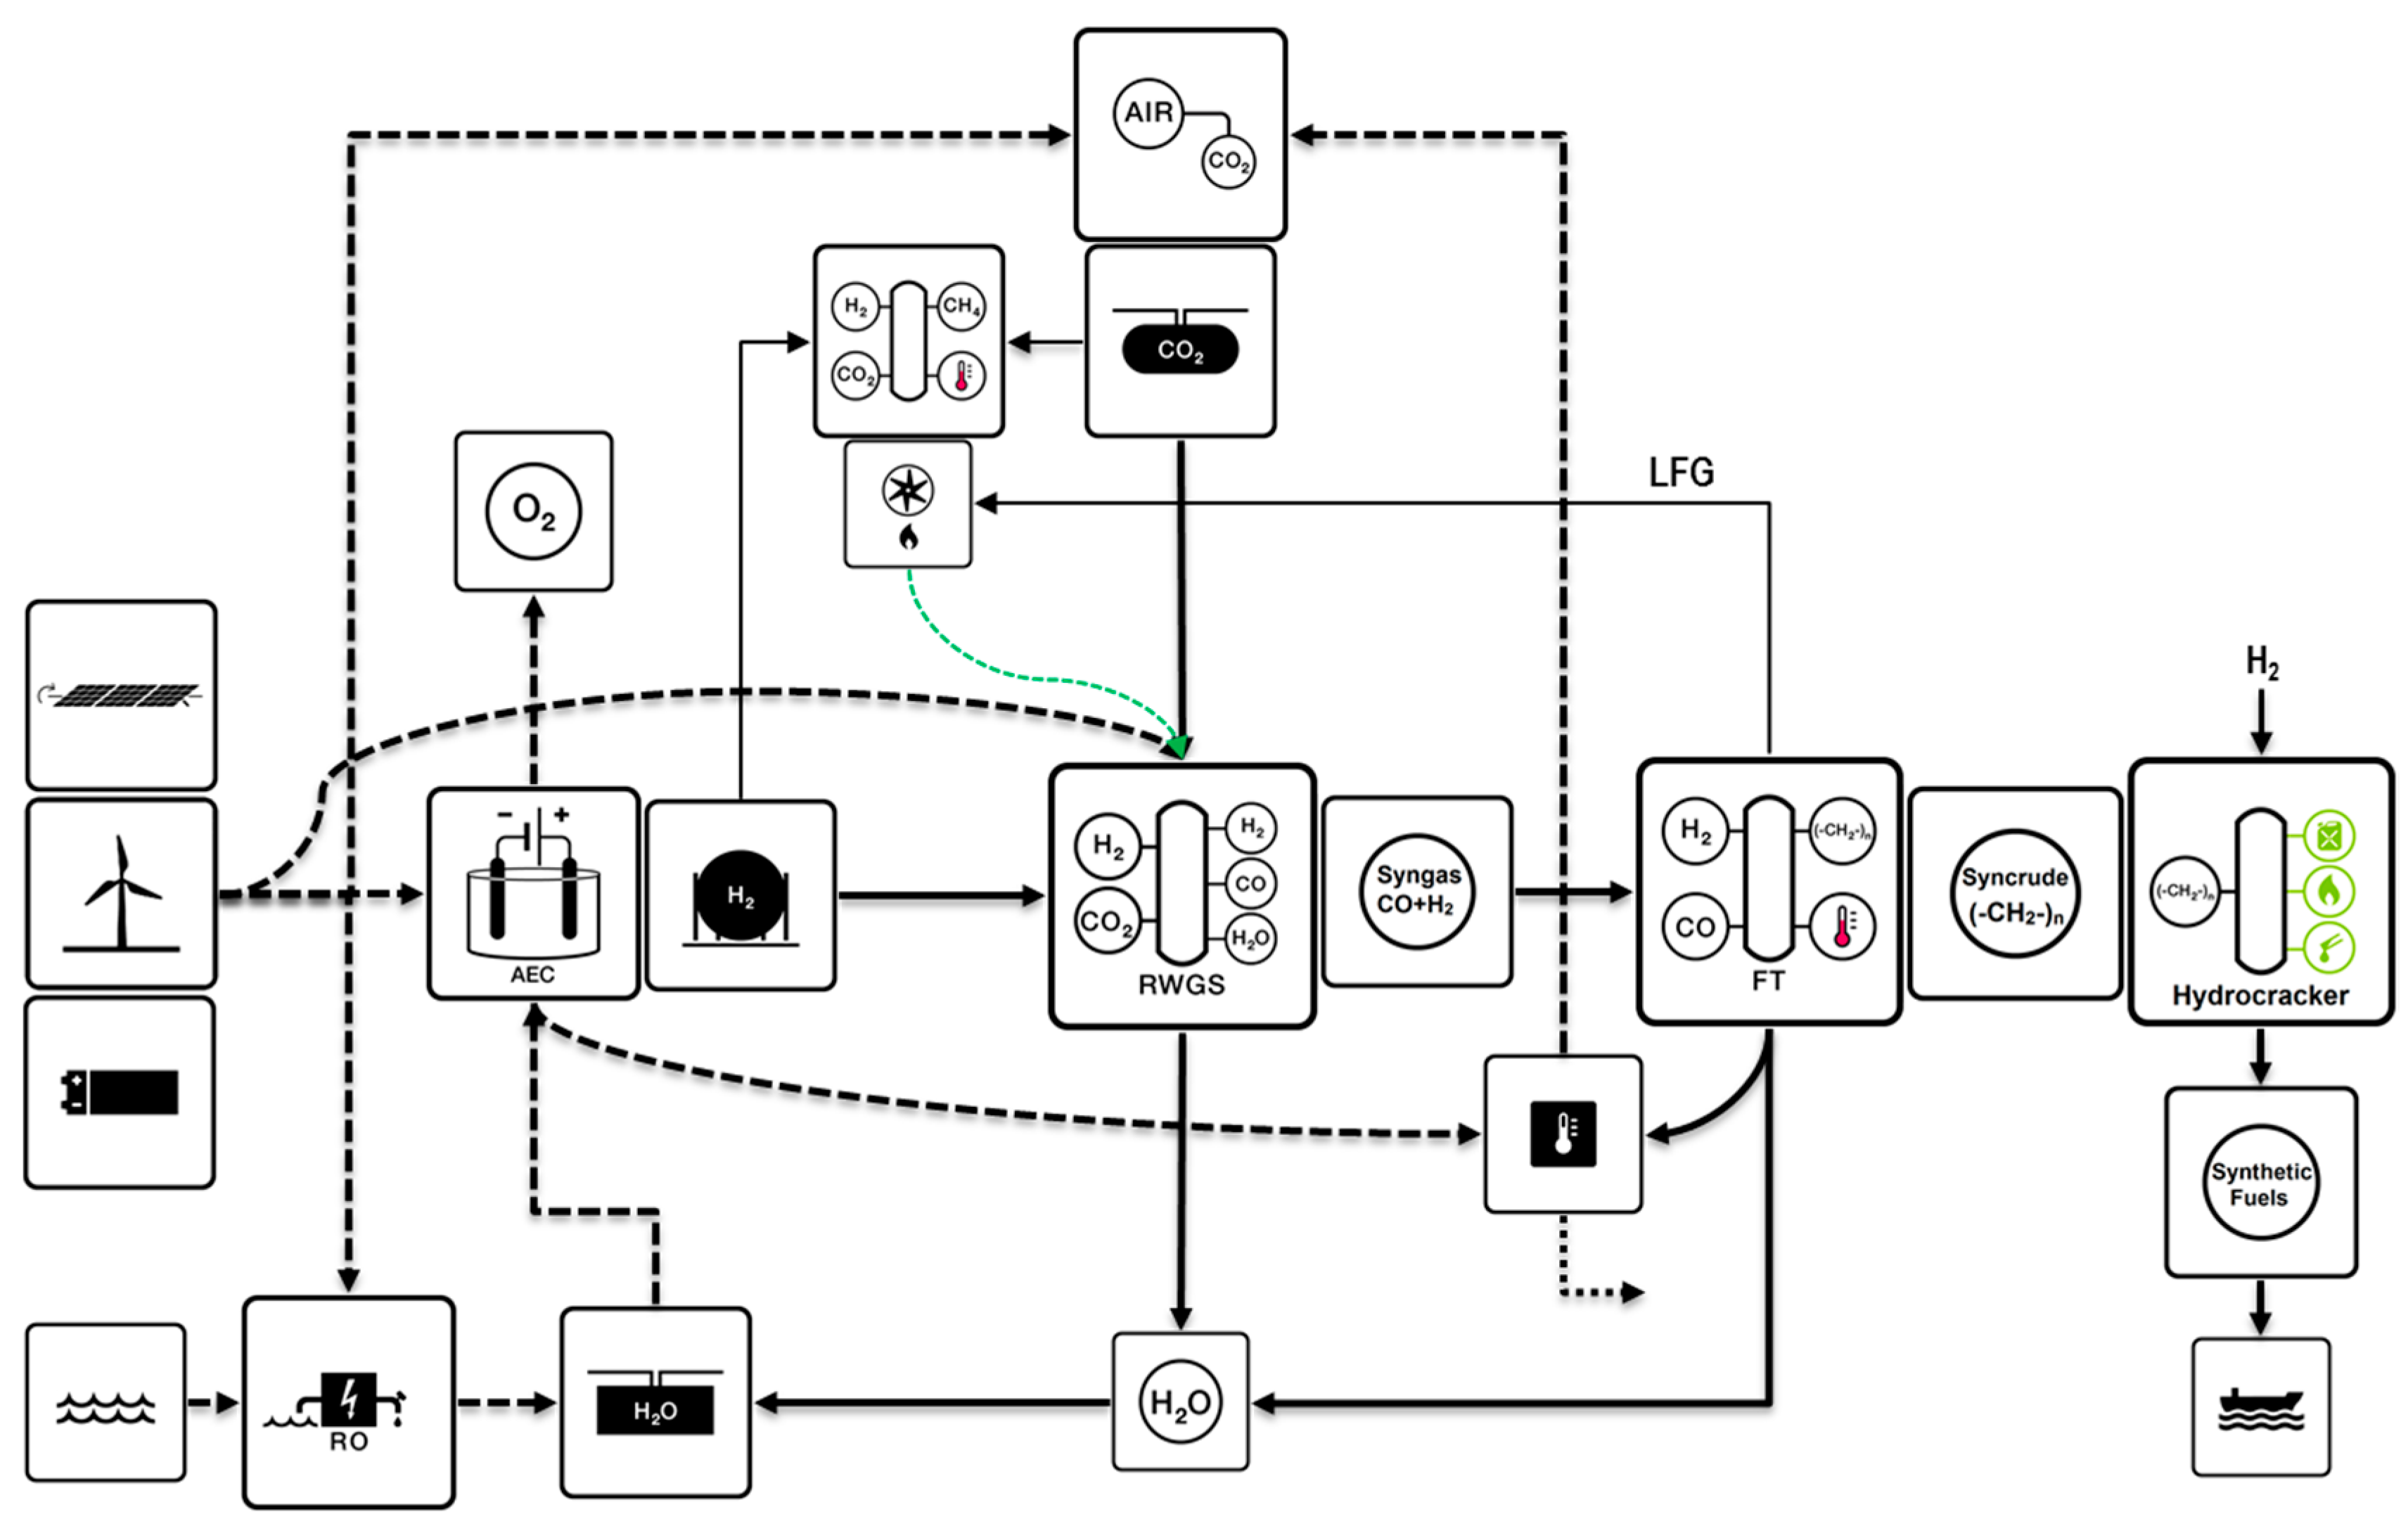
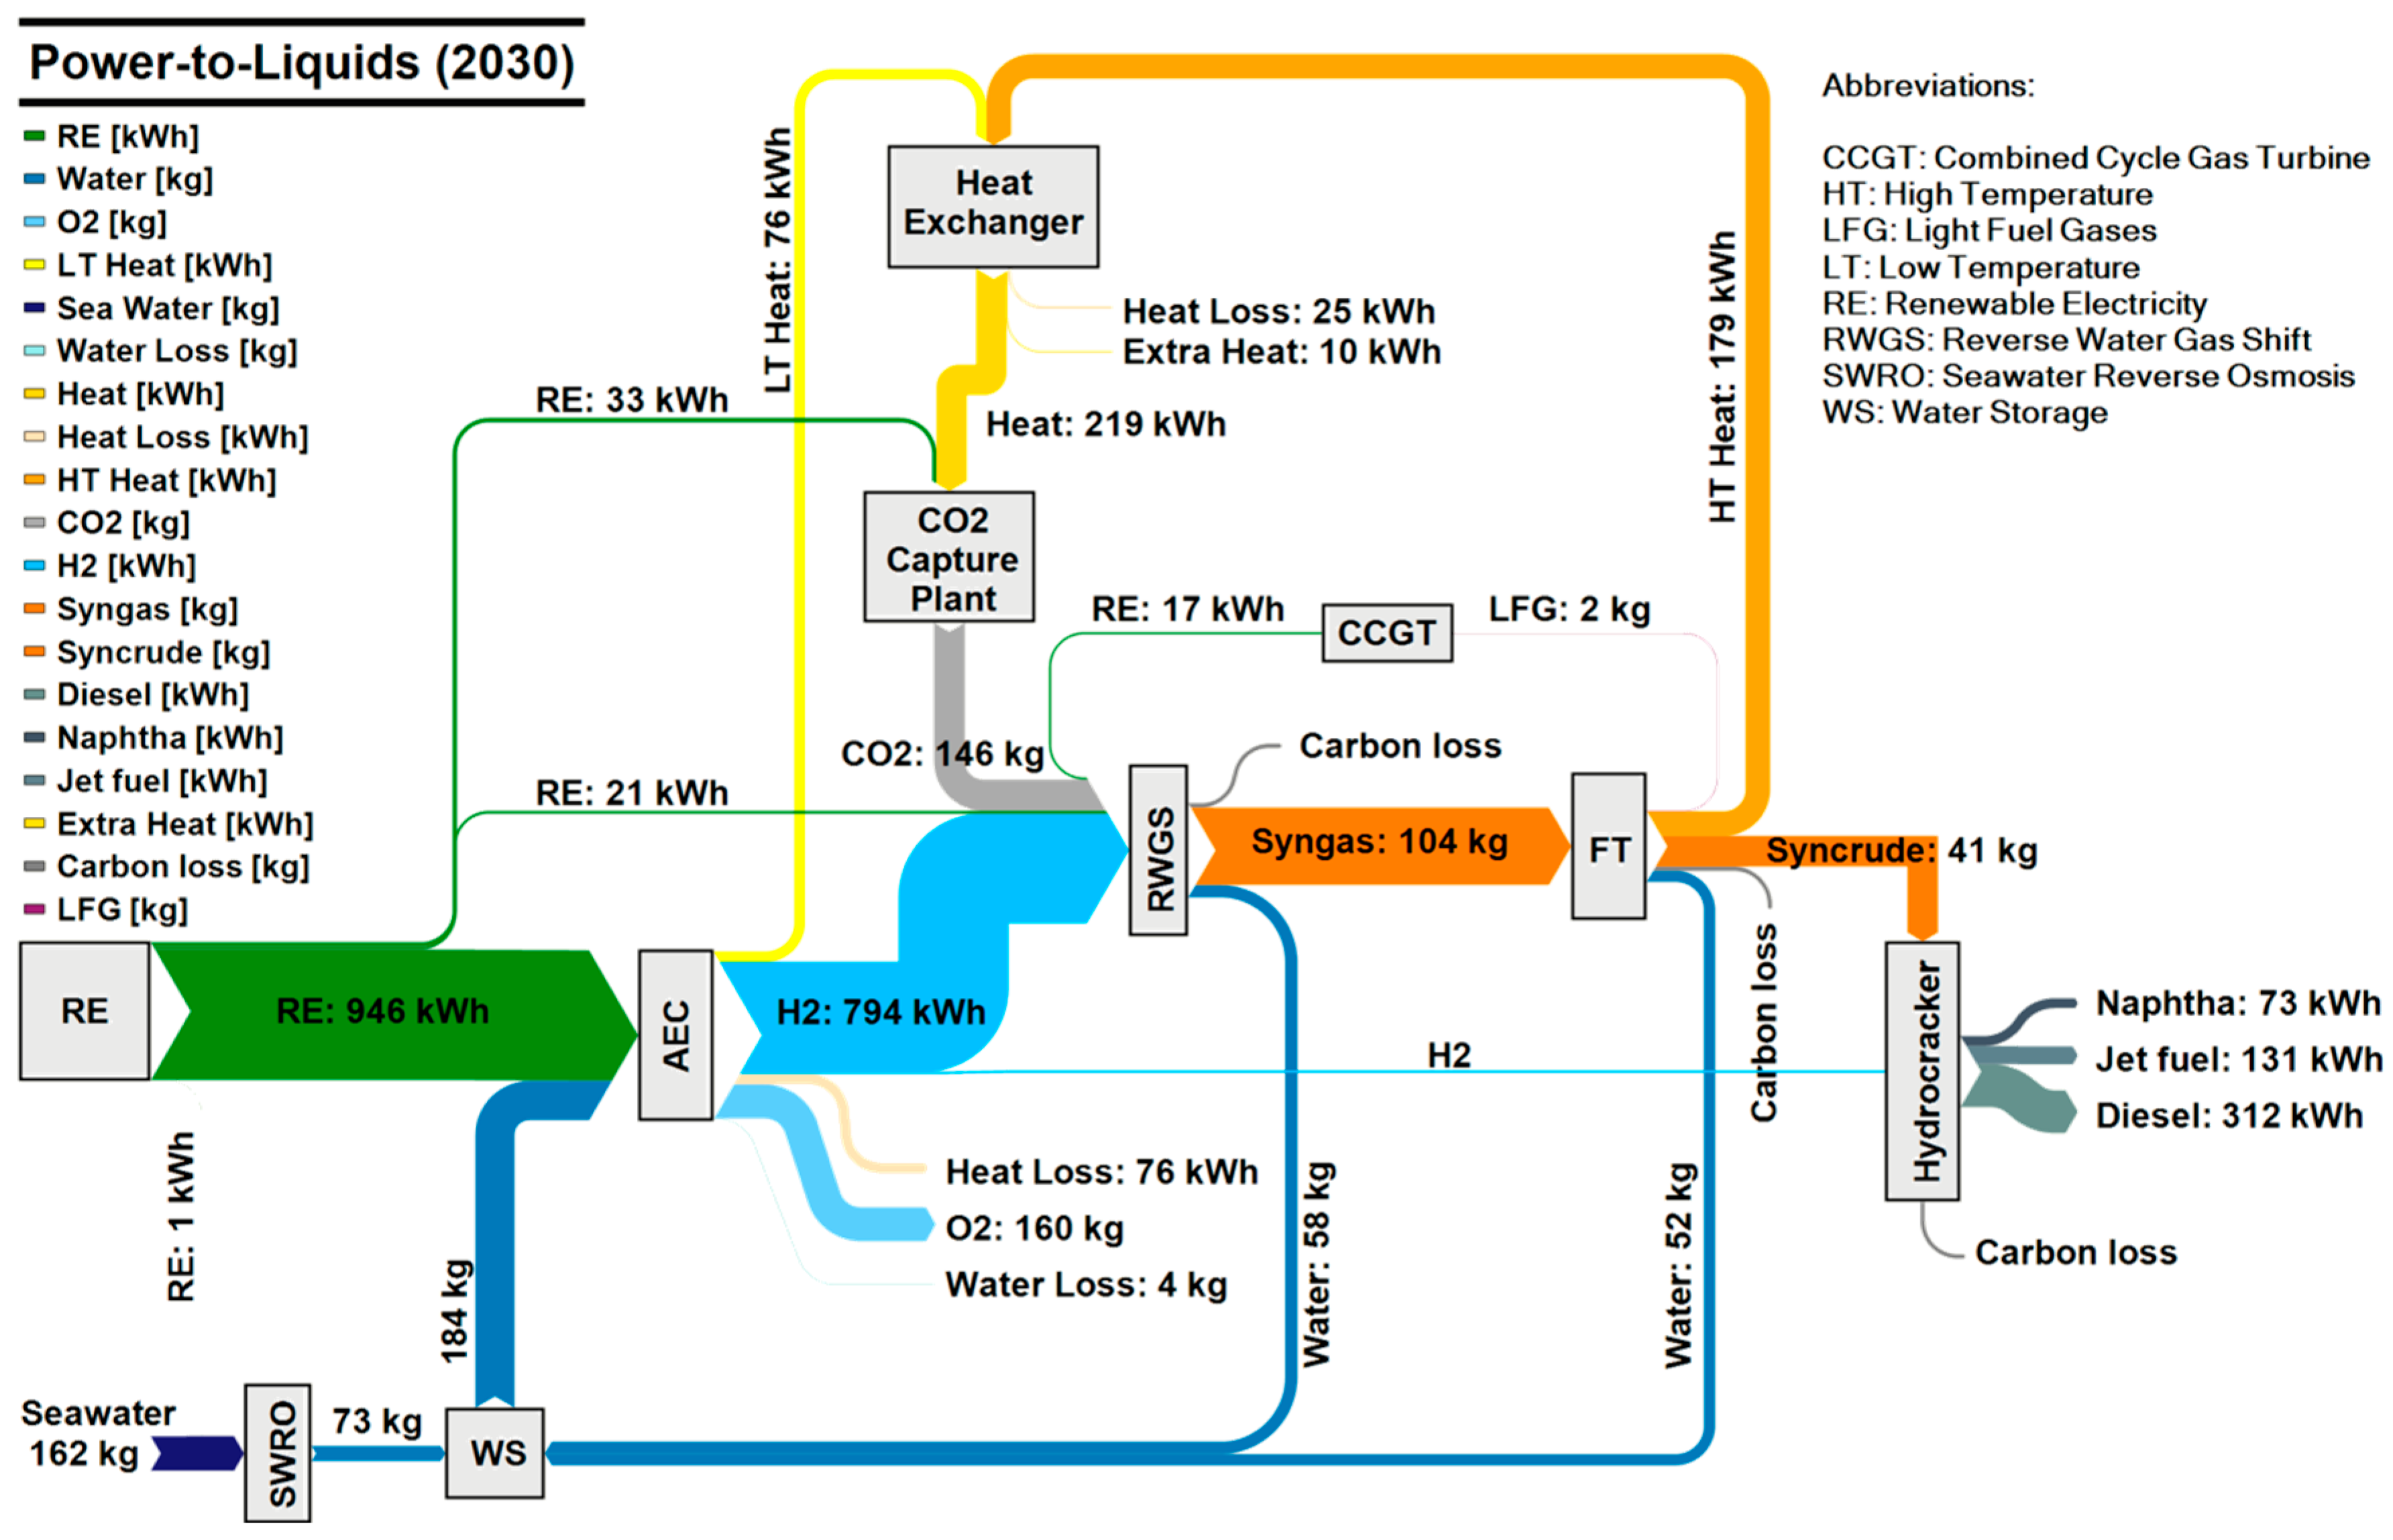
3.1. Energy and Material Flow
Figure 5 and Figure 6 show the Sankey diagrams of the entire system, depicting the energy and material flows within the entire RE-PtG–LNG and RE-PtL value chains, respectively. The figures are the example of a system with 1 MWhel specific electricity input. As can be seen in Figure 5, the electrolyser, at 97%, is the main electricity consumer in the PtG–LNG value chain, while the excess heat out of the electrolyser and the methanation plant is the main source of energy for the CO2 capture plant. Delivered SNG (HHV) to the NG pipeline in Southern Europe or regasified SNG (through LNG value chain) to Northern Europe (Finland) would be 63.7% and 57.4% of inlet electricity, respectively.
Figure 5.
RE-PtG–LNG energy and material flow diagram.
Figure 6.
RE-PtL energy and material flow diagram.
Figure 6 illustrates the energy and mass flow for the PtL value chain. As can be seen, the alkaline electrolyser, at 93%, is the main electricity consuming element, while the excess heat by-product of the electrolyser and the FT plant is the main source of energy for the CO2 capture plant. The heat released in the FT process accounts for 18% of initial electricity and 22.5% of energy content of inlet H2 to the system. The electricity generated by LFG combustion is equal to 1.7% of the inlet electricity. The overall PtL efficiency of this system would be 51.5% (HHV), while 64.9% of inlet hydrogen is converted to liquid fuels in the H2tL plant.
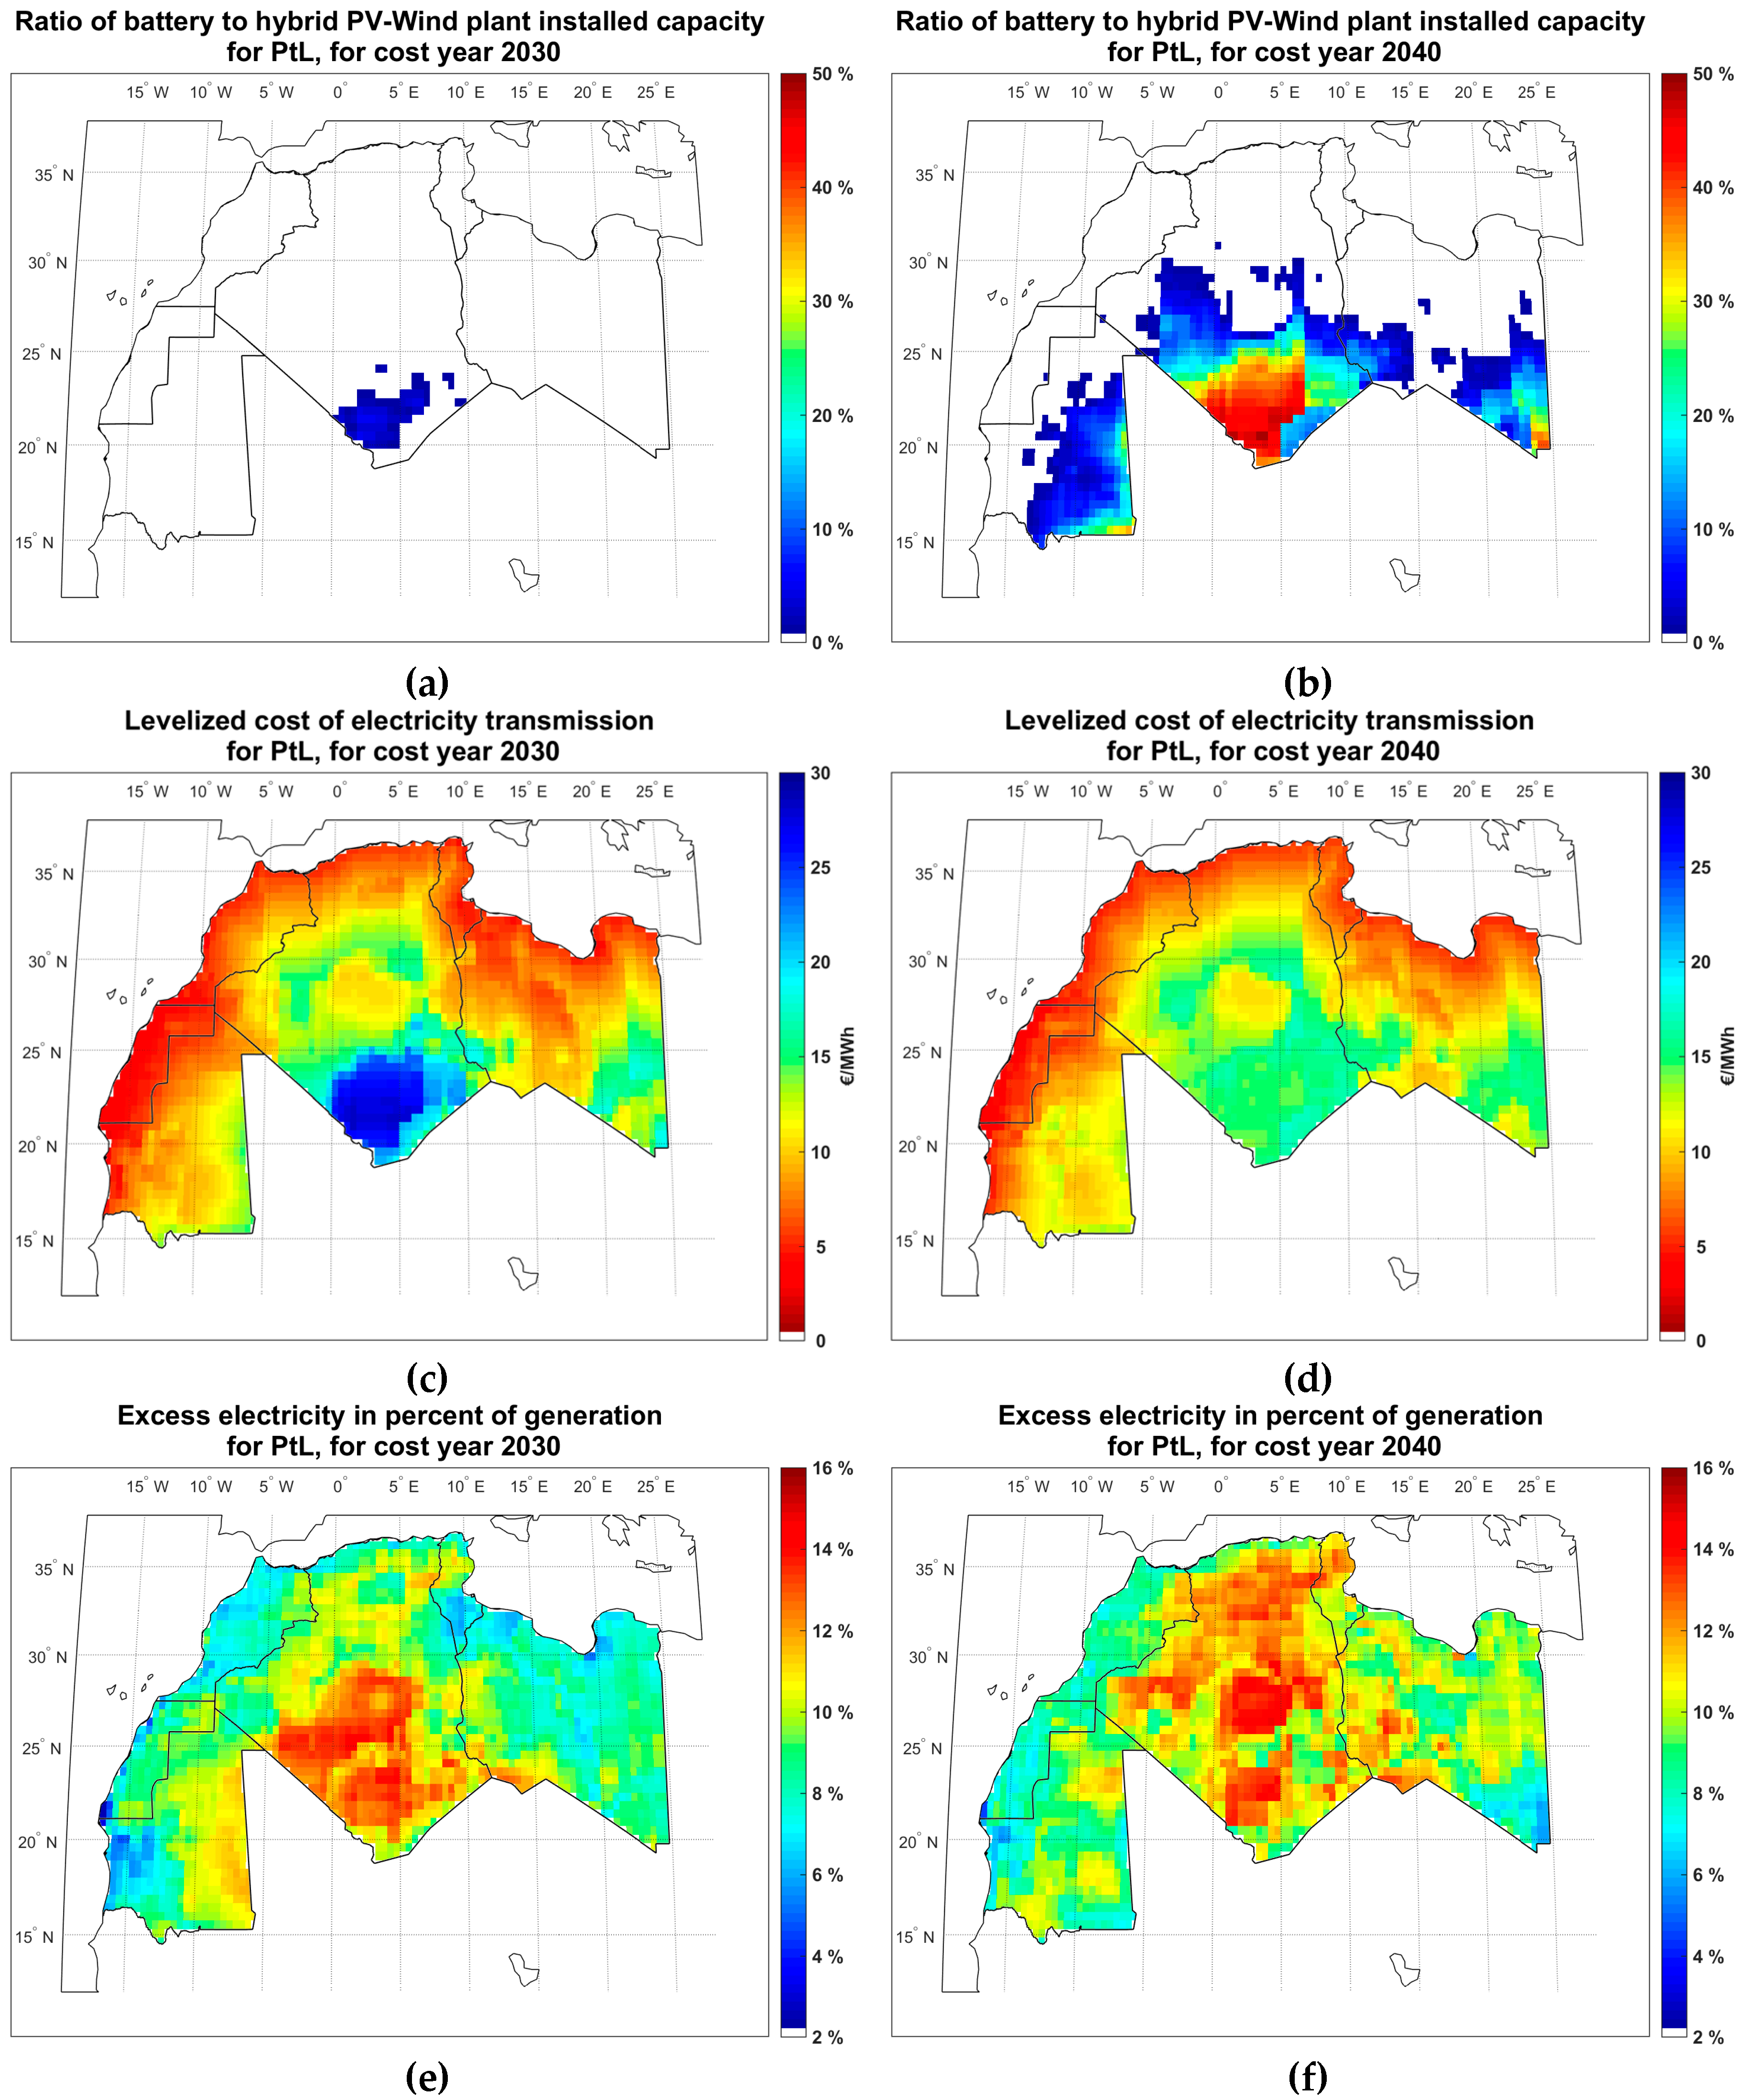
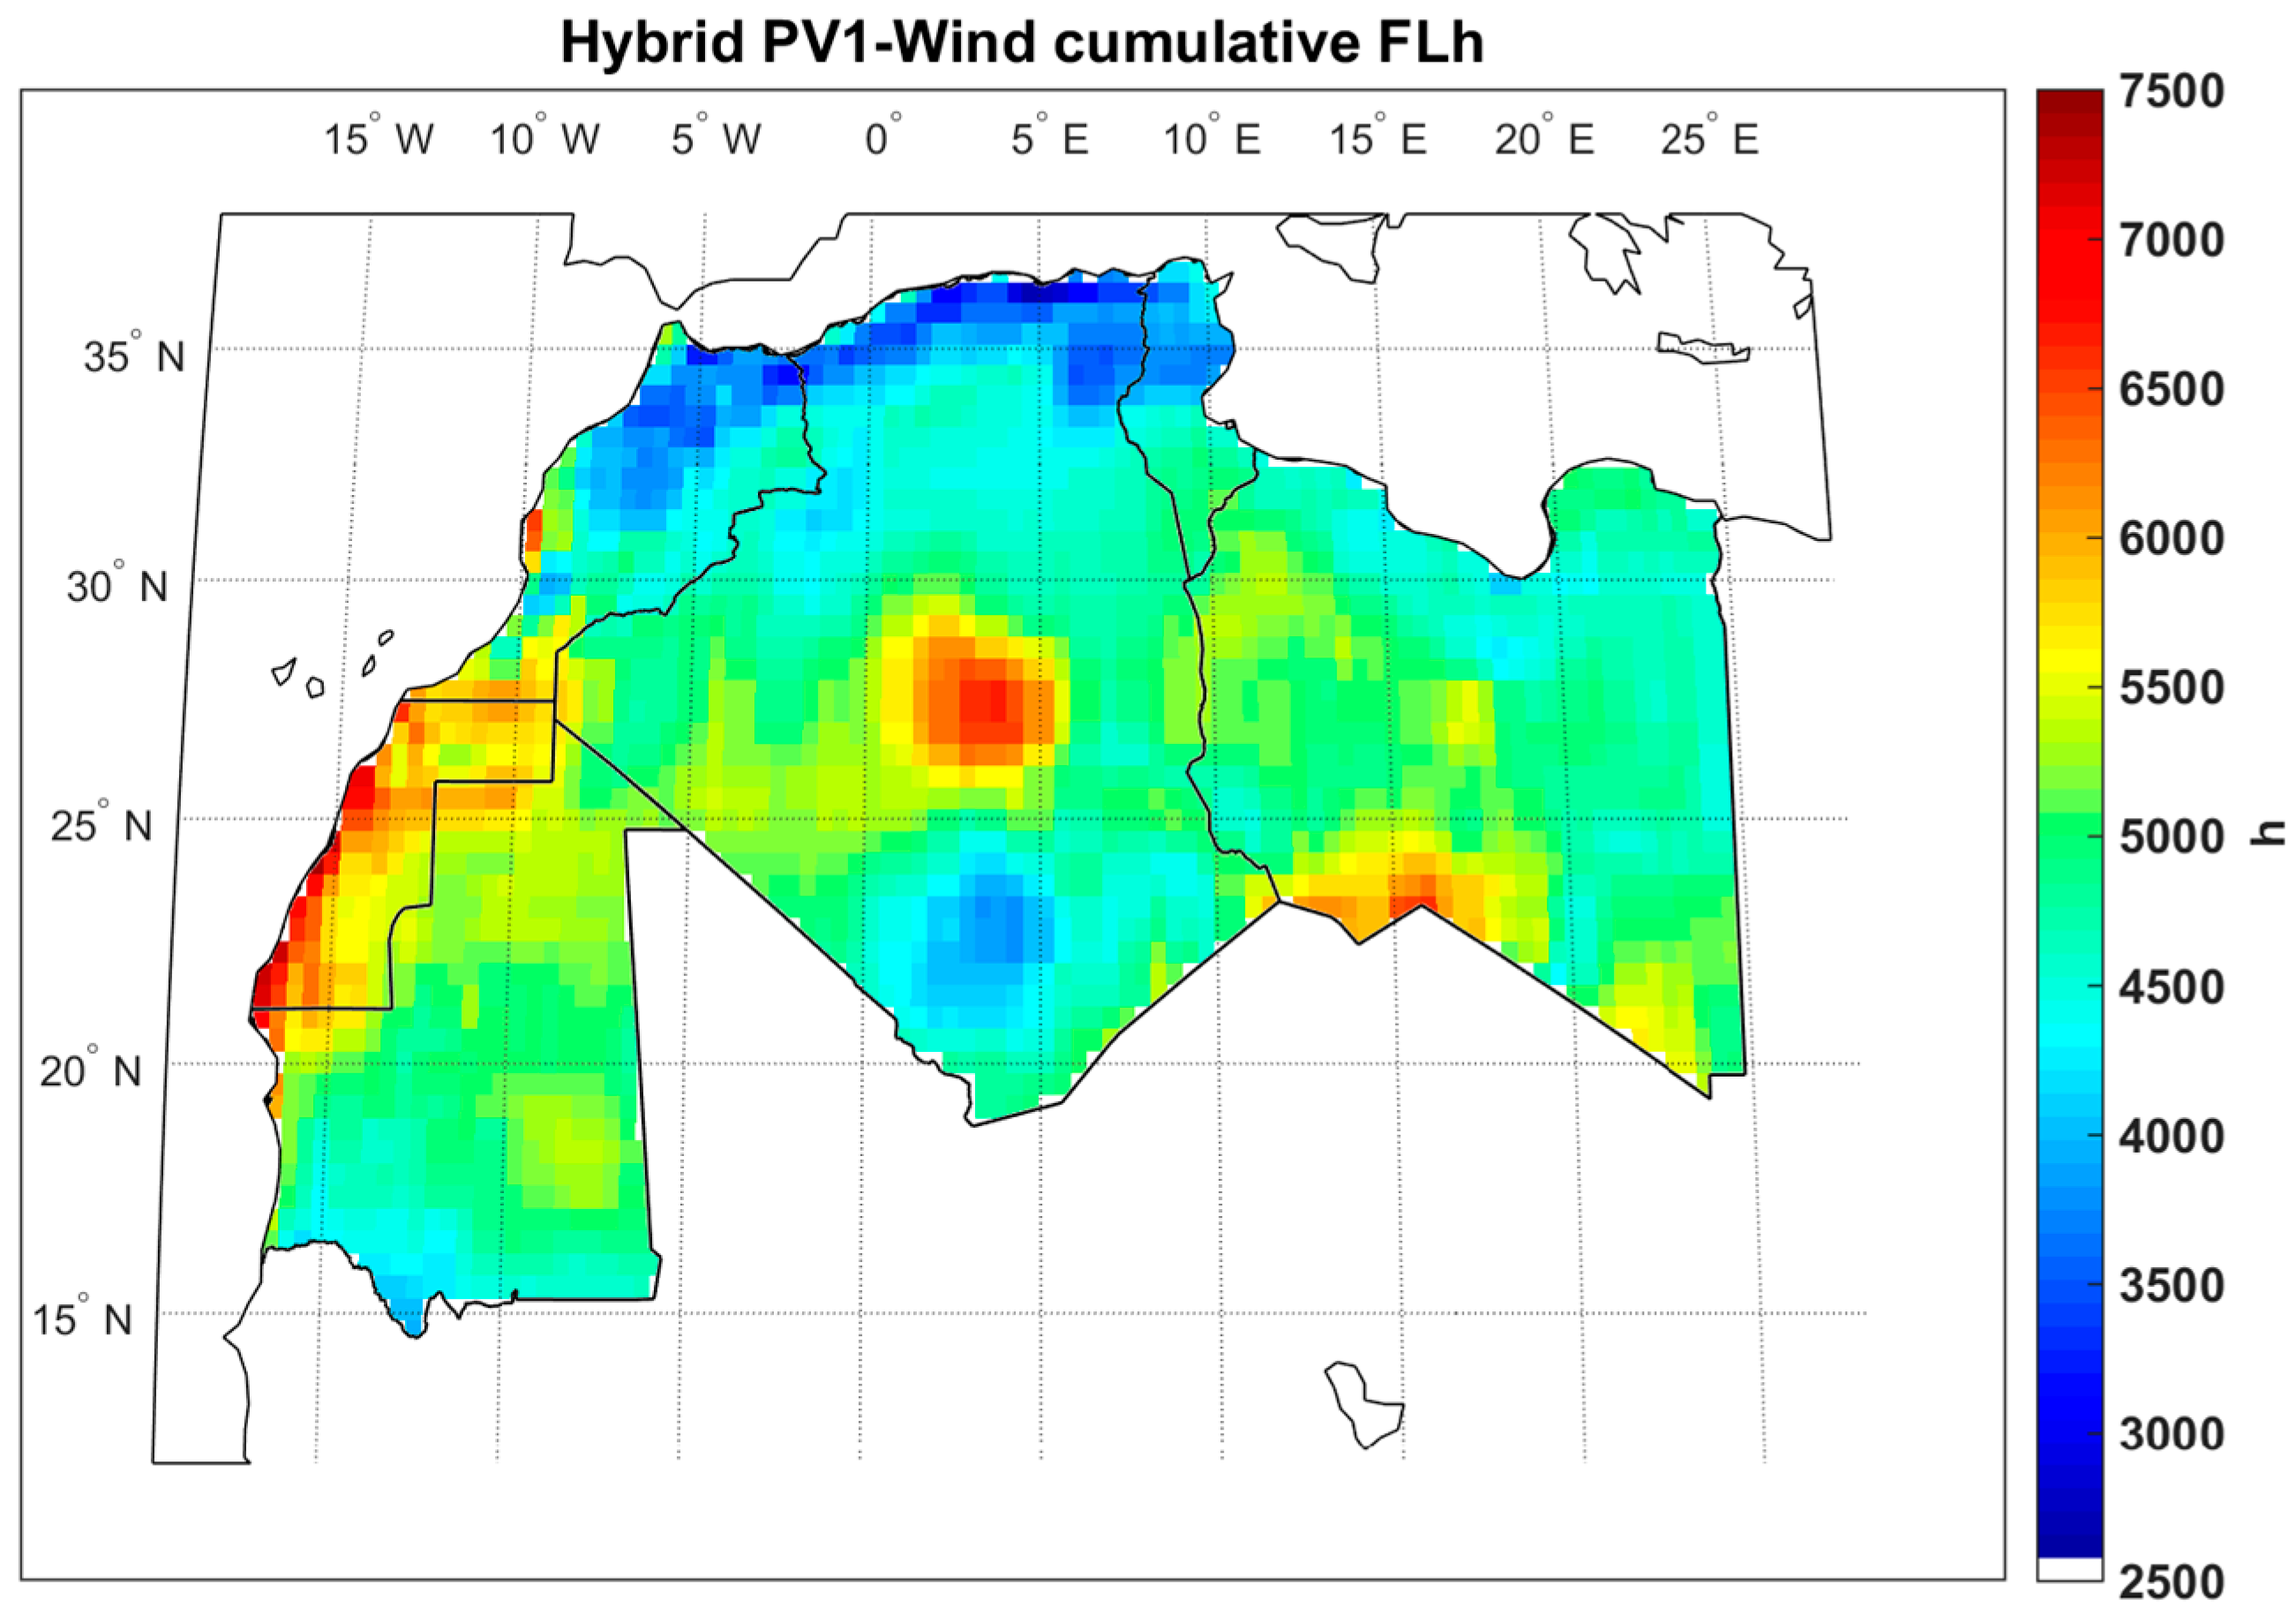
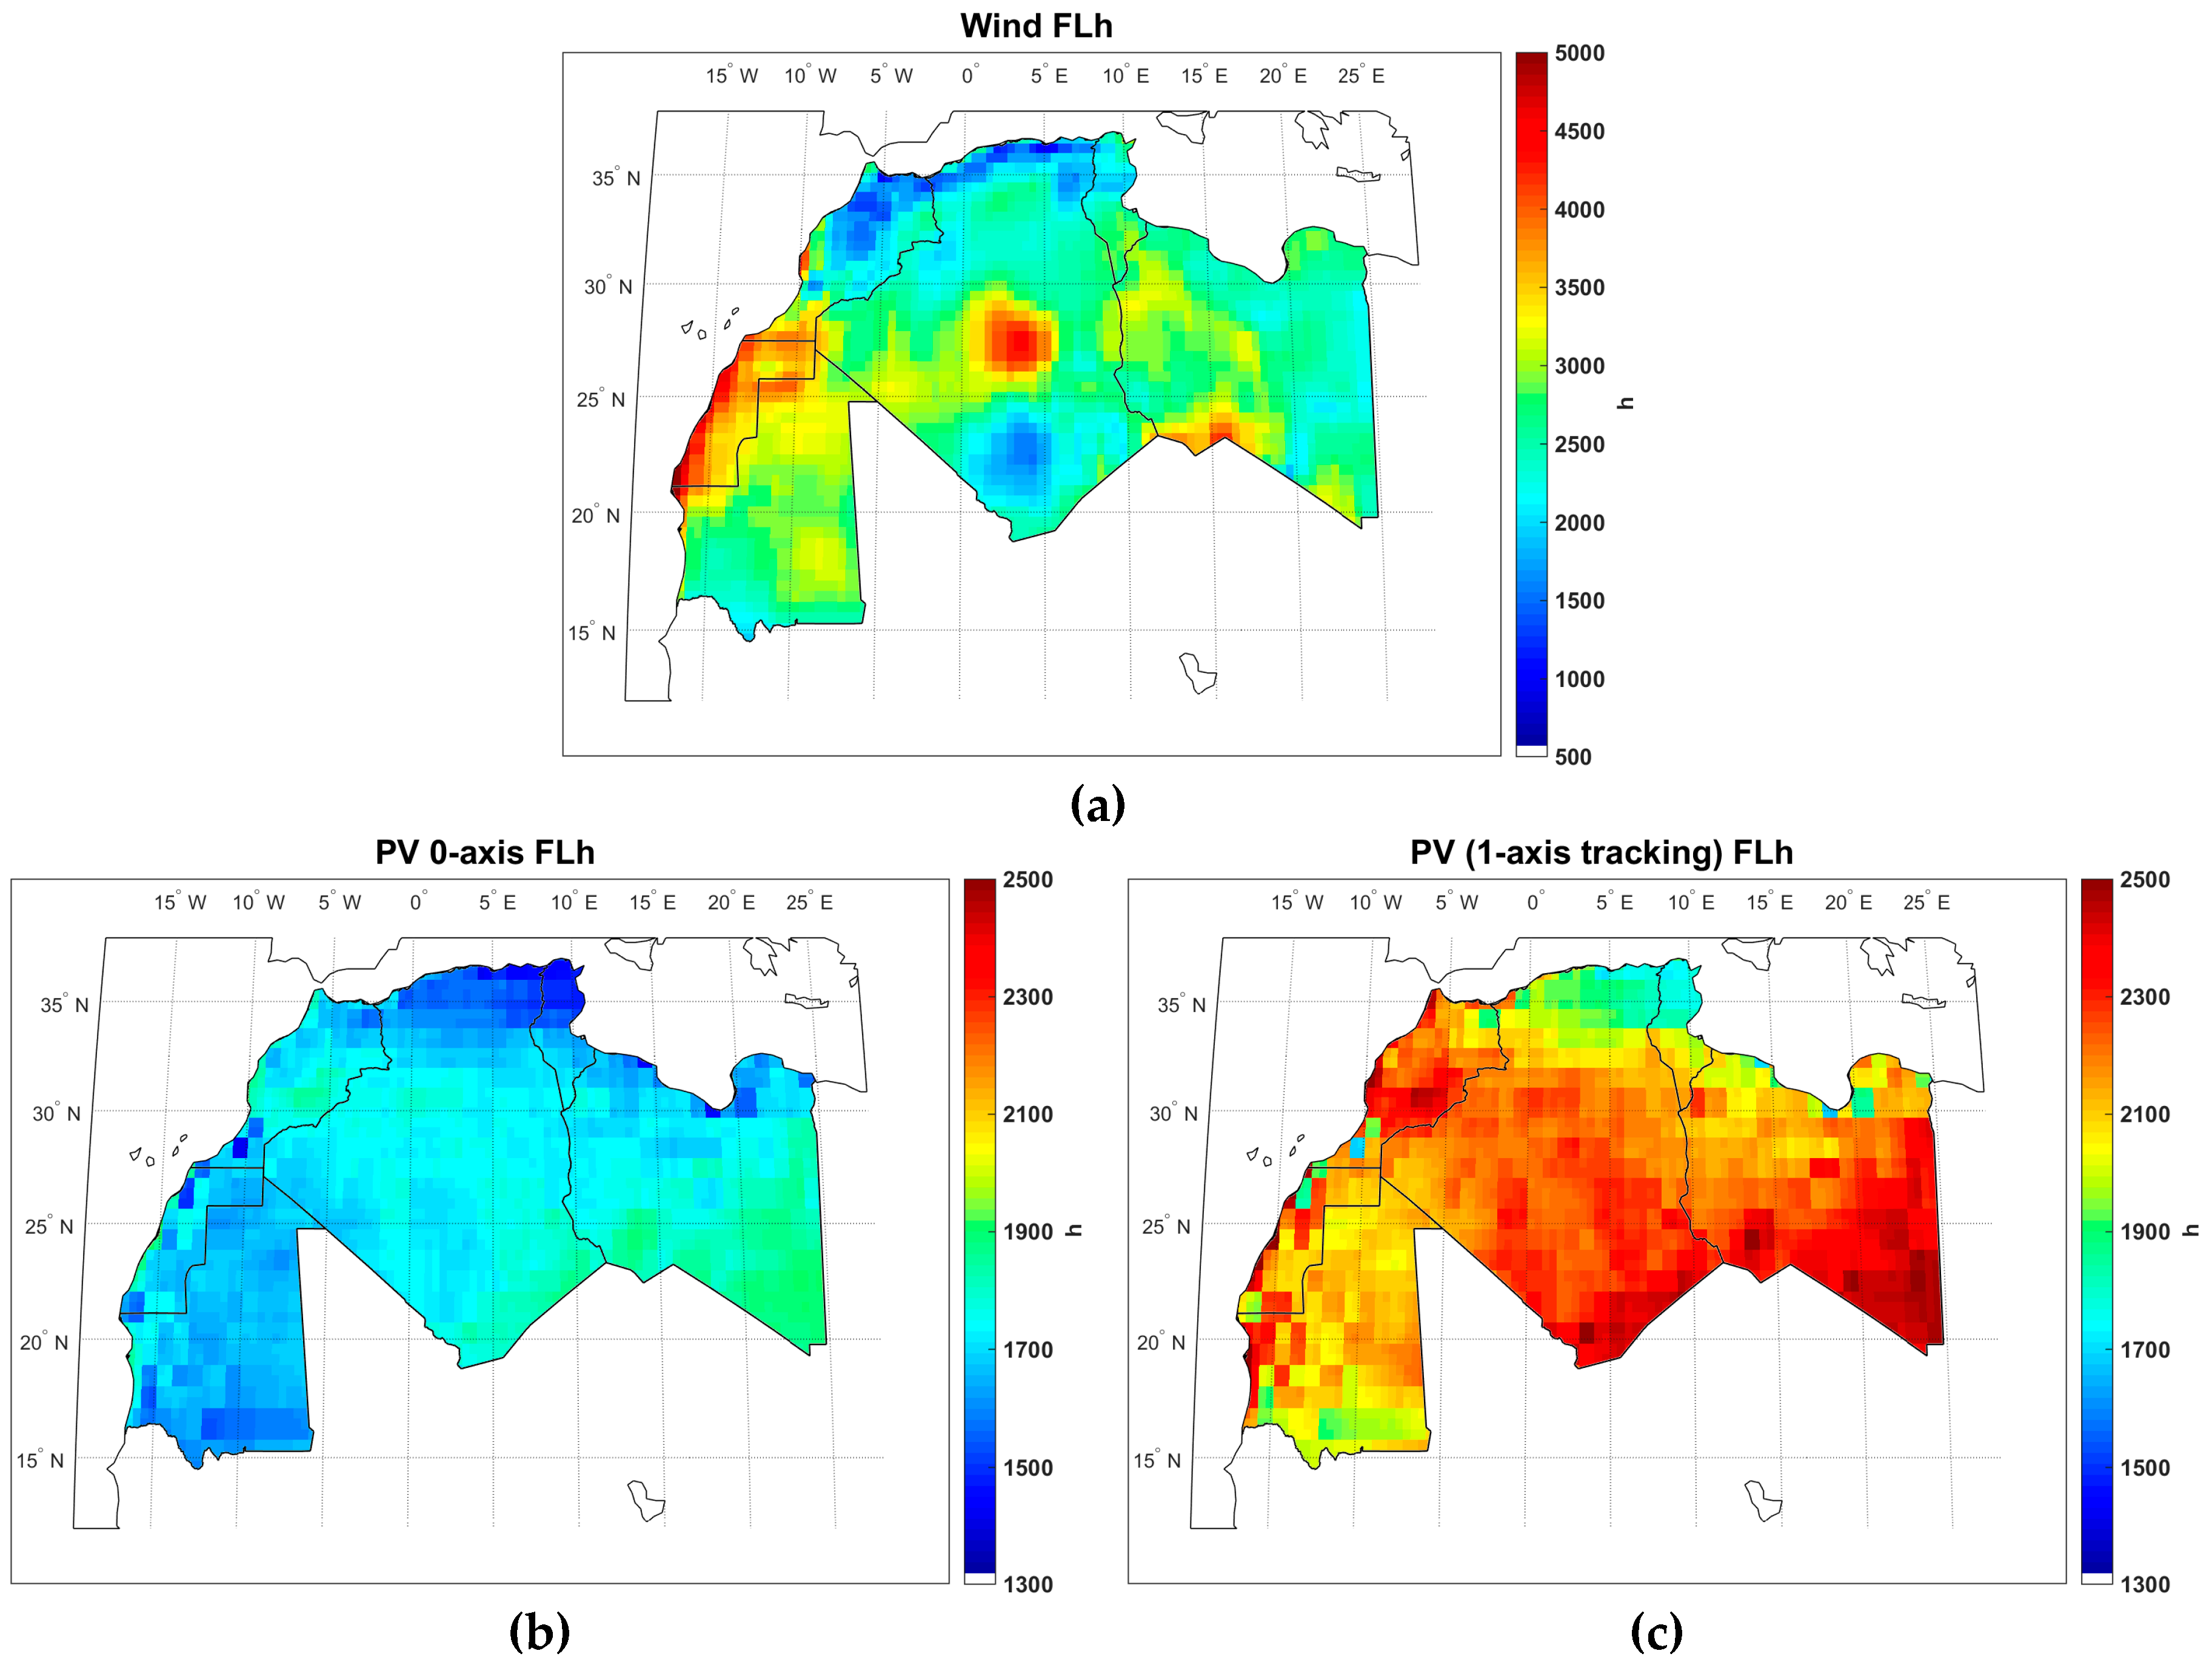
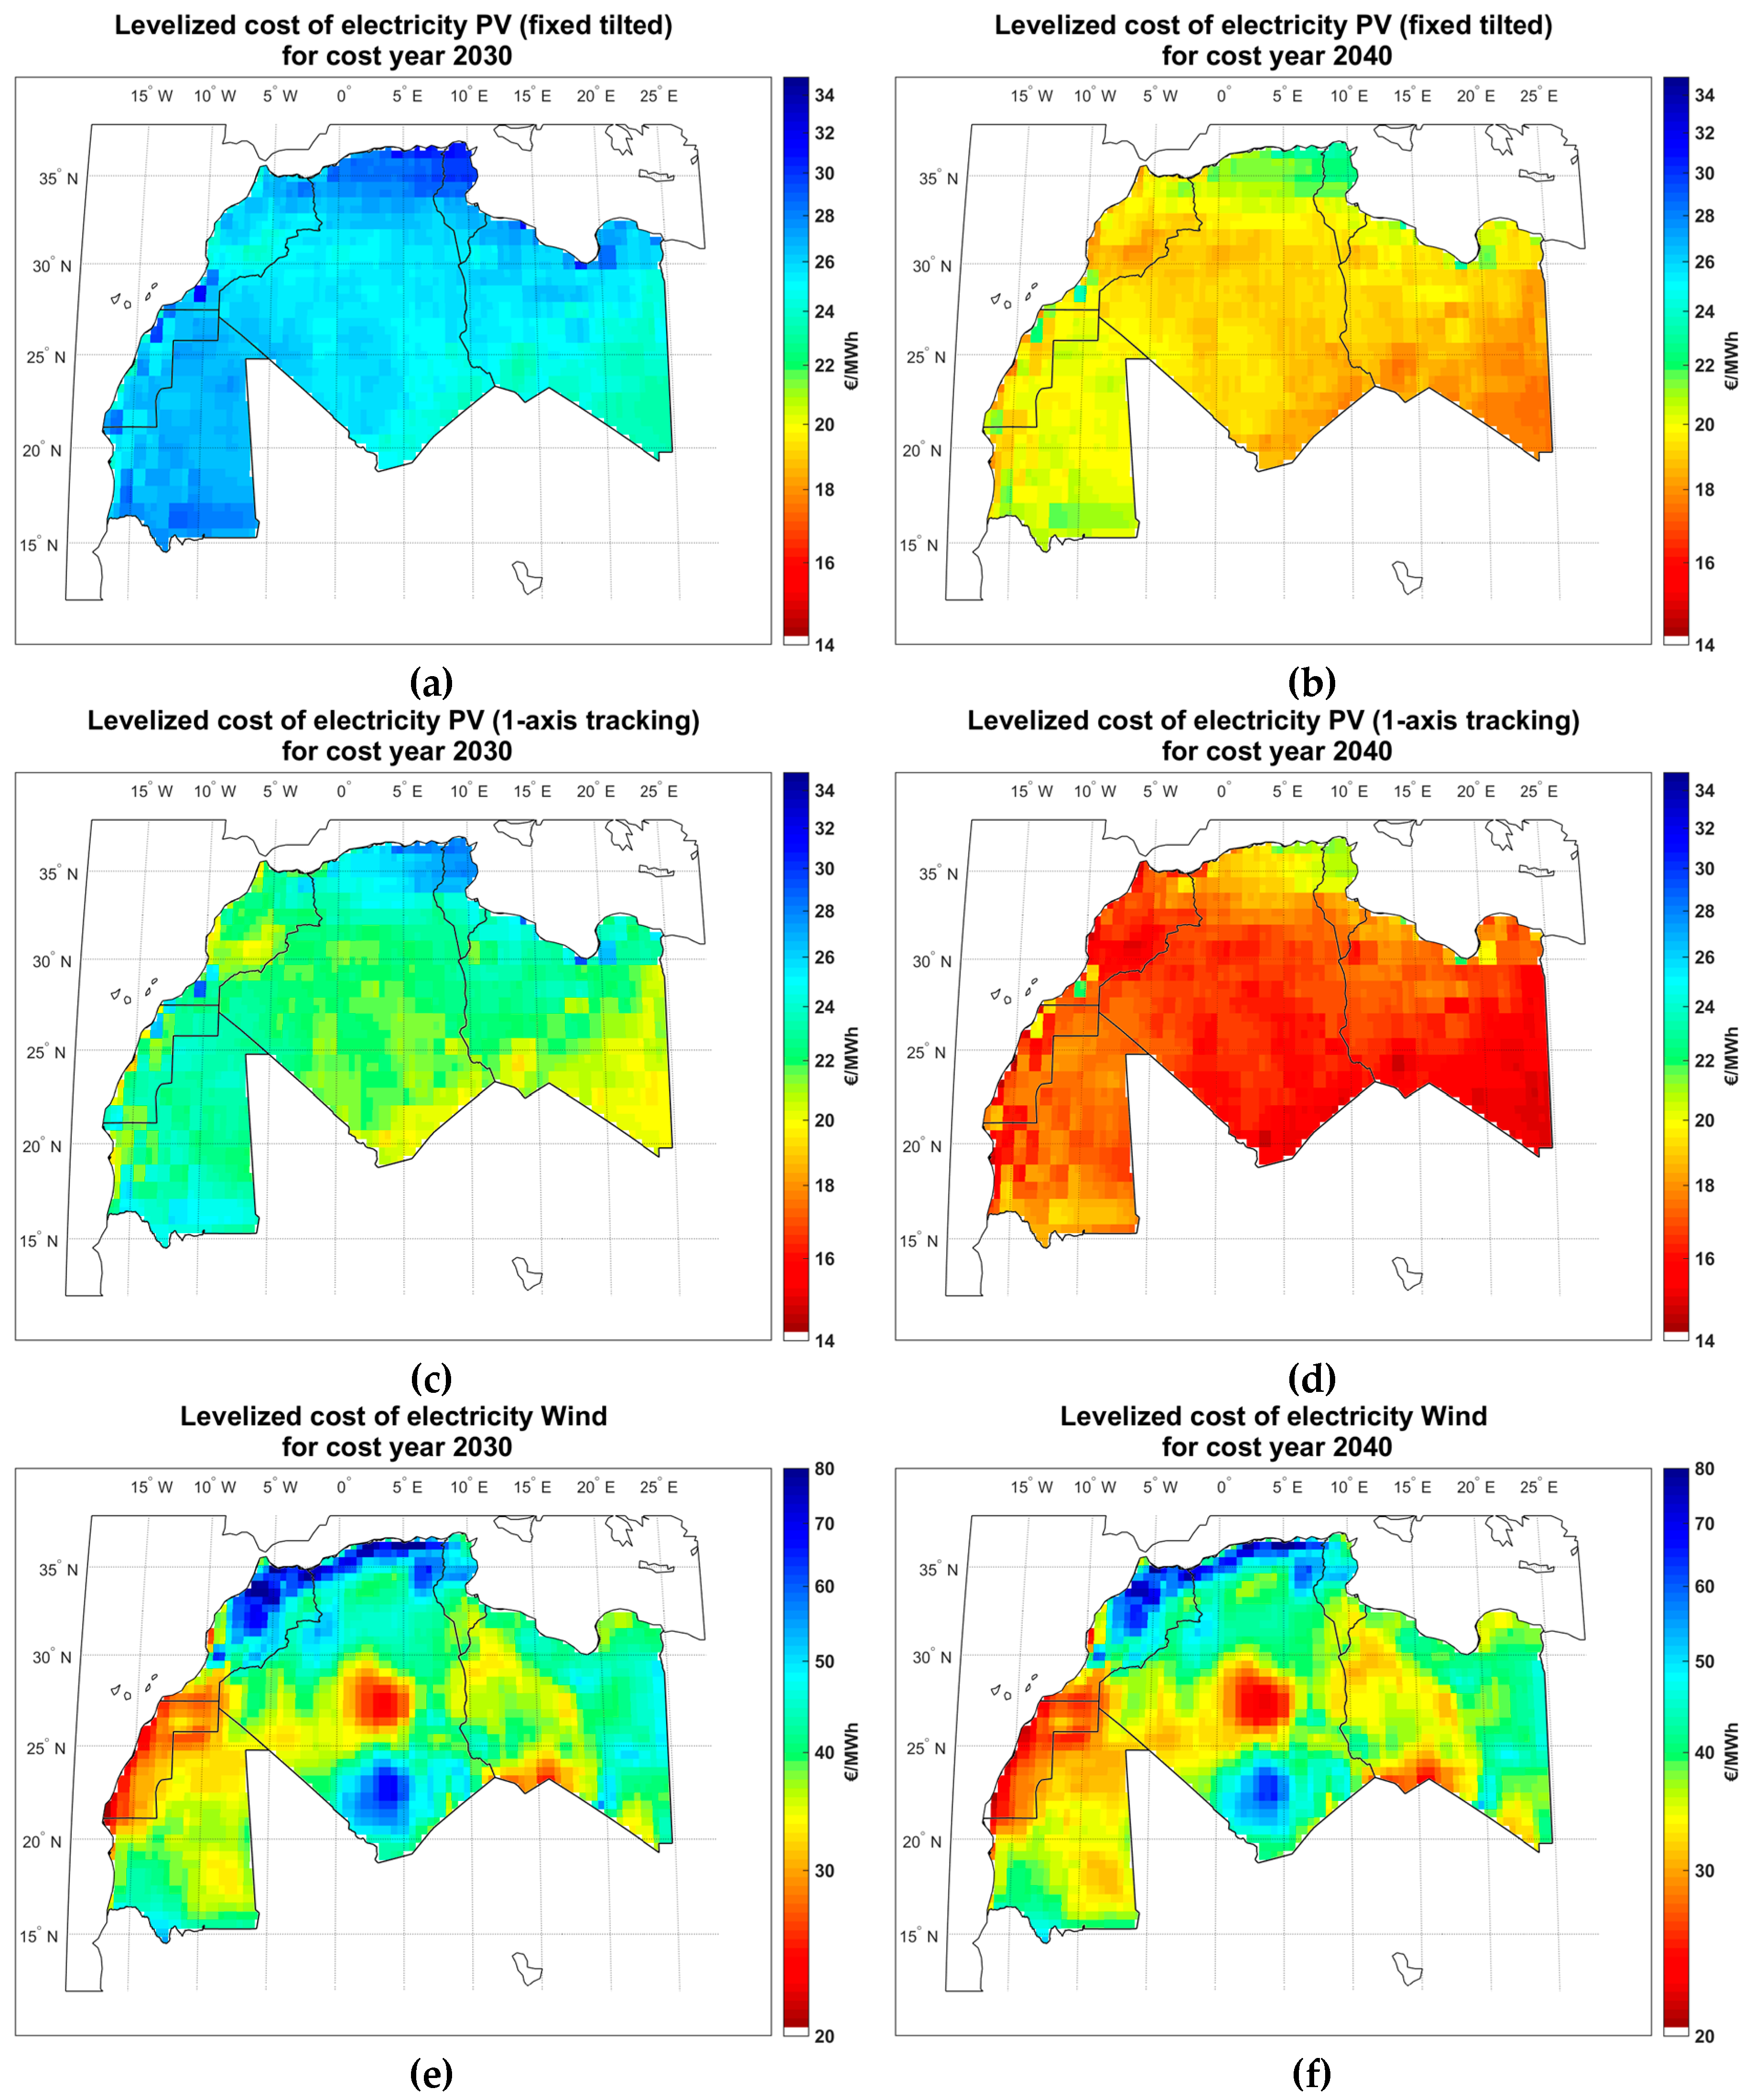
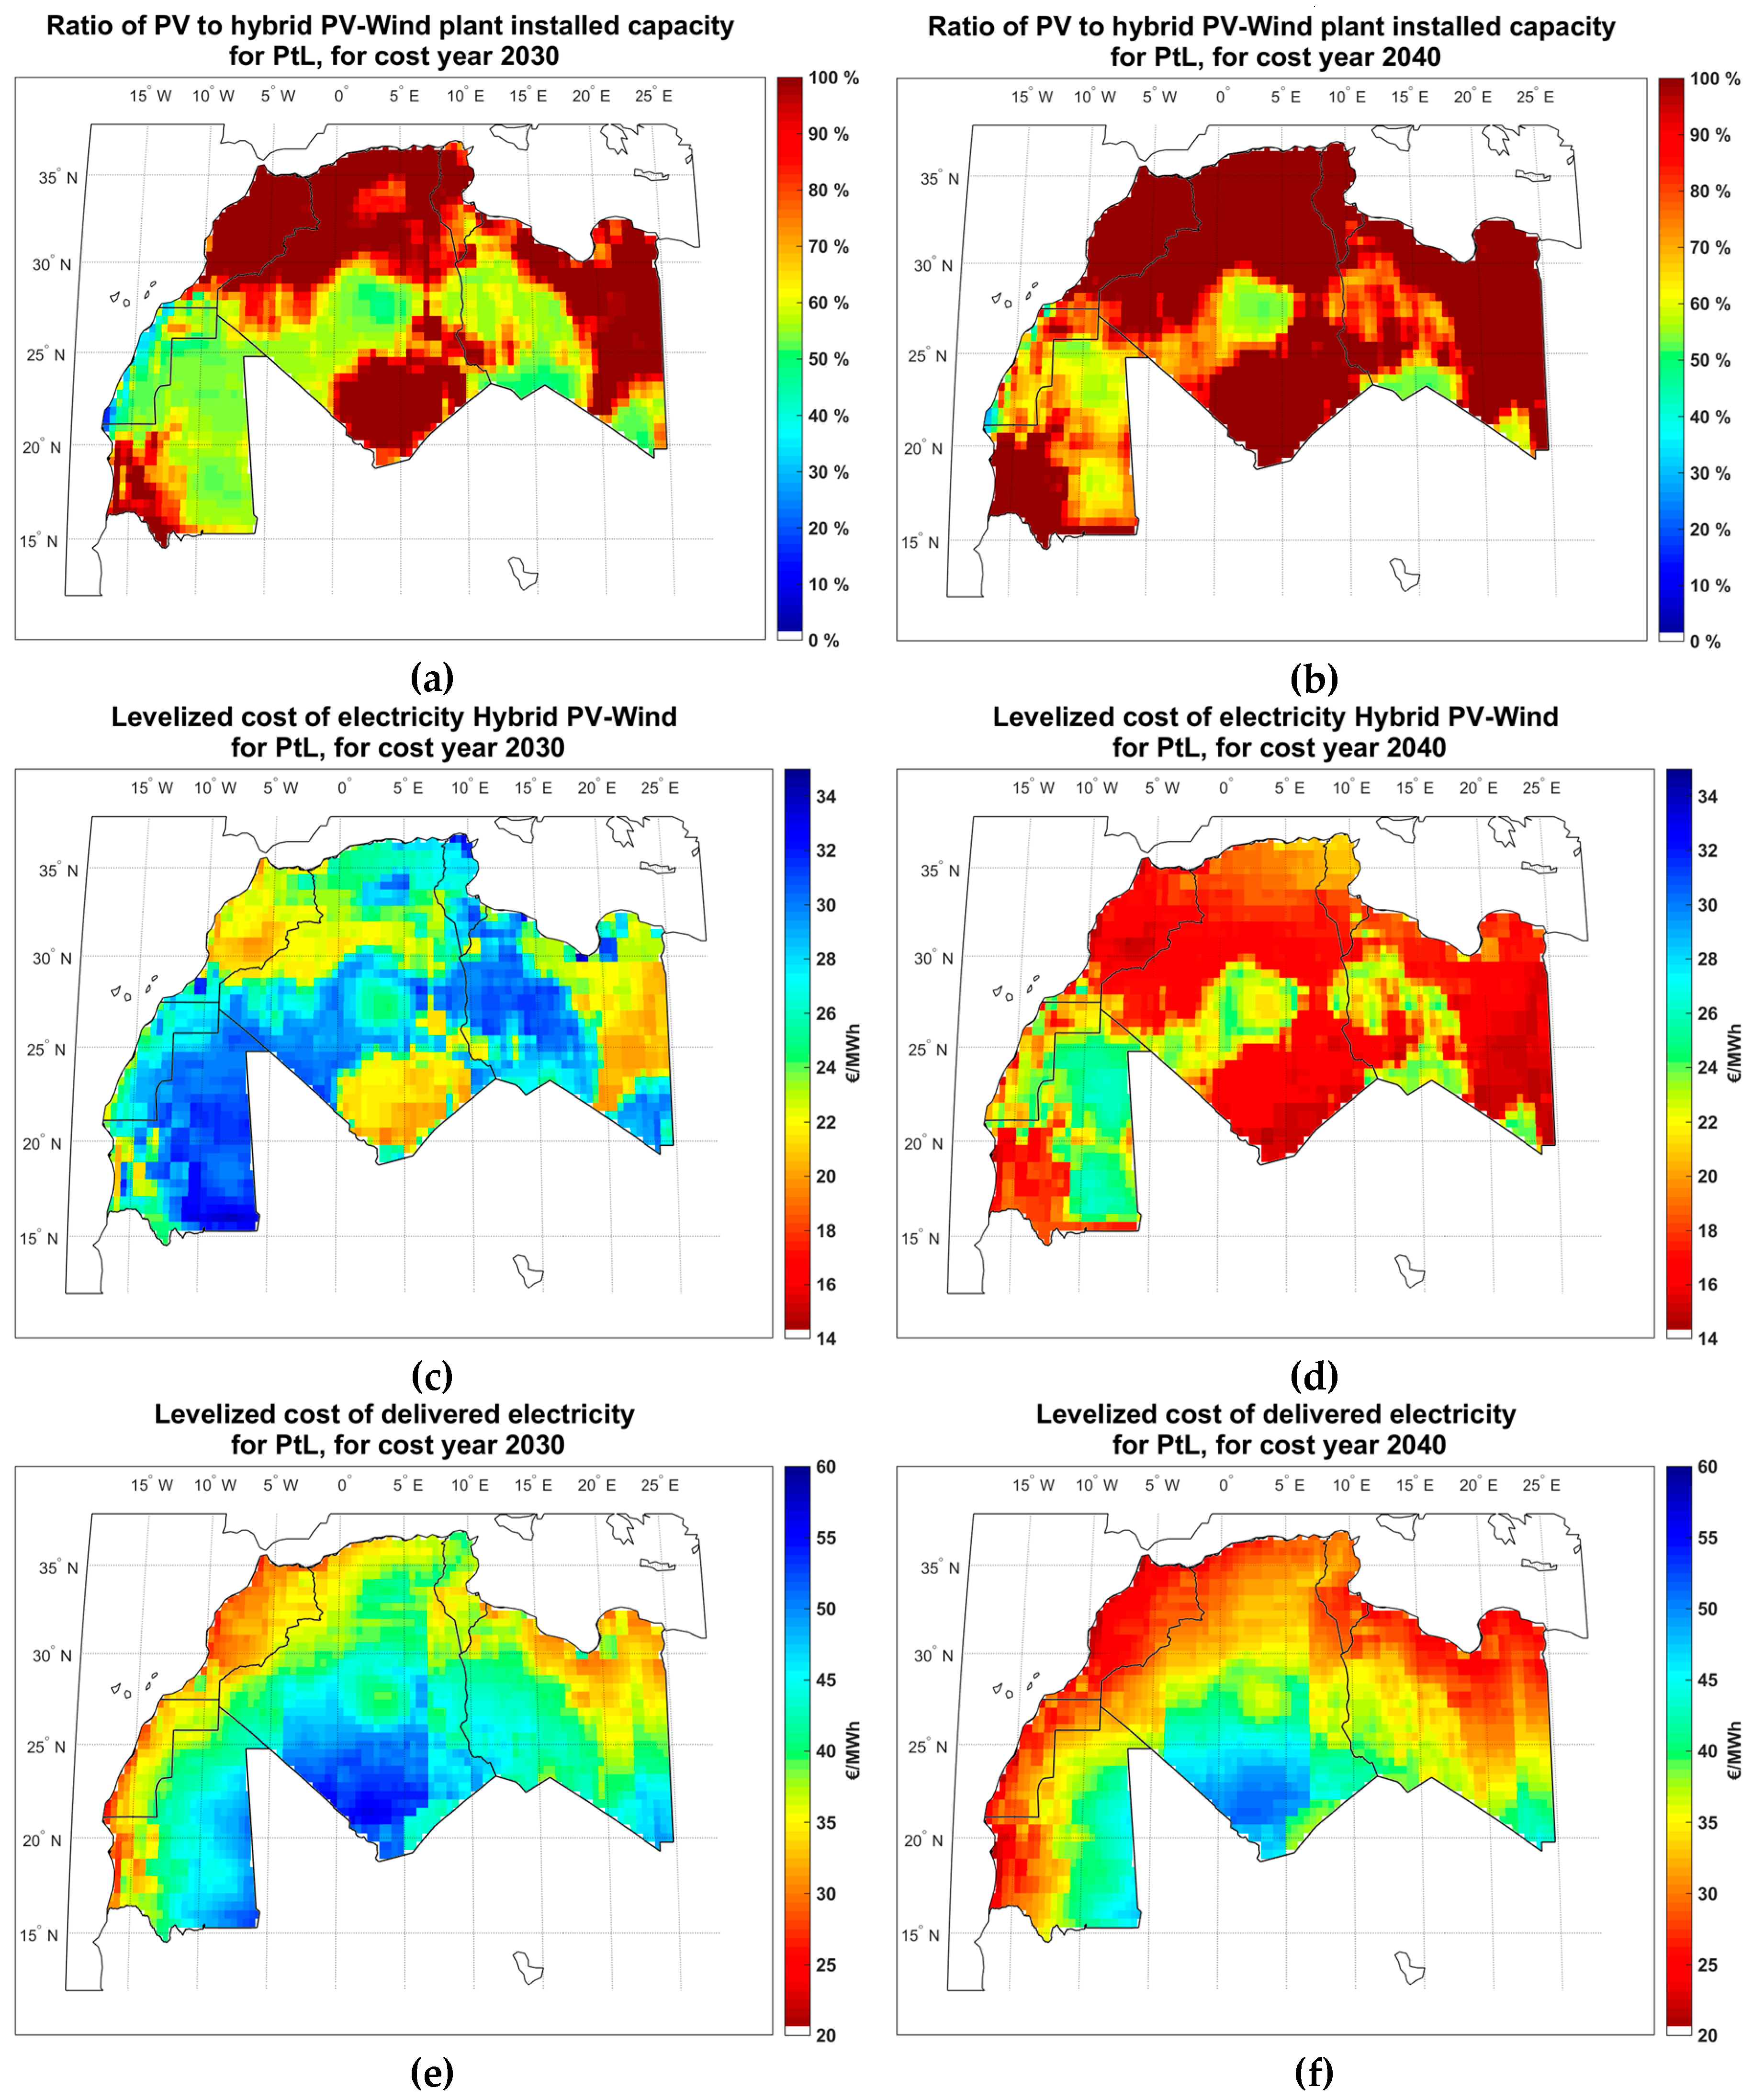
3.2. Hybrid PV–Wind FLh and Levelized Cost of Electricity
FLh have a major role in the final product cost. High FLh of hybrid PV–Wind power plants result in cost reduced downstream processes such as PtG, PtL, seawater desalination and CO2 direct air capture. The FLh of fixed tilted PV, single-axis tracking PV and wind are shown in Figure 7. The single-axis PV FLh are about 400 hours more than fixed tilted PV in most parts of the Maghreb region. Wind FLh could be much higher, but it shows a wider range. With 4800 FLh and 4000 FLh, Western Sahara and Central Algeria have the best wind potentials, respectively. The cumulative FLh of PV and wind reaches 7000 FLh in these regions (Figure 4), which seems a perfect place for power generation. However, the longer distance of Central Algeria to the coast and the corresponding transmission line cost is a negative factor for that region.
Figure 7.
Wind FLh (a); PV fixed tilted FLh (b); and PV single-axis tracking FLh (c).
Besides FLh, the LCOE has a key role in the cost of synthetic fuels. Figure 8 shows the Maghreb region’s electricity production cost of fixed tilted and single-axis tracking PV systems and wind energy in 2030 and 2040. The minimum production cost of single-axis tracking PV in 2030 would be 20 €/MWh, which would drop down to about 15 €/MWh in 2040, and would be cheaper than fixed tilted PV. The minimum wind electricity generation cost with 2030 technology would be 22–25 €/MWh, but, unlike PV, it is limited to Western Sahara and Central Algeria.
Figure 8.
LCOE of fixed tilted PV in 2030 (a) and 2040 (b); single-axis tracking PV in 2030 (c) and 2040 (d); and wind in 2030 (e) and 2040 (f).
A different configuration of PtG and PtL plant results in a slightly different optimal combination of PV and Wind. Figure 9 shows the share of installed capacity of single-axis tracking PV in the optimal hybrid PV–Wind power plant configuration and the corresponding hybrid system LCOE for the PtL system in 2030 and 2040. Due to lower FLh and higher LCOE, fixed tilted PV is not installed in the model. The figure indicates that PV would be the dominating installed technology in the cost optimal system in 2030 for most regions, except Western Sahara. Due to continued decrease in PV Capex, a higher share of PV is installed for the year 2040. The minimum hybrid PV–Wind LCOE would be about 20 €/MWh and 15 €/MWh in 2030 and 2040, respectively. However, the minimum cost of delivered electricity to the PtL system on the coast would be about 30 €/MWh and 25 €/MWh in 2030 and 2040, respectively.
Figure 9.
Ratio of PV to hybrid PV–Wind plant installed capacity in 2030 (a) and 2040 (b); hybrid PV–Wind LCOE in 2030 (c) and 2040 (d); and levelized cost of delivered electricity in 2030 (e) and 2040 (f); for the PtL system.
Figure 10 shows that battery capacity, transmission line cost and excess electricity (overlap and curtailment) affect the amount and price of delivered electricity to the coast. Batteries can store a part of the excess electricity to balance the electricity flow as well as minimize the size and cost of electricity transmission lines and downstream PtX facilities. Modern stationary Li-ion batteries can be operated for 10,000 cycles, but batteries used in the model show up to 330 full charge cycles per year. This would be equivalent to 30 years, which is more than the calendar life assumption in this paper (20 years). The share of battery storage increases significantly from 2030 to 2040 and reaches up to 45% of the hybrid PV–Wind power installed capacity in the south of Algeria, with high distance to the sea (approximately 2000 km). The transmission line cost in most regions with a distance of up to 1000 km would not exceed 10–12 €/MWhel. For an optimal system, the percentage of excess electricity for PtL systems would be up to 15% for regions far from the coast and with a high share of wind. This would happen in a wider region in 2040, as the lower cost of electricity production makes electricity curtailment a cheaper option to balance the system.
Figure 10.
Ratio of battery to hybrid PV–Wind power plant installed capacity in 2030 (a) and 2040 (b); LCOE transmission in 2030 (c) and 2040 (d); excess electricity in percentage of generation in 2030 (e) and 2040 (f); for the PtL system.
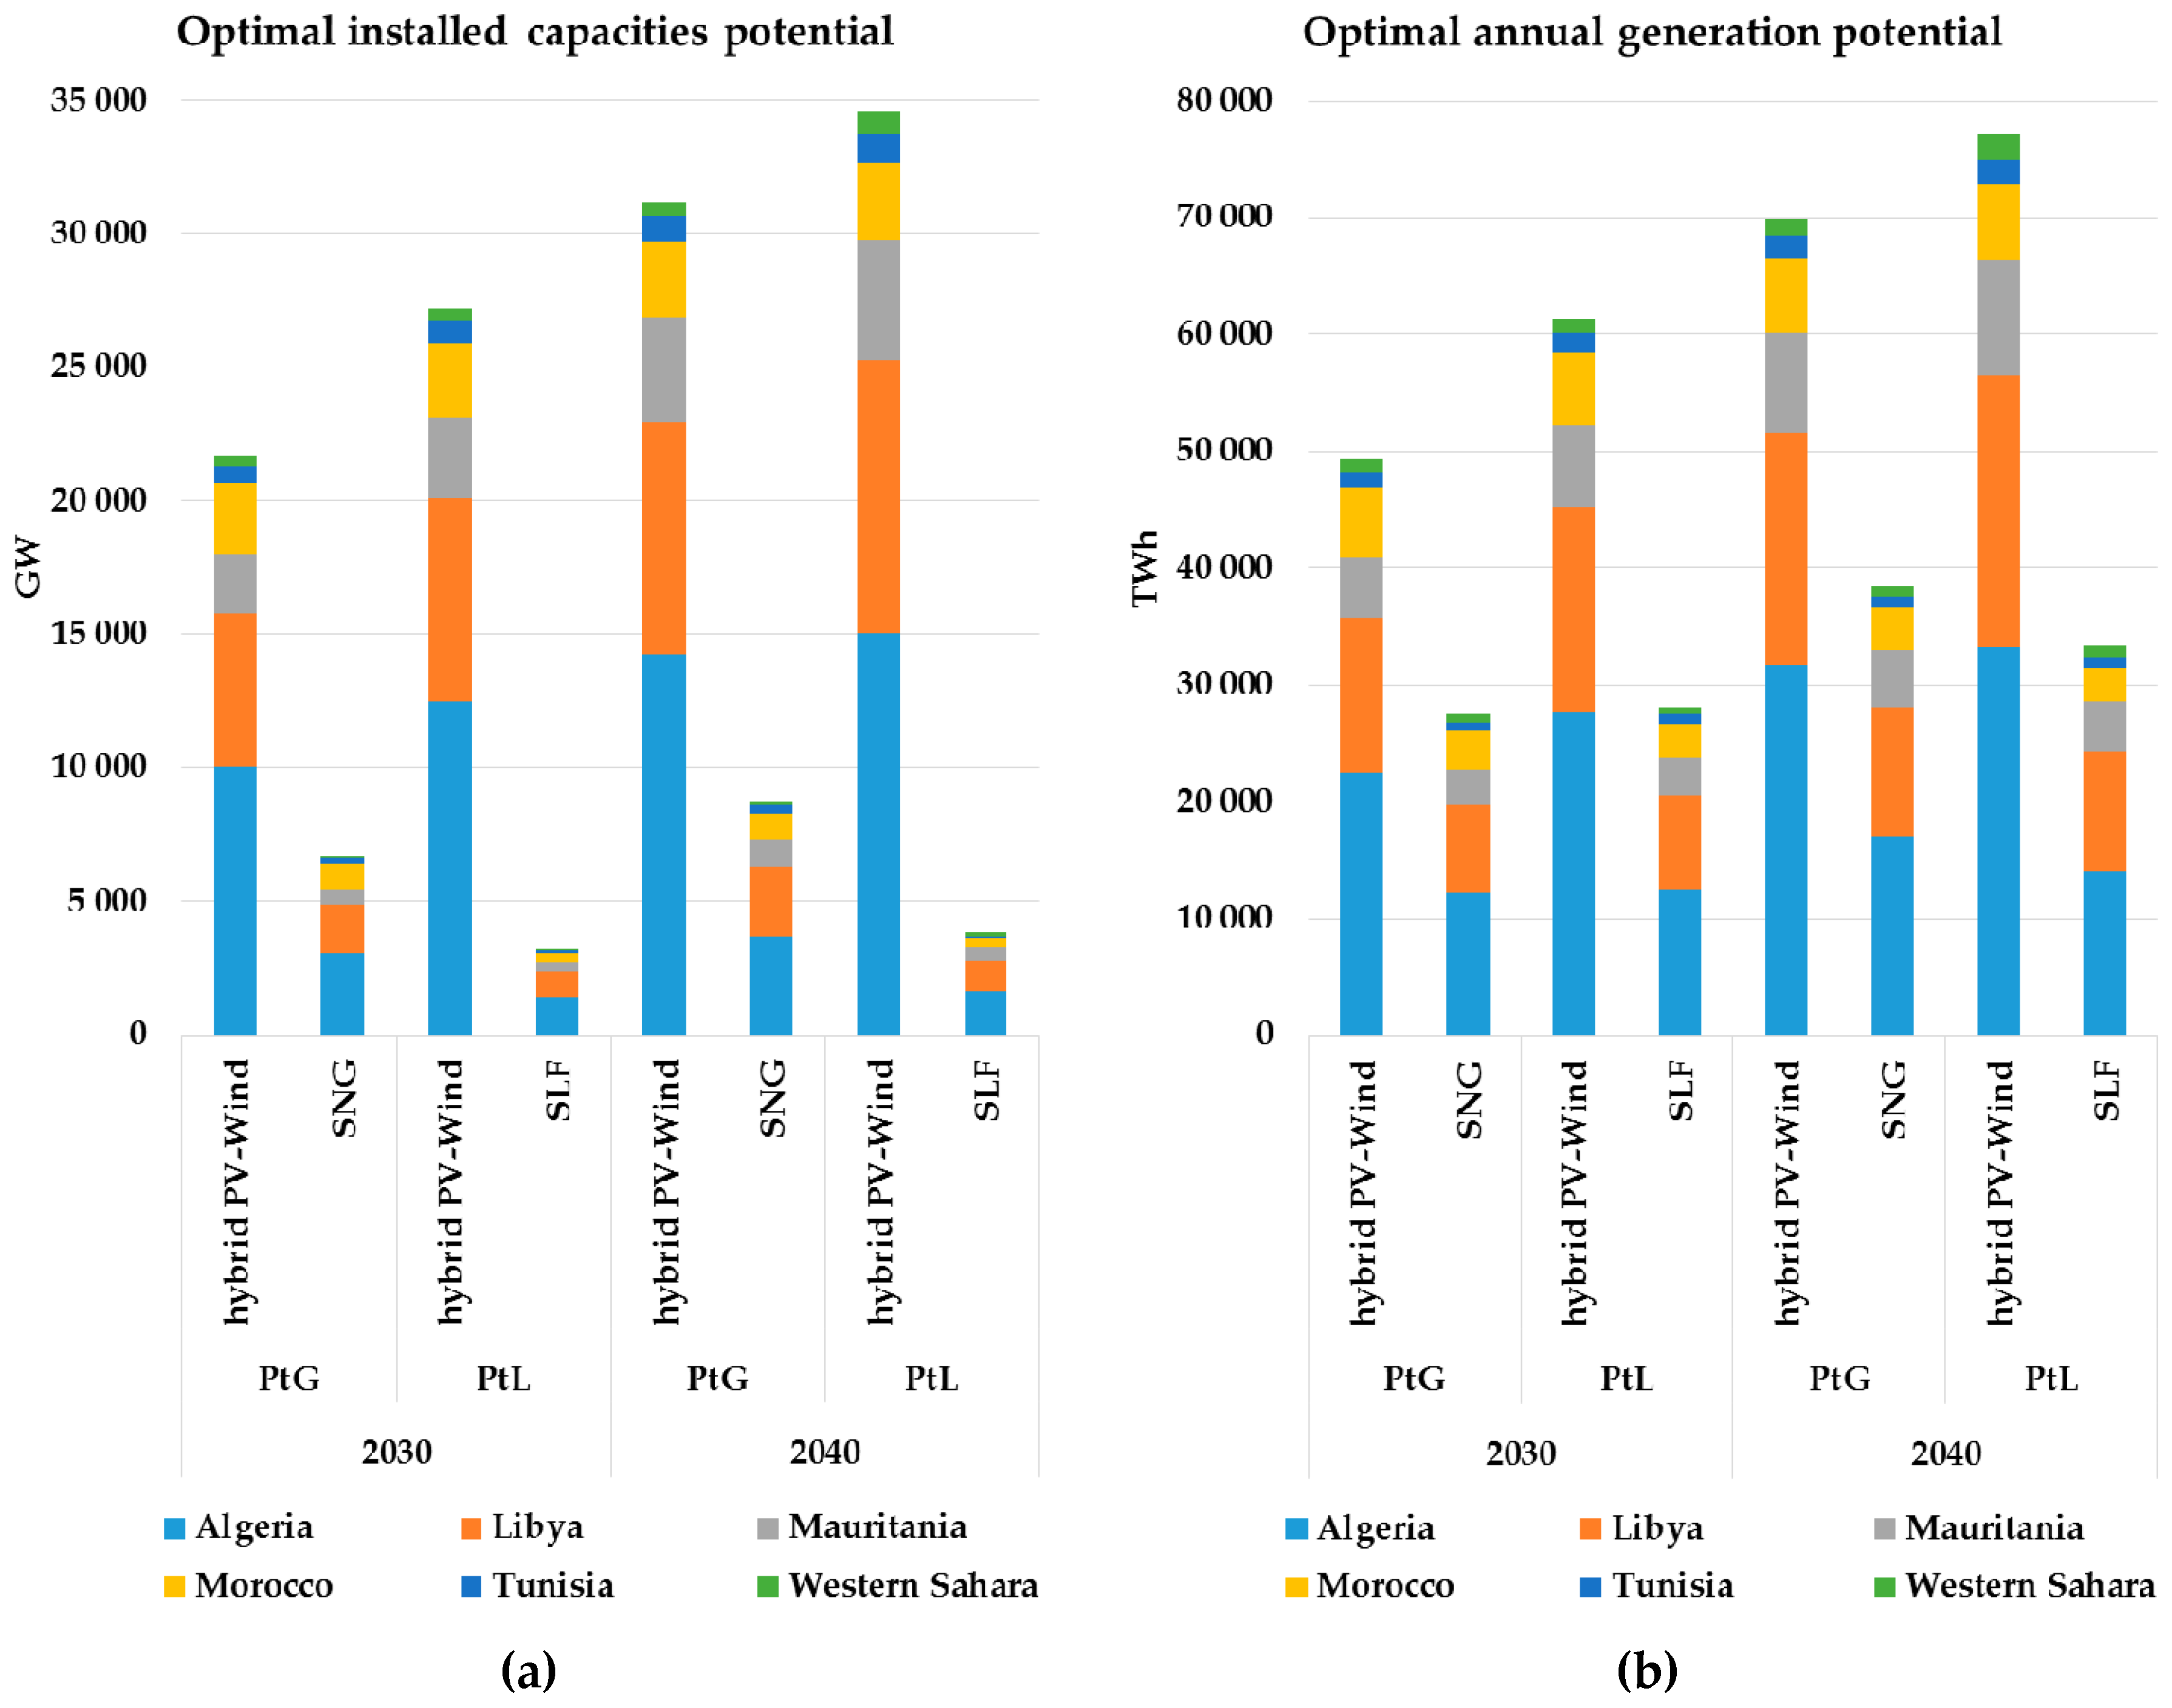
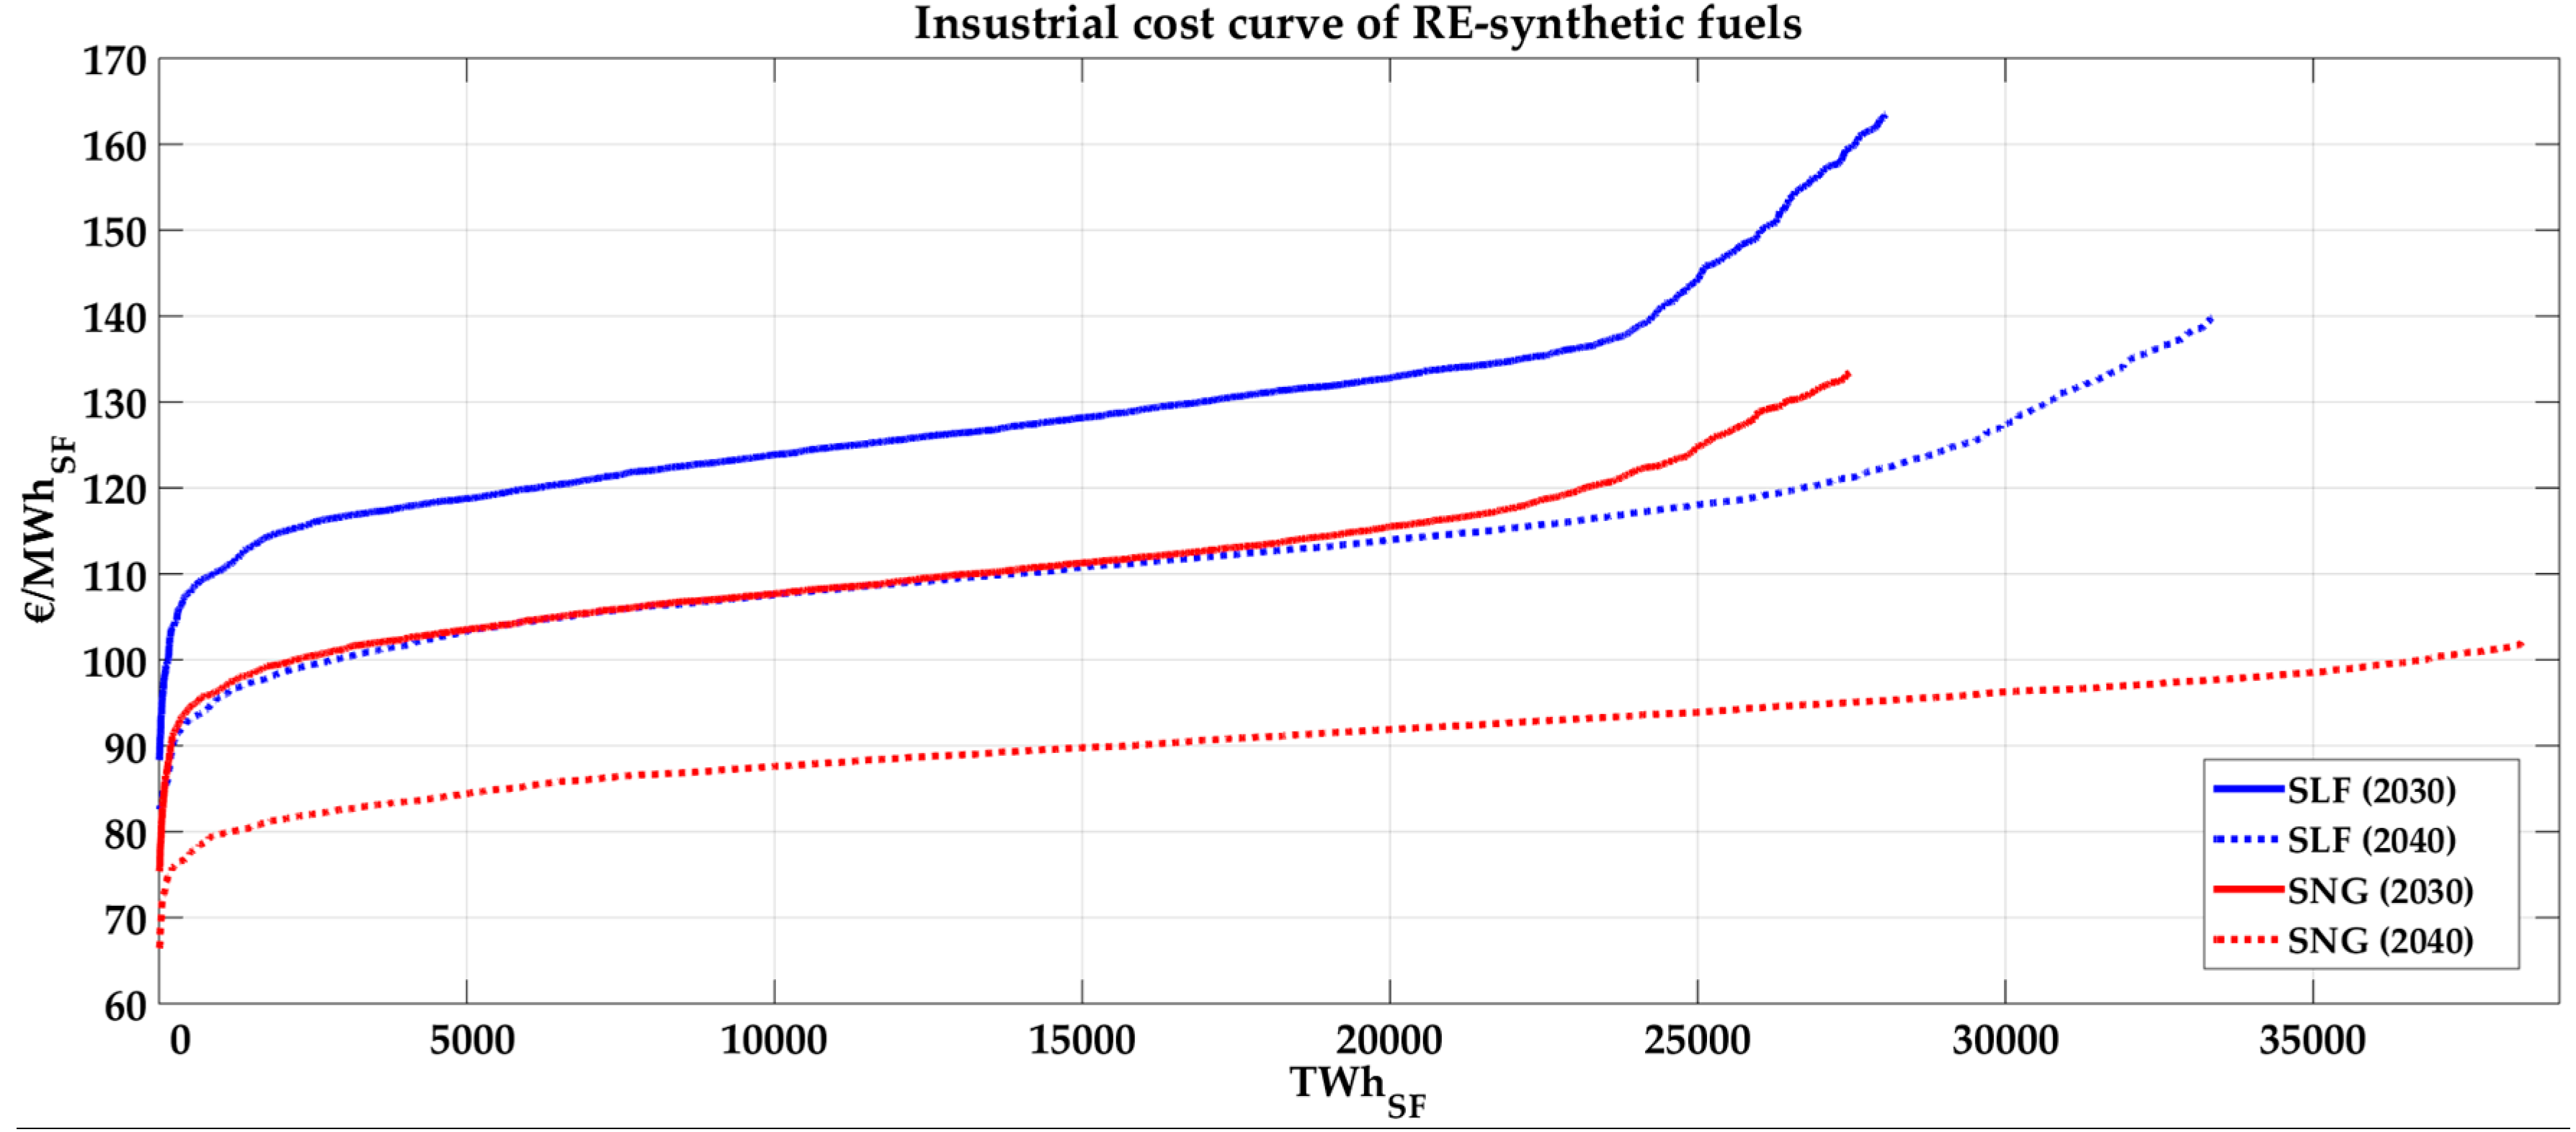
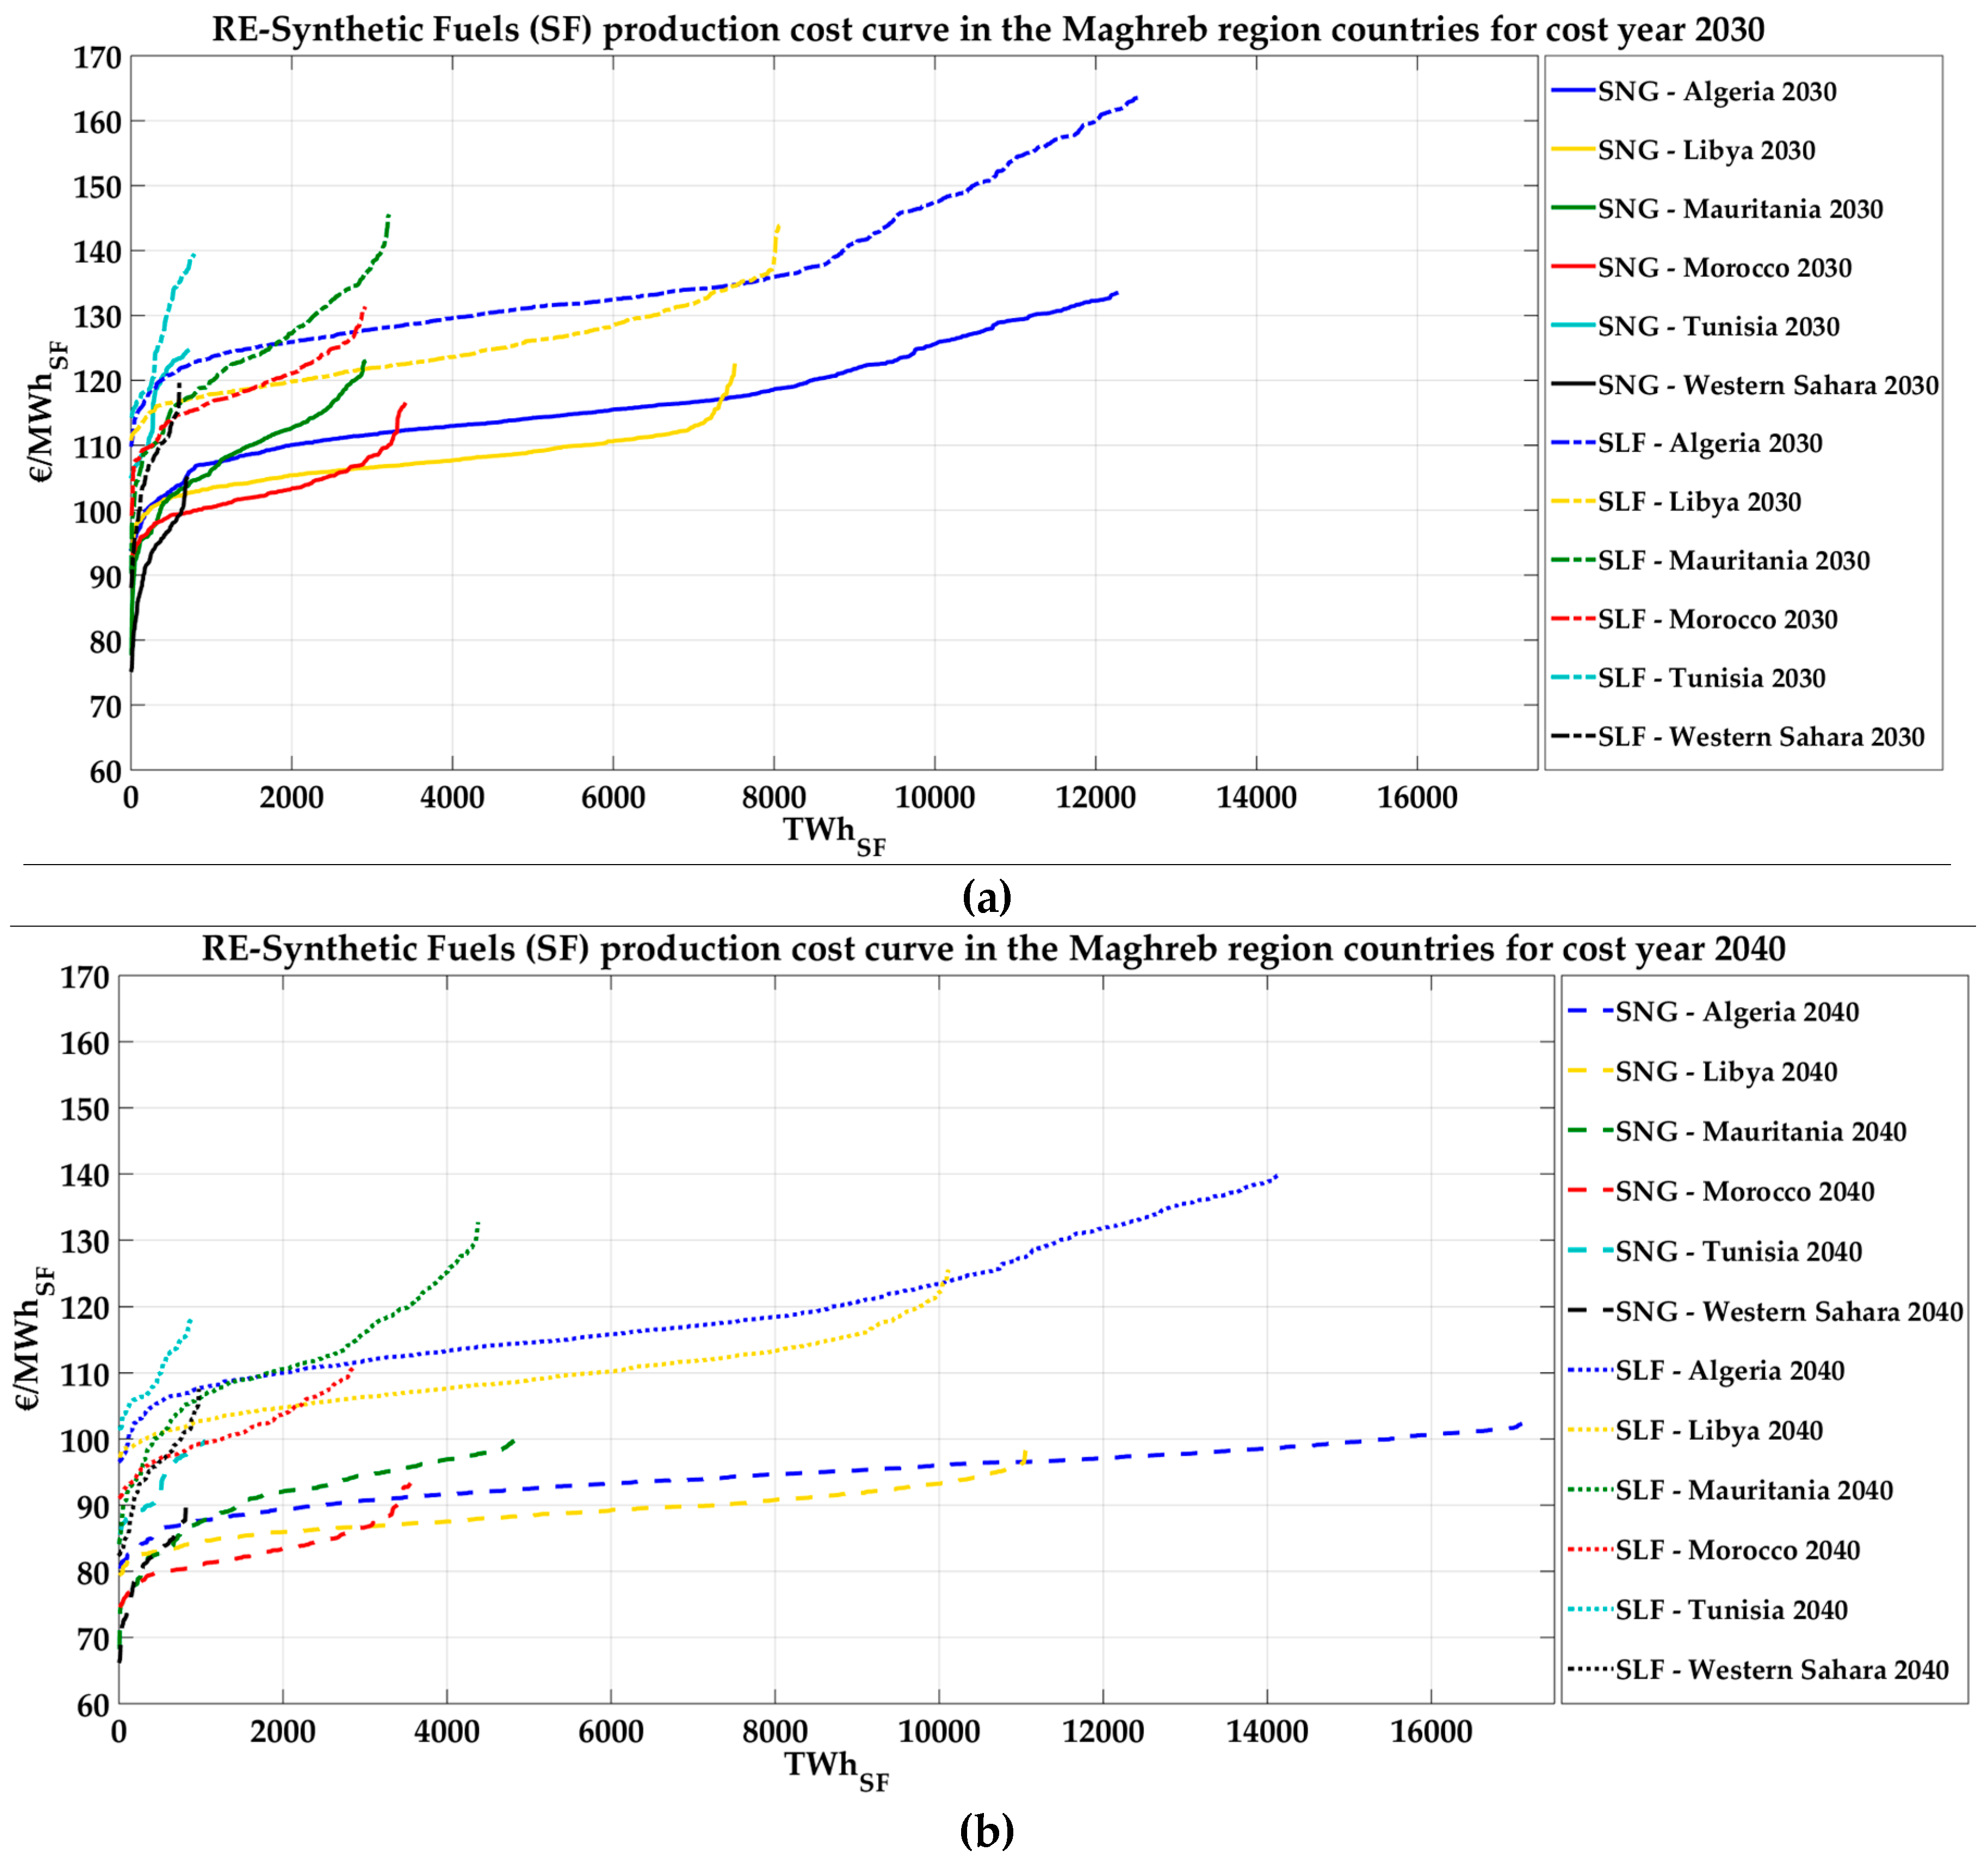
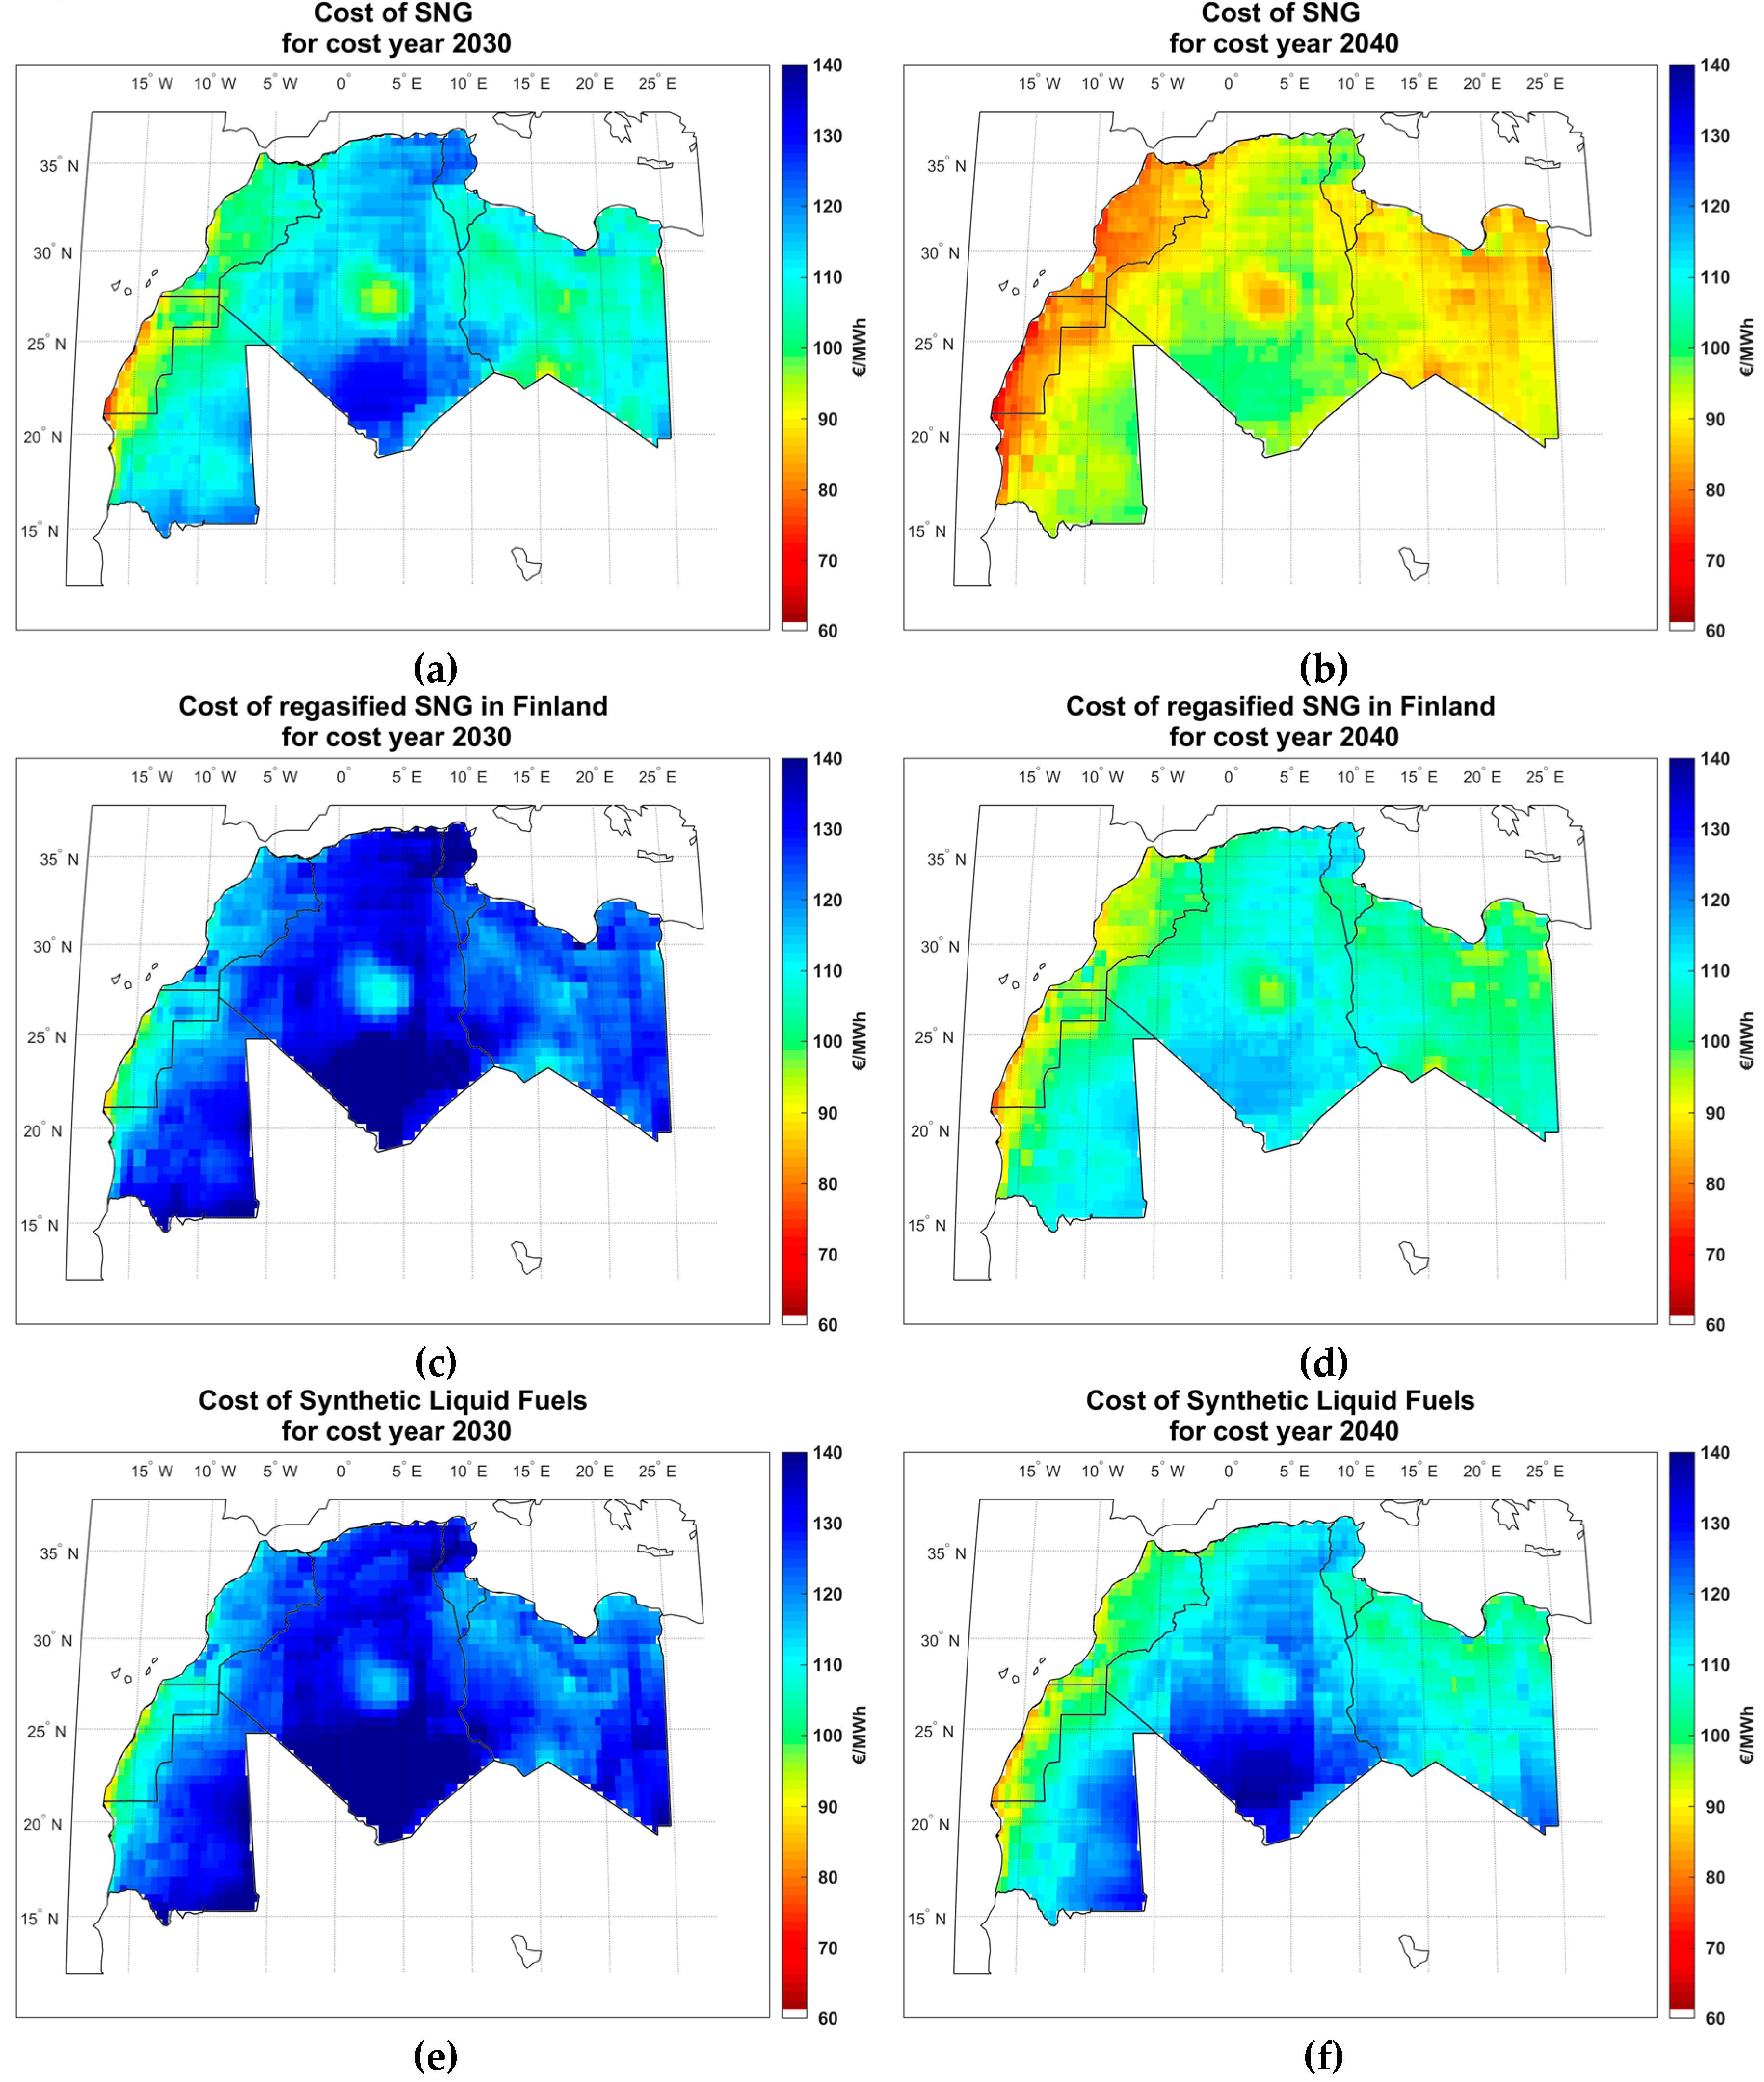
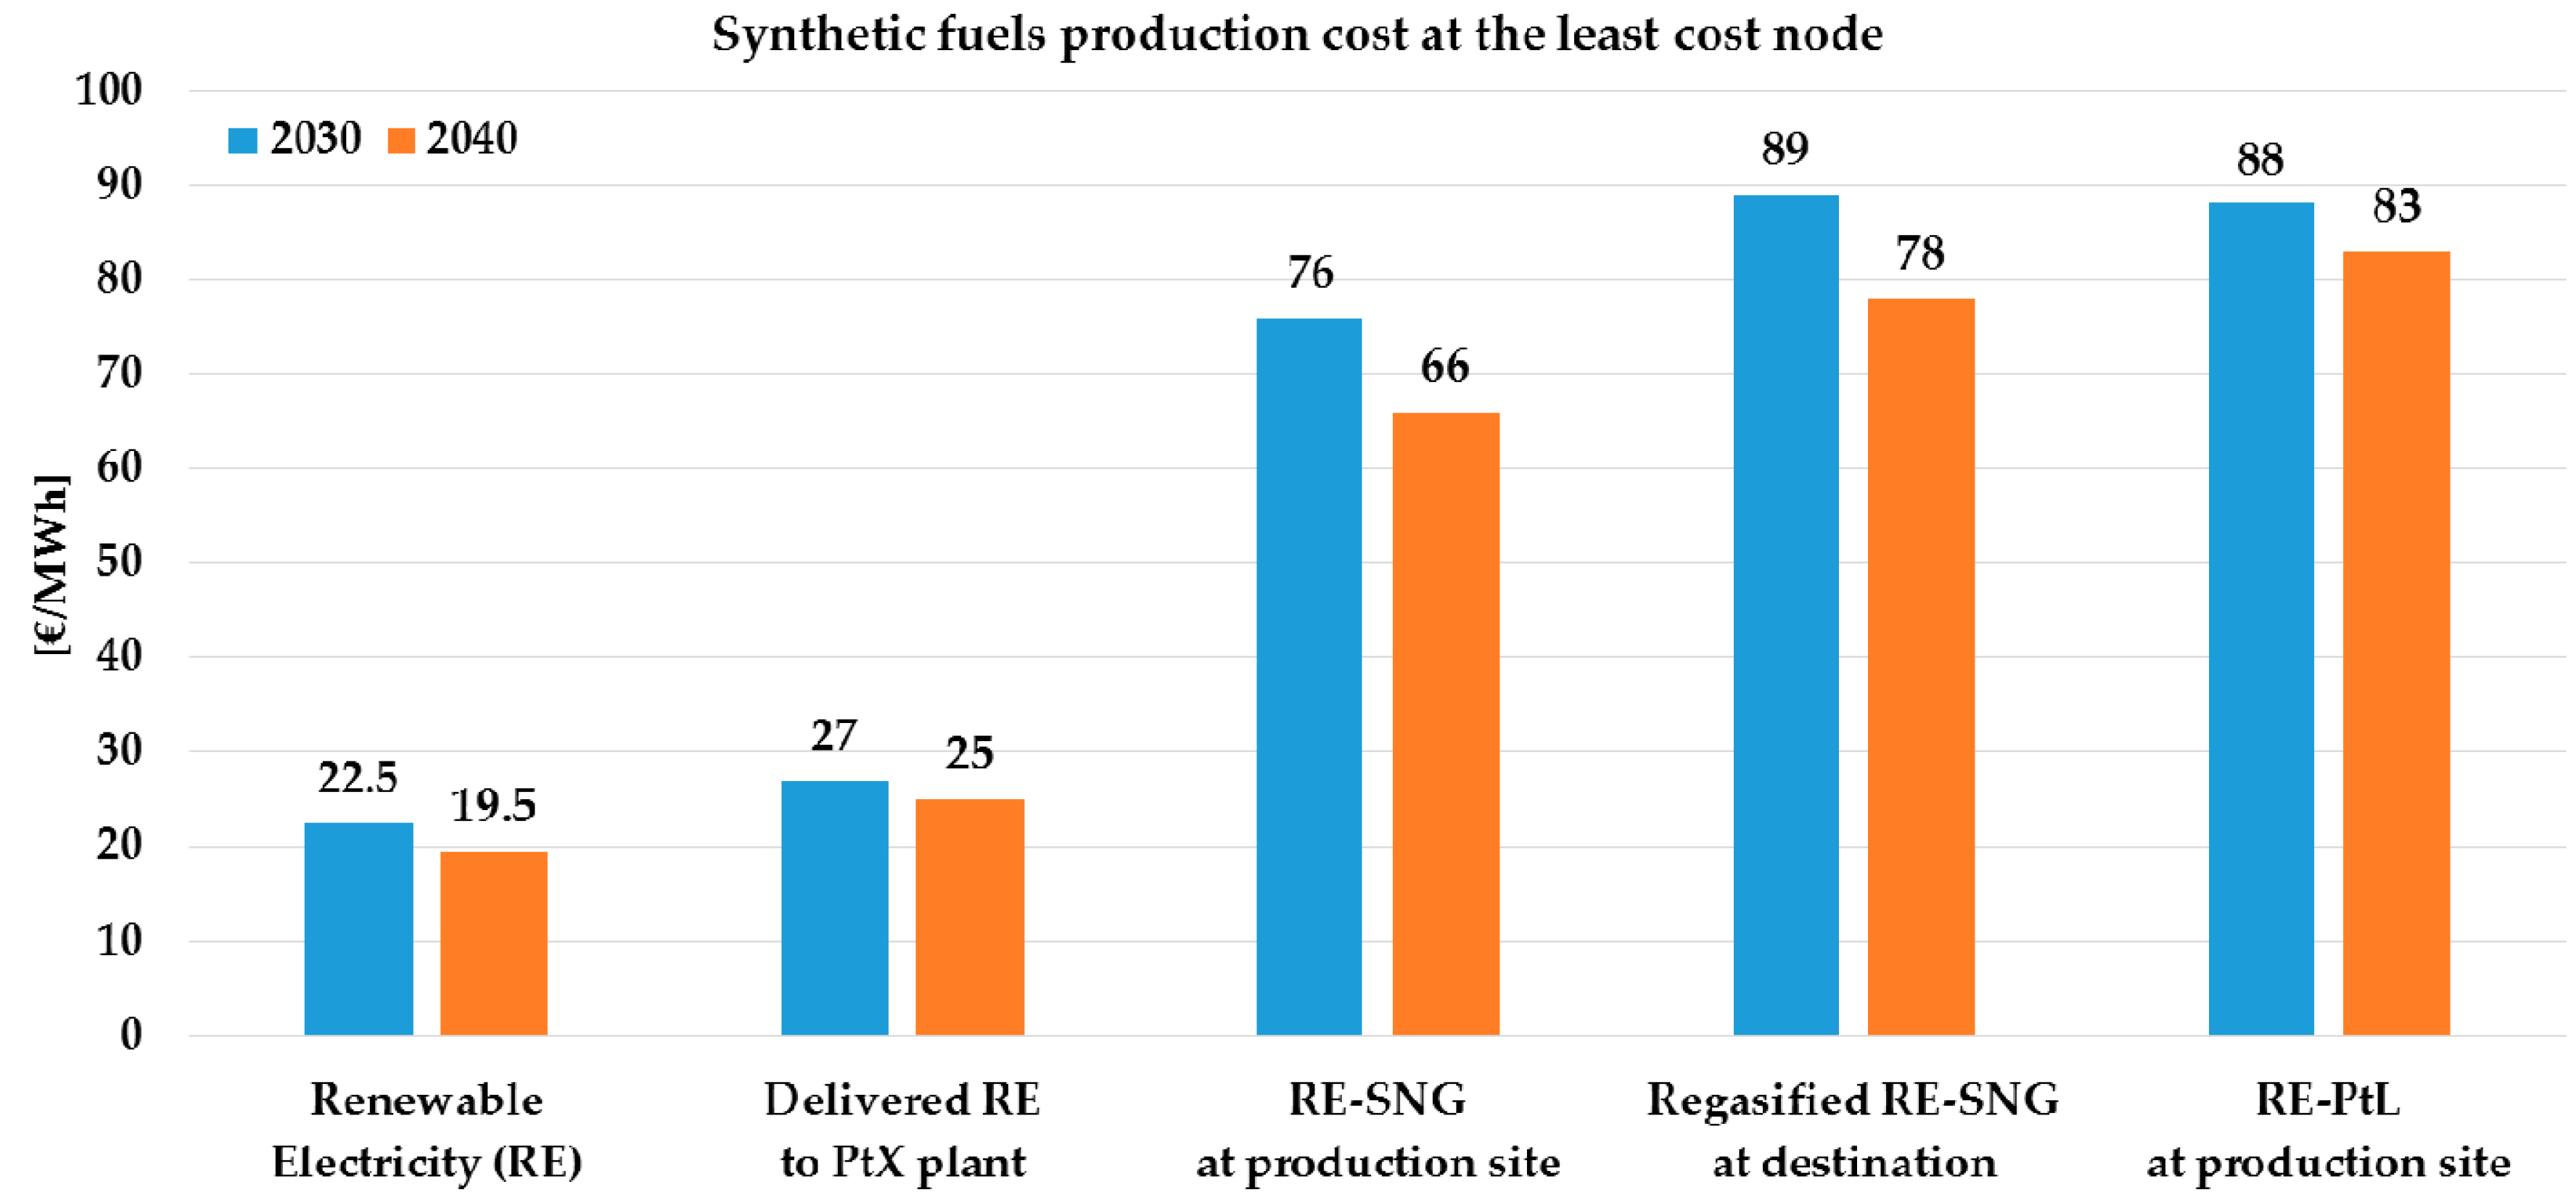
3.3. Levelized Cost and Production Potential of Synthetic Fuels
The price and FLh of delivered electricity to the PtX plants will result in SNG, regasified SNG (in Finland) and synthetic liquid fuels (SLF) costs, illustrated in Figure 11. In 2030, the cheapest SNG could be generated in Western Sahara, along the coast, while the area for the cheapest SNG expands to Morocco, Libya and some parts of Mauritania in 2040. The cost difference between SNG and regasified SNG stands for the LNG value chain. This will make regasified SNG as expensive as SLF in 2030, while in 2040 regasified SNG would be cheaper in most regions and SLF shows a wider cost range.
Figure 11.
Cost of SNG in 2030 (a) and 2040 (b); cost of regasified SNG in Finland in 2030 (c) and 2040 (d); and cost of synthetic liquid fuels in 2030 (e) and 2040 (f).
A summary of the electricity and synthetic fuel generation costs at the least cost node, located in Western Sahara, has been illustrated in Figure 12. The electricity generation cost at this node is not the cheapest one, but due to a higher share of wind and, consequently FLh, this leads to the cheapest synthetic fuel generation cost. With a minimum production cost of 88 €/MWhth,HHV (0.85 €/L), RE-diesel production cost is about 16% higher than SNG, but it would be cheaper than regasified SNG. For a SNG production cost of 80 €/MWhth,HHV (0.66 €/m3SNG), the LNG value chain would cost 13 €/MWhth,HHV, while this increases to 15 €/MWhth,HHV for a SNG price of 100 €/MWhth,HHV (1.03 €/m3SNG), due to the higher cost of efficiency losses. The SNG and SLF production costs decrease by about 13% and 5%, respectively, from 2030 to 2040. The sharper decrease in SNG production cost is due to a sharper decrease in the Capex projected for the PtG system and a sharper increase in the FLh of the PtG system.
Figure 12.
RE and synthetic fuels production cost (based on HHV) at the least cost node for the base scenario in 2030 and 2040.
The optimal sample case can be scaled up to generate more electricity and, consequently, synthetic fuels. A maximum 10% of land is allowed for PV and wind installation. The data for the optimal installed capacity and generation potential of hybrid PV–Wind, PtG and PtL plants in 2030 and 2040 is shown in Table 5 and has been visualized in Figure 13. Algeria and Libya comprise 73% of total installed capacity and generation potential of all technologies and fuels in the Maghreb region. In addition to the size of the country, hybrid PV–Wind installed capacity is a factor of the ratio of installed technologies, as the installed capacity potential of PV is 8.9 times bigger than a wind power plant in the same area. This is the reason for lower hybrid PV–Wind installed capacity for PtG than PtL in the same country and the same year. An optimized PtG system needs to operate on higher FLh than a PtL system, thus more wind power capacity would be installed which reaches its area limit at a lower installed capacity. From 2030 to 2040, there would be an increase in the total installed capacity of hybrid PV–Wind power plants, which is due to an increase in the share of PV (Figure 9).
Table 5.
Optimal installed capacity and production potential of hybrid PV–Wind, PtG and PtL plants.
Figure 13.
Optimal installed capacity (a) and production (b) potential of hybrid PV–Wind, PtG and PtL plants.
In 2030, even with higher hybrid PV–Wind installed capacities, the optimal installed capacity potential of PtL is only 48% of the total optimal PtG installation potential. In addition to lower efficiency, this is because, with the aid of hydrogen storage, the downstream part of the PtL system (RWGS and FT) would be operated as base load, while in the PtG system it is directly connected to the source of power. Thus, the operating time of the system is lower, but at a higher level of capacities. Even with constant PtX efficiency through 2030 to 2040, the generation potential increases from 2030 to 2040, due to the higher share of single-axis tracking PV in 2040, which has a higher generation potential than wind in the same area. Figure 14 presents the optimal annual PtG and PtL production volume (Figure 13) sorted in order of the specific generation cost, in 2030 and 2040. The production cost increases about 20 €/MWhth,fuel for the first 1000 TWhth. To boost the volume of cheap fuel production, desirable nodes can be completely covered by solar PV plants or wind farms if their site is outside of an inhabited region.
Figure 14.
PtG (SNG) and PtL (SLF) industrial cost curves for cost optimized production based on hybrid PV–Wind power in a cumulative distribution, in 2030 and 2040.
The industrial cost curves for the Maghreb region have been broken down by country in Figure 15, which makes it possible to investigate the production potential of each country under any cost level, in 2030 and 2040.
Figure 15.
PtG (SNG) and PtL (SLF) industrial cost curves for cost optimized production based on hybrid PV–Wind power in a cumulative distribution for each country in the Maghreb region; in 2030 (a) and 2040 (b).
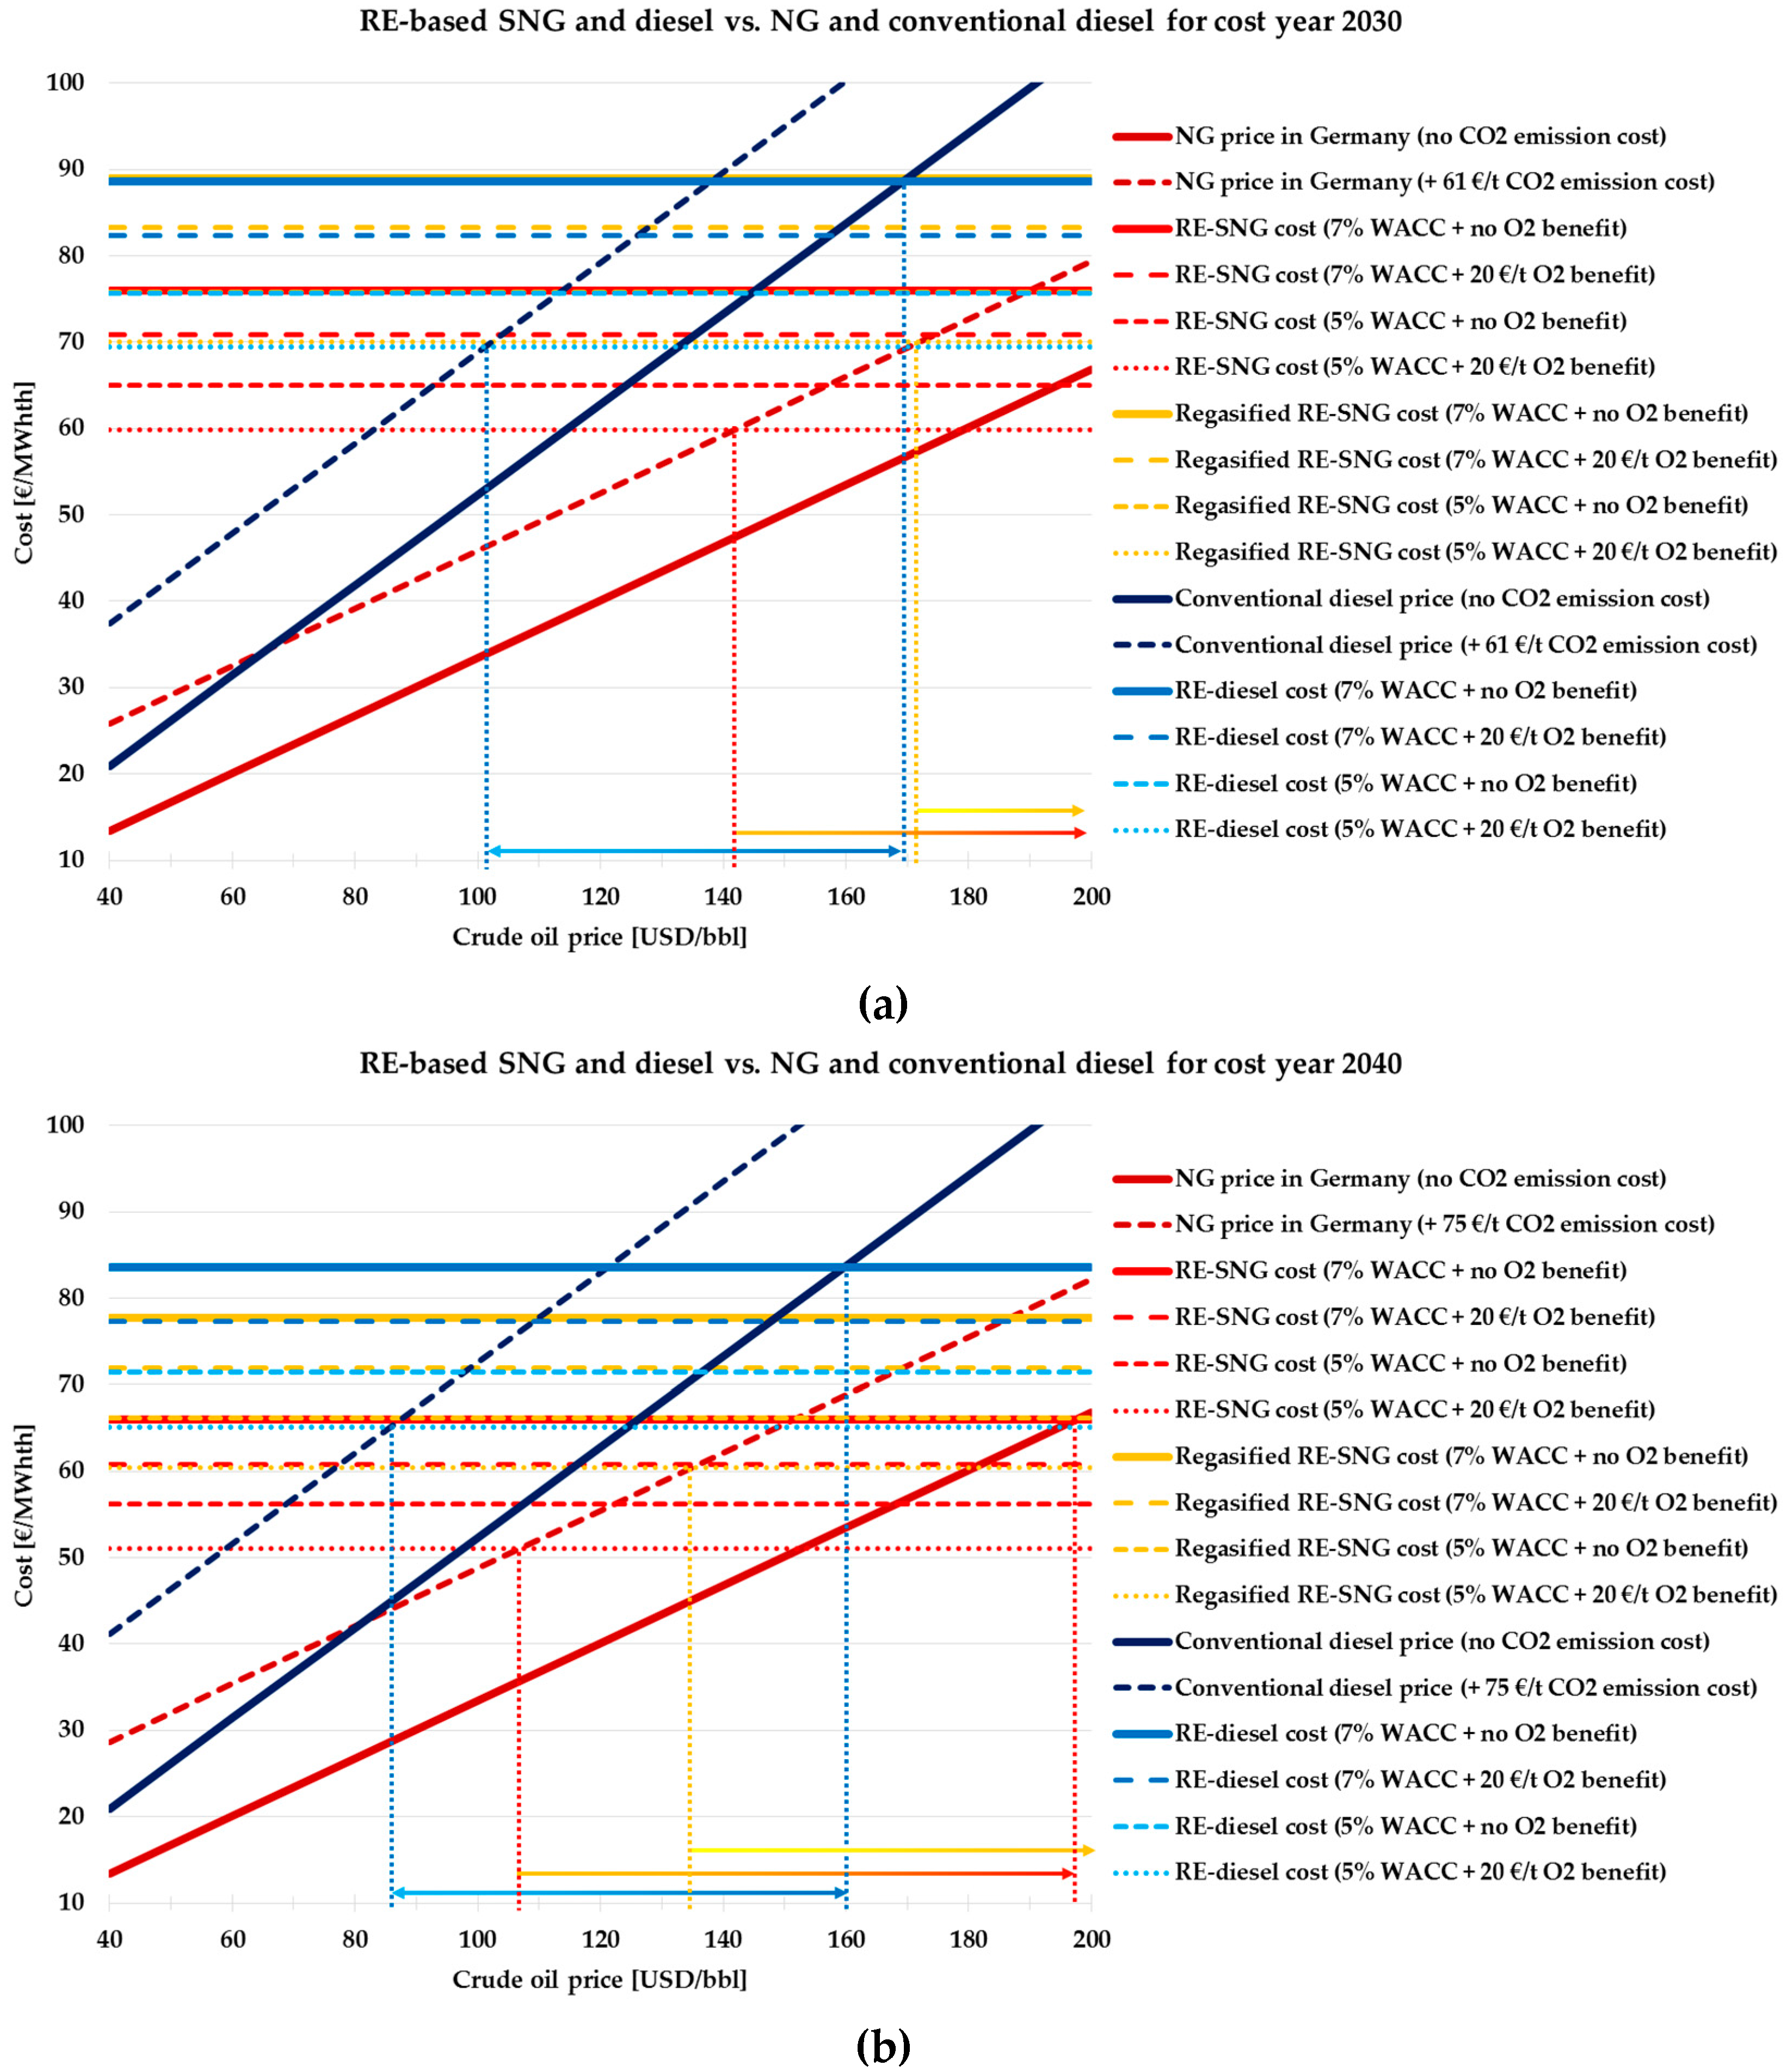
3.4. Business Case and Cost Drivers for Reaching Fuel-Parity
As discussed in the introduction, by 2030 there would be countries that may only demand carbon neutral hydrocarbons, i.e., fossil-based fuels would not be accepted anymore in those countries. However, in general the RE-SNG and RE-diesel should compete with NG, LNG and conventional diesel in the market, which is a function of the crude oil price and in the case of diesel, also a function of refining cost. The 32-year average ratio of NG price in Germany (as a European country) to crude oil price is 77.9% [9,48]. In addition, for the latest six-year average, the NG price in Germany has been at the same level as the Spanish LNG price [49,50]. The 13-year average ratio of one barrel of diesel cost to crude oil price is 118.8% [10,51]. With current crude oil prices and the projected costs of synthetic fuels in 2030 and 2040 for the base scenario, synthetic fuels would not become comparable. However, an increase in crude oil price or CO2 emission cost will increase the cost of NG and conventional diesel, while a profitable business case for O2 or a feasible business case at a de-risked 5% WACC level can lead to lower cost for RE-synthetic fuels. In this study, according to Bloomberg New Energy Outlook 2015 [52], the additional cost of CO2 emissions on conventional hydrocarbons with a maximum price of 61 €/tCO2 in 2030 and 75 €/tCO2 in 2040 has been taken into account. The market price of oxygen for industrial purposes can be up to 80 €/tO2 [8]. Nevertheless, the projection of a maximum 20 €/tO2 benefit from oxygen utilization is assumed in this study, while there is no benefit from oxygen utilization in the base scenario. The effects of all these factors have been summarized in Figure 16. The prices of NG and diesel in the EU are based on:
- the global crude oil price for a price range of 40–200 USD/barrel;
- two scenarios for CO2 emission cost;
- two scenarios for benefits from O2 sales; and
- the cost of delivered RE-SNG or RE-diesel based on two different WACC levels.
Figure 16.
Different scenarios for the RE-SNG and RE-diesel production cost in the Maghreb region (Western Sahara) and regasified RE-SNG price in Finland, in: 2030 (a); and 2040 (b). Reading example: For a crude oil price of 100 USD/bbl in 2040, the conventional diesel price varies from 52–73 €/MWhth (depending on the CO2 emission cost), while the RE-diesel cost varies from 65–83 €/MWhth (depending on WACC and O2 benefit).
All projections are for the years 2030 and 2040.
At 76 €/MWhth,HHV (0.78 €/m3SNG), RE-SNG has a lower production cost in comparison to 88 €/MWhth,HHV (0.85 €/L) for RE-diesel, in 2030. On the other hand, the market price of diesel per unit of energy is significantly higher than natural gas. Moreover, CO2 emissions of diesel per unit of energy are more than NG, thus CO2 emission cost would have a greater impact on the price of conventional diesel. Thus, in total, RE-diesel can reach market parity at lower crude oil prices. This market parity can also be called fuel-parity, since for the applied assumptions the fossil and RE-based fuels result in the same cost in the target markets. The fuel-parity concept and its impacts are further explained by Breyer et al. [53]. The first breakeven point, in 2030, can be expected for produced RE-diesel with a WACC of 5%, CO2 emission cost of 61 €/tCO2, accessible oxygen price of 20 €/tO2 and a crude oil price of about 101 USD/bbl, in 2030. While RE-diesel produced under the base case (WACC of 7%, no CO2 emission cost and no O2 sales) can reach fuel-parity with conventional diesel whenever the crude oil price is higher than about 169 USD/bbl. In 2040, this range decreases to 86–160 USD/bbl. In the case of RE-SNG the first breakeven point can be expected for a crude oil price of 142 and 107 USD/bbl in 2030 and 2040, respectively. The regasified RE-SNG would reach fuel-parity at about 30 USD/bbl higher crude oil prices. These represent a very high difference and the base case may not easily match with market prices. However, the additional assumptions are not far from reality, since a CO2 emission cost is already applied in some countries [54].
4. Discussion and Conclusions
Synthetic fuel production for Europe based on hybrid PV–Wind power plants in the Maghreb region is technically feasible by the year 2030. In general, the system can run if the final product is cost competitive or there is a ban on fossil fuels. This study shows that, for the base scenario, RE-diesel produced in the Maghreb region in 2030 can reach fuel-parity with RE-diesel in the EU for a crude oil price of 169 USD/bbl, while RE-SNG in Southern Europe and regasified RE-SNG in Finland would not reach fuel-parity for the studied crude oil price of up to 200 USD/bbl. These are more than the prices of conventional fossil diesel or NG in today’s markets. However, application of CO2 emission cost, a profitable business case for O2, a feasible business case at a de-risked 5% WACC level, further advances in technologies, or cost reductions by 2040 can decrease the fuel-parity for RE-diesel and RE-SNG to crude oil prices of 86 and 107 USD/bbl, respectively. For this matter, a study of oxygen demand in the Maghreb region and Southern Europe is essential. In addition, the improvement of stability in the region will encourage investors to choose the Maghreb region for their investment in this sector. However, the Opex for solar PV might be higher in some parts of the Maghreb region with very harsh climate. The WACC may vary between 5% and 9% around the assumed 7%, depending on economic and political constraints. To reflect the impact of these factors, sensitivity analyses have been performed for WACC and the solar PV Opex for PtG in 2030, as an example. As illustrated in Figure 17, a WACC of 9% would increase the SNG production cost by about 17%. However, the corresponding return on equity would be around 18% (for 5% interest rate and 70% debt financing), a level that reflects either extreme high risk or a business case which is close to being greedy. The solar PV Opex sensitivity analysis shows that a 0.1% absolute increase of annual Opex as a percentage of Capex leads to 1.08% higher PV LCOE and 0.4% higher synthetic fuels cost. The lower impact on fuel final production cost is because the optimized combination of different technologies would be rebalanced in order to minimize the cost effect of PV LCOE. For example, more wind power or batteries would be installed in the newly optimized system. Moreover, the Opex increase effect is almost negligible for production up to 300 TWhth in the least cost production sites characterized by a very low share of PV (Figure 9a).
Figure 17.
PtG (SNG) sensitivity analysis for different WACC and solar PV Opex assumptions in 2030.
Apart from direct air capture (DAC), other carbon capture and utilization (CCU) methods such as CO2 from waste-to-energy plants, pulp and paper plants and the raw material from cement mills could be used in order to give the model more flexibility to find the least cost option. The direct air capturing CO2 units in the current system are mainly powered by waste heat from the PtG or PtL plants and can deliver CO2 with a cost range of 30–80 €/tonne in an optimized PtX system. Any other CO2 source has to compete with this cost reference to achieve a positive effect on the overall cost-optimized system. Aghahosseini et al. [55] concluded for the Middle East and Northern Africa (MENA) region that the sector integration of a 100% renewable electricity system with seawater desalination and industrial gas demand could lead to an additional cost benefit for the total energy system of 10.8%, due to an increased level of flexibility, which may be used for a further optimization of the utilization of intermittent RE sources. The PtX options discussed in this article have not yet been integrated in a comprehensive energy system analysis investigating further potential cost reductions due to more flexibility.
RE-diesel would be a more attractive case than SNG if the current energy system continued. Nevertheless, the production cost of synthetic fuels is not the only factor when choosing one fuel as the best option. Preference also depends on each one’s application and the corresponding demand. However, the world’s energy system will become mainly electrified in future, thus the market size for hydrocarbons would shrink to mainly aviation, heavy vehicles, and non-energetic industrial purposes. Thus, the chances are high that there would always be a surplus of crude oil and NG, which can easily keep the market price below the synthetic fuels production cost.
On the other hand, there would be more restrictions on fossil-based hydrocarbons due to environmental issues and emissions cost, in particular due to the global net zero agreement at COP21 in Paris. The standards for fuel quality may rise to a limit at which NG and conventional diesel and jet fuel cannot be produced at that quality anymore. In that case, carbon-neutral, sulfur-free SNG and SLF can be considered as one of the main substitutions, even at a higher production cost. In that case, RE-synthetic fuels produced in the Maghreb region would be one of the cheapest available options for Europe. Thus, a decent market potential is seen for both SNG and RE-diesel for the EU in 2030 and 2040, which the Maghreb region can address and gain a significant share.
Acknowledgments
The authors gratefully acknowledge the public financing of Tekes, the Finnish Funding Agency for Innovation, for the :Neo-Carbon Energy: project under the number 40101/14. The first author thanks the Gasum Gas Fund for the valuable scholarship. We also thank Michael Child for proofreading.
Author Contributions
Dmitrii Bogdanov did the initial coding of the hourly model; Mahdi Fasihi performed the research, developed the code, generated the results, analyzed the data, and wrote the manuscript; and Christian Breyer framed the research questions and scope of the work and cross-checked results, assumptions and the manuscript.
Conflicts of Interest
The authors declare no conflict of interest. The founding sponsors had no role in the design of the study; in the collection, analyses, or interpretation of data; in the writing of the manuscript, and in the decision to publish the results.
Nomenclature
| AEC | Alkaline Electrolysis Cell |
| bpd | Barrel per day |
| Capex | Capital Expenditures |
| CCU | Carbon Capture and Utilization |
| CCS | Carbon Capture and Storage |
| COP | Conference of the Parties |
| crf | Capital recovery factor |
| Eq | Equation |
| DAC | Direct Air Capture |
| FLh | Full Load hours |
| FT | Fischer–Tropsch |
| h | hour |
| H2tL | Hydrogen-to-Liquids |
| HHV | Higher Heating Value |
| HT | High Temperature |
| LCOE | Levelized Cost of Electricity |
| LCOF | Levelized Cost of Fuel |
| LFG | Light Fuel Gases |
| LHV | Lower Heating Value |
| LNG | Liquefied Natural Gas |
| LT | Low Temperature |
| N | Lifetime |
| NG | Natural Gas |
| Opex | Operational Expenditures |
| PR | Performance Ratio |
| PtG | Power-to-Gas |
| PtL | Power-to-Liquids |
| PV | Photovoltaic |
| RE | Renewable Electricity |
| RO | Reverse Osmosis |
| RWGS | Reverse Water-Gas Shift |
| SLF | Synthetic Liquid Fuels |
| SNG | Synthetic Natural Gas |
| SWRO | Seawater Reverse Osmosis |
| t | Tonne |
| USD | United States dollar |
| WACC | Weighted Average Cost of Capital |
| WS | Water Storage |
| η | Efficiency |
| Subscripts | |
| el | electricity |
| fix | fixed |
| sf | Synthetic Fuels |
| th | thermal |
| var | variable |
References
- Intergovernmental Panel on Climate Change. Climate Change 2014 Synthesis Report Summary for Policymakers; Intergovernmental Panel on Climate Change: Geneva, Switzerland, 2014; Available online: https://goo.gl/AdJEFf (accessed on 6 November 2016).
- Carbon Tracker. Unburnable Carbon 2013: Wasted Capital and Stranded Assets; Carbon Tracker and the Grantham Research Institute: London, UK, 2013; Available online: https://goo.gl/QR6gsc (accessed on 6 November 2016).
- Carbon Tracker. Carbon Asset Risk: From Rhetoric to Action; Carbon Tracker: London, UK, 2015; Available online: https://goo.gl/2A2SSG (accessed on 6 November 2016).
- United Nations Framework Convention on Climate Change. Adoption of the Paris Agreement—Proposal by the President; United Nations Framework Convention on Climate Change (UNFCCC): Paris, France, 2015; Available online: https://goo.gl/t3rLbg (accessed on 6 November 2016).
- Schellnhuber, H.J.; Rahmstorf, S.; Winkelmann, R. Why the right climate target was agreed in Paris. Nat. Clim. Chang. 2016, 6, 649–653. [Google Scholar] [CrossRef]
- Koizumi, T. Biofuels and food security. Renew. Sustain. Energy Rev. 2015, 52, 829–841. [Google Scholar] [CrossRef]
- Tomei, J.; Helliwell, R. Food versus fuel? Going beyond biofuels. Land Use Policy 2016, 56, 320–326. [Google Scholar] [CrossRef]
- Breyer, C.; Tsupari, E.; Tikka, V.; Vainikka, P. Power-to-gas as an emerging profitable business through creating an integrated value chain. Energy Procedia 2015, 73, 182–189. [Google Scholar] [CrossRef]
- Fasihi, M.; Bogdanov, D.; Breyer, C. Economics of Global LNG Trading Based on Hybrid PV-Wind Power Plants. In Proceedings of the 31st European Photovoltaic Solar Energy Conference (EU PVSEC), Hamburg, Germany, 14–18 September 2015; Available online: https://goo.gl/ReTvGn (accessed on 6 November 2016).
- Fasihi, M.; Bogdanov, D.; Breyer, C. Techno-Economic Assessment of Power-to-Liquids (PtL) Fuels Production and Global Trading Based on Hybrid PV-Wind Power Plants. In Proceedings of the 10th International Renewable Energy Storage Conference (IRES), Düsseldorf, Germany, 15–17 March 2016; Available online: https://goo.gl/AonMp4 (accessed on 6 November 2016).
- Fu, Q.; Mabilat, C.; Zahid, M.; Brisse, A.; Gautier, L. Syngas production via high-temperature steam/CO2 co-electrolysis: An economic assessment. Energy Environ. Sci. 2010, 3, 1382. [Google Scholar] [CrossRef]
- Forschungsvereinigung Verbrennungskraftmaschinen. Kraftstoffstudie—Zukünftige Kraftstoffe für Verbrennungsmotoren und Gasturbinen; Forschungsvereinigung Verbrennungskraftmaschinen (FVV): Frankfurt, Germany, 2013; Available online: https://goo.gl/bGpzpn (accessed on 6 November 2016).
- Agora Energiewende. Stromspeicher in der Energiewende; Agora Energiewende: Berlin, Germany, September 2014; Available online: https://goo.gl/OazIzS (accessed on 6 November 2016).
- ETOGAS GmbH. Power to Gas: Intelligente Konvertierung und Speicherung von Energie in der Industriellen Umsetzung; ETOGAS GmbH: Stuttgart, Germany, 2013; Available online: https://goo.gl/E1vzLb (accessed on 6 November 2016).
- König, D.H.; Freiberg, M.; Dietrich, R.U.; Wörner, A. Techno-economic study of the storage of fluctuating renewable energy in liquid hydrocarbons. Fuel 2015, 159, 289–297. [Google Scholar] [CrossRef]
- Konovessis, D. An investigation on cost-effective tanker design configurations for reduced oil outflow. Ocean Eng. 2012, 49, 16–24. [Google Scholar] [CrossRef]
- United Nations Conference on Trade and Development. Review of Maritime Transport; United Nations Conference on Trade and Development (UNCTAD): New York, NY, USA; Geneva, Switzerland, 2009; Available online: https://goo.gl/YKcRgo (accessed on 6 November 2016).
- MAN Diesel & Turbo. Propulsion Trends in Tankers; MAN Diesel & Turbo—A member of the MAN Group: Copenhagen, Denmark, 2013; Available online: https://goo.gl/d9k8Uj (accessed on 6 November 2016).
- Khalilpour, R.; Karimi, I.A. Evaluation of utilization alternatives for stranded natural gas. Energy 2012, 40, 317–328. [Google Scholar] [CrossRef]
- Lochner, S.; Bothe, D. The development of natural gas supply costs to Europe, the United States and Japan in a globalizing gas market-Model-based analysis until 2030. Energy Policy 2009, 37, 1518–1528. [Google Scholar] [CrossRef]
- Castillo, L.; Dorao, C.A. Influence of the plot area in an economical analysis for selecting small scale LNG technologies for remote gas production. J. Nat. Gas Sci. Eng. 2010, 2, 302–309. [Google Scholar] [CrossRef]
- Vanem, E.; Antão, P.; Østvik, I.; de Comas, F.D. C. Analysing the risk of LNG carrier operations. Reliab. Eng. Syst. Saf. 2007, 93, 1328–1344. [Google Scholar] [CrossRef]
- Maxwell, D.; Zhu, Z. Natural gas prices, LNG transport costs, and the dynamics of LNG imports. Energy Econ. 2011, 33, 217–226. [Google Scholar] [CrossRef]
- Sönmez, E.; Kekre, S.; Scheller-Wolf, A.; Secomandi, N. Strategic analysis of technology and capacity investments in the liquefied natural gas industry. Eur. J. Oper. Res. 2012, 226, 100–114. [Google Scholar] [CrossRef]
- Sea Distances Website. Available online: www.sea-distances.org (accessed on 6 November 2016).
- Alberto Rechelo Neto, C.; Sauer, I.L. LNG as a strategy to establish developing countries’ gas markets: The Brazilian case. Energy Policy 2005, 34, 4103–4114. [Google Scholar] [CrossRef]
- Bogdanov, D.; Breyer, C. North-East Asian Super Grid for 100% renewable energy supply: Optimal mix of energy technologies for electricity, gas and heat supply options. Energy Convers. Manag. 2016, 112, 176–190. [Google Scholar] [CrossRef]
- Kronenberg, D.; (Climeworks AG, Zürich, Switzerland). Personal Communication, 2015.
- Caldera, U.; Bogdanov, D.; Afanasyeva, S.; Breyer, C. Integration of reverse osmosis seawater desalination in the power sector, based on PV and wind energy, for the Kingdom of Saudi Arabia. In Proceedings of the 32nd European Photovoltaic Solar Energy Conference (EU PVSEC), Munich, Germany, 20–24 June 2016; Available online: https://goo.gl/99Z7YY (accessed on 6 November 2016).
- Loutatidou, S.; Chalermthai, B.; Marpu, P.R.; Arafat, H.A. Capital cost estimation of RO plants: GCC countries versus southern Europe. Desalination 2014, 347, 103–111. [Google Scholar] [CrossRef]
- Breyer, C. Economics of Hybrid Photovoltaics Power Plants. Ph.D. Thesis, Faculty of Electrical Engineering and Computer Science, University of Kassel, Kassel, Germany, 2012. Available online: https://goo.gl/Yy6P9X (accessed on 6 November 2016). [Google Scholar]
- Stackhouse, P.; Whitlock, C. (Eds.) Surface Meteorology and Solar Energy (SSE) Release 6.0 Methodology; National Aeronautic and Space Administration (NASA): Langley, VA, USA, 2008; Available online: https://goo.gl/Ty6k0v (accessed on 6 November 2016).
- Stackhouse, P.; Whitlock, C. (Eds.) Surface Meteorology and Solar Energy (SSE) Release 6.0 Methodology; National Aeronautic and Space Administration (NASA): Langley, VA, USA, 2009; Available online: https://goo.gl/Ty6k0v (accessed on 6 November 2016).
- Stetter, D. Enhancement of the REMix Energy System Model: Global Renewable Energy Potentials, Optimized Power Plant Siting and Scenario Validation. Ph.D. Thesis, Faculty of Energy-, Process- and Bio-Engineering, University of Stuttgart, Stuttgart, Germany, 2012. [Google Scholar]
- Gerlach, A.; Stetter, D.; Schmid, J.; Breyer, C. PV and Wind Power—Complementary Technologies. In Proceedings of the 26th European Photovoltaic Solar Energy Conference (EU PVSEC), Hamburg, Germany, 5–9 September 2011; Available online: https://goo.gl/ERHmSm (accessed on 6 November 2016).
- Huld, T.; Šúri, M.; Dunlop, E.D. Geographical variation of the conversion efficiency of crystalline silicon photovoltaic modules in Europe. Prog. Photovolt. Res. Appl. 2008, 16, 595–607. [Google Scholar] [CrossRef]
- Duffie, J.A.; Beckman, W.A. Solar Engineering of Thermal Processes, 4th ed.; Wiley: Hoboken, NJ, USA, 2013. [Google Scholar]
- ENERCON GmbH. ENERCON Product Overview; ENERCON GmbH: Aurich, Germany, 2014; Available online: https://goo.gl/TKdTPE (accessed on 6 November 2016).
- Masson, G. PV Trends & Market Overview. In Proceedings of the Solar United PV Forum, Intersolar, Munich, Germany, 23 June 2016.
- Central Electricity Regulatory Commission. Determination of Benchmark Capital Cost Norm for Solar PV Power Projects and Solar Thermal Power Projects Applicable during FY 2016–17; Petition No. 17/SM/2015; Central Electricity Regulatory Commission (CERC): New Delhi, India, 2016; Available online: https://goo.gl/jXWXx3 (accessed on 6 November 2016).
- Braisaz, B.; Duchayne, C.; Van Iseghem, M.; Radouane, K. PV Aging Model Applied to Several Meteorological Conditions. In Proceedings of the 29th European Photovoltaic Solar Energy Conference (EU PVSEC), Amsterdam, the Netherlands, 22–26 September 2014; Available online: https://goo.gl/sYVBbr (accessed on 6 November 2016).
- Mann, S.A.; De Wild-Scholten, M.J.; Fthenakis, V.M.; Van Sark, W.G.J.H.M.; Sinke, W.C. The energy payback time of advanced crystalline silicon PV modules in 2020: A prospective study. Prog. Photovolt. Res. Appl. 2013, 22, 1180–1194. [Google Scholar] [CrossRef]
- Breyer, C.; Afanasyeva, S.; Brakemeier, D.; Engelhard, M.; Giuliano, S.; Puppe, M.; Schenk, H.; Hirsch, T.; Moser, M. Assessment of Mid-Term Growth Assumptions and Learning Rates for Comparative Studies of CSP and Hybrid PV-Battery Power Plants. In Proceedings of the 22nd Solar Power And Chemical Energy Systems (SolarPACES), Abu Dhabi, UAE, 11–14 October 2016; Available online: https://goo.gl/Vln1nx (accessed on 6 November 2016).
- Dii GmbH. Desert Power 2050: Perspectives on a Sustainable Power System for EUMENA; Dii GmbH: Munich, Germany, 2012; Available online: https://goo.gl/81rJYg (accessed on 6 November 2016).
- European Commission. ETRI 2014—Energy Technology Reference Indicator Projections for 2010–2050; European Commission: Petten, the Netherlands, 2014; Available online: https://goo.gl/06Lxuk (accessed on 6 November 2016).
- Farfan, J.; Breyer, C. Structural Changes of the global power generation capacity towards sustainability and the risk of stranded investments, in preparation. J. Clean. Prod. 2017, 141, 370–384. [Google Scholar] [CrossRef]
- Short, W.; Packey, D.J.; Holt, T. A Manual for the Economic Evaluation of Energy Efficiency and Renewable Energy Technologies; National Renewable Energy Laboratory (NREL): Golden, CO, USA, 1995; Available online: https://goo.gl/aD6zjn (accessed on 18 December 2016).
- BP. BP Statistical Review of World Energy 2015, 64th ed.; BP: London, UK, 2015; Available online: https://goo.gl/WlKvgf (accessed on 6 November 2016).
- European Commission. Quarterly Report on European Gas Markets; European Commission: Brussel, Belgium, 2015; Volume 8, Available online: https://goo.gl/nV0qJZ (accessed on 6 November 2016).
- European Commission. Quarterly Report on European Gas Market; European Commission: Brussel, Belgium, 2016; Volume 9, Available online: https://goo.gl/liHy2K (accessed on 6 November 2016).
- U.S. Energy Information Administration. Gasoline and Diesel Fuel Update; U.S. Energy Information Administration (EIA): Washington, DC, USA, 2015. Available online: https://goo.gl/MK7Xw6 (accessed on 6 November 2016).
- Bloomberg New Energy Finance. New Energy Outlook 2015; Bloomberg New Energy Finance (BNEF): London, UK, 2015; Available online: https://goo.gl/4mu6uW (accessed on 6 November 2016).
- Breyer, C.; Görig, M.; Gerlach, A.-K.; Schmid, J. Fuel-Parity: Impact of Photovoltaics on Global Fossil Fuel Fired Power Plant Business. In Proceedings of the 26 Symposium Photovoltaische Solarenergie, Bad Staffelstein, Germany, 2–4 March 2011; Available online: https://goo.gl/S5bcPU (accessed on 6 November 2016).
- Organisation for Economic Co-operation and Development (OECD). Climate and Carbon: Aligning Prices and Policies; OECD Environment Policy Papers, No. 1; OECD: Paris, France, 2013; Available online: https://goo.gl/DiWzBj (accessed on 6 November 2016).
- Aghahosseini, A.; Bogdanov, D.; Breyer, C. The MENA Super Grid towards 100% Renewable Energy Power Supply by 2030. In Proceedings of the 11th International Energy Conference, Tehran, Iran, 30–31 May 2016; Available online: https://goo.gl/M4ZQvG (accessed on 20 December 2016).
© 2017 by the authors. Licensee MDPI, Basel, Switzerland. This article is an open access article distributed under the terms and conditions of the Creative Commons Attribution (CC BY) license ( http://creativecommons.org/licenses/by/4.0/).