
Elimination Method of Multi-Criteria Decision Analysis (MCDA): A Simple Methodological Approach for Assessing Agricultural Sustainability


Abstract
:1. Introduction
2. Method and Data
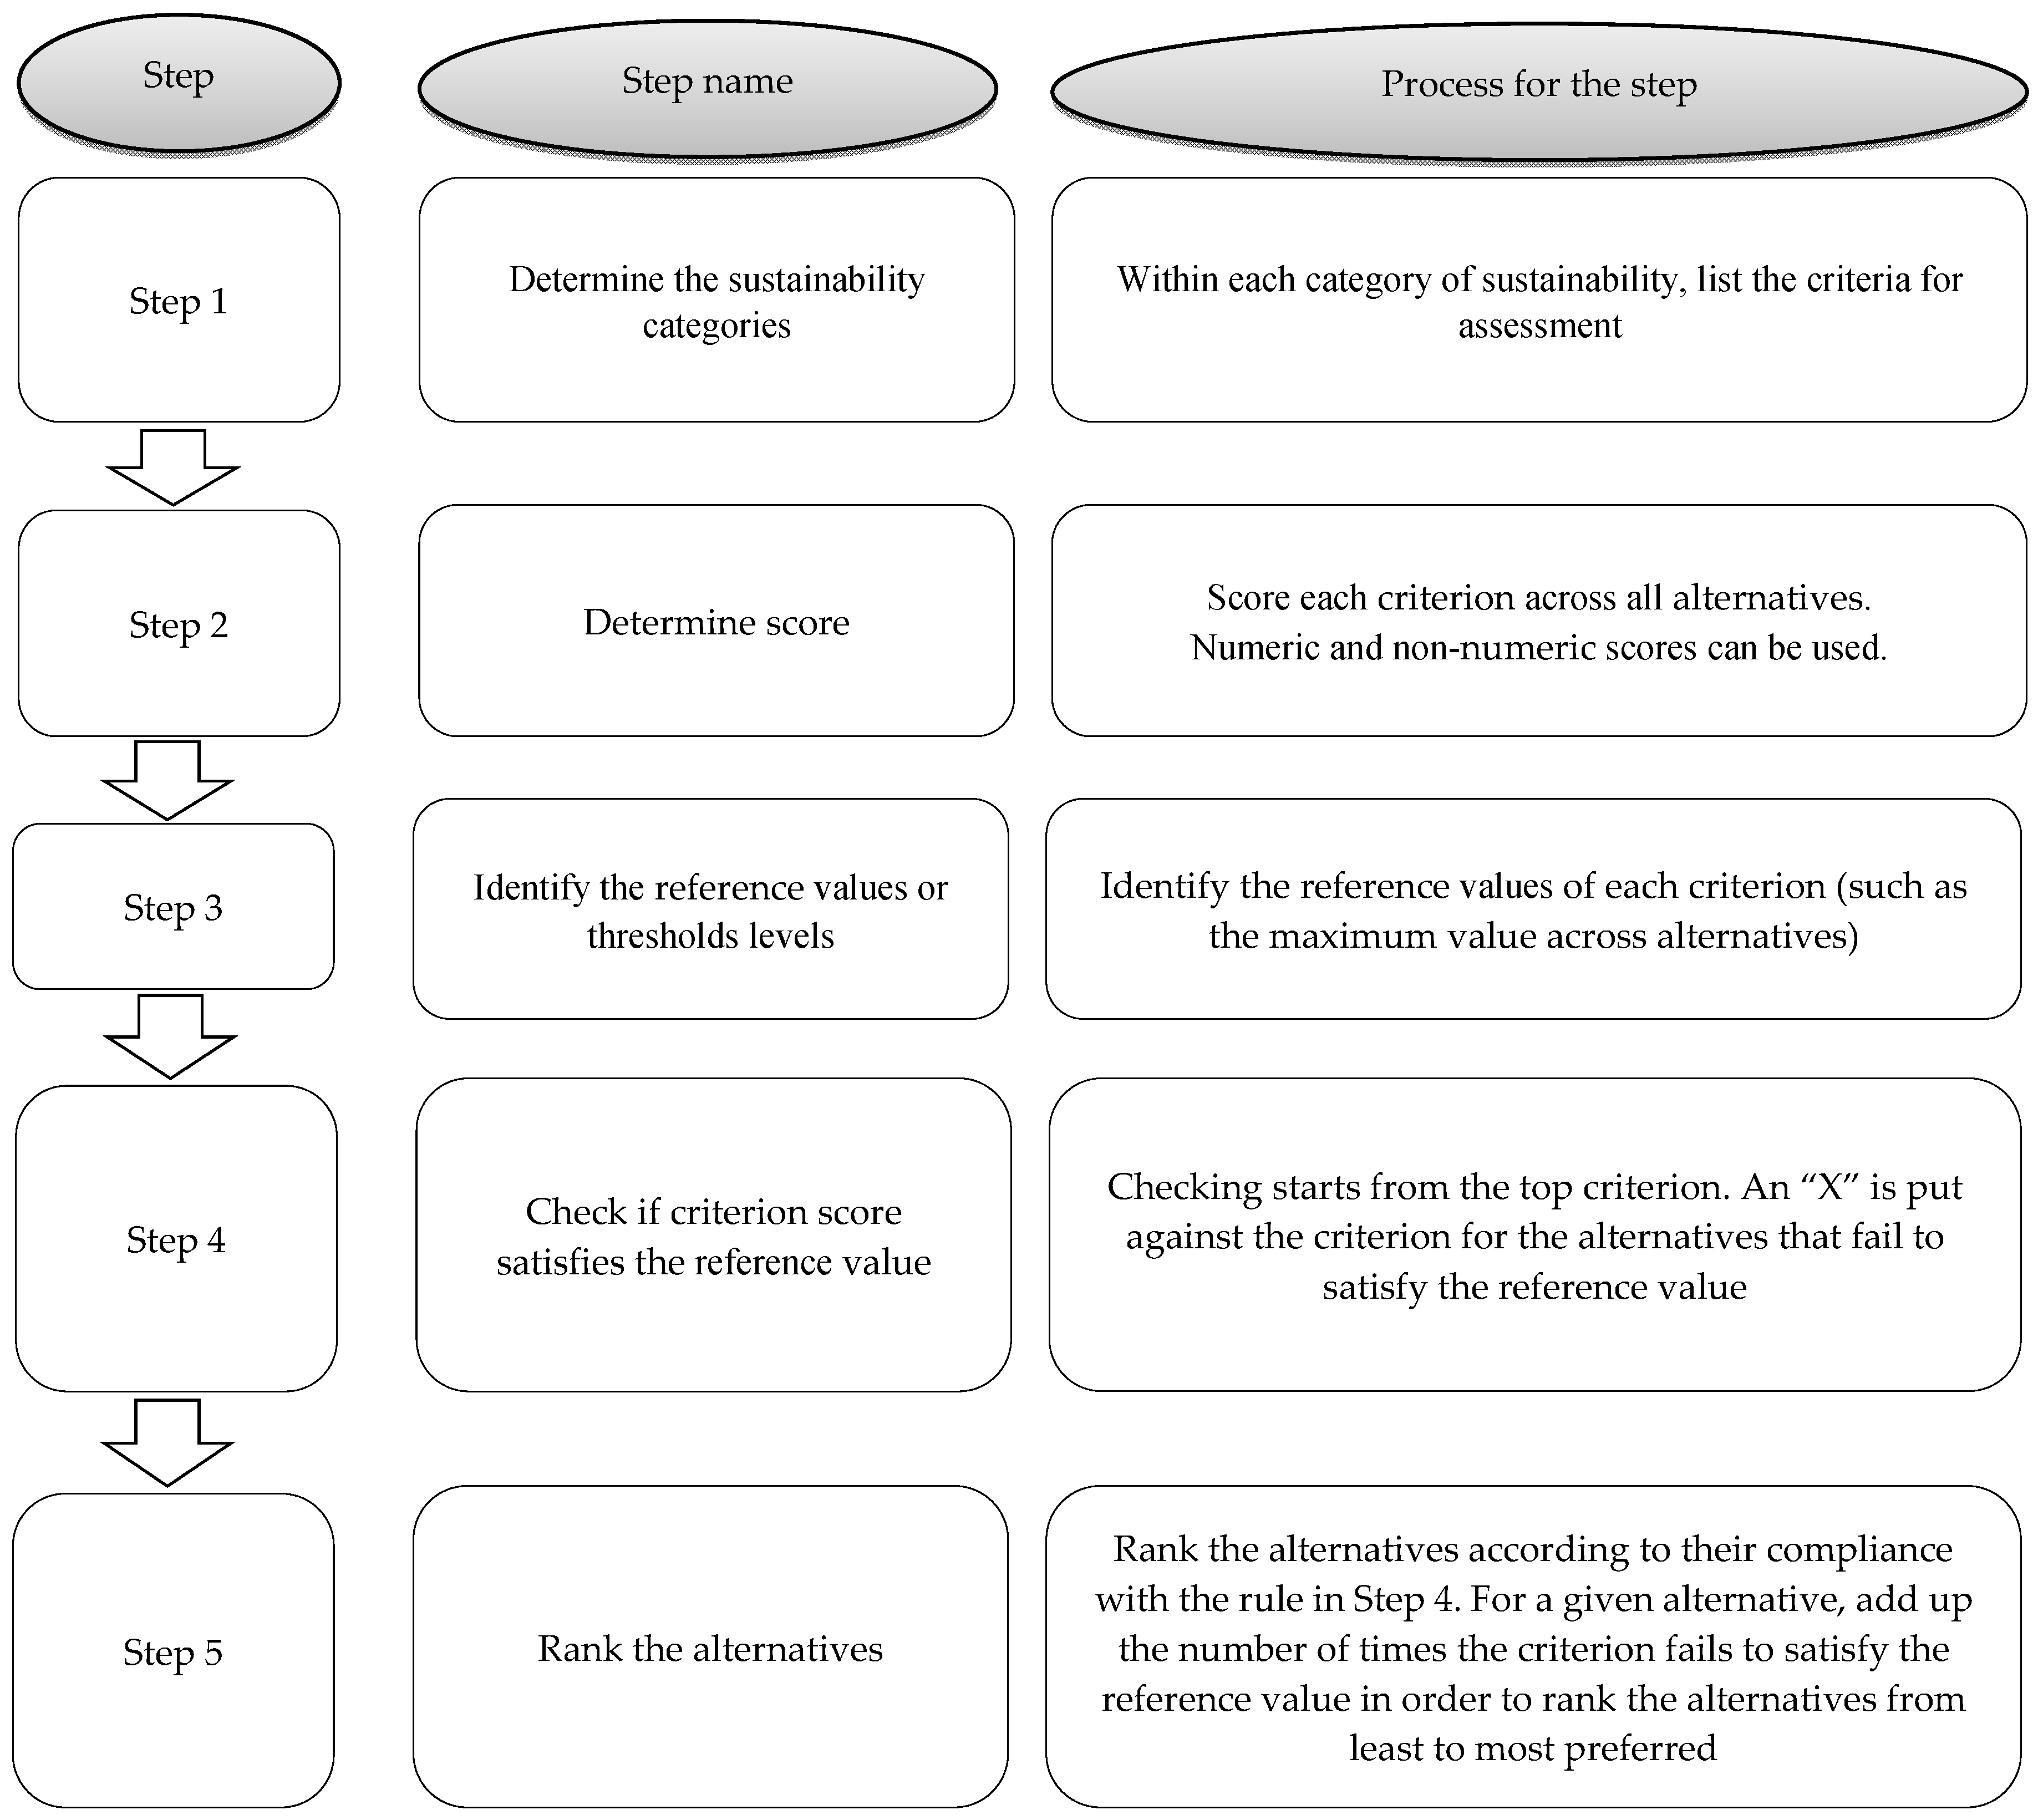
2.1. Elimination Method of MCDA
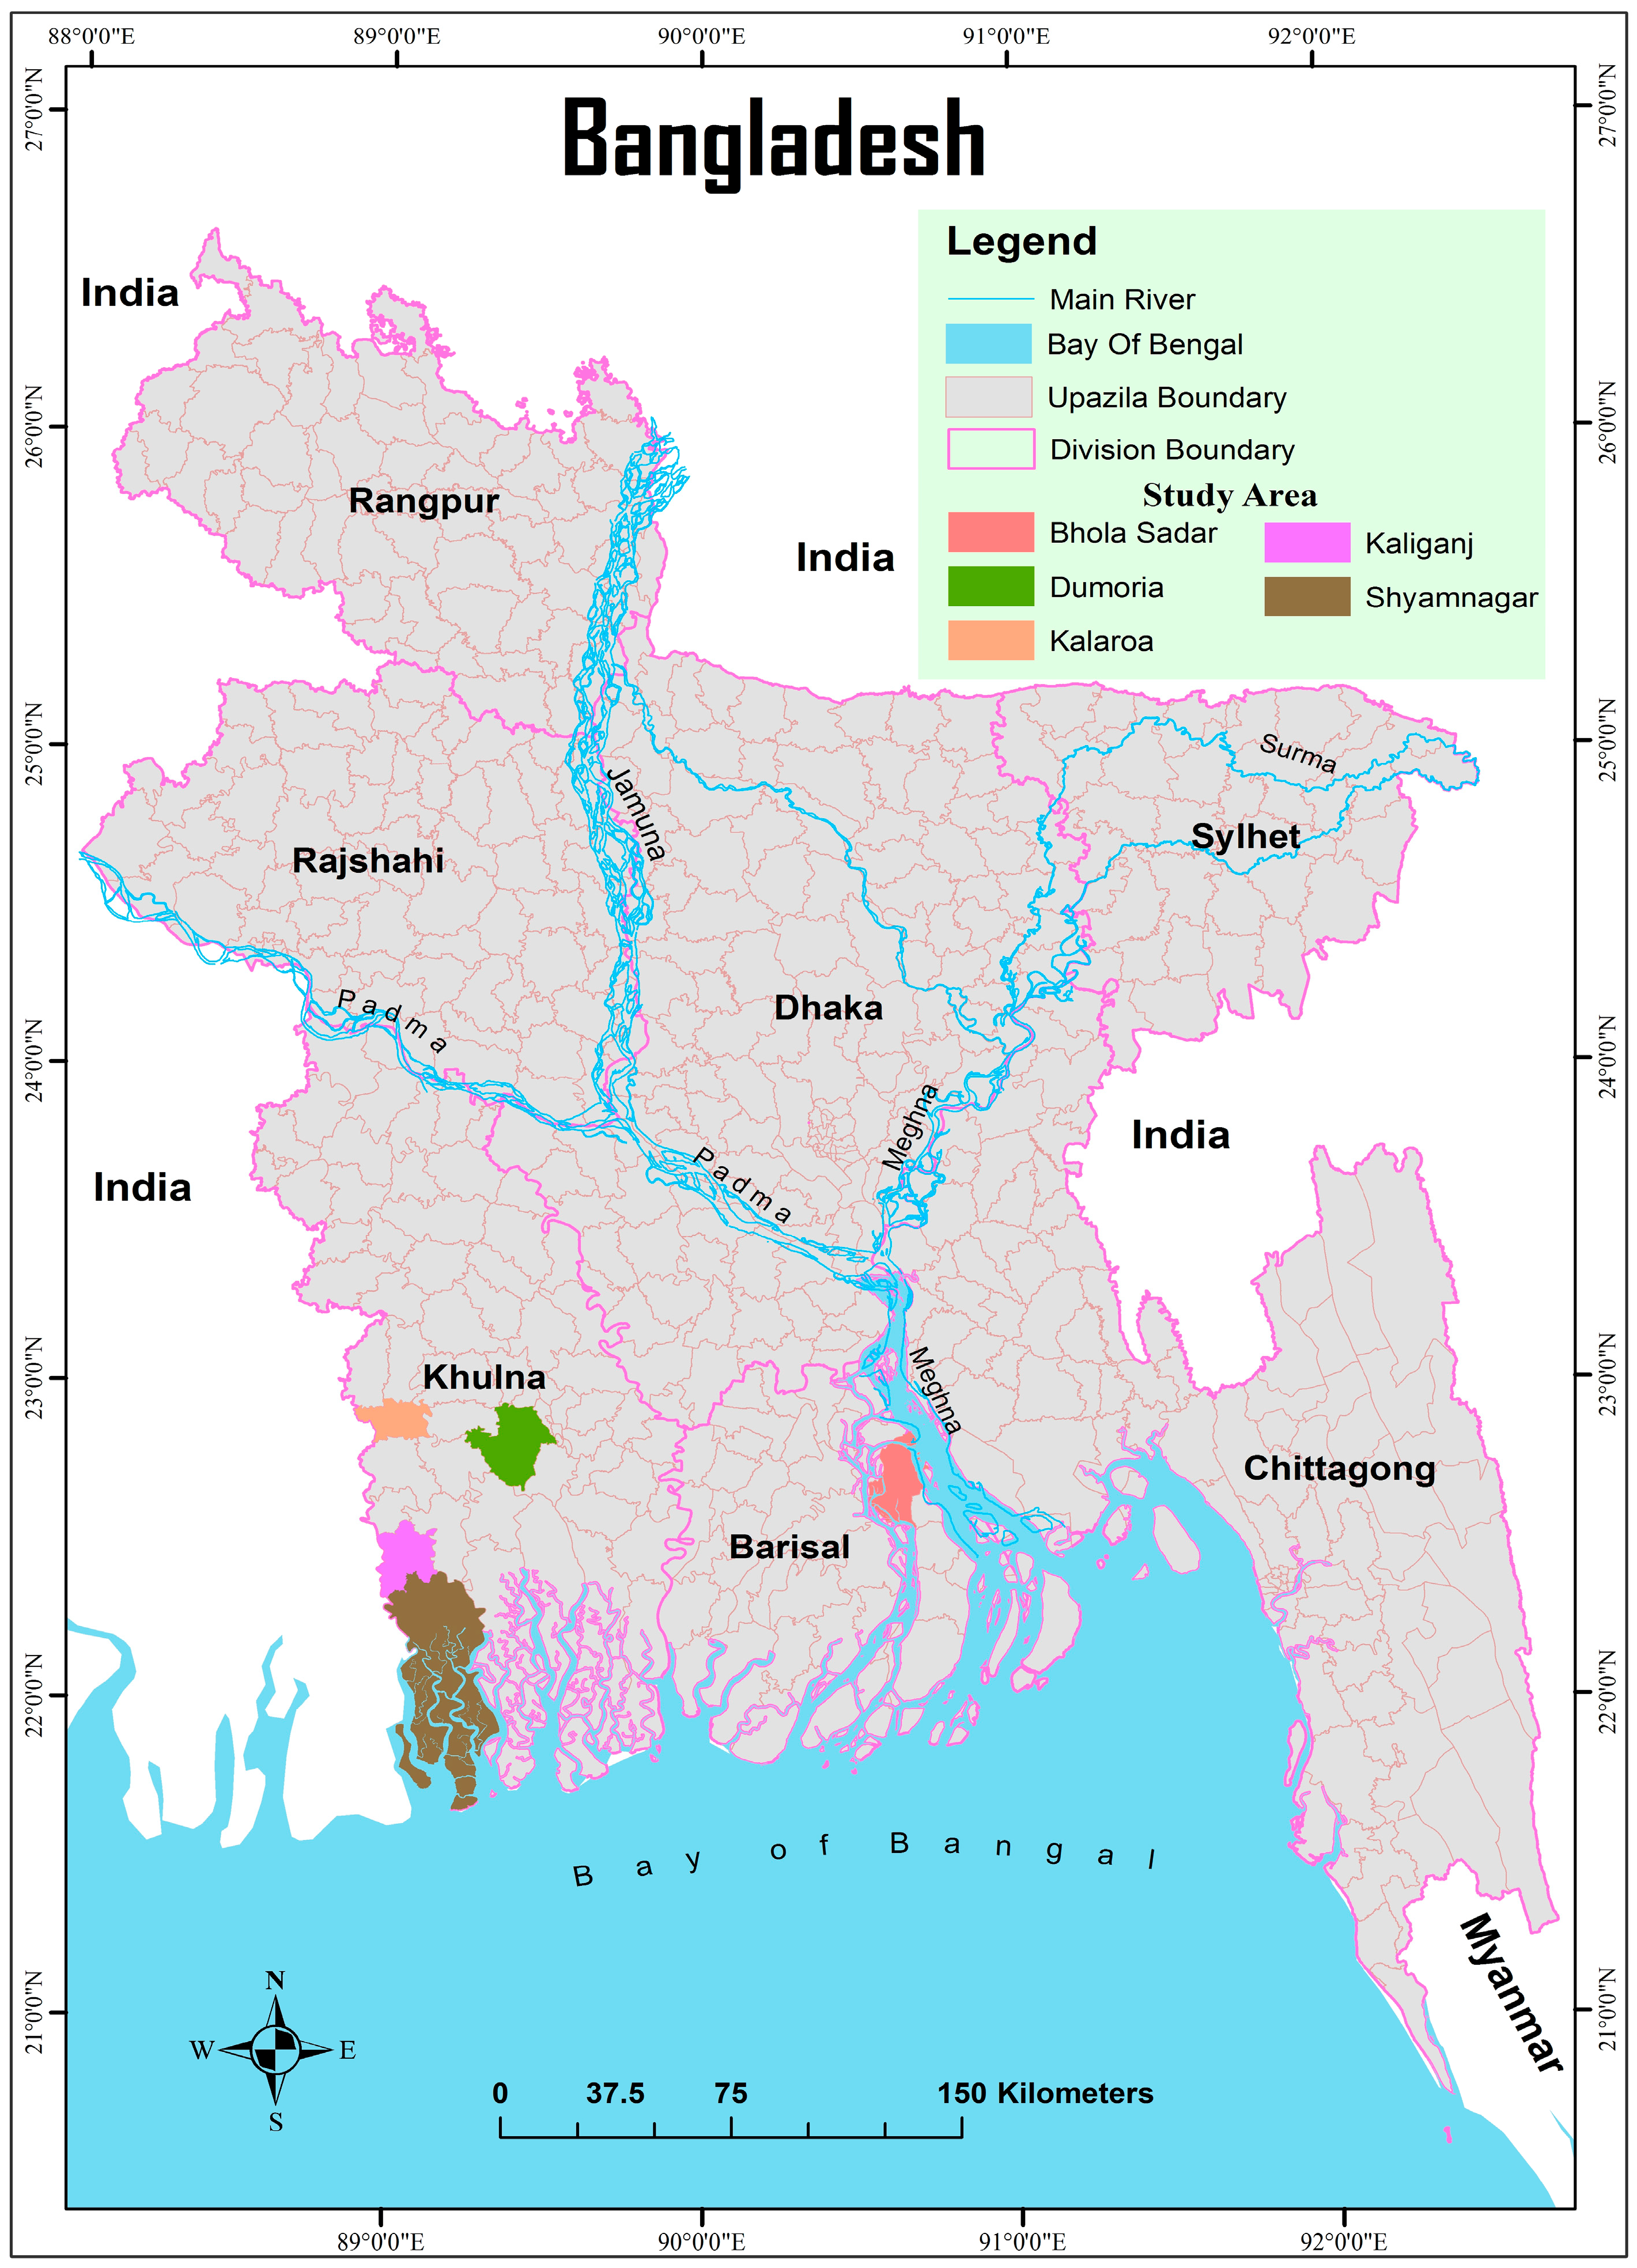
2.2. Data for the Case Study
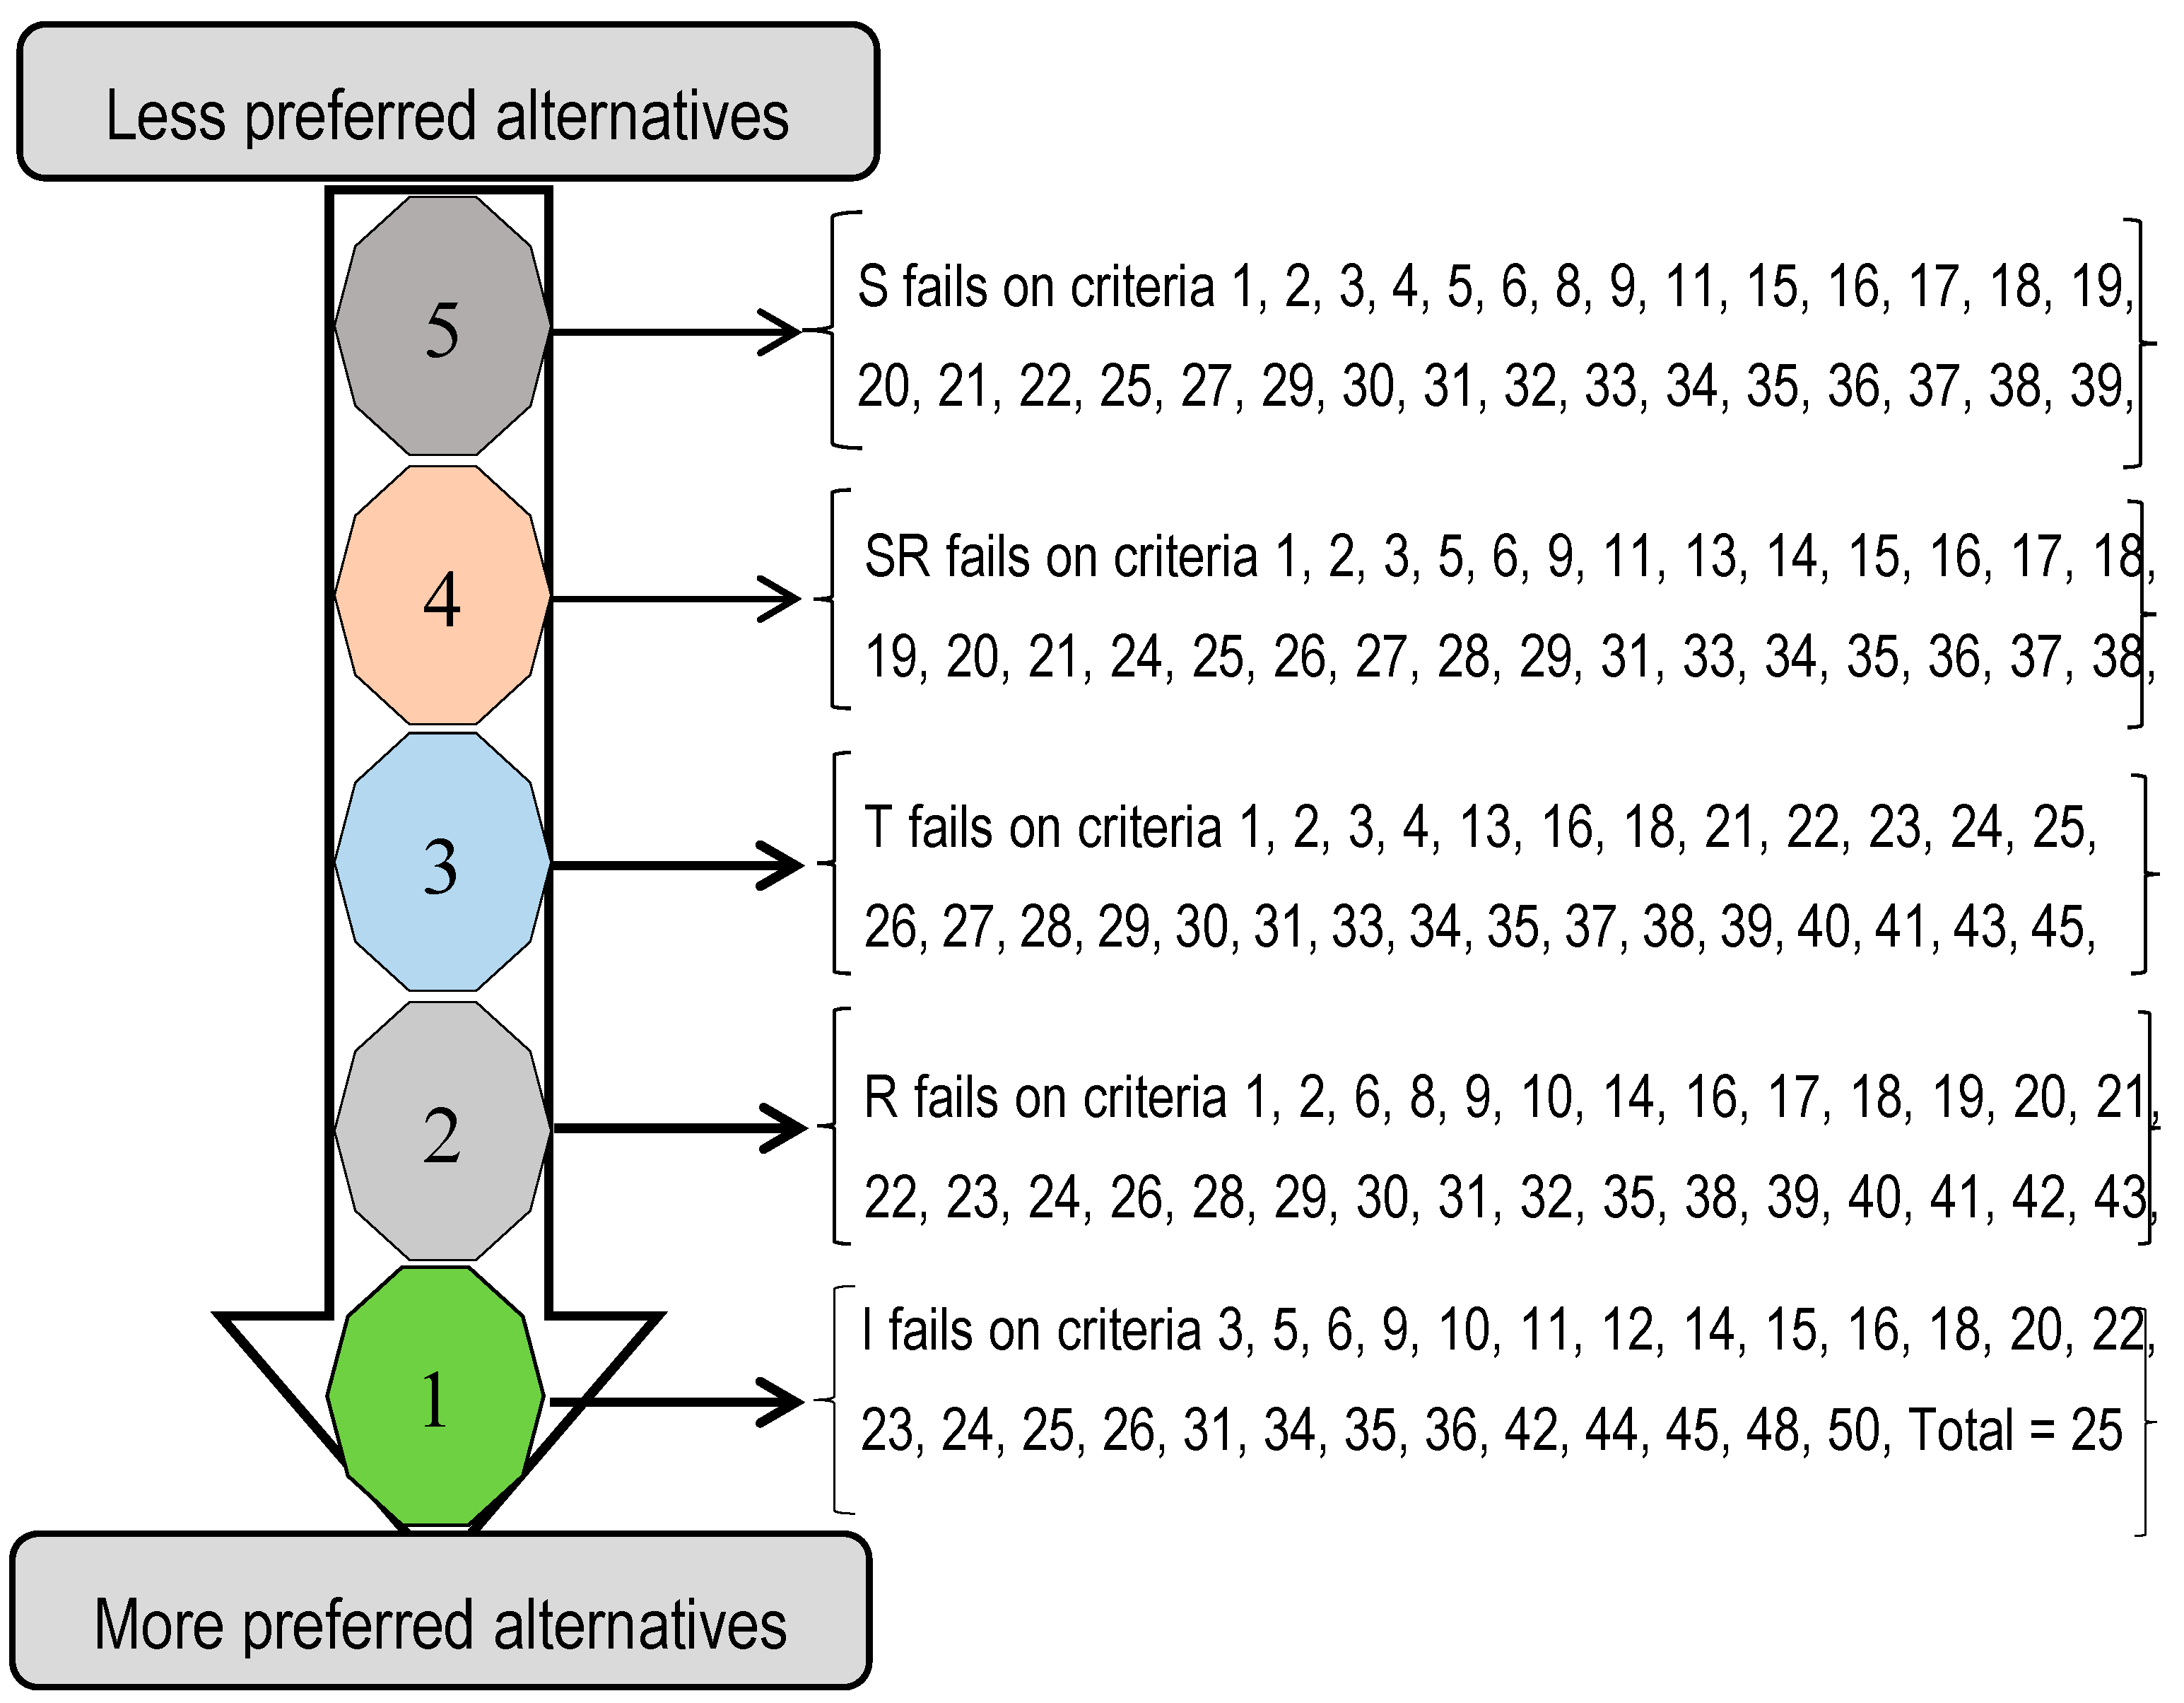
3. Results of Elimination Method
4. Discussion
5. Conclusions
Acknowledgments
Author Contributions
Conflicts of Interest
Appendix A. Databases Used in the Bangladesh Study

| Sustainability Category | Composite Indicator | Description | Unit | Data Type | Sustainability Pillar | Data Source | Agricultural Systems | Level of Measurement | ||||
|---|---|---|---|---|---|---|---|---|---|---|---|---|
| S | SR | R | I | T | ||||||||
| Productivity | Productivity | Weighted yield of the main staple crop | t/ha | QTL | Economic | Q.S. | 2.26 | 4.41 | 5.23 | 6.51 | 2.86 | Ratio scale |
| Net income from the agro-ecosystem | $/ha | QTL | Economic | Q.S. | 311.15 | 1020.37 | 1585.81 | 1806.04 | 544.01 | Ratio scale | ||
| Protein yield from the agro-ecosystem | kg/ha | QTL | Ecological | Q.S. | 68.42 | 147.23 | 552 | 373.01 | 318.87 | Ratio scale | ||
| Sustainability Category | Composite Indicator | Description | Unit | Data Type | Sustainability Pillar | Data Source | Agricultural Systems | Level of Measurement | ||||
|---|---|---|---|---|---|---|---|---|---|---|---|---|
| S | SR | R | I | T | ||||||||
| Stability | Landscape stability | Land exposure to natural events: cyclone | binary yes/no response | QUAL | Ecological | S.D. | 1 | 2 | 2 | 2 | 1 | Nominal scale |
| Land exposure to natural events: saline water | binary yes/no response | QUAL | Ecological | S.D. | 1 | 1 | 3 | 2 | 3 | Nominal scale | ||
| Land exposure to natural events: drought in kharif to rabi season | binary yes/no response | QUAL | Ecological | S.D. | 1.5 | 1.5 | 2 | 2 | 3.5 | Nominal scale | ||
| Land exposure to natural events: river bank erosion | binary yes/no response | QUAL | Ecological | S.D. | 2 | 2 | 2 | 2 | 1 | Nominal scale | ||
| Stability of embankment | binary yes/no response | QUAL | Ecological | F. O. | 1 | 2 | 1 | 2 | 2 | Nominal scale | ||
| Withdraw of upstream water | binary yes/no response | QUAL | Ecological | S.D. | 1 | 1 | 1 | 1 | 2 | Nominal scale | ||
| Soil health/stability | Organic materials | % | QTL | Ecological | S.D. | 4 | 4 | 2 | 3 | 2 | Ordinal scale | |
| Salinity | dS/m | QTL | Ecological | S.D. | 1 | 5 | 6 | 3 | 6 | Ordinal scale | ||
| Macronutrient: N | meq/100 gm | QTL | Ecological | S.D. | 2 | 2 | 2 | 1 | 2 | Ordinal scale | ||
| Macronutrient: P | meq/100 gm | QTL | Ecological | S.D. | 3 | 2 | 3 | 3 | 3 | Ordinal scale | ||
| Macronutrients: K | meq/100 gm | QTL | Ecological | S.D. | 6 | 4 | 3 | 2 | 4 | Ordinal scale | ||
| Soil pH | Ratio (no unit) | QTL | Ecological | S.D. | 1 | 3 | 4 | 2 | 4 | Ordinal scale | ||
| Water quality | Water salinity in surface water (quality of surface water for irrigation) | dS/m | QTL | Ecological | S.D. | 1 | 2 | 2 | 2 | 3 | Ordinal scale | |
| Water salinity in ground water (quality of ground water for irrigation) | dS/m | QTL | Ecological | S.D. | 1 | 2 | 2 | 4 | 3 | Ordinal scale | ||
| Arsenic concentration (quality of ground water for irrigation) | Ppm | QTL | Ecological | S.D. | 2 | 2 | 2 | 2 | 4 | Ordinal scale | ||
| Sustainability Category | Composite Indicator | Description | Unit | Data Type | Sustainability Pillar | Data Source | Agricultural Systems | Level of Measurement | ||||
|---|---|---|---|---|---|---|---|---|---|---|---|---|
| S | SR | R | I | T | ||||||||
| Efficiency | Monetary efficiency | Money input and output in the agro-ecosystem | $ output/$ input | QTL | Economic | Q.S. | 1.53 | 2.24 | 2.78 | 6.67 | 2.29 | Ratio scale |
| Energy efficiency | Overall energy efficiency | Ratio of energy output and input | QTL | Ecological | Q.S. | 1.37 | 2.01 | 5.53 | 5.54 | 5.9 | Ratio scale | |
| Non-renewable energy efficiency | Ratio of energy output and input | QTL | Ecological | Q.S. | 0.78 | 0.92 | 2.17 | 2.52 | 2.44 | Ratio scale | ||
| Sustainability Category | Composite Indicators | Description | Unit | Data Type | Sustainability Pillar | Data Source | Agricultural Systems | Level of Measurement | ||||
|---|---|---|---|---|---|---|---|---|---|---|---|---|
| S | SR | R | I | T | ||||||||
| Durability | Resistance to pest stress | Chemical response to pest stress | binary yes/no response | QUAL | Ecological | Q.S. | 1.78 | 4.17 | 4.24 | 5.45 | 6.54 | Nominal scale |
| Water availability at transplanting stage of rice | binary yes/no response | QUAL | Ecological | Q.S. | 0.75 | 0.75 | 0.2 | 0.2 | 0.2 | Nominal scale | ||
| Water availability at flowering stage of rice | binary yes/no response | QUAL | Ecological | Q.S. | 0.75 | 0.75 | 0.2 | 0.2 | 0.2 | Nominal scale | ||
| Farm management (soil test, pest management, land management, soil fertility management) | binary yes/no response | QUAL | Ecological | Q.S. | 0.67 | 0.83 | 1.69 | 1.36 | 0.0 | Nominal scale | ||
| Resistance to economic stress | Good product price | binary yes/no response | QUAL | economic | Q.S. | 8.44 | 5 | 4.58 | 4.55 | 3.8 | Nominal scale | |
| Availability of seeds | binary yes/no response | QUAL | Ecological | Q.S. | 9.33 | 9.5 | 10 | 10 | 8.85 | Nominal scale | ||
| Availability of market (market diversification) | Yes/no | QUAL | Social/economic | Q.S. | 10 | 9.17 | 8.47 | 10 | 7.69 | Nominal scale | ||
| Resistance to climate change | Agricultural training | binary yes/no response | QUAL | Social/ecological | Q.S. | 1.33 | 1.83 | 0.33 | 2.27 | 1.15 | Nominal scale | |
| Climate change awareness | binary yes/no response | QUAL | Social | Q.S. | 1.11 | 0.67 | 0.51 | 1.82 | 0 | Nominal scale | ||
| Advice from agricultural extension workers or NGO | binary yes/no response | QUAL | Ecological | Q.S. | 0.66 | 1.17 | 0.51 | 0.45 | 0.38 | Nominal scale | ||
| Sustainability Category | Composite Indicators | Description | Unit | Data Type | Sustainability Pillar | Data Source | Agricultural Systems | Level of Measurement | ||||
|---|---|---|---|---|---|---|---|---|---|---|---|---|
| S | SR | R | I | T | ||||||||
| Compatibility | Human Compatibility | Drinking water quality (protected) | binary yes/no response | QUAL | Ecological | Q.S. | 0 | 8 | 9 | 10 | 9 | Nominal scale |
| Illness from drinking water | binary yes/no response | QUAL | Ecological | Q.S. | 5 | 10 | 10 | 10 | 10 | Nominal scale | ||
| Biophysical Compatibility | Overall biodiversity condition: Percentage of non-crop area | % | QTL | Ecological | Q.S. | 7.54 | 6.48 | 23.01 | 15.73 | 18.68 | Ordinal scale | |
| Overall biodiversity condition: crop richness | number of crops | QTL | Ecological | Q.S. | 2 | 6 | 16 | 10 | 17 | Ordinal scale | ||
| Overall biodiversity condition: crop rotation | number | QTL | Ecological | Q.S. | 2 | 3 | 5 | 4 | 4 | Ordinal scale | ||
| Ecosystem connectivity | binary yes/no response | QUAL | Ecological | F.O. | 1 | 1 | 2 | 2 | 2 | Nominal scale | ||
| Sustainability Category | Composite Indicators | Description | Unit | Data Type | Sustainability Pillar | Data Source | Agricultural Systems | Level of Measurement | ||||
|---|---|---|---|---|---|---|---|---|---|---|---|---|
| S | SR | R | I | T | ||||||||
| Equity | Education | Education of farmers | % | QTL | Social | Q.S. | 8.56 | 9.25 | 4.75 | 10 | 5 | Ordinal scale |
| Education status of farmers’ male children | % | QTL | Social | Q.S. | 10 | 9.49 | 11.2 | 13.1 | 7.45 | Ordinal scale | ||
| Education status of farmers’ female children | % | QTL | Social | Q.S. | 9.07 | 10.54 | 11.17 | 12.5 | 6.36 | Ordinal scale | ||
| Access to electronic media | % | QTL | Social | Q.S. | 7.78 | 9.17 | 9.39 | 10 | 3.08 | Ordinal scale | ||
| Economic | Farm profitability (previously it was Income from agro ecosystem) | $ | QTL | Economic | Q.S. | 648.23 | 3340.55 | 1371.32 | 1992.39 | 1025.06 | Ratio scale | |
| Average wage of farm labourer ($) | $/person/day | QTL | Economic | Q.S. | 1.33 | 1.33 | 1.60 | 1.80 | 1.60 | Ratio scale | ||
| Livelihood diversity other than agriculture | Count, 0 to 5 | QTL | Economic | Q.S. | 6.22 | 4.33 | 5.93 | 4.55 | 6.92 | Ordinal scale | ||
| Years of economic hardship | No. of year | QTL | Economic | Q.S. | 0.73 | 0.73 | 0.91 | 0.82 | 0.64 | Ordinal scale | ||
| Road network (establishing farm roads and access roads) | access/not access | QTL | Economic/social | Q.S. | 2 | 3 | 3 | 3 | 1 | Nominal scale | ||
| Health | Settings where treatment is taken or public health | % | QTL | Social | Q.S. | 3.51 | 4.76 | 4.07 | 8.14 | 4.29 | Ordinal scale | |
| Sanitation or public health | % | QTL | social | Q.S. | 7.69 | 8.73 | 7.59 | 7.41 | 7.08 | Ordinal scale | ||
| Gender | Women’s involvement in decision making about agricultural activities | % | QTL | Social | Q.S. | 3 | 4 | 5 | 6.5 | 2.5 | Ordinal scale | |
| Gender-based wage differentials | $/person/day | QTL | Economic | Q.S. | 0.33 | 0.33 | 0.5 | 0.59 | 0 | Ratio scale | ||
References
- International Council for Science (ICSU); International Social Science Council (ISSC). Review of the Sustainable Development Goals: The Science Perspective; International Council for Science (ICSU): Paris, France, 2015; Available online: http://www.icsu.org/publications/reports-and-reviews/review-of-targets-for-the-sustainable-development-goals-the-science-perspective-2015/SDG-Report.pdf (accessed on 10 July 2016).
- Astier, M.; García-Barrios, L.; Galván-Miyoshi, Y.; González-Esquivel, C.E.; Masera, O.R. Assessing the Sustainability of Small Farmer Natural Resource Management Systems. A Critical Analysis of the MESMIS Program. Ecol. Soc. 2012, 17, 25. [Google Scholar]
- Pope, J.; Annandale, D.; Morrison-Saunders, A. Conceptualising sustainability assessment. Environ. Impact Assess. Rev. 2004, 24, 595–616. [Google Scholar] [CrossRef]
- IUCN—The World Conservation Union. IUCN Resource Kit for Sustainability Assessment. Part A: Overview Based on the Work of the IUCN /IDRC Sustainability Assessment Team Compiled and Written by Irene Guijt and Alex Moiseev with Robert Prescott-Allen. IUCN Monitoring and Evaluation Initiative, 2001. Available online: http://cmsdata.iucn.org/downloads/resource_kit_a_eng.pdf (accessed on 7 January 2015).
- Food and Agriculture Organization (FAO). Sustainability Assessment of Food and Agriculture Systems (SAFA) Guidelines; Natural Resources Management and Environment Department: Rome, Italy, 2012; Available online: http://www.fao.org/fileadmin/templates/nr/sustainability_pathways/docs/Reflections_SAFA_E_Forum_2012_final.pdf (accessed on 20 July 2015).
- Van Cauwenbergh, N.; Biala, K.; Bielders, C.; Brouckaert, V.; Franchois, L.; Garcia Cidad, V.; Hermy, M.; Mathijs, E.; Muys, B.; Reijnders, J.; et al. SAFE—A hierarchical framework for assessing the sustainability of agricultural systems. Agric. Ecosyst. Environ. 2007, 120, 229–242. [Google Scholar] [CrossRef]
- Häni, F.; Braga, F.; Stämpfli, A.; Keller, T.; Fischer, M.; Porsche, H. RISE, a tool for holistic sustainability assessment at the farm level. Int. Food Agribus. Manag. Rev. 2003, 6, 78–90. [Google Scholar]
- Eriksson, I.S.; Elmquist, H.; Nybrant, T. SALSA: A simulation tool to assess ecological sustainability of agricultural production. AMBIO 2005, 34, 388–392. [Google Scholar] [CrossRef] [PubMed]
- Gomez-Limon, J.A.; Sanchez-Fernandez, G. Empirical evaluation of agricultural sustainability using composite indicators. Ecol. Econ. 2010, 69, 1062–1075. [Google Scholar] [CrossRef]
- Zahm, F.; Viaux, P.; Vilain, L.; Girardin, P.; Mouchet, C. Assessing farm sustainability with the IDEA method-from the concept of agriculture sustainability to case studies on farms. Sustain. Dev. 2008, 16, 271–281. [Google Scholar] [CrossRef]
- Van Ittersum, M.K.; Ewert, F.; Heckelei, T.; Wery, J.; Olsson, J.A.; Andersen, E.; Bezlepkina, I.; Brouwer, F.; Donatelli, M.; Olsson, L. Integrated assessment of agricultural systems—A component-based framework for the European Union (SEAMLESS). Agric. Syst. 2008, 96, 150–165. [Google Scholar] [CrossRef]
- Dantsis, T.; Douma, C.; Giourga, C.; Loumou, A.; Polychronaki, E.A. A methodological approach to assess and compare the sustainability level of agricultural plant production systems. Ecol. Indic. 2010, 10, 256–263. [Google Scholar] [CrossRef]
- Talukder, B.; Saifuzzaman, M.; vanLoon, G.W. Sustainability of agricultural systems in the coastal zone of Bangladesh. Renew. Agric. Food Syst. 2016, 31, 148–165. [Google Scholar] [CrossRef]
- Velasquez, M.; Hester, P.T. An analysis of multi-criteria decision making methods. Int. J. Oper. Res. 2013, 10, 56–66. [Google Scholar]
- Cinelli, M.; Coles, S.R.; Kirwan, K. Analysis of the potentials of multi criteria decision analysis methods to conduct sustainability assessment. Ecol. Indic. 2014, 46, 138–148. [Google Scholar] [CrossRef]
- Köksalan, M.; Wallenius, J.; Zionts, S. Multiple Criteria Decision Making: From Early History to the 21st Century; World Scientific: Singapore, 2011. [Google Scholar]
- Ishizaka, A.; Pearman, C.; Nemery, P. AHP Sort: An AHP-based method for sorting problems. Int. J. Prod. Res. 2012, 50, 4767–4784. [Google Scholar] [CrossRef]
- Hipel, K.W.; Radford, K.J.; Fang, L. Multiple Participant‑Multiple Criteria Decision Making. IEEE Trans. Syst. Man Cybern. 1993, 23, 1184–1189. [Google Scholar] [CrossRef]
- Herath, G.; Prato, T. Role of Multi-Criteria Decesion making in Natual Resource Management. In Using Multi-Criteria Decision Analysis in Natural Resource Management; Herath, G., Prato, T., Eds.; Ashgate Publishing, Ltd.: Farnham, UK, 2006. [Google Scholar]
- Chen, Y.; Kilgour, D.M.; Hipel, K.W. Screening in multiple criteria decision analysis. Decis. Support Syst. 2008, 45, 278–290. [Google Scholar] [CrossRef]
- Keeney, R.; Raiffa, H. Decisions with Multiple Objectives: Preferences and Value Tradeoffs; Cambridge University Press: New York, NY, USA, 1993. [Google Scholar]
- Brans, J.P.; Mareschal, B. PROMETHEE methods. In Multiple Criteria Decision Analysis: State of the Art Surveys; Springer: New York, NY, USA, 2005; pp. 163–186. [Google Scholar]
- Kuang, H.; Kilgour, D.M.; Hipel, K.W. Grey-based PROMTHEE II with Application to Evaluation of Source Water Protection Strategies. Inf. Sci. 2015, 294, 376–389. [Google Scholar] [CrossRef]
- Figueira, J.; Mousseau, V.; Roy, B. ELECTRE methods. In Multiple Criteria Decision Analysis: State of the Art Surveys; Springer: New York, NY, USA, 2005; pp. 133–153. [Google Scholar]
- Saaty, T.L. The Analytic Hierarchy Process, New York: McGraw Hill. International, Revised ed.; RWS Publications: Pittsburgh, PA, USA, 2000. [Google Scholar]
- Saaty, T.L.; Peniwati, K. Group Decision Making: Drawing out and Reconciling Differences; RWS Publications: Pittsburgh, PA, USA, 2013. [Google Scholar]
- Doumpos, M.; Grigoroudis, E. Multicriteria Decision Aid and Artificial Intelligence: Links, Theory and Applications; John Wiley & Sons: Hoboken, NJ, USA, 2013. [Google Scholar]
- Hipel, K.W. Fuzzy Multicriteria Modelling. Invited paper in Systems and Control Encyclopaedia, Theory, Technology and Applications; Singh, M.G., Ed.; Pergamon Press: Oxford, UK, 1987; pp. 1826–1829. [Google Scholar]
- MacCrimmon, K.R. An Overview of Multiple-Objective Decision-Making. In Multiple-Criteria Decision-Making; Cochrance, J.L., Zeleny, M., Eds.; University of South Carolina Press: Columbia, SC, USA, 1973; pp. 18–44. [Google Scholar]
- Radford, K.J. Individual and Small Group Decisions; Springer: New York, NY, USA, 1989. [Google Scholar]
- Chen, Y. Multiple Criteria Decision Analysis: Classification Problems and Solutions. Ph.D. Dissertation, University of Waterloo, Waterloo, ON, Canada, 2006. [Google Scholar]
- Ma, J.; Hipel, K.W.; De, M.; Cai, J. Transboundary water policies: Assessment, comparison and enhancement. Water Resour. Manag. 2008, 22, 1069–1087. [Google Scholar] [CrossRef]
- Acosta-Alba, I.; Van der Werf, H.M.G. The use of reference values in indicator-based methods for the environmental assessment of agricultural systems. Sustainability 2011, 3, 424–442. [Google Scholar] [CrossRef]
- Hipel, K.H. Multiple Participant Multiple Criteria Decision Making; SYDE 433. Fall 2013. 396 Courseware; Waterloo University: Waterloo, ON, Canada, 2013. [Google Scholar]
- Talukder, B. Sustainability of Changing Agricultural Systems in the Coastal Zone of Bangladesh. Master’s Thesis, Queen’s University, Kingston, ON, Canada, 2012. [Google Scholar]
- Bangladesh Bureau of Statistics (BBS). 2012 Statistical Yearbook of Bangladesh; Ministry of Planning: Dhaka, Bangladesh, 2013. [Google Scholar]
- Van Loon, G.W.; Patil, S.G.; Hugar, L.B. Agricultural Sustainability: Strategies for Assessment; SAGE Publications: New Delhi, India, 2005. [Google Scholar]
- Hossain, M.S.; Uddin, M.J.; Fakhruddin, A.N. M. Impacts of shrimp farming on the coastal environment of Bangladesh and approach for management. Rev. Environ. Sci. Bio/Technol. 2013, 12, 313–332. [Google Scholar] [CrossRef]
- Rahman, S.; Barmon, B.K. Energy productivity and efficiency of the ‘gher’ (prawn-fish-rice) farming system in Bangladesh. Energy 2012, 43, 293–300. [Google Scholar] [CrossRef]
- Munda, G. Social Multi-Criteria Evaluation for a Sustainable Economy; Springer: Berlin, Germany, 2008. [Google Scholar]
- Marta-Costa, A.A.; Silva, E. Methods and Procedures for Building Sustainable Farming Systems: Application in the European Context; Springer Science and Business Media: Berlin, Germany, 2012. [Google Scholar]

| Name of Method | Purpose | Some Advantages | Some Disadvantages |
|---|---|---|---|
| SAFA (Sustainability Assessment of Food and Agricultural Systems) [5] | It is a guideline for Sustainability Assessment of Food and Agriculture Systems. It is a general framework for assessing sustainability of food and agriculture systems and takes an umbrella approach. It builds on existing systems that facilitate transparency. It assesses performance, not improvements of the system. | It supports a sustainability management that facilitates progress towards production to processing and distribution of food and agricultural products. The guiding vision of this method is to promote sustainable agriculture systems characterised by “environmental integrity, economic resilience, social well-being and good governance” [5] (p. 1). It is a globally applicable template. It is credible because of institutional independence [5]. | It is in the development process and has been applied in few studies. Not all indicators are acceptable by all farming systems of the world. |
| SAFE [6] (A hierarchical framework for assessing the sustainability of agricultural systems) | SAFE is a dependable and wide-ranging framework of principles, criteria and indicators and reference values structured for sustainability assessment of agricultural systems. It identifies, develops and evaluates the production systems, techniques and policies of agriculture. | The framework is capable of assessing agricultural sustainability at the parcel, farm and higher spatial levels. It is developed in a hierarchical and structured way so it is able to assess the sustainability of agricultural systems. It encompasses the three dimensions of sustainability. | It is not designed to find an answer of agricultural sustainability as a whole. It does not measure the interaction of the three SD’s pillars. |
| RISE [7] (Response-Inducing Sustainability Evaluation model) | A tool that allows easy assessment of sustainability at the farm level. | It offers a holistic approach by covering agricultural sustainability aspects (ecological, economic and social). It is able to quantify the sustainability level of agricultural systems. It is globally applicable. | It is based on 12 indicators only. It does not measure the interaction of the indicators. |
| SALSA (A Simulation Tool to Assess Ecological Sustainability of Agricultural Production) [8] | It helps to assess the ecological sustainability of a farm’s agricultural production system. It is based on life-cycle assessment methodology. | It helps in complex studies of agricultural production systems as it is able to capture the consequences of agricultural production management options. | Concentrates on environmental issues only. Used in Switzerland. |
| EVAS (Empirical Evaluation of Agricultural Sustainability) [9] | It aims to develop a practical methodology for evaluating the sustainability of farms by means of composite indicators. | It evaluates and aims to improve the three dimensions of farm sustainability. This assessment helps to improve current agriculture-related policies such as income, agricultural structure and rural development. | Only 16 indicators cover the three components of the sustainability concept. |
| IDEA (Indicateurs de Durabilité des Exploitations Agricoles or Farm Sustainability Indicators) [10] | The IDEA method is based on research work conducted since 1998 in France. It gives a practical expression to the concept of sustainable farms. This method supports farmers as well as policy makers to assess sustainable agriculture and support it. It is based on the three different scales of sustainability. | It provides an operational tool for sustainability assessment at the farm level through 41 sustainability indicators covering the three dimensions of sustainability. It can be linked with the Farm Accounting Data Network of France which opens an interesting possibility to assess the sustainability levels of different farming systems. It concentrates on economic viability, social liveability and environmental reproducibility. | There are many models of farm sustainability, therefore while using this method the indicators must be adapted to local farming. It is based on a case study in France. |
| SEAMLESS (Integrated assessment of agricultural systems—A component-based framework for the European Union) [11] | This framework “aims to assess, ex-ante, agricultural and agri-environmental policies and technologies across a range of scales, from field-farm to region up to the European Union, as well as some global interactions”. “It links individual model and data components and a software infrastructure that allows a flexible (re-) use and linkage of components” [11] (p. 150). | “It addresses the four identified challenges for integrated assessment tools, i.e., linking micro and macro analysis, assessing economic, environmental, social and institutional indicators, (re-)using standalone model components for field, farm and market analysis and their conceptual and technical linkage” [1] (p.150). | Based on the European context. |
| Category | Sl. No. | Criteria | Reference Values | Agricultural Systems | ||||
|---|---|---|---|---|---|---|---|---|
| S | SR | R | I | T | ||||
| Productivity | 1 | Weighted yield of the main staple crop | 6.51 | 2.26 | 4.41 | 5.23 | 6.51 | 2.86 |
| 2 | Net income from the agro-ecosystem | 1806.04 | 311.15 | 1020.37 | 1585.81 | 1806.04 | 544.01 | |
| 3 | Protein yield from the agro-ecosystem | 552 | 68.42 | 147.23 | 552 | 373.01 | 318.87 | |
| Stability | 4 | Land exposure to natural events: cyclone | 2 | 1 | 2 | 2 | 2 | 1 |
| 5 | Land exposure to natural events: saline water | 3 | 1 | 1 | 3 | 2 | 3 | |
| 6 | Land exposure to natural events: drought in kharif to rabi season | 3.5 | 1.5 | 1.5 | 2 | 2 | 3.5 | |
| 7 | Land exposure to natural events: river bank erosion | 2 | 2 | 2 | 2 | 2 | 1 | |
| 8 | Stability of embankment | 2 | 1 | 2 | 1 | 2 | 2 | |
| 9 | Withdrawal of upstream water | 2 | 1 | 1 | 1 | 1 | 2 | |
| 10 | Organic materials | 4 | 4 | 4 | 2 | 3 | 2 | |
| 11 | Salinity | 6 | 1 | 5 | 6 | 3 | 6 | |
| 12 | Macronutrient: N | 2 | 2 | 2 | 2 | 1 | 2 | |
| 13 | Macronutrient: P | 3 | 3 | 2 | 3 | 3 | 3 | |
| 14 | Macronutrient: K | 6 | 6 | 4 | 3 | 2 | 4 | |
| 15 | Soil pH | 4 | 1 | 3 | 4 | 2 | 4 | |
| 16 | Water salinity in surface water (quality of surface water for irrigation) | 3 | 1 | 2 | 2 | 2 | 3 | |
| 17 | Water salinity in ground water (quality of ground water for irrigation) | 4 | 1 | 2 | 2 | 4 | 3 | |
| 18 | Arsenic concentration (quality of ground water for irrigation) | 4 | 2 | 2 | 2 | 2 | 4 | |
| Efficiency | 19 | Money input and output in the agro-ecosystem | 6.67 | 1.53 | 2.24 | 2.78 | 6.67 | 2.29 |
| 20 | Overall energy efficiency | 5.9 | 1.37 | 2.01 | 5.53 | 5.54 | 5.9 | |
| 21 | Non-renewable energy efficiency | 2.52 | 0.78 | 0.92 | 2.17 | 2.52 | 2.44 | |
| Durability | 22 | Chemical response to pest stress | 6.54 | 1.78 | 4.17 | 4.24 | 5.45 | 6.54 |
| 23 | Water availability at transplanting stage of rice | 0.75 | 0.75 | 0.75 | 0.2 | 0.2 | 0.2 | |
| 24 | Water availability at flowering stage of rice | 0.75 | 0.75 | 0.75 | 0.2 | 0.2 | 0.2 | |
| 25 | Farm management (soil test, pest management, land management, soil fertility management) | 1.69 | 0.67 | 0.83 | 1.69 | 1.36 | 0 | |
| 26 | Good product price | 8.44 | 8.44 | 5 | 4.58 | 4.55 | 3.8 | |
| 27 | Availability of seeds | 10 | 9.33 | 9.5 | 10 | 10 | 8.85 | |
| 28 | Availability of market (market diversification) | 10 | 10 | 9.17 | 8.47 | 10 | 7.69 | |
| 29 | Agricultural training | 2.27 | 1.33 | 1.83 | 0.33 | 2.27 | 1.15 | |
| 30 | Climate change awareness | 1.82 | 1.11 | 0.67 | 0.51 | 1.82 | 0 | |
| 31 | Advice from agricultural extension workers or NGO | 1.17 | 0.66 | 1.17 | 0.51 | 0.45 | 0.38 | |
| Compatibility | 32 | Drinking water quality (protected) | 10 | 0 | 8 | 9 | 10 | 9 |
| 33 | Illness from drinking water | 10 | 5 | 10 | 10 | 10 | 10 | |
| 34 | Overall biodiversity condition: percentage of non-crop area | 23.01 | 7.54 | 6.48 | 23.01 | 15.73 | 18.68 | |
| 35 | Overall biodiversity condition: crop richness | 17 | 2 | 6 | 16 | 10 | 17 | |
| 36 | Overall biodiversity condition: crop rotation | 5 | 2 | 3 | 5 | 4 | 4 | |
| 37 | Ecosystem connectivity | 2 | 1 | 1 | 2 | 2 | 2 | |
| Equity | 38 | Education of farmers | 10 | 8.56 | 9.25 | 4.75 | 10 | 5 |
| 39 | Education status of farmers’ male children | 13.1 | 10 | 9.49 | 11.2 | 13.1 | 7.45 | |
| 40 | Education status of farmers’ female children | 12.5 | 9.07 | 10.54 | 11.17 | 12.5 | 6.36 | |
| 41 | Access to electronic media | 10 | 7.78 | 9.17 | 9.39 | 10 | 3.08 | |
| 42 | Farm profitability | 3340.55 | 648.23 | 3340.55 | 1371.32 | 1992.39 | 1025.06 | |
| 43 | Average wage of farm labourer ($) | 1.8 | 1.33 | 1.33 | 1.6 | 1.8 | 1.6 | |
| 44 | Livelihood diversity other than agriculture | 6.92 | 6.22 | 4.33 | 5.93 | 4.55 | 6.92 | |
| 45 | Years of economic hardship | 0.91 | 0.73 | 0.73 | 0.91 | 0.82 | 0.64 | |
| 46 | Road network [establishing farm roads and access roads] | 3 | 2 | 3 | 3 | 3 | 1 | |
| 47 | Availability of medical treatment or public health | 8.14 | 3.51 | 4.76 | 4.07 | 8.14 | 4.29 | |
| 48 | Sanitation or public health | 8.73 | 7.69 | 8.73 | 7.59 | 7.41 | 7.08 | |
| 49 | Women’s involvement in decision making about agricultural activities | 6.5 | 3 | 4 | 5 | 6.5 | 2.5 | |
| 50 | Gender-based wage differentials | 0.59 | 0.33 | 0.33 | 0.5 | 0.59 | 0 | |
| Category | Sl. No. | Criteria | Reference Values | Agricultural Systems | ||||
|---|---|---|---|---|---|---|---|---|
| S | SR | R | I | T | ||||
| Productivity | 1 | Weighted yield of the main staple crop | 6.51 | X | X | X | X | |
| 2 | Net income from the agro-ecosystem | 1806.04 | X | X | X | X | ||
| 3 | Protein yield from the agro-ecosystem | 552 | X | X | X | X | ||
| Stability | 4 | Land exposure to natural events: cyclone | 2 | X | X | |||
| 5 | Land exposure to natural events: saline water | 3 | X | X | X | |||
| 6 | Land exposure to natural events: drought in kharif to rabi season | 3.5 | X | X | X | X | ||
| 7 | Land exposure to natural events: river bank erosion | 2 | X | |||||
| 8 | Stability of embankment | 2 | X | X | ||||
| 9 | Withdrawal of upstream water | 2 | X | X | X | X | ||
| 10 | Organic materials | 4 | X | X | X | |||
| 11 | Salinity | 6 | X | X | X | |||
| 12 | Macronutrient: N | 2 | X | |||||
| 13 | Macronutrient: P | 3 | X | |||||
| 14 | Macronutrient: K | 6 | X | X | X | X | ||
| 15 | Soil pH | 4 | X | X | X | |||
| 16 | Water salinity in surface water (quality of surface water for irrigation) | 3 | X | X | X | X | ||
| 17 | Water salinity in ground water (quality of ground water for irrigation) | 4 | X | X | X | X | ||
| 18 | Arsenic concentration (quality of ground water for irrigation) | 4 | X | X | X | X | ||
| Efficiency | 19 | Money input and output in the agro-ecosystem | 6.67 | X | X | X | X | |
| 20 | Overall energy efficiency | 5.9 | X | X | X | X | ||
| 21 | Non-renewable energy efficiency | 2.52 | X | X | X | X | ||
| Durability | 22 | Chemical response to pest stress | 6.54 | X | X | X | X | |
| 23 | Water availability at transplanting stage of rice | 0.75 | X | X | X | |||
| 24 | Water availability at flowering stage of rice | 0.75 | X | X | X | |||
| 25 | Farm management (soil test, pest management, land management, soil fertility management) | 1.69 | X | X | X | X | ||
| 26 | Good product price | 8.44 | X | X | X | X | ||
| 27 | Availability of seeds | 10 | X | X | X | |||
| 28 | Availability of market (market diversification) | 10 | X | X | X | |||
| 29 | Agricultural training | 2.27 | X | X | X | X | ||
| 30 | Climate change awareness | 1.82 | X | X | X | X | ||
| 31 | Advice from agricultural extension workers or NGO | 1.17 | X | X | X | X | ||
| Compatibility | 32 | Drinking water quality (protected) | 10 | X | X | X | X | |
| 33 | Illness from drinking water | 10 | X | |||||
| 34 | Overall biodiversity condition: percentage of non-crop area | 23.01 | X | X | X | x | ||
| 35 | Overall biodiversity condition: crop richness | 17 | X | X | X | X | ||
| 36 | Overall biodiversity condition: crop rotation | 5 | X | X | X | X | ||
| 37 | Ecosystem connectivity | 2 | X | X | ||||
| Equity | 38 | Education of farmers | 10 | X | X | X | X | |
| 39 | Education status of farmers’ male children | 13.1 | X | X | X | X | ||
| 40 | Education status of farmers’ female children | 12.5 | X | X | X | X | ||
| 41 | Access to electronic media | 10 | X | X | X | X | ||
| 42 | Farm profitability | 3340.55 | X | X | X | X | ||
| 43 | Average wage of farm labourer ($) | 1.8 | X | X | X | X | ||
| 44 | Livelihood diversity other than agriculture | 6.92 | X | X | X | X | ||
| 45 | Years of economic hardship | 0.91 | X | X | X | X | ||
| 46 | Road network (establishing farm roads and access roads) | 3 | X | X | ||||
| 47 | Availability of medical treatment or public health | 8.14 | X | X | X | X | ||
| 48 | Sanitation or public health | 8.73 | X | X | X | X | ||
| 49 | Women’s involvement in decision making about agricultural activities | 6.5 | X | X | X | X | ||
| 50 | Gender-based wage differentials | 0.59 | X | X | X | X | ||
© 2017 by the authors. Licensee MDPI, Basel, Switzerland. This article is an open access article distributed under the terms and conditions of the Creative Commons Attribution (CC BY) license ( http://creativecommons.org/licenses/by/4.0/).
Share and Cite
Talukder, B.; Blay-Palmer, A.; Hipel, K.W.; VanLoon, G.W. Elimination Method of Multi-Criteria Decision Analysis (MCDA): A Simple Methodological Approach for Assessing Agricultural Sustainability. Sustainability 2017, 9, 287. https://doi.org/10.3390/su9020287
Talukder B, Blay-Palmer A, Hipel KW, VanLoon GW. Elimination Method of Multi-Criteria Decision Analysis (MCDA): A Simple Methodological Approach for Assessing Agricultural Sustainability. Sustainability. 2017; 9(2):287. https://doi.org/10.3390/su9020287
Chicago/Turabian StyleTalukder, Byomkesh, Alison Blay-Palmer, Keith W. Hipel, and Gary W. VanLoon. 2017. "Elimination Method of Multi-Criteria Decision Analysis (MCDA): A Simple Methodological Approach for Assessing Agricultural Sustainability" Sustainability 9, no. 2: 287. https://doi.org/10.3390/su9020287
APA StyleTalukder, B., Blay-Palmer, A., Hipel, K. W., & VanLoon, G. W. (2017). Elimination Method of Multi-Criteria Decision Analysis (MCDA): A Simple Methodological Approach for Assessing Agricultural Sustainability. Sustainability, 9(2), 287. https://doi.org/10.3390/su9020287