
Evaluating Resiliency of Supply Chain Network: A Data Envelopment Analysis Approach


Abstract
:1. Introduction
2. Literature Review
2.1. Conceptual Foundation
2.2. Measuring Resiliency of Supply Chain
3. Methodology
3.1. DEA Model
- (1)
- There is no measurement error in the data.
- (2)
- If DMUs (network configurations) are observed to operate with certain input and output sets, the combination of the input and outputs sets are also operable (convexity).
- (3)
- If a specific network configuration can operate with a certain input and output set, it can also operate at a point that uses larger input and yields less output (strong disposability).
3.2. Selected Variables
3.2.1. Positive Factor
Available Capacity
Node Degree and Clustering Coefficient
Number of Supply Nodes
3.2.2. Negative Factor
3.2.3. External Factor
4. Application of the Model to a Case Study in Korea
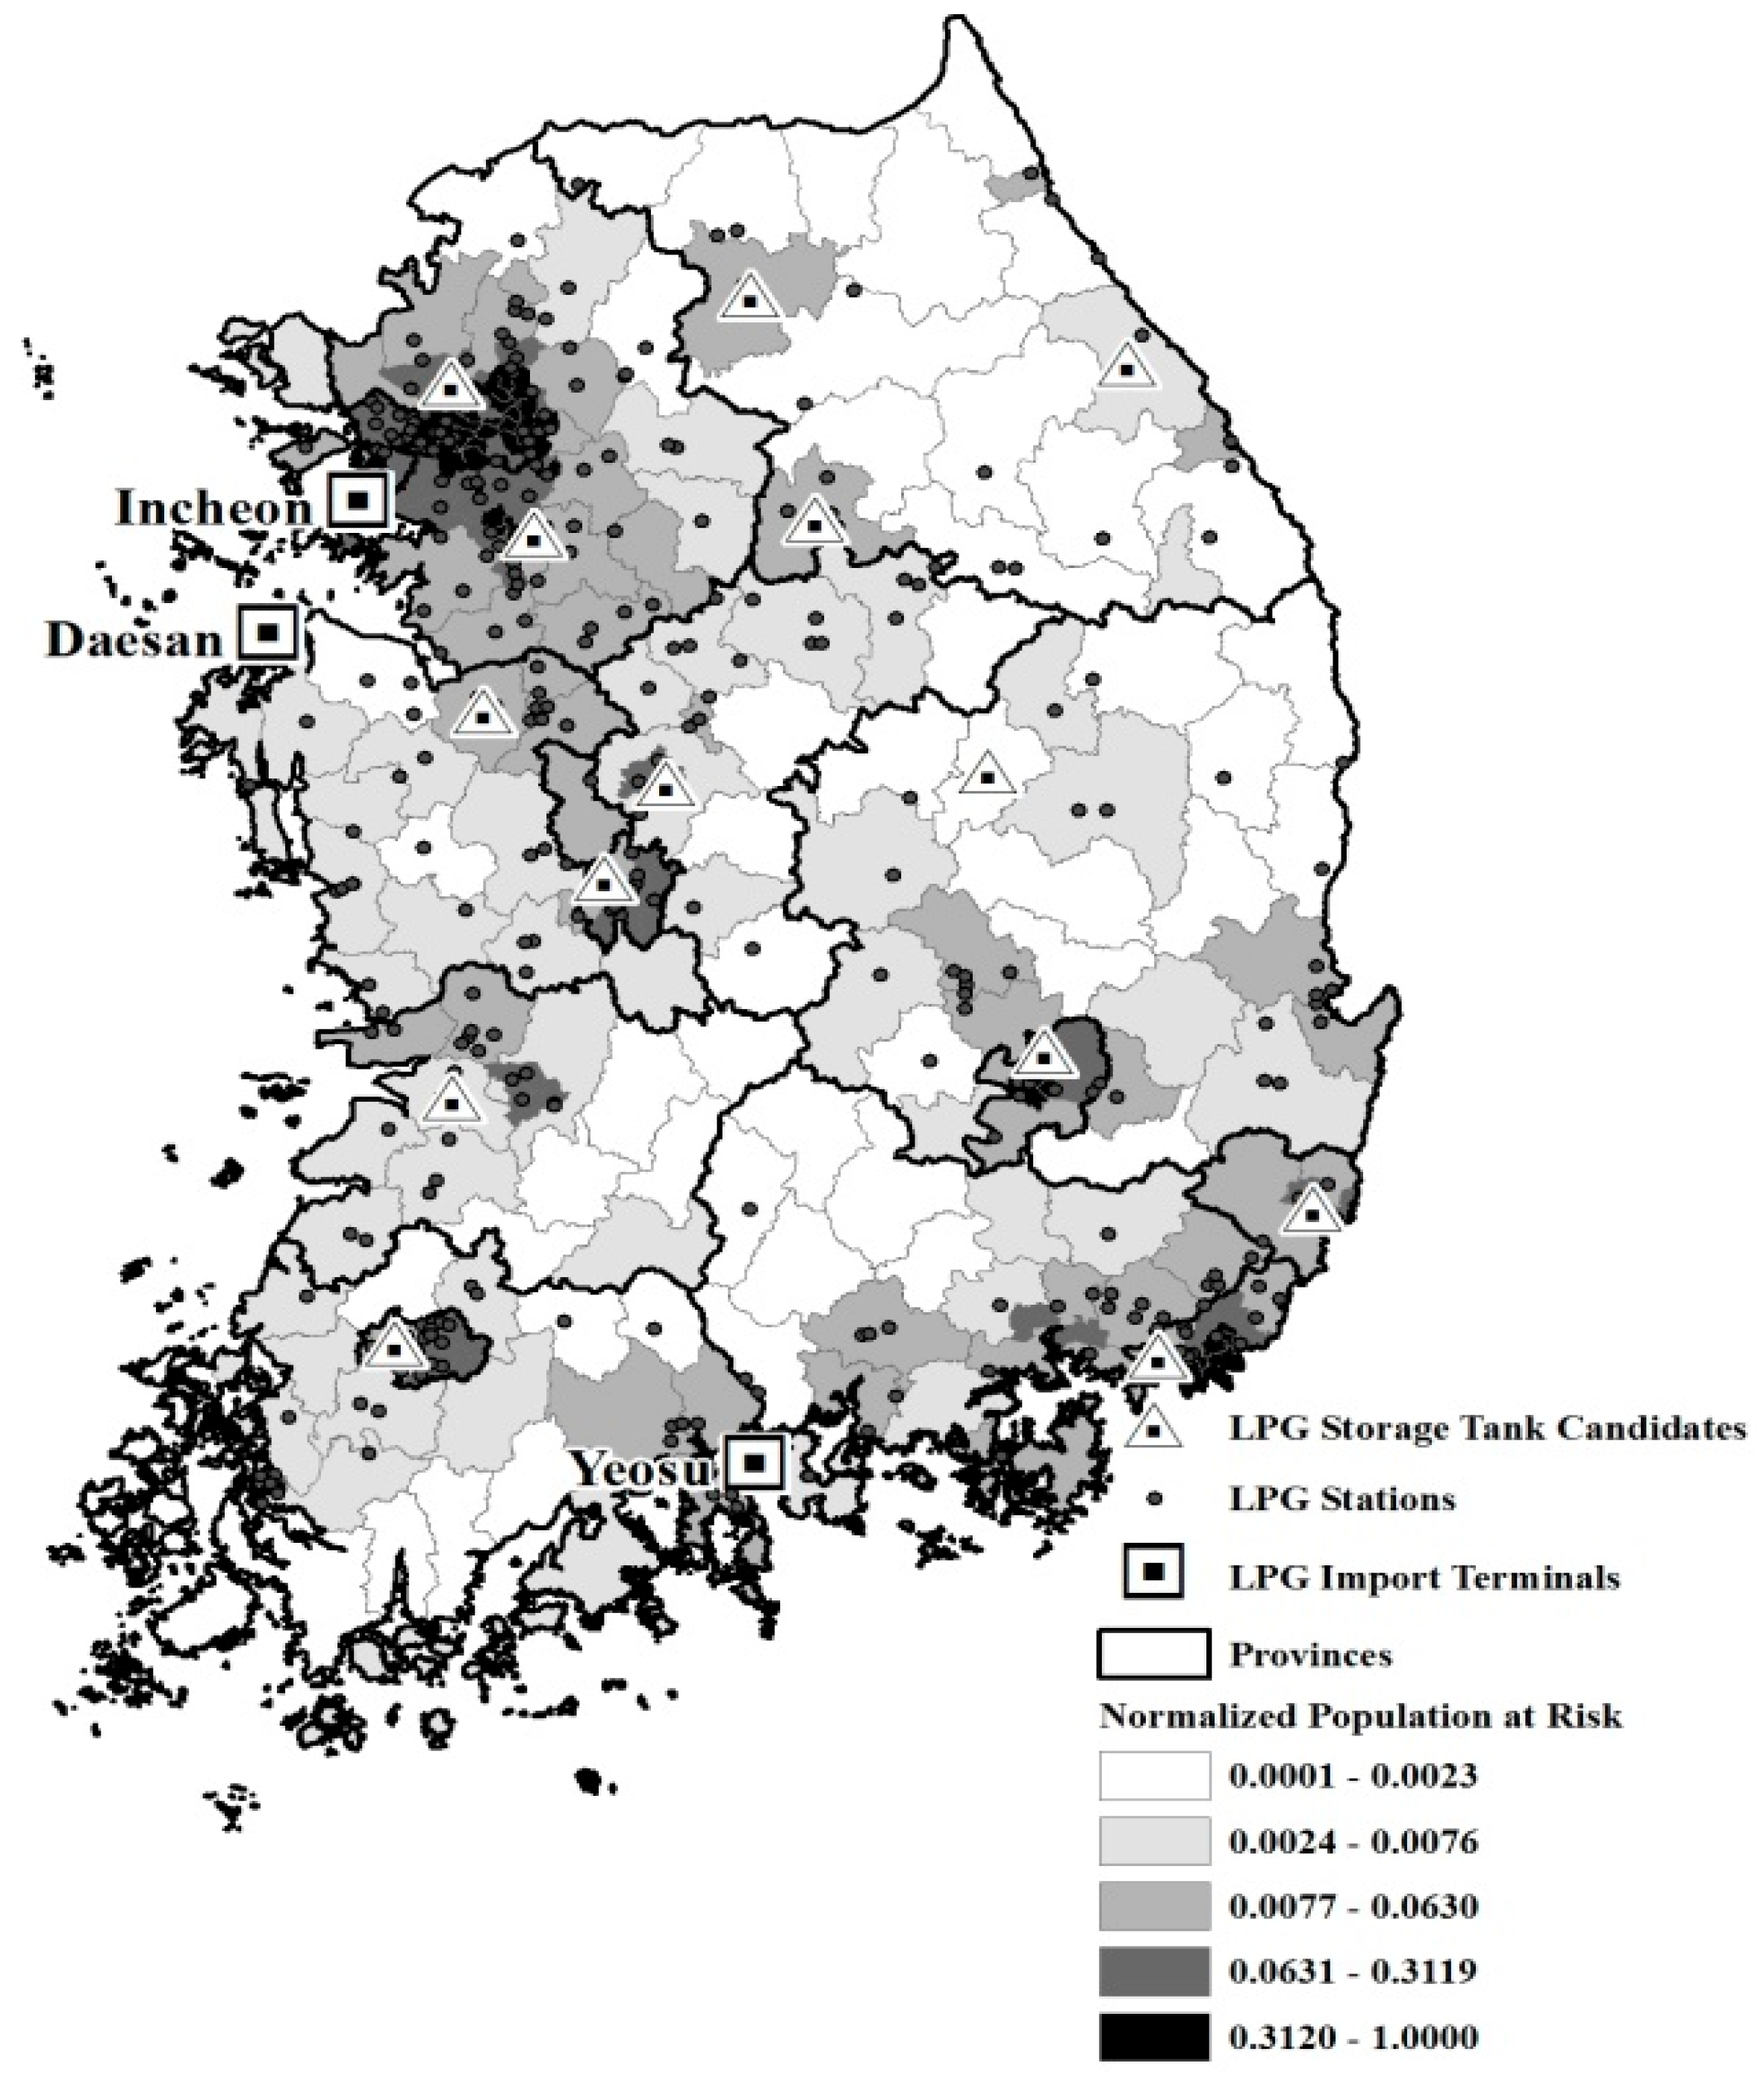
4.1. Case Study: LPG Supply Chain in Korea
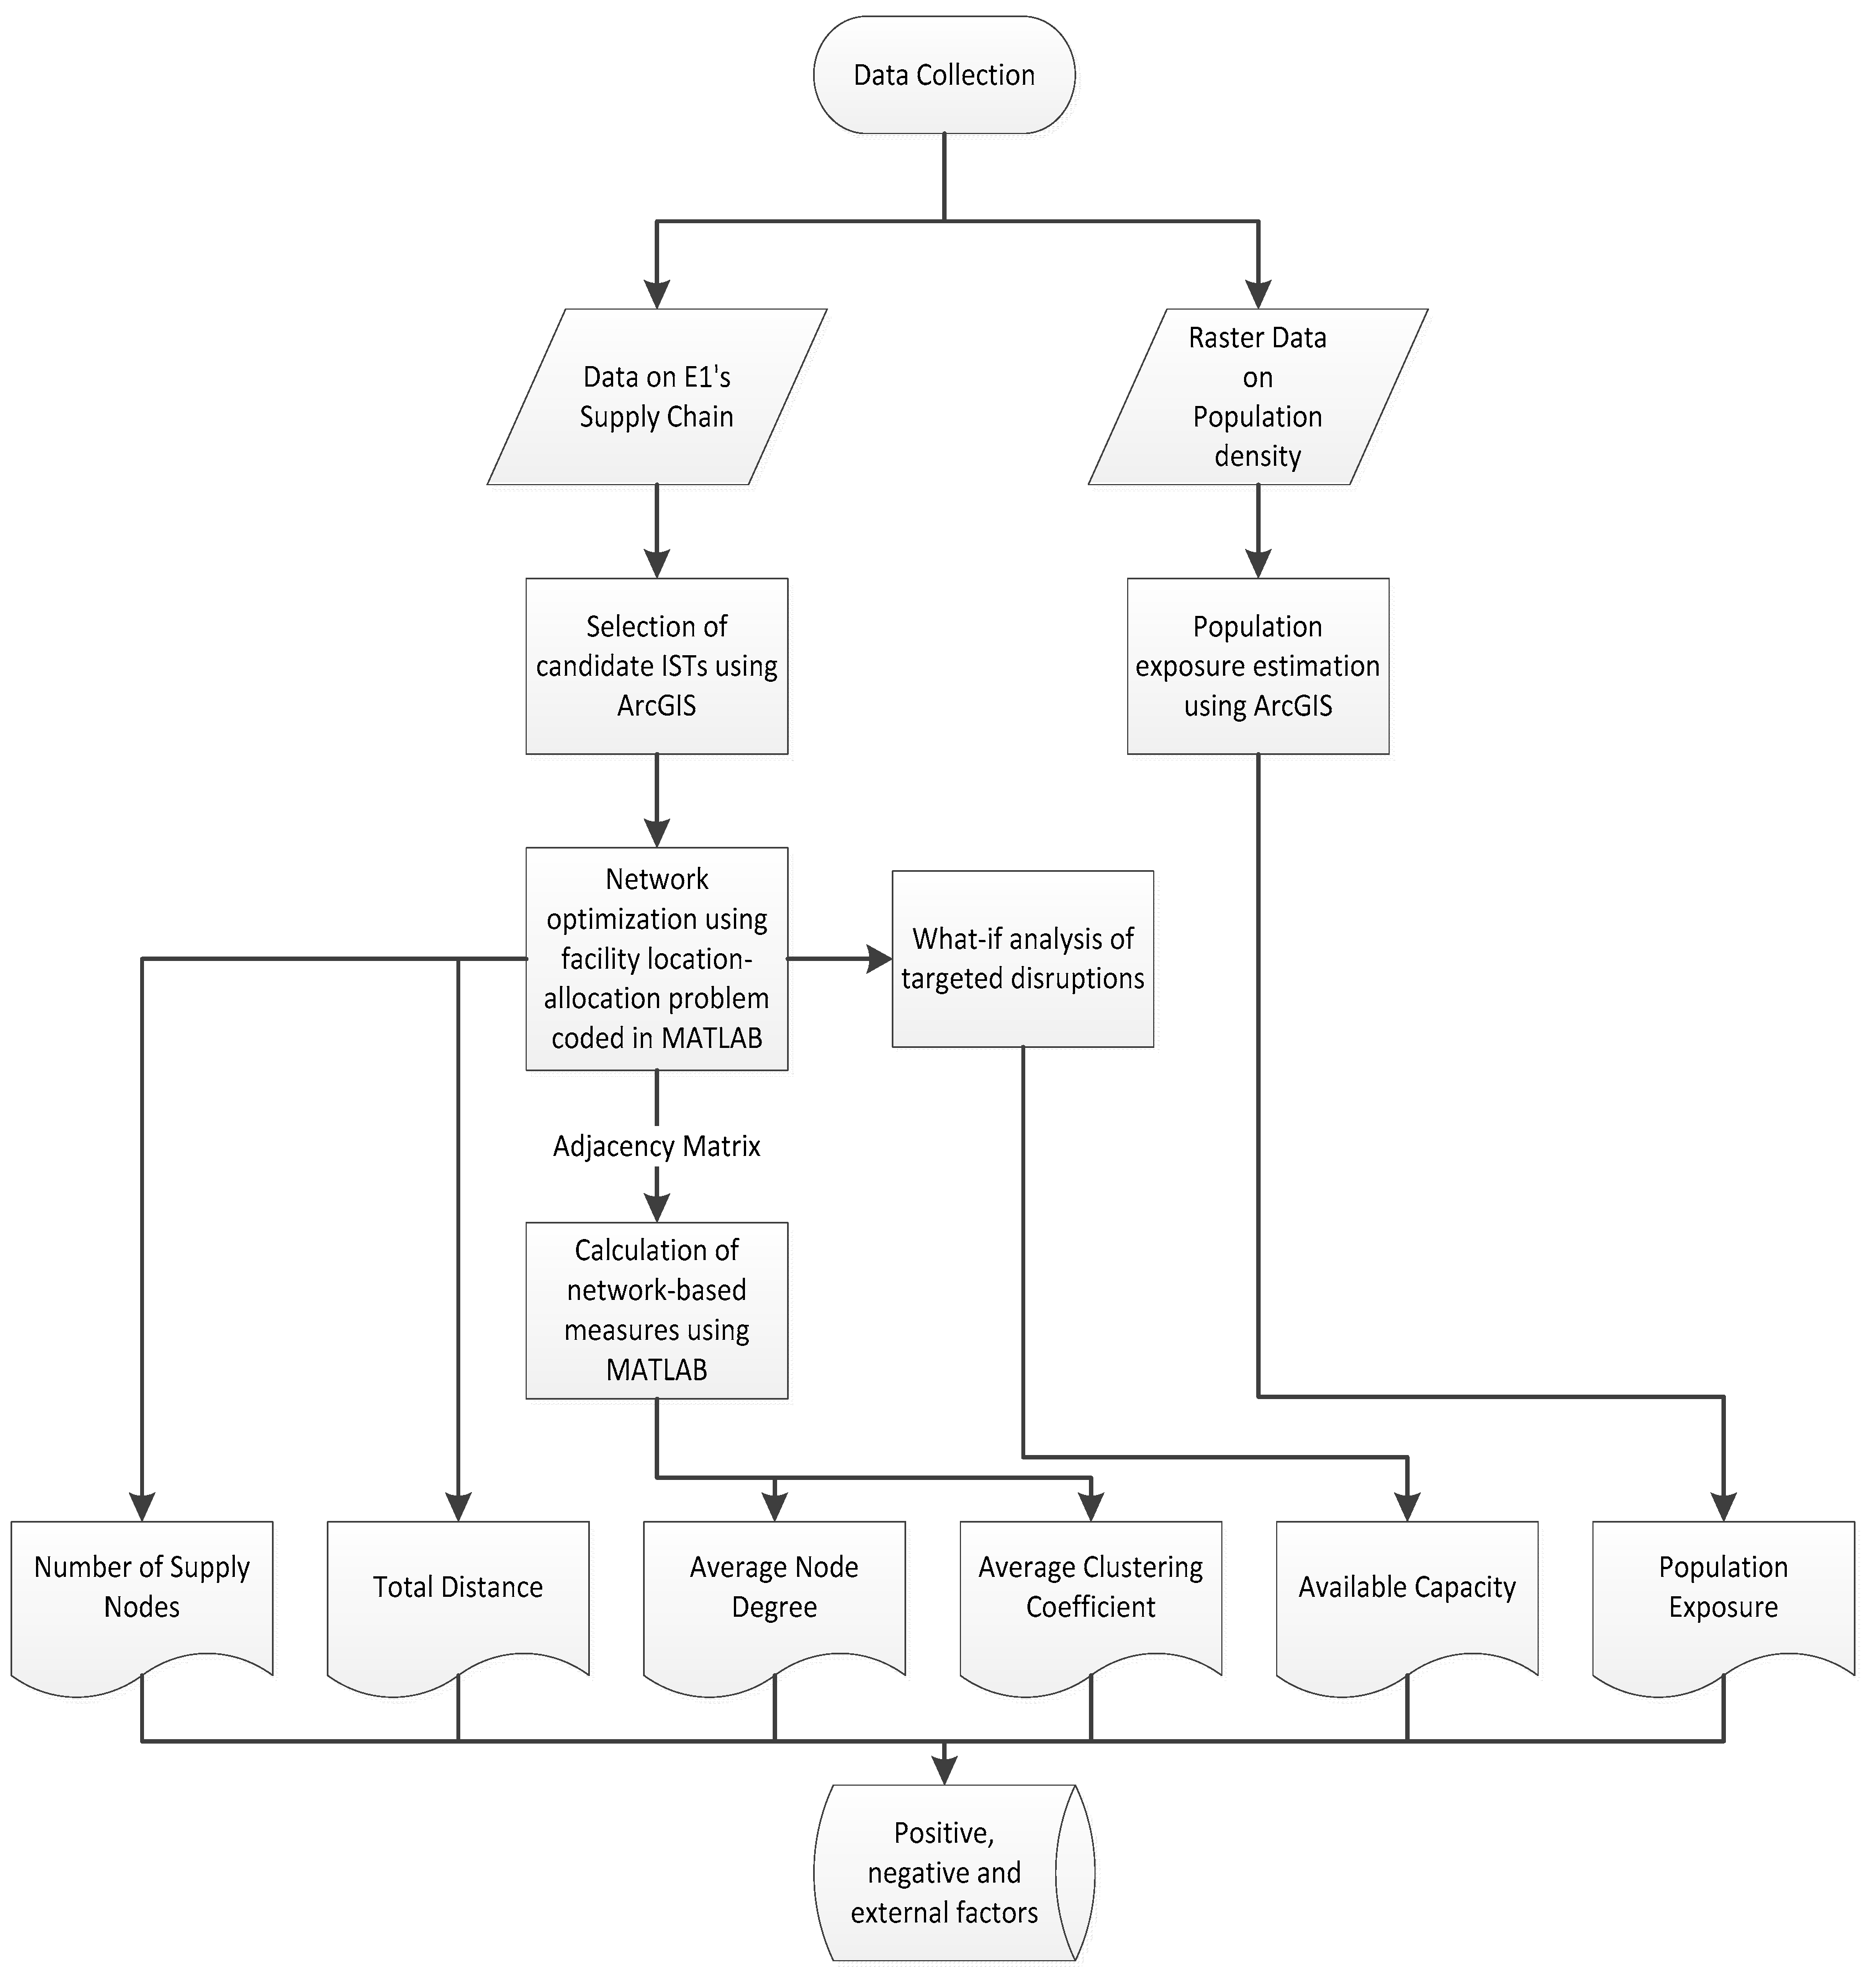
4.2. Data Collection
5. Results and Discussion
6. Conclusions
Appendix A. Hub Location Allocation Model
Acknowledgements
Author Contributions
Conflicts of Interest
References
- Pourhejazy, P.; Kwon, O.K. The New Generation of Operations Research Methods in Supply Chain Optimization: A Review. Sustainability 2016, 8, 1033. [Google Scholar] [CrossRef]
- Christopher, M.; Towill, D. An Integrated Model for the Design of Agile Supply Chains. Int. J. Phys. Distrib. Logist. Manag. 2001, 31, 235–246. [Google Scholar] [CrossRef]
- Mason-Jones, R.; Naylor, B.; Towill, D.R. Lean, Agile or Leagile? Matching Your Supply Chain to the Marketplace. Int. J. Prod. Res. 2000, 38, 4061–4070. [Google Scholar] [CrossRef]
- Lamming, R. Squaring Lean Supply with Supply Chain Management. Int. J. Phys. Distrib. Logist. Manag. 1996, 16, 183–196. [Google Scholar] [CrossRef]
- Naylor, J.B.; Naim, M.M.; Berry, D. Leagility: Integrating the Lean and Agile Manufacturing Paradigms in the Total Supply Chain. Int. J. Prod. Econ. 1999, 62, 107–118. [Google Scholar] [CrossRef]
- Sheffi, Y. Supply Chain Management under the Threat of International Terrorism. Int. J. Logist. Manag. 2001, 12, 1–11. [Google Scholar] [CrossRef]
- Lee, H.L. The Triple—A Supply Chain. Harv. Bus. Rev. 2004, 82, 102–113. [Google Scholar] [PubMed]
- Ponomarov, S.Y.; Holcomb, M.C. Understanding the Concept of Supply Chain Resilience. Int. J. Logist. Manag. 2009, 20, 124–143. [Google Scholar] [CrossRef]
- Sheffi, Y.; Rice, J.B., Jr. A Supply Chain View of the Resilient Enterprise. MIT Sloan Manag. Rev. 2005, 47, 41. [Google Scholar]
- Sheffi, Y. The Resilient Enterprise: Overcoming Vulnerability for Competitive Advantage; MIT Press Books: Cambridge, MA, USA, 2005; Volume 1. [Google Scholar]
- Hohenstein, N.; Feisel, E.; Hartmann, E.; Giunipero, L. Research on the Phenomenon of Supply Chain Resilience: A Systematic Review and Paths for further Investigation. Int. J. Phys. Distrib. Logist. Manag. 2015, 45, 90–117. [Google Scholar] [CrossRef]
- Christopher, M.; Peck, H. Building the Resilient Supply Chain. Int. J. Logist. Manag. 2004, 15, 1–14. [Google Scholar] [CrossRef]
- Pettit, T.J.; Fiksel, J.; Croxton, K.L. Ensuring Supply Chain Resilience: Development of a Conceptual Framework. J. Bus. Logist. 2010, 31, 1–21. [Google Scholar] [CrossRef]
- Pettit, T.J.; Croxton, K.L.; Fiksel, J. Ensuring Supply Chain Resilience: Development and Implementation of an Assessment Tool. J. Bus. Logist. 2013, 34, 46–76. [Google Scholar] [CrossRef]
- Peng, H.; Lu, S.; Zhao, D.; Zhang, A.; Li, J. An Anti-Attack Model Based on Complex Network Theory in P2P Networks. Phys. A Stat. Mech. Its Appl. 2012, 391, 2788–2793. [Google Scholar] [CrossRef]
- Priya Datta, P.; Christopher, M.; Allen, P. Agent-Based Modelling of Complex Production/Distribution Systems to Improve Resilience. Int. J. Logist. Res. Appl. 2007, 10, 187–203. [Google Scholar] [CrossRef]
- Schmitt, A.J.; Singh, M. A Quantitative Analysis of Disruption Risk in a Multi-Echelon Supply Chain. Int. J. Prod. Econ. 2012, 139, 22–32. [Google Scholar] [CrossRef]
- Zsidisin, G.A.; Wagner, S.M. Do Perceptions Become Reality? The Moderating Role of Supply Chain Resiliency on Disruption Occurrence. J. Bus. Logist. 2010, 31, 1–20. [Google Scholar] [CrossRef]
- Hearnshaw, E.J.; Wilson, M.M. A Complex Network Approach to Supply Chain Network Theory. Int. J. Phys. Distrib. Logist. Manag. 2013, 33, 442–469. [Google Scholar] [CrossRef]
- Mari, S.I.; Lee, Y.H.; Memon, M.S.; Park, Y.S.; Kim, M. Adaptivity of Complex Network Topologies for Designing Resilient Supply Chain Networks. Int. J. Ind. Eng. 2015, 22, 102–116. [Google Scholar]
- Xu, N.; Liu, J.; Li, D.; Wang, J. Research on Evolutionary Mechanism of Agile Supply Chain Network via Complex Network Theory. Math. Probl. Eng. 2016, 2016, 1–9. [Google Scholar] [CrossRef]
- Azadeh, A.; Salehi, V. Modeling and Optimizing Efficiency Gap between Managers and Operators in Integrated Resilient Systems: The Case of a Petrochemical Plant. Process Saf. Environ. Prot. 2014, 92, 766–778. [Google Scholar] [CrossRef]
- Azadeh, A.; Salehi, V.; Ashjari, B.; Saberi, M. Performance Evaluation of Integrated Resilience Engineering Factors by Data Envelopment Analysis: The Case of a Petrochemical Plant. Process Saf. Environ. Prot. 2014, 92, 231–241. [Google Scholar] [CrossRef]
- Charnes, A.; Cooper, W.W.; Rhodes, E. Measuring the Efficiency of Decision Making Units. Eur. J. Oper. Res. 1978, 2, 429–444. [Google Scholar] [CrossRef]
- Fiksel, J. Sustainability and Resilience: Toward a Systems Approach. Sustain. Sci. Pract. Policy 2006, 2, 14–21. [Google Scholar] [CrossRef]
- Pereira, J.V. The New Supply Chain's Frontier: Information Management. Int. J. Inf. Manag. 2009, 29, 372–379. [Google Scholar] [CrossRef]
- Carpenter, S.; Walker, B.; Anderies, J.M.; Abel, N. From Metaphor to Measurement: Resilience of What to What? Ecosystems 2001, 4, 765–781. [Google Scholar] [CrossRef]
- Sheffi, Y. Preparing for the Big One [Supply Chain Management]. Manuf. Eng. 2005, 84, 12–15. [Google Scholar] [CrossRef]
- Chopra, S.; Sodhi, M.S. Managing Risk to Avoid Supply-Chain Breakdown. MIT Sloan Manag. Rev. 2004, 46, 53. [Google Scholar]
- Peck, H. Drivers of Supply Chain Vulnerability: An Integrated Framework. Int. J. Phys. Distrib. Logist. Manag. 2005, 35, 210–232. [Google Scholar] [CrossRef]
- Jüttner, U.; Maklan, S. Supply Chain Resilience in the Global Financial Crisis: An Empirical Study. Supply Chain Manag. Int. J. 2011, 16, 246–259. [Google Scholar] [CrossRef]
- Spiegler, V.L.; Naim, M.M.; Wikner, J. A Control Engineering Approach to the Assessment of Supply Chain Resilience. Int. J. Prod. Res. 2012, 50, 6162–6187. [Google Scholar] [CrossRef]
- Wu, T.; Huang, S.; Blackhurst, J.; Zhang, X.; Wang, S. Supply Chain Risk Management: An Agent-Based Simulation to Study the Impact of Retail Stockouts. IEEE Trans. Eng. Manag. 2013, 60, 676–686. [Google Scholar] [CrossRef]
- Huang, L.; Wang, W.; Wang, M. Simulation Research of Space-Time Evolution of Emergency Logistics Network Reliability Based on Complex Network Theory. Discret. Dyn. Nat. Soc. 2013, 2013, 1–7. [Google Scholar] [CrossRef]
- Perera, S.S.; Bell, M.; Bliemer, M. Modelling Supply Chains as Complex Networks for Investigating Resilience: An Improved Methodological Framework. In Proceedings of the 37th Australasian Transport Research Forum (ATRF), Sydney, Australia, 30 September–2 October 2015.
- Wieland, A.; Marcus Wallenburg, C. The Influence of Relational Competencies on Supply Chain Resilience: A Relational View. Int. J. Phys. Distrib. Logist. Manag. 2013, 43, 300–320. [Google Scholar] [CrossRef]
- Barroso, A.P.; Machado, V.H.; Machado, V.C. The Resilience Paradigm in the Supply Chain Management: A Case Study. In Proceedings of the 2011 IEEE International Conference on Industrial Engineering and Engineering Management (IEEM), Singapore, 6–9 December 2011; pp. 928–932.
- Carvalho, H.; Barroso, A.P.; Machado, V.H.; Azevedo, S.G.; Machado, V.C. Supply Chain Resilience: A Simulation Study. Ann. DAAAM Proc. 2011, 2011, 1611–1613. [Google Scholar]
- Carvalho, H.; Barroso, A.P.; Machado, V.H.; Azevedo, S.; Cruz-Machado, V. Supply Chain Redesign for Resilience using Simulation. Comput. Ind. Eng. 2012, 62, 329–341. [Google Scholar] [CrossRef]
- Ishfaq, R. Resilience through Flexibility in Transportation Operations. Int. J. Logist. Res. Appl. 2012, 15, 215–229. [Google Scholar] [CrossRef]
- Kristianto, Y.; Gunasekaran, A.; Helo, P.; Hao, Y. A Model of Resilient Supply Chain Network Design: A Two-Stage Programming with Fuzzy Shortest Path. Expert Syst. Appl. 2014, 41, 39–49. [Google Scholar] [CrossRef]
- Wang, J.; Gao, F.; Ip, W.H. Measurement of Resilience and its Application to Enterprise Information Systems. Enterp. Inf. Syst. 2010, 4, 215–223. [Google Scholar] [CrossRef]
- Chang, Y.; Park, H.; Jeong, J.; Lee, J. Evaluating Economic and Environmental Efficiency of Global Airlines: A SBM-DEA Approach. Transp. Res. D 2014, 27, 46–50. [Google Scholar] [CrossRef]
- Charnes, A.; Cooper, W.W.; Golany, B.; Seiford, L.; Stutz, J. Foundations of Data Envelopment Analysis for Pareto-Koopmans Efficient Empirical Production Functions. J. Econ. 1985, 30, 91–107. [Google Scholar] [CrossRef]
- Cook, W.D.; Seiford, L.M. Data Envelopment Analysis (DEA)—Thirty Years on. Eur. J. Oper. Res. 2009, 192, 1–17. [Google Scholar] [CrossRef]
- Portela, M.; Thanassoulis, E. Developing a Decomposable Measure of Profit Efficiency using DEA. J. Oper. Res. Soc. 2007, 58, 481–490. [Google Scholar] [CrossRef]
- Tone, K. A Slacks-Based Measure of Efficiency in Data Envelopment Analysis. Eur. J. Oper. Res. 2001, 130, 498–509. [Google Scholar] [CrossRef]
- Chen, H.; Lin, A. Complex Network Characteristics and Invulnerability Simulating Analysis of Supply Chain. J. Netw. 2012, 7, 591–597. [Google Scholar] [CrossRef]
- Zhao, K.; Kumar, A.; Harrison, T.P.; Yen, J. Analyzing the Resilience of Complex Supply Network Topologies against Random and Targeted Disruptions. IEEE Syst. J. 2011, 5, 28–39. [Google Scholar] [CrossRef]
- Callaway, D.S.; Newman, M.E.; Strogatz, S.H.; Watts, D.J. Network Robustness and Fragility: Percolation on Random Graphs. Phys. Rev. Lett. 2000, 85, 5468. [Google Scholar] [CrossRef] [PubMed]
- Kim, K.H.; Bae, J.W. A Dispatching Method for Automated Guided Vehicles to Minimize Delays of Containership Operations. Int. J. Manag. Sci. 1999, 5, 1–25. [Google Scholar]
- Cooper, W.W.; Seiford, L.M.; Zhu, J. Data envelopment analysis. In Handbook on Data Envelopment Analysis; Springer: New York, NY, USA, 2004; pp. 1–39. [Google Scholar]
- Carvalho, H. Modeling Resilience in Supply Chain (Thesis). Faculdade de Ciências e Tecnologia. Available online: http://hdl.handle.net/10362/8949 (accessed on 10 February 2017). (In English)
- Hakimi, S.L. Optimum Distribution of Switching Centers in a Communication Network and some Related Graph Theoretic Problems. Oper. Res. 1965, 13, 462–475. [Google Scholar] [CrossRef]
- Hakimi, S.L. Optimum Locations of Switching Centers and the Absolute Centers and Medians of a Graph. Oper. Res. 1964, 12, 450–459. [Google Scholar] [CrossRef]

| Resiliency Measure | Reference |
|---|---|
| Simulation (Performance Measure) | |
| customer service level, production change over time, average inventory at each distribution center, total average network inventory | [16] |
| the integral of time multiplied by the absolute error, customer service level | [32] |
| order fill rate | [17] |
| downstream market share | [33] |
| order fulfillment rate | [37] |
| order fulfillment rate, the cost of backorders | [38] |
| lead time ratio | [39] |
| shipment delay time | [40,41,42] |
| Complex Network Theory (Topological Measure) | |
| the degree of distribution, average path length, clustering coefficient | [21] |
| the size of the largest functional network, clustering coefficient and characteristics path length | [20] |
| connectivity, characteristic path length, clustering coefficient | [19] |
| effective demand node ratio, supply mileage | [34] |
| node degree | [15] |
| flows, costs, capacities, and other topological measures | [35] |
| the degree of distribution, average path length, clustering coefficient | [21] |
| Conceptual (Survey Scale) | |
| flexibility, redundancy, disruption occurrences | [18] |
| robustness, ability | [36] |
| capability (ability to bounce back, market position, financial strength, recovery), vulnerability (turbulence, deliberate threats, external pressures) | [14] |
| commitment management, reporting culture, learning, awareness, preparedness and flexibility, self-organization, teamwork, redundancy, and fault-tolerance | [22,23] |
| SCN Config. | Ave. Node Degree | Clustering Coefficient (105) | No. of Supply Nodes | Available Capacity (Ton) | Total Distance (Km) | Population Density * |
|---|---|---|---|---|---|---|
| 1 | 1.995 | 0.000 | 2 | 53,002.5 | 162,700 | 4452 |
| 2 | 2.000 | 0.015 | 3 | 77,996 | 160,200 | 4652 |
| 3 | 2.000 | 0.008 | 3 | 56,401.172 | 131,010 | 9308 |
| 4 | 2.011 | 0.104 | 4 | 80,070.852 | 127,770 | 4940 |
| 5 | 2.000 | 0.008 | 3 | 57,487.392 | 131,010 | 9308 |
| 6 | 2.011 | 0.104 | 4 | 80,781.569 | 127,770 | 4940 |
| 7 | 2.011 | 0.133 | 4 | 57,815.846 | 106,600 | 6411 |
| 8 | 2.022 | 1.600 | 5 | 85,005.144 | 106,870 | 13,895 |
| 9 | 2.011 | 0.133 | 4 | 59,357.692 | 106,600 | 6411 |
| 10 | 2.022 | 1.600 | 5 | 87,422.65 | 106,870 | 13,895 |
| 11 | 2.028 | 0.628 | 5 | 59,890.152 | 101,270 | 13,554 |
| 12 | 2.049 | 4.130 | 6 | 85,179.567 | 96,459 | 13,650 |
| 13 | 2.028 | 0.628 | 5 | 62,120.714 | 101,270 | 13,554 |
| 14 | 2.049 | 4.130 | 6 | 87,644.823 | 96,459 | 13,650 |
| 15 | 2.049 | 1.360 | 6 | 60,072.998 | 89,489 | 14,191 |
| 16 | 2.077 | 9.640 | 7 | 85,752.84 | 74,066 | 9084 |
| 17 | 2.049 | 1.360 | 6 | 62,357.684 | 89,489 | 14,191 |
| 18 | 2.077 | 9.640 | 7 | 88,436.857 | 74,066 | 9084 |
| 19 | 2.077 | 3.830 | 7 | 61,021.554 | 67,730 | 17,880 |
| 20 | 2.109 | 28.200 | 8 | 86,936.811 | 72,123 | 13,373 |
| 21 | 2.077 | 1.360 | 7 | 63,626.922 | 67,730 | 17,880 |
| 22 | 2.109 | 9.640 | 8 | 90,025.922 | 72,123 | 13,373 |
| Variable | Min | Med. | Max. | Std. |
|---|---|---|---|---|
| Positive Factor | ||||
| Available capacity (Tons) | 53,002.5 | 70,811.5 | 90,025.9 | 13,239.2 |
| Ave. node degree | 2.0 | 2.0 | 2.1 | 0.0 |
| Clustering coefficient (105) | 0.0 | 1.4 | 28.2 | 6.2 |
| Number of supply nodes | 2.0 | 5.0 | 8.0 | 1.7 |
| Negative Factor | ||||
| Total distance (Km) | 67,730.0 | 101,270.0 | 162,700.0 | 27,147.0 |
| External Factor | ||||
| Population density | 4452.0 | 13,373.0 | 17,880.0 | 4166.7 |
| SCN Config. | Resiliency Score | Ranking | Resiliency Score Considering Population Density | Ranking Considering Population Density |
|---|---|---|---|---|
| 1 | 0.000 | 22 | 1.000 | 1 |
| 2 | 0.001 | 19 | 1.000 | 2 |
| 3 | 0.001 | 20 | 0.002 | 21 |
| 4 | 0.008 | 17 | 0.998 | 9 |
| 5 | 0.001 | 21 | 0.002 | 22 |
| 6 | 0.008 | 18 | 1.000 | 3 |
| 7 | 0.012 | 15 | 0.128 | 17 |
| 8 | 0.127 | 11 | 0.154 | 13 |
| 9 | 0.012 | 16 | 0.128 | 18 |
| 10 | 0.127 | 12 | 0.154 | 14 |
| 11 | 0.058 | 13 | 0.069 | 19 |
| 12 | 0.293 | 7 | 0.338 | 11 |
| 13 | 0.058 | 14 | 0.069 | 20 |
| 14 | 0.260 | 8 | 0.300 | 12 |
| 15 | 0.131 | 10 | 0.142 | 16 |
| 16 | 0.639 | 6 | 0.992 | 10 |
| 17 | 0.132 | 9 | 0.143 | 15 |
| 18 | 0.642 | 5 | 1.000 | 4 |
| 19 | 1.000 | 1 | 1.000 | 5 |
| 20 | 1.000 | 2 | 1.000 | 6 |
| 21 | 1.000 | 3 | 1.000 | 7 |
| 22 | 1.000 | 4 | 1.000 | 8 |
| SCN Config. | Available Capacity (Ton) | Average Node Degree | Clustering Coefficient | Number of Supply Nodes | Total Distance (Km) |
|---|---|---|---|---|---|
| 1 | 143,115.5 | 3 | 63.6 | 16 | 0 |
| 2 | 115,108.5 | 3 | 62.6 | 15 | 0 |
| 3 | 101,517.8 | 2 | 51.2 | 12 | 0 |
| 4 | 73,942.7 | 2 | 49.9 | 10 | 0 |
| 5 | 100,431.6 | 2 | 51.2 | 12 | 0 |
| 6 | 73,231.9 | 2 | 49.9 | 10 | 0 |
| 7 | 70,679.4 | 1 | 41.5 | 8 | 0 |
| 8 | 43,815.6 | 1 | 40.2 | 7 | 0 |
| 9 | 69,137.6 | 1 | 41.5 | 8 | 0 |
| 10 | 41,398.1 | 1 | 40.2 | 7 | 0 |
| 11 | 62,180.4 | 1 | 39.0 | 6 | 0 |
| 12 | 31,091.8 | 1 | 33.6 | 5 | 0 |
| 13 | 59,949.8 | 1 | 39.0 | 6 | 0 |
| 14 | 28,626.5 | 1 | 33.6 | 8 | 0 |
| 15 | 47,796.7 | 1 | 33.6 | 4 | 0 |
| 16 | 3526.1 | 0 | 19.3 | 1 | 0 |
| 17 | 45,512.0 | 1 | 33.6 | 4 | 0 |
| 18 | 842.0 | 0 | 19.3 | 1 | 0 |
| 19 | 0.0 | 0 | 0.0 | 0 | 0 |
| 20 | 0.0 | 0 | 0.0 | 0 | 0 |
| 21 | 0.0 | 0 | 0.0 | 0 | 0 |
| 22 | 0.0 | 0 | 0.0 | 0 | 0 |
| SCN Config. | Available Capacity (Ton) | Average Node Degree | Clustering Coefficient | Number of Supply Nodes | Total Distance (Km) | Population Density |
|---|---|---|---|---|---|---|
| 1 | 0.0 | 0 | 0.0 | 0 | 0.0 | 0 |
| 2 | 0.0 | 0 | 0.0 | 0 | 0.0 | 0 |
| 3 | 25,128.8 | 0 | 15.2 | 3 | 37,133.0 | 0 |
| 4 | 710.7 | 0 | 0.0 | 0 | 0.0 | 0 |
| 5 | 24,042.6 | 0 | 15.2 | 3 | 37,133.0 | 0 |
| 6 | 0.0 | 0 | 0.0 | 0 | 0.0 | 0 |
| 7 | 24,783.5 | 0 | 3.5 | 1 | 0.0 | 0 |
| 8 | 5325.1 | 0 | 27.7 | 3 | 31,931.8 | 0 |
| 9 | 23,241.6 | 0 | 3.5 | 1 | 0.0 | 0 |
| 10 | 2907.6 | 0 | 27.7 | 3 | 31,931.8 | 0 |
| 11 | 28,223.3 | 0 | 28.0 | 3 | 28,170.8 | 0 |
| 12 | 3558.0 | 0 | 24.7 | 2 | 22,842.1 | 0 |
| 13 | 25,992.8 | 0 | 28.0 | 3 | 28,170.8 | 0 |
| 14 | 1092.7 | 0 | 24.7 | 5 | 22,842.1 | 0 |
| 15 | 32,181.6 | 0 | 28.6 | 2 | 12,954.4 | 0 |
| 16 | 2684.0 | 0 | 0.0 | 0 | 0.0 | 0 |
| 17 | 29,896.9 | 0 | 28.6 | 2 | 12,954.4 | 0 |
| 18 | 0.0 | 0 | 0.0 | 0 | 0.0 | 0 |
| 19 | 0.0 | 0 | 0.0 | 0 | 0.0 | 0 |
| 20 | 0.0 | 0 | 0.0 | 0 | 0.0 | 0 |
| 21 | 0.0 | 0 | 0.0 | 0 | 0.0 | 0 |
| 22 | 0.0 | 0 | 0.0 | 0 | 0.0 | 0 |
© 2017 by the authors. Licensee MDPI, Basel, Switzerland. This article is an open access article distributed under the terms and conditions of the Creative Commons Attribution (CC BY) license ( http://creativecommons.org/licenses/by/4.0/).
Share and Cite
Pourhejazy, P.; Kwon, O.K.; Chang, Y.-T.; Park, H. Evaluating Resiliency of Supply Chain Network: A Data Envelopment Analysis Approach. Sustainability 2017, 9, 255. https://doi.org/10.3390/su9020255
Pourhejazy P, Kwon OK, Chang Y-T, Park H. Evaluating Resiliency of Supply Chain Network: A Data Envelopment Analysis Approach. Sustainability. 2017; 9(2):255. https://doi.org/10.3390/su9020255
Chicago/Turabian StylePourhejazy, Pourya, Oh Kyoung Kwon, Young-Tae Chang, and Hyosoo (Kevin) Park. 2017. "Evaluating Resiliency of Supply Chain Network: A Data Envelopment Analysis Approach" Sustainability 9, no. 2: 255. https://doi.org/10.3390/su9020255
APA StylePourhejazy, P., Kwon, O. K., Chang, Y.-T., & Park, H. (2017). Evaluating Resiliency of Supply Chain Network: A Data Envelopment Analysis Approach. Sustainability, 9(2), 255. https://doi.org/10.3390/su9020255