Figure 1.
The relation between photovoltaic (PV) cell efficiency and angle of the sun’s rays [
2].
Figure 1.
The relation between photovoltaic (PV) cell efficiency and angle of the sun’s rays [
2].
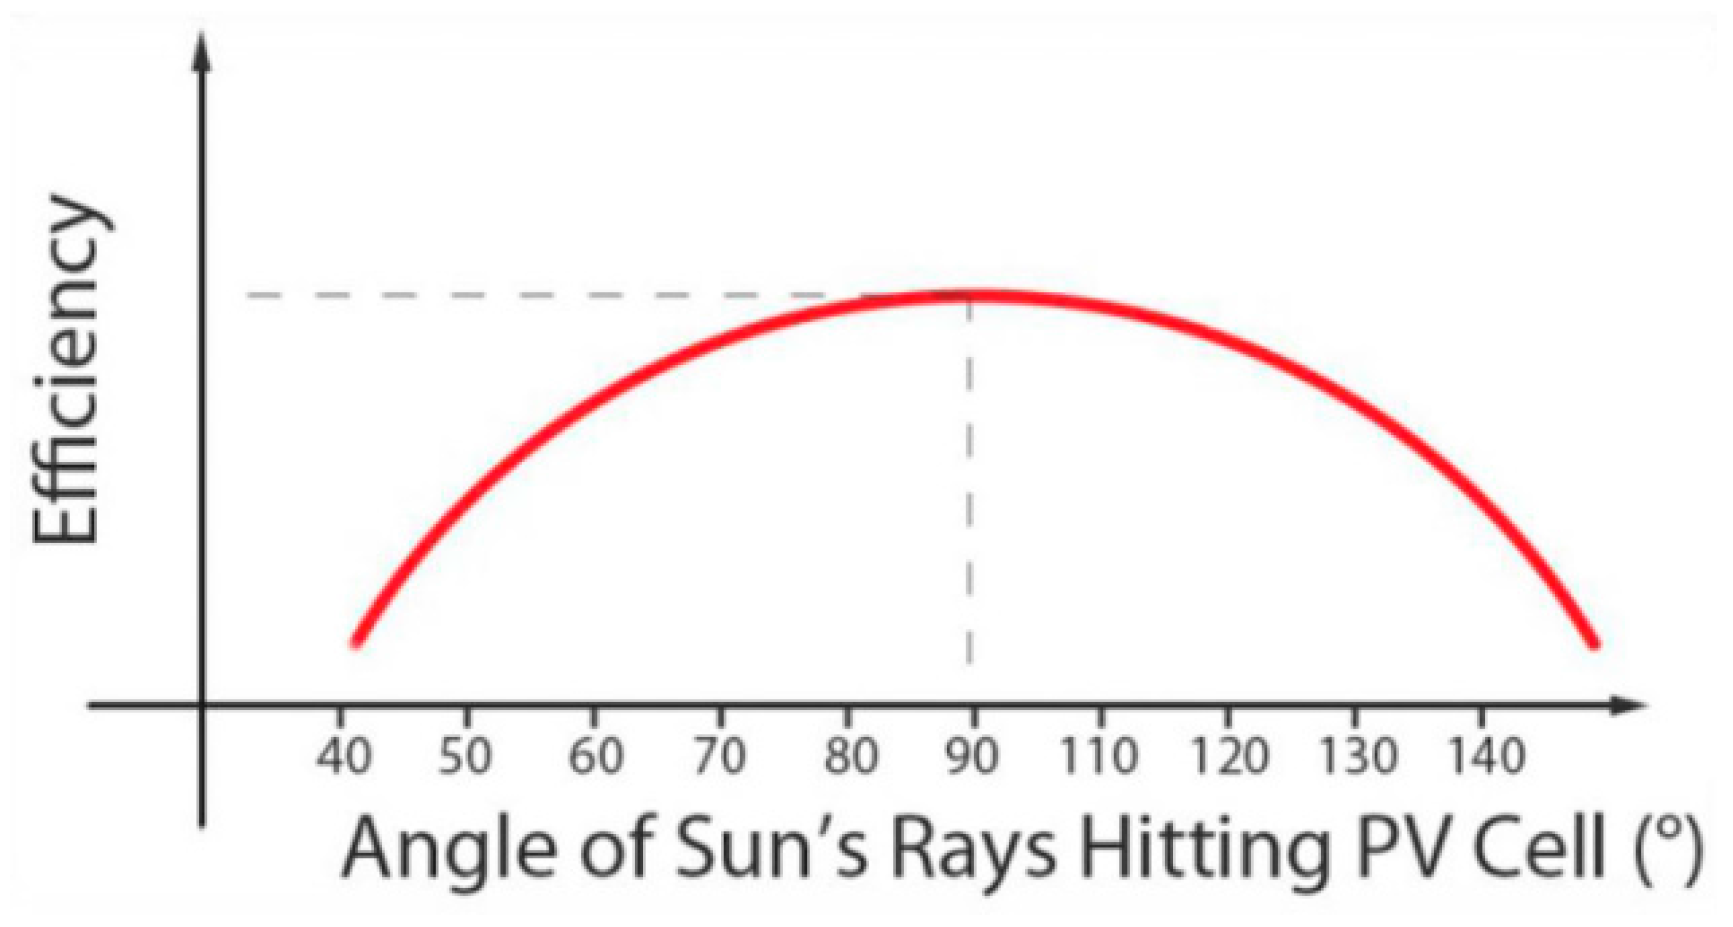
Figure 2.
PV-integrated responsive shading device with the dual-axis solar tracking system [
18].
Figure 2.
PV-integrated responsive shading device with the dual-axis solar tracking system [
18].
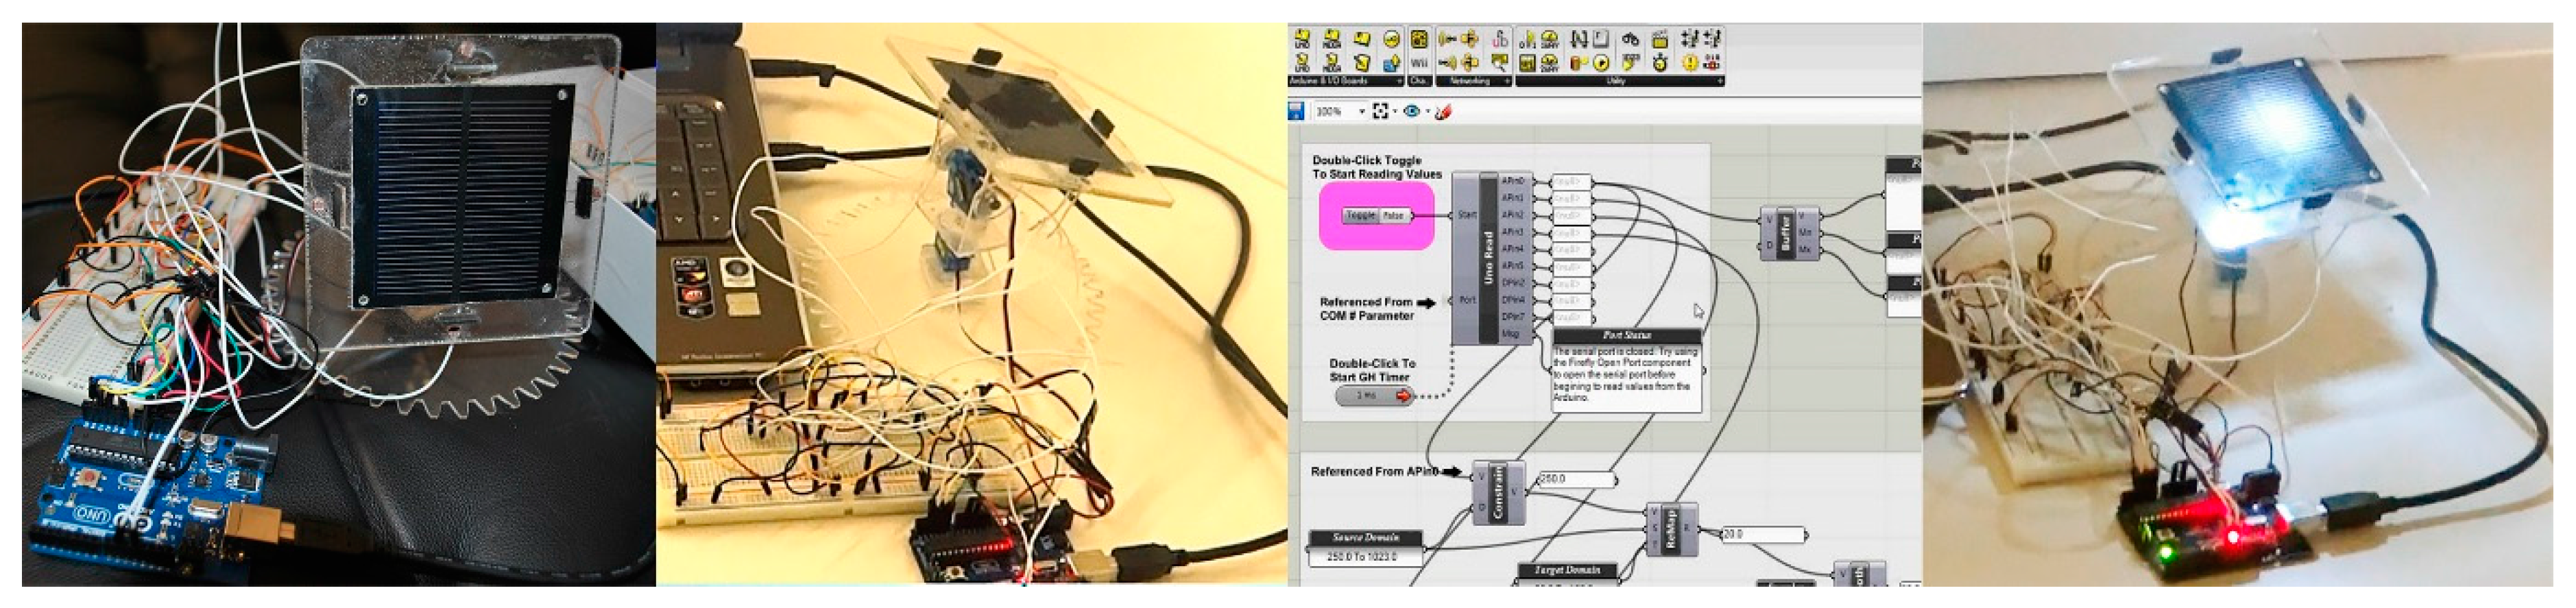
Figure 3.
The prototype calibration procedure and real-time data collection.
Figure 3.
The prototype calibration procedure and real-time data collection.
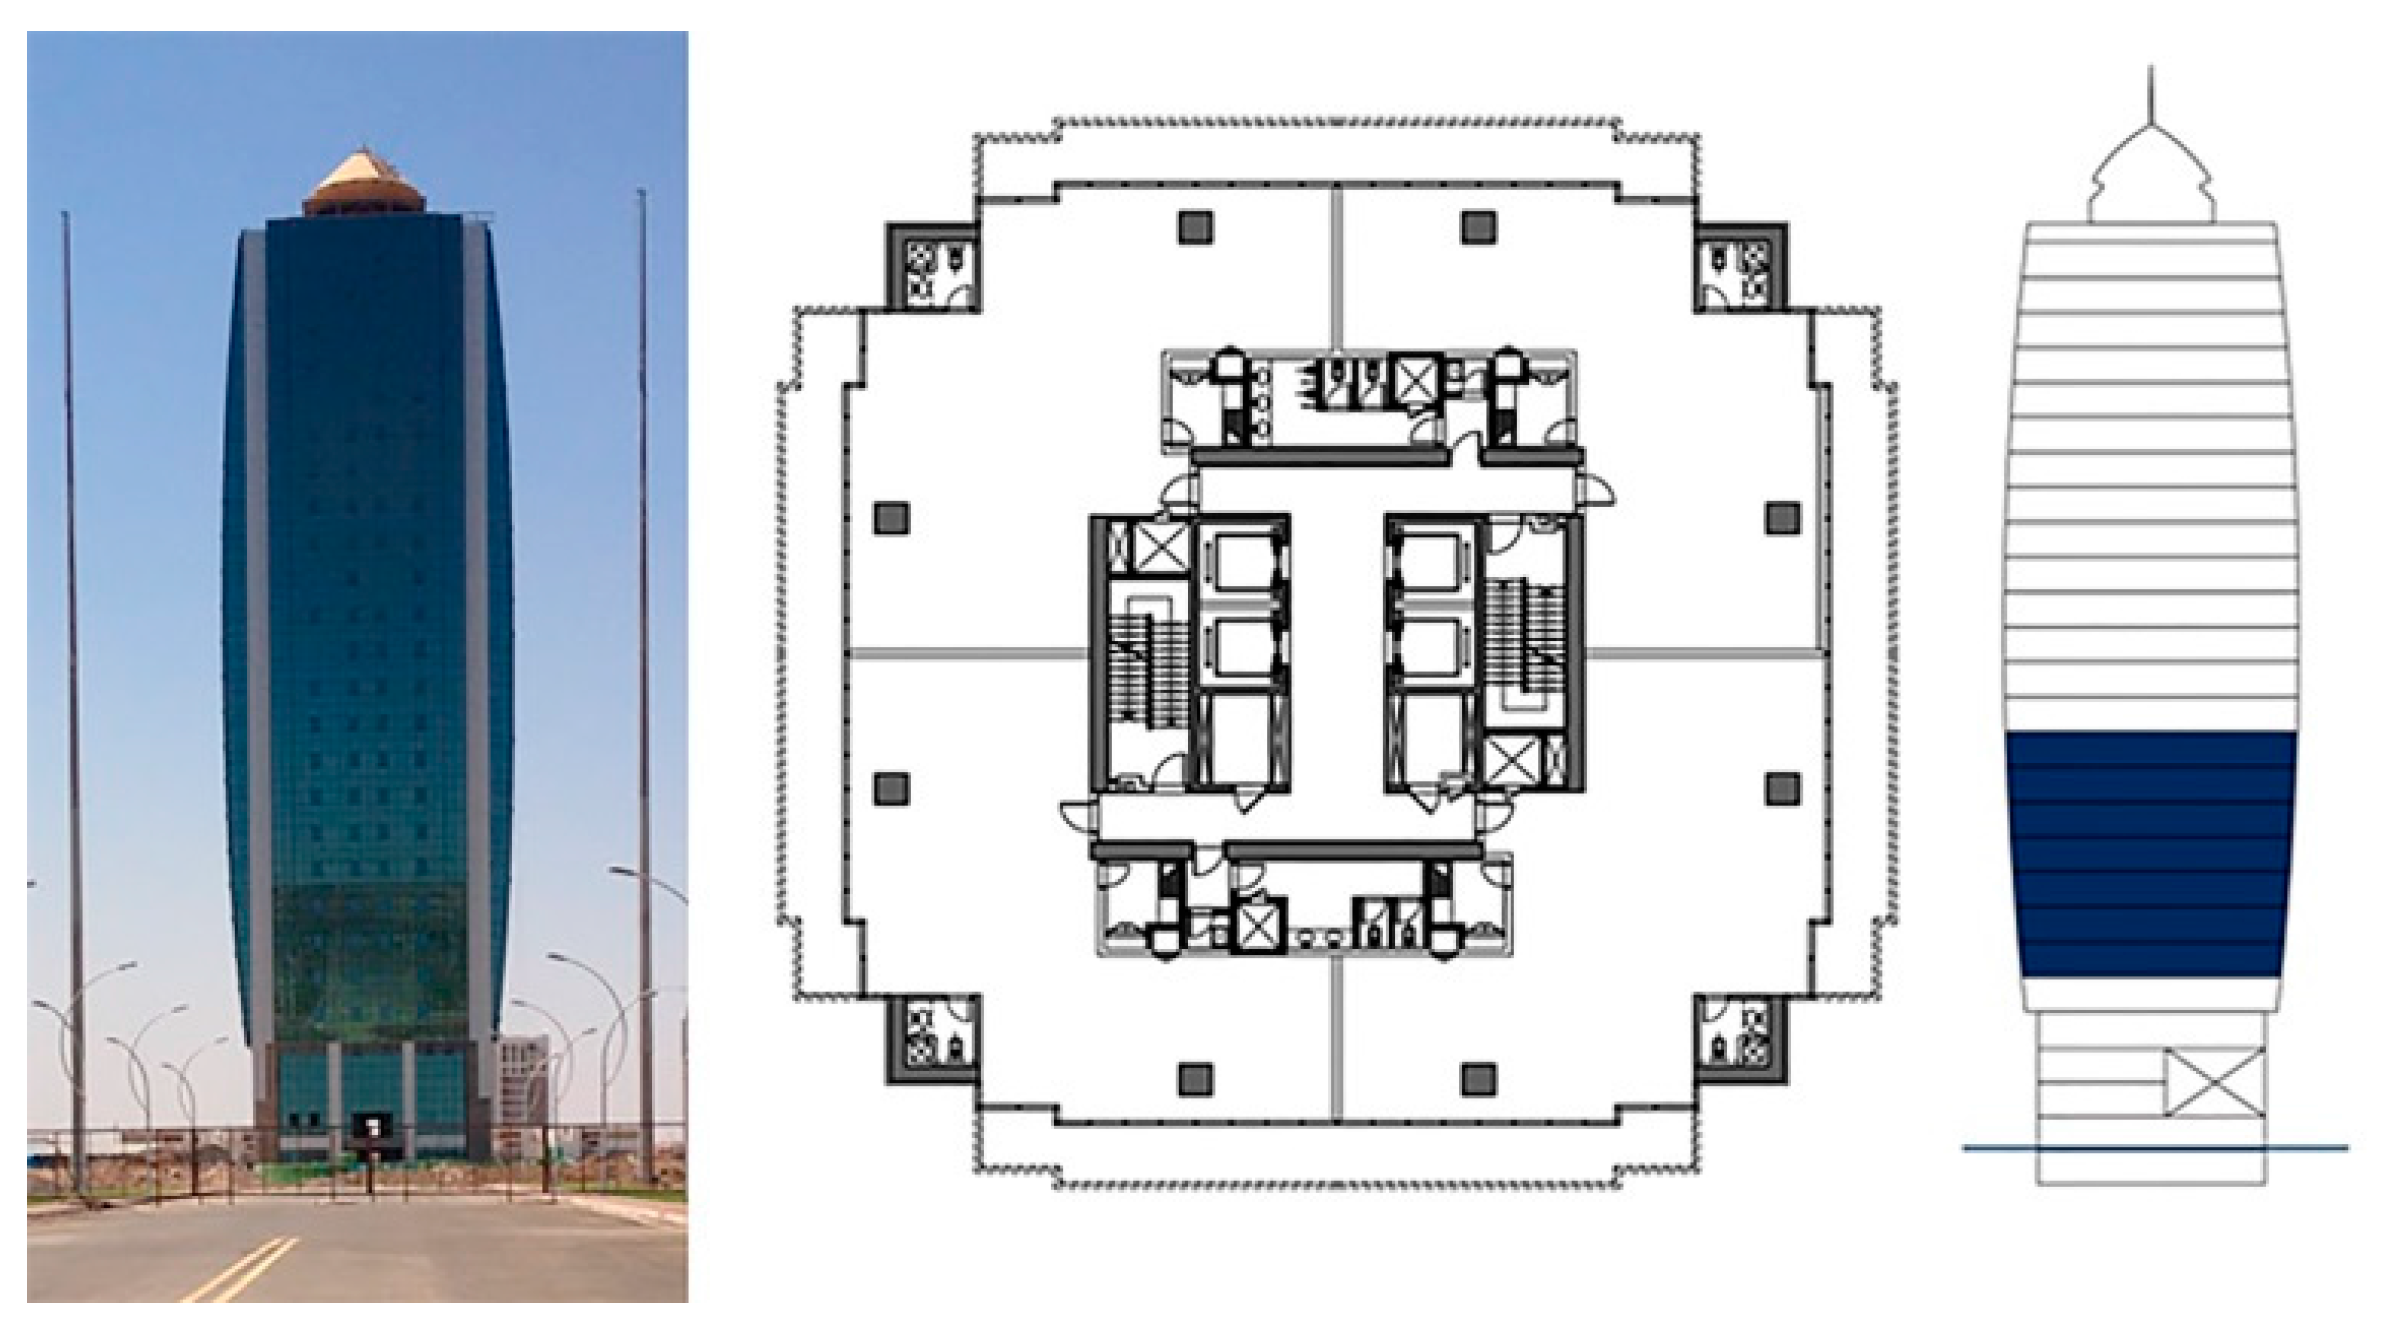
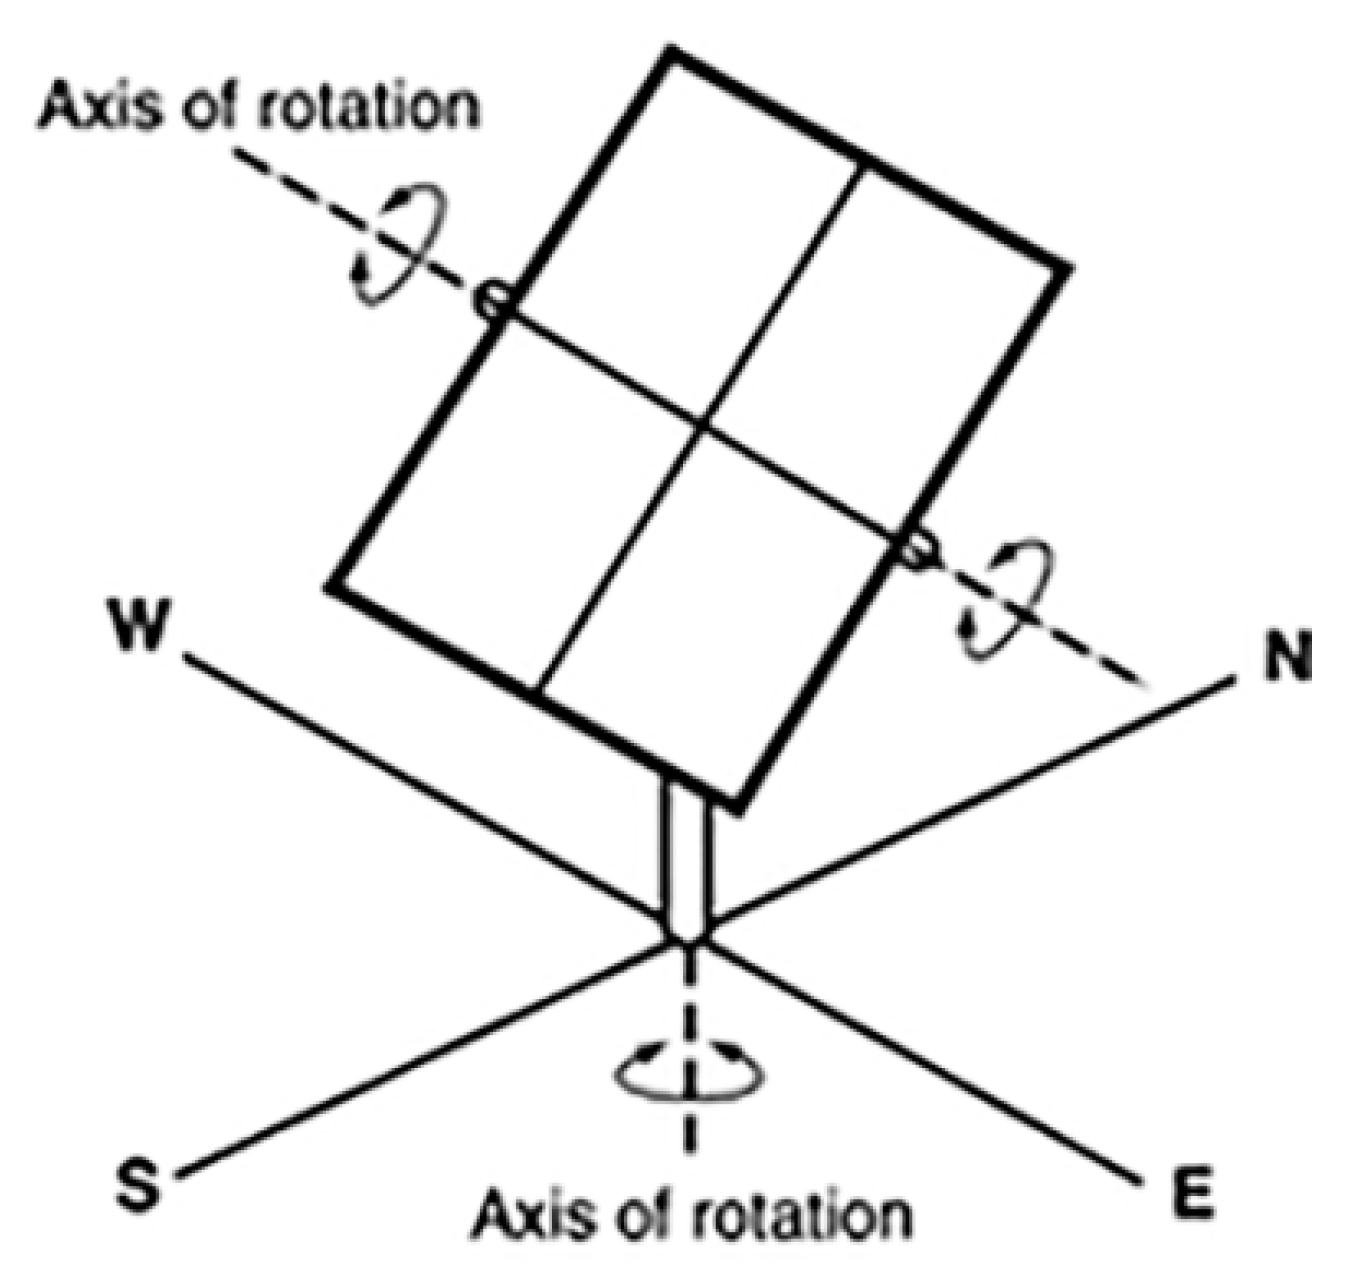
Figure 4.
Empire World T1 elevation and the plan of office floors [
20].
Figure 4.
Empire World T1 elevation and the plan of office floors [
20].
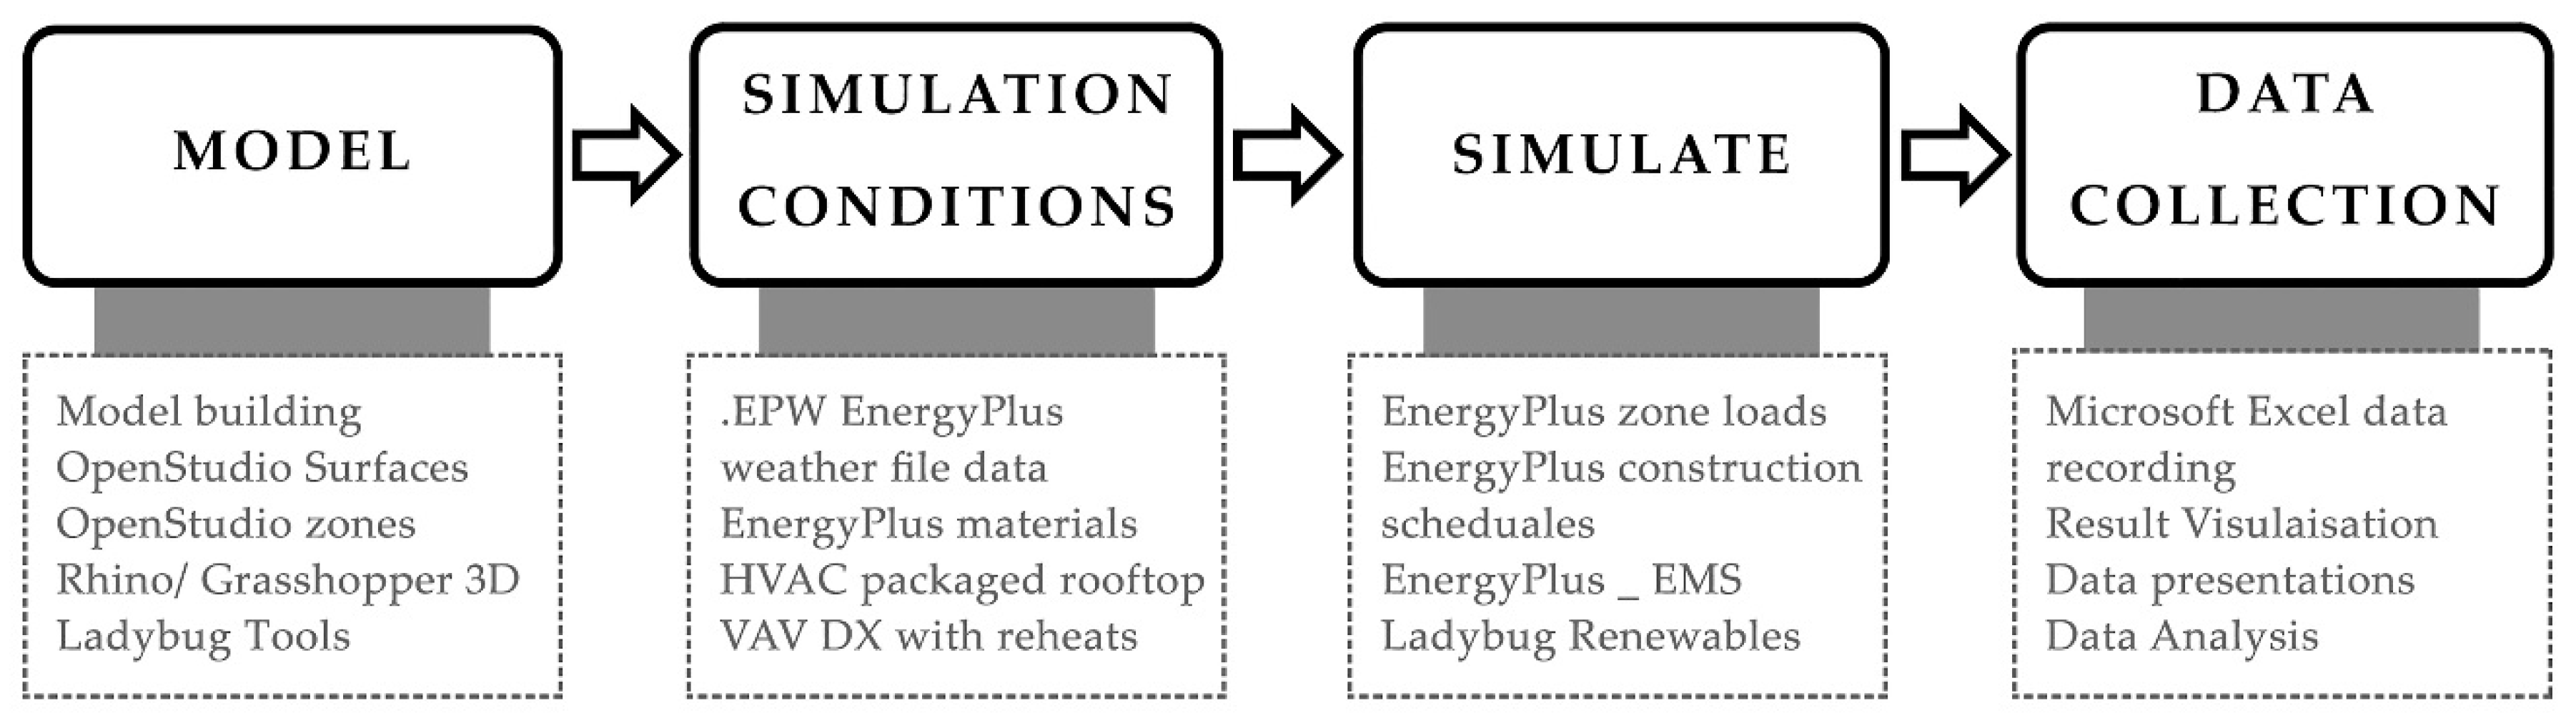
Figure 5.
The structure of the modelling and simulation process.
Figure 5.
The structure of the modelling and simulation process.
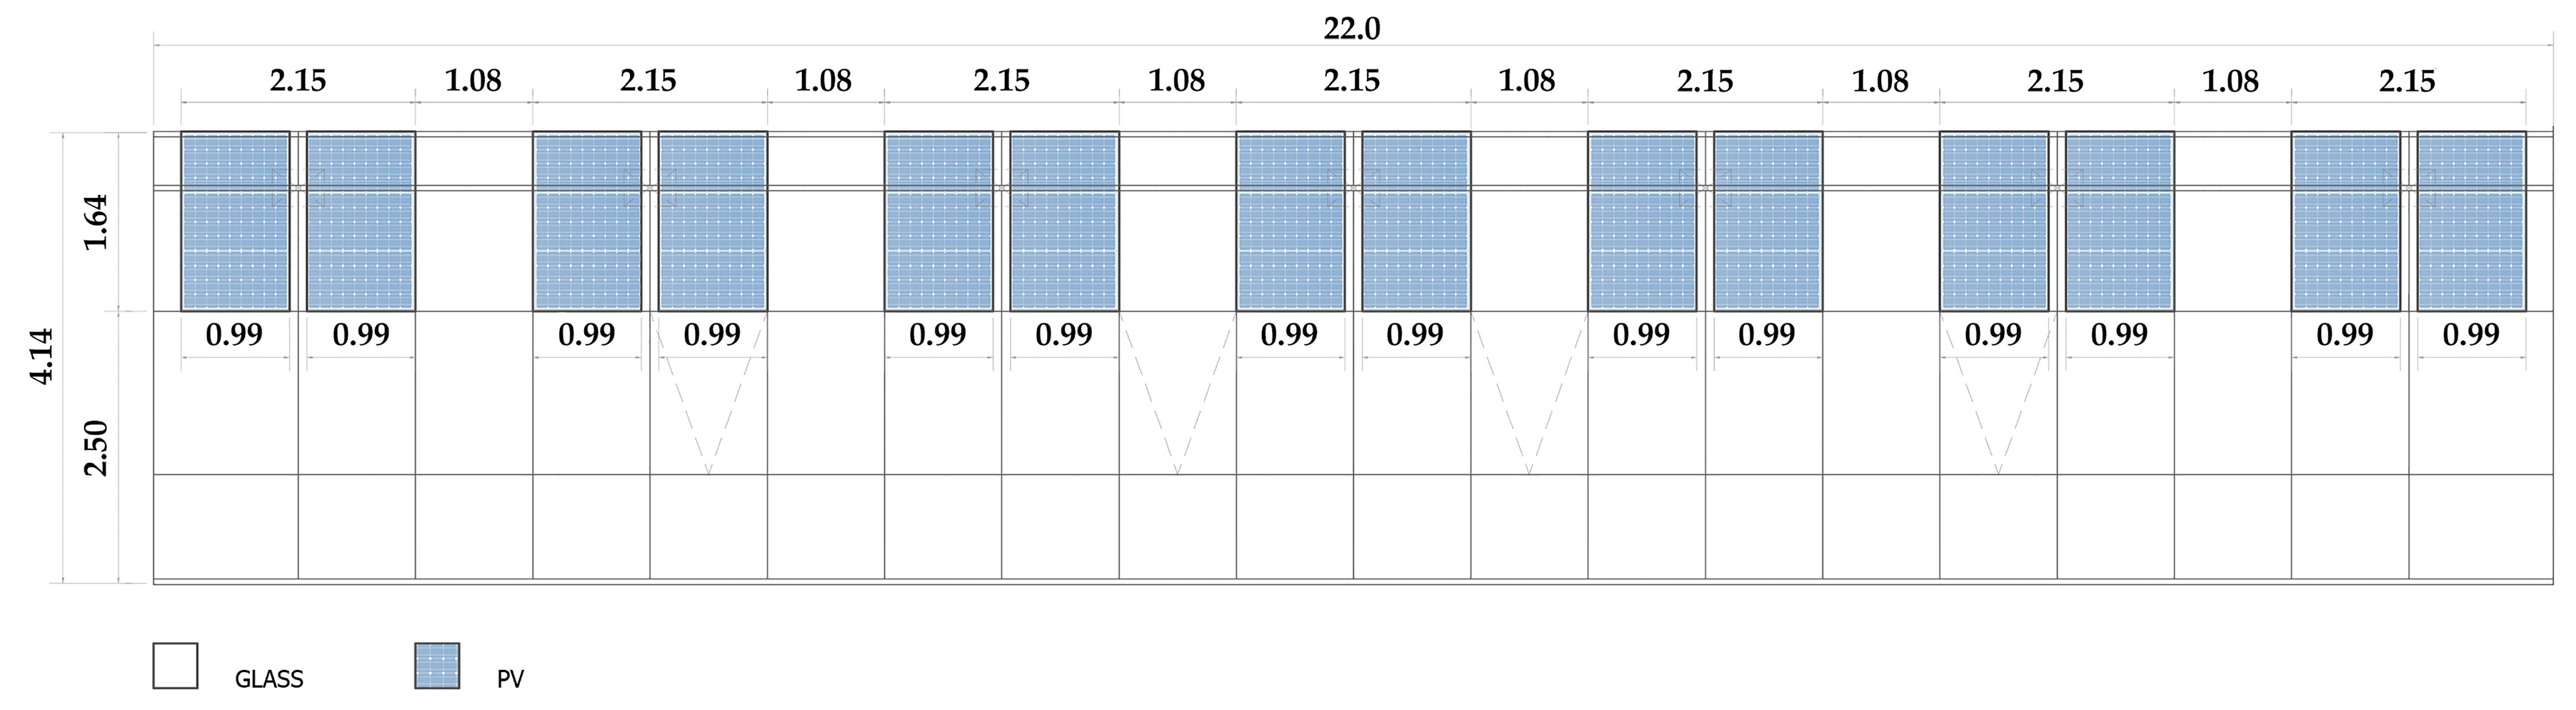
Figure 6.
Photovoltaic opaque area of each floor on the south, east, and west orientations.
Figure 6.
Photovoltaic opaque area of each floor on the south, east, and west orientations.
Figure 7.
Schematic view of the case-study building with PV-integrated responsive shading devices.
Figure 7.
Schematic view of the case-study building with PV-integrated responsive shading devices.
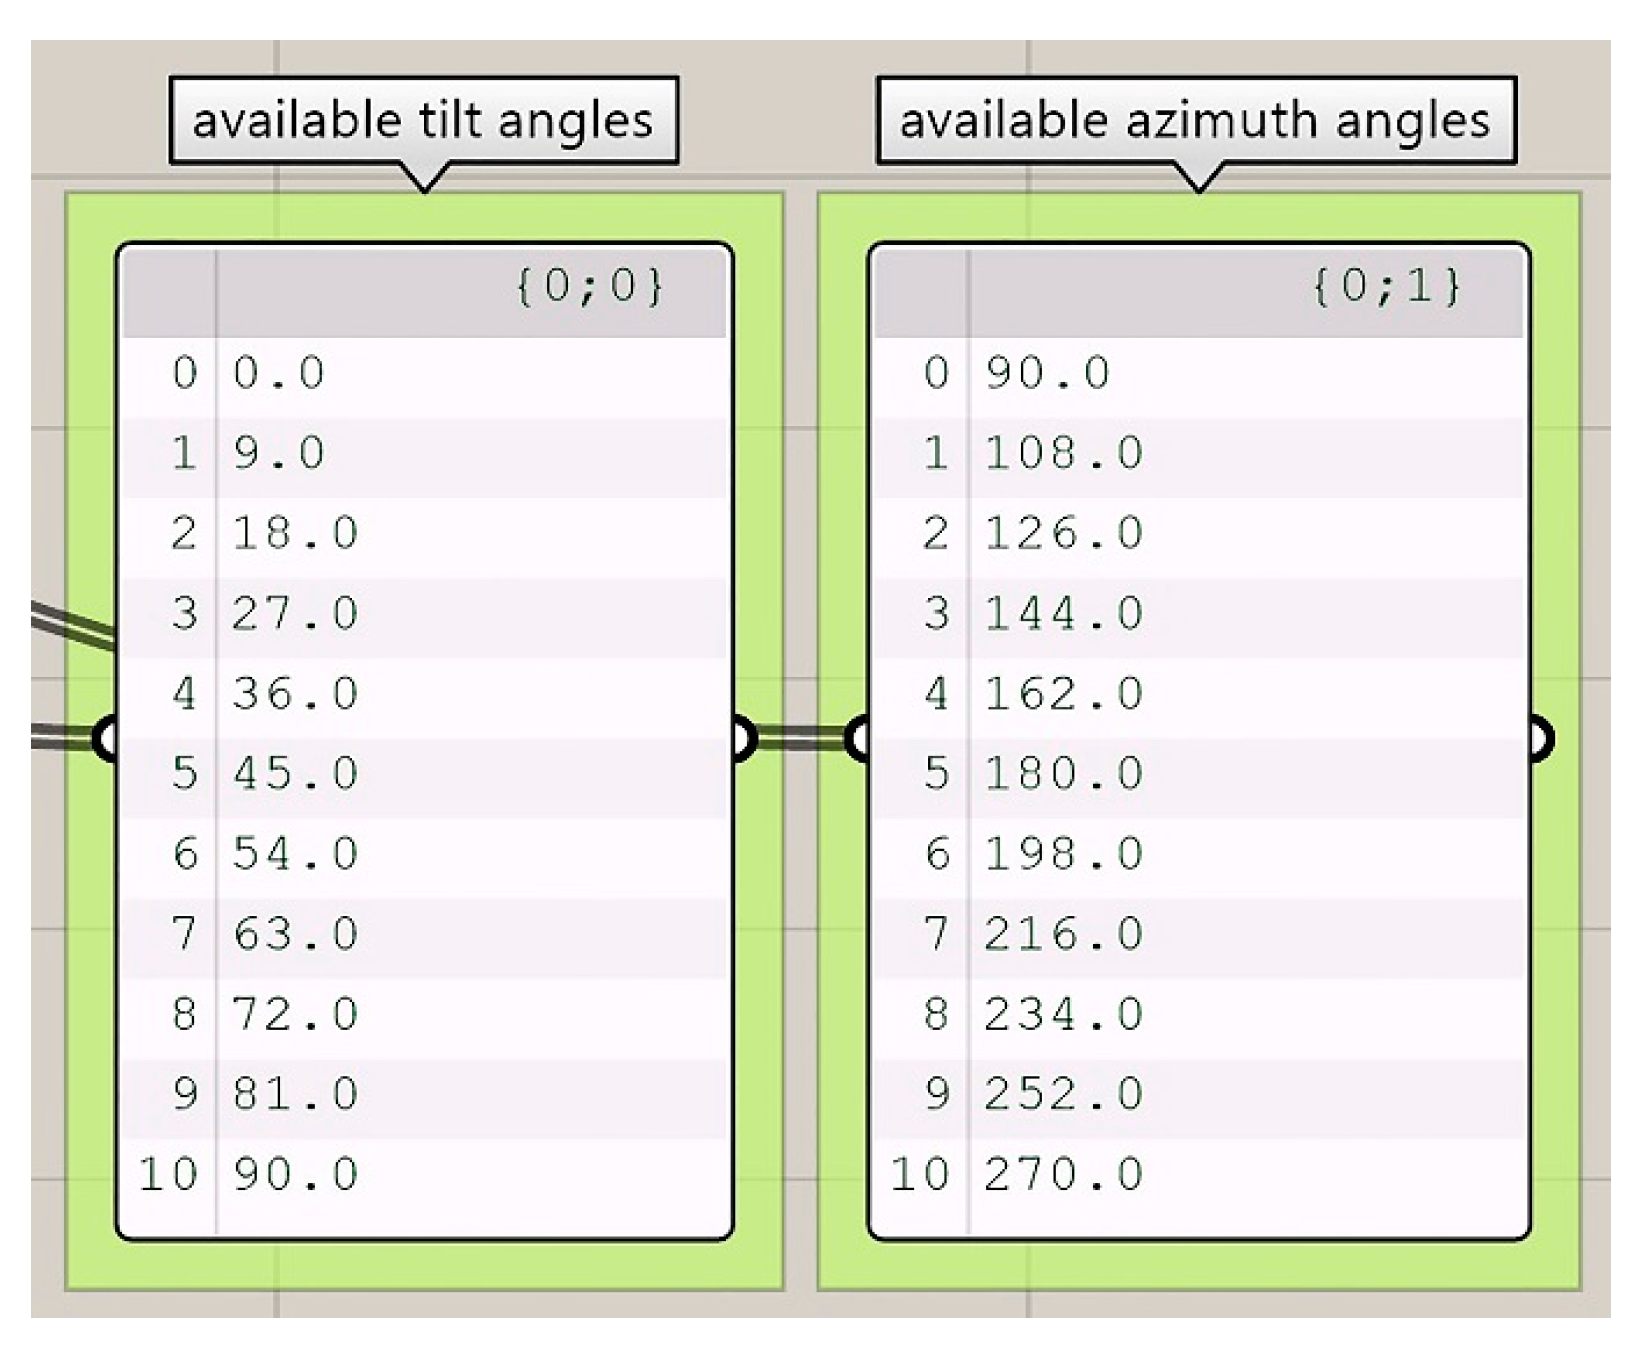
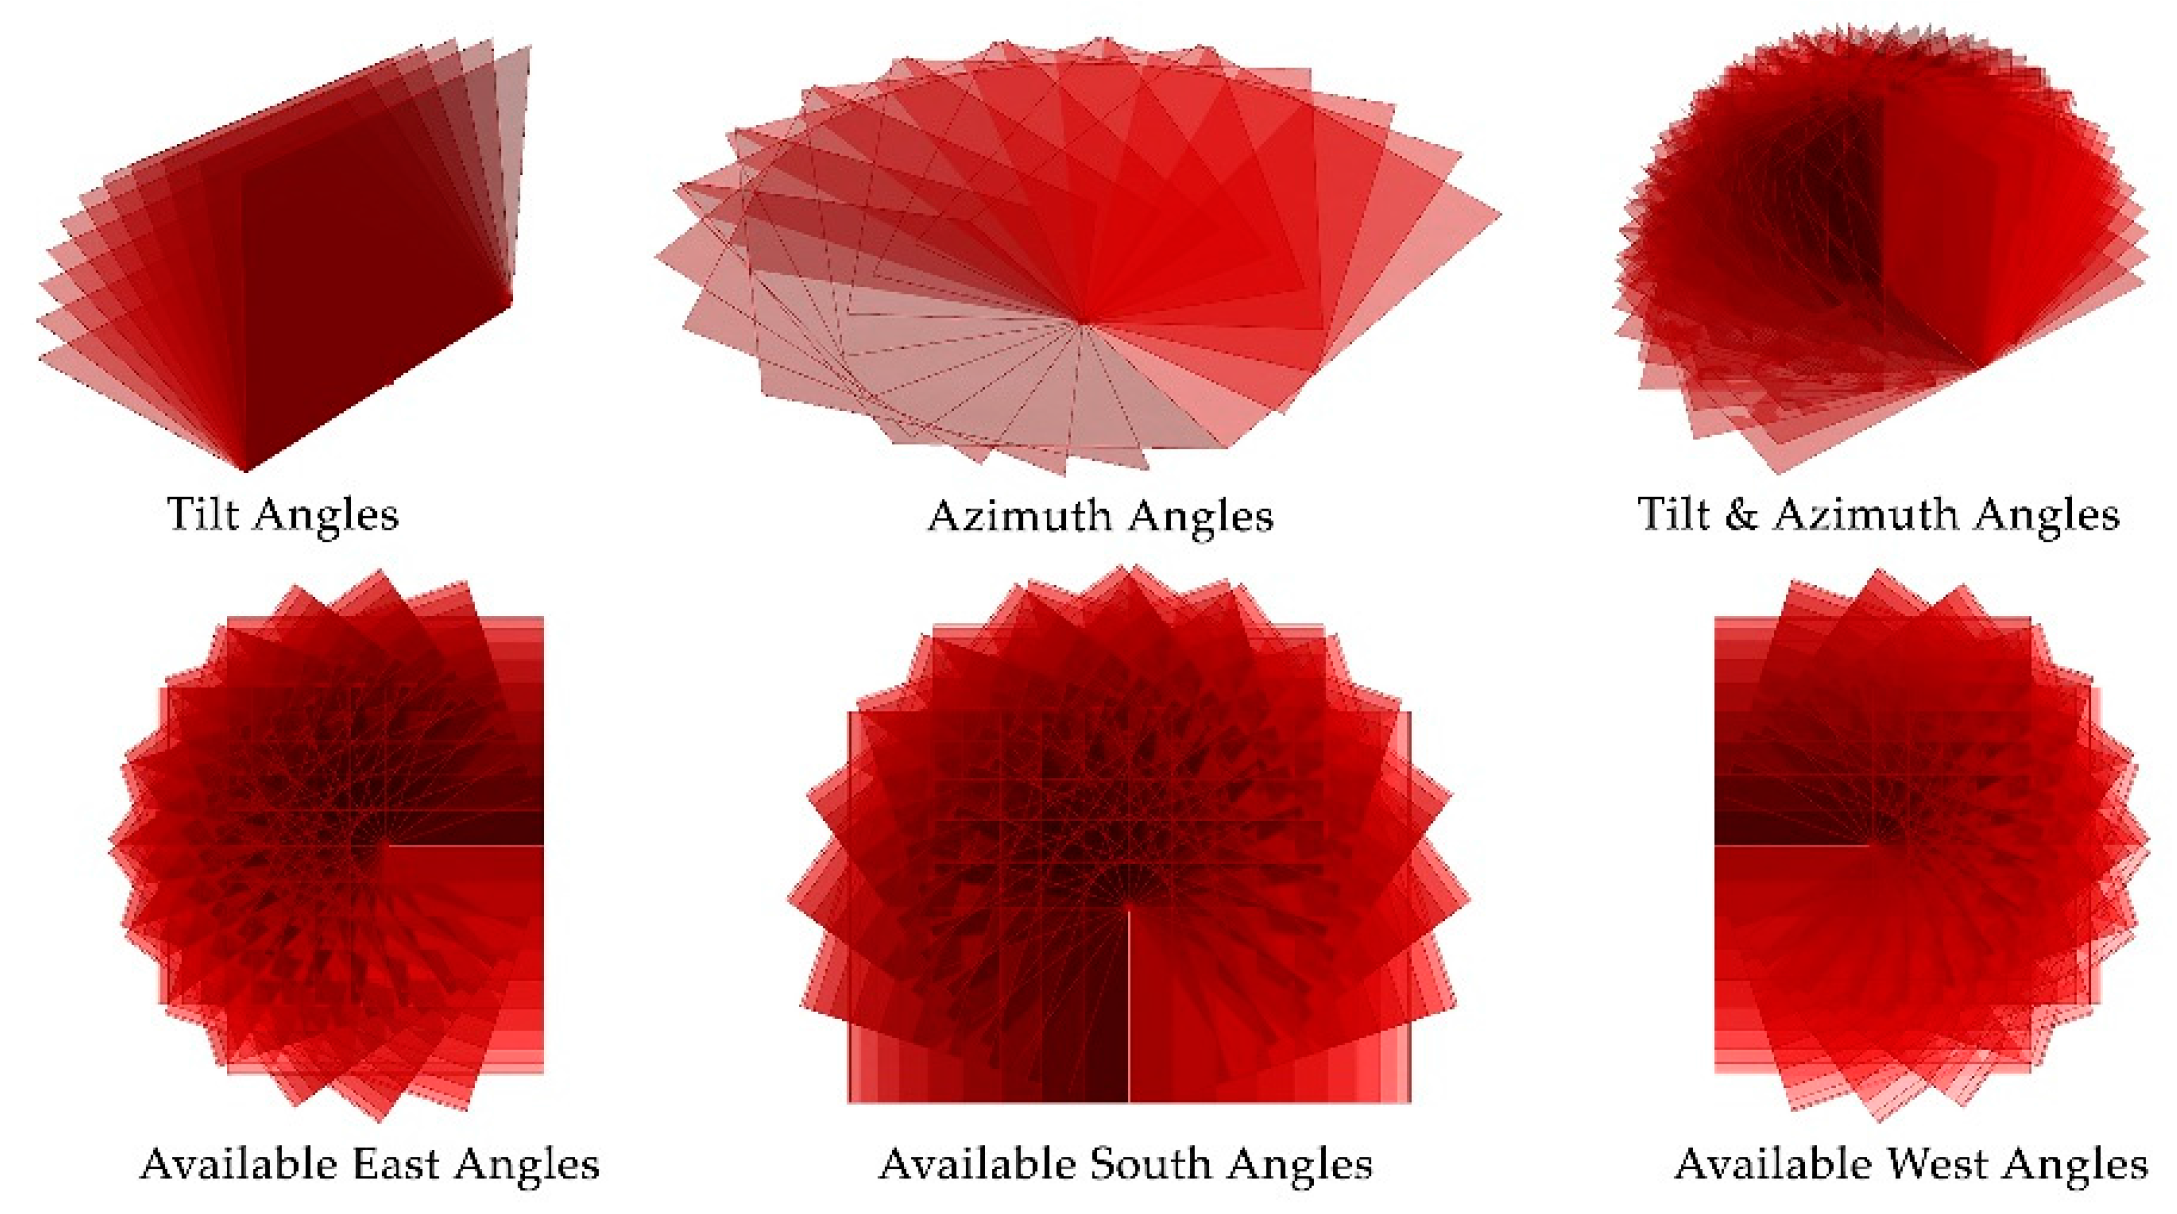
Figure 8.
Defined tilt and azimuth angles for each orientation.
Figure 8.
Defined tilt and azimuth angles for each orientation.
Figure 9.
Simulated optimal tilt and azimuth angles for the south, east, and west façades.
Figure 9.
Simulated optimal tilt and azimuth angles for the south, east, and west façades.
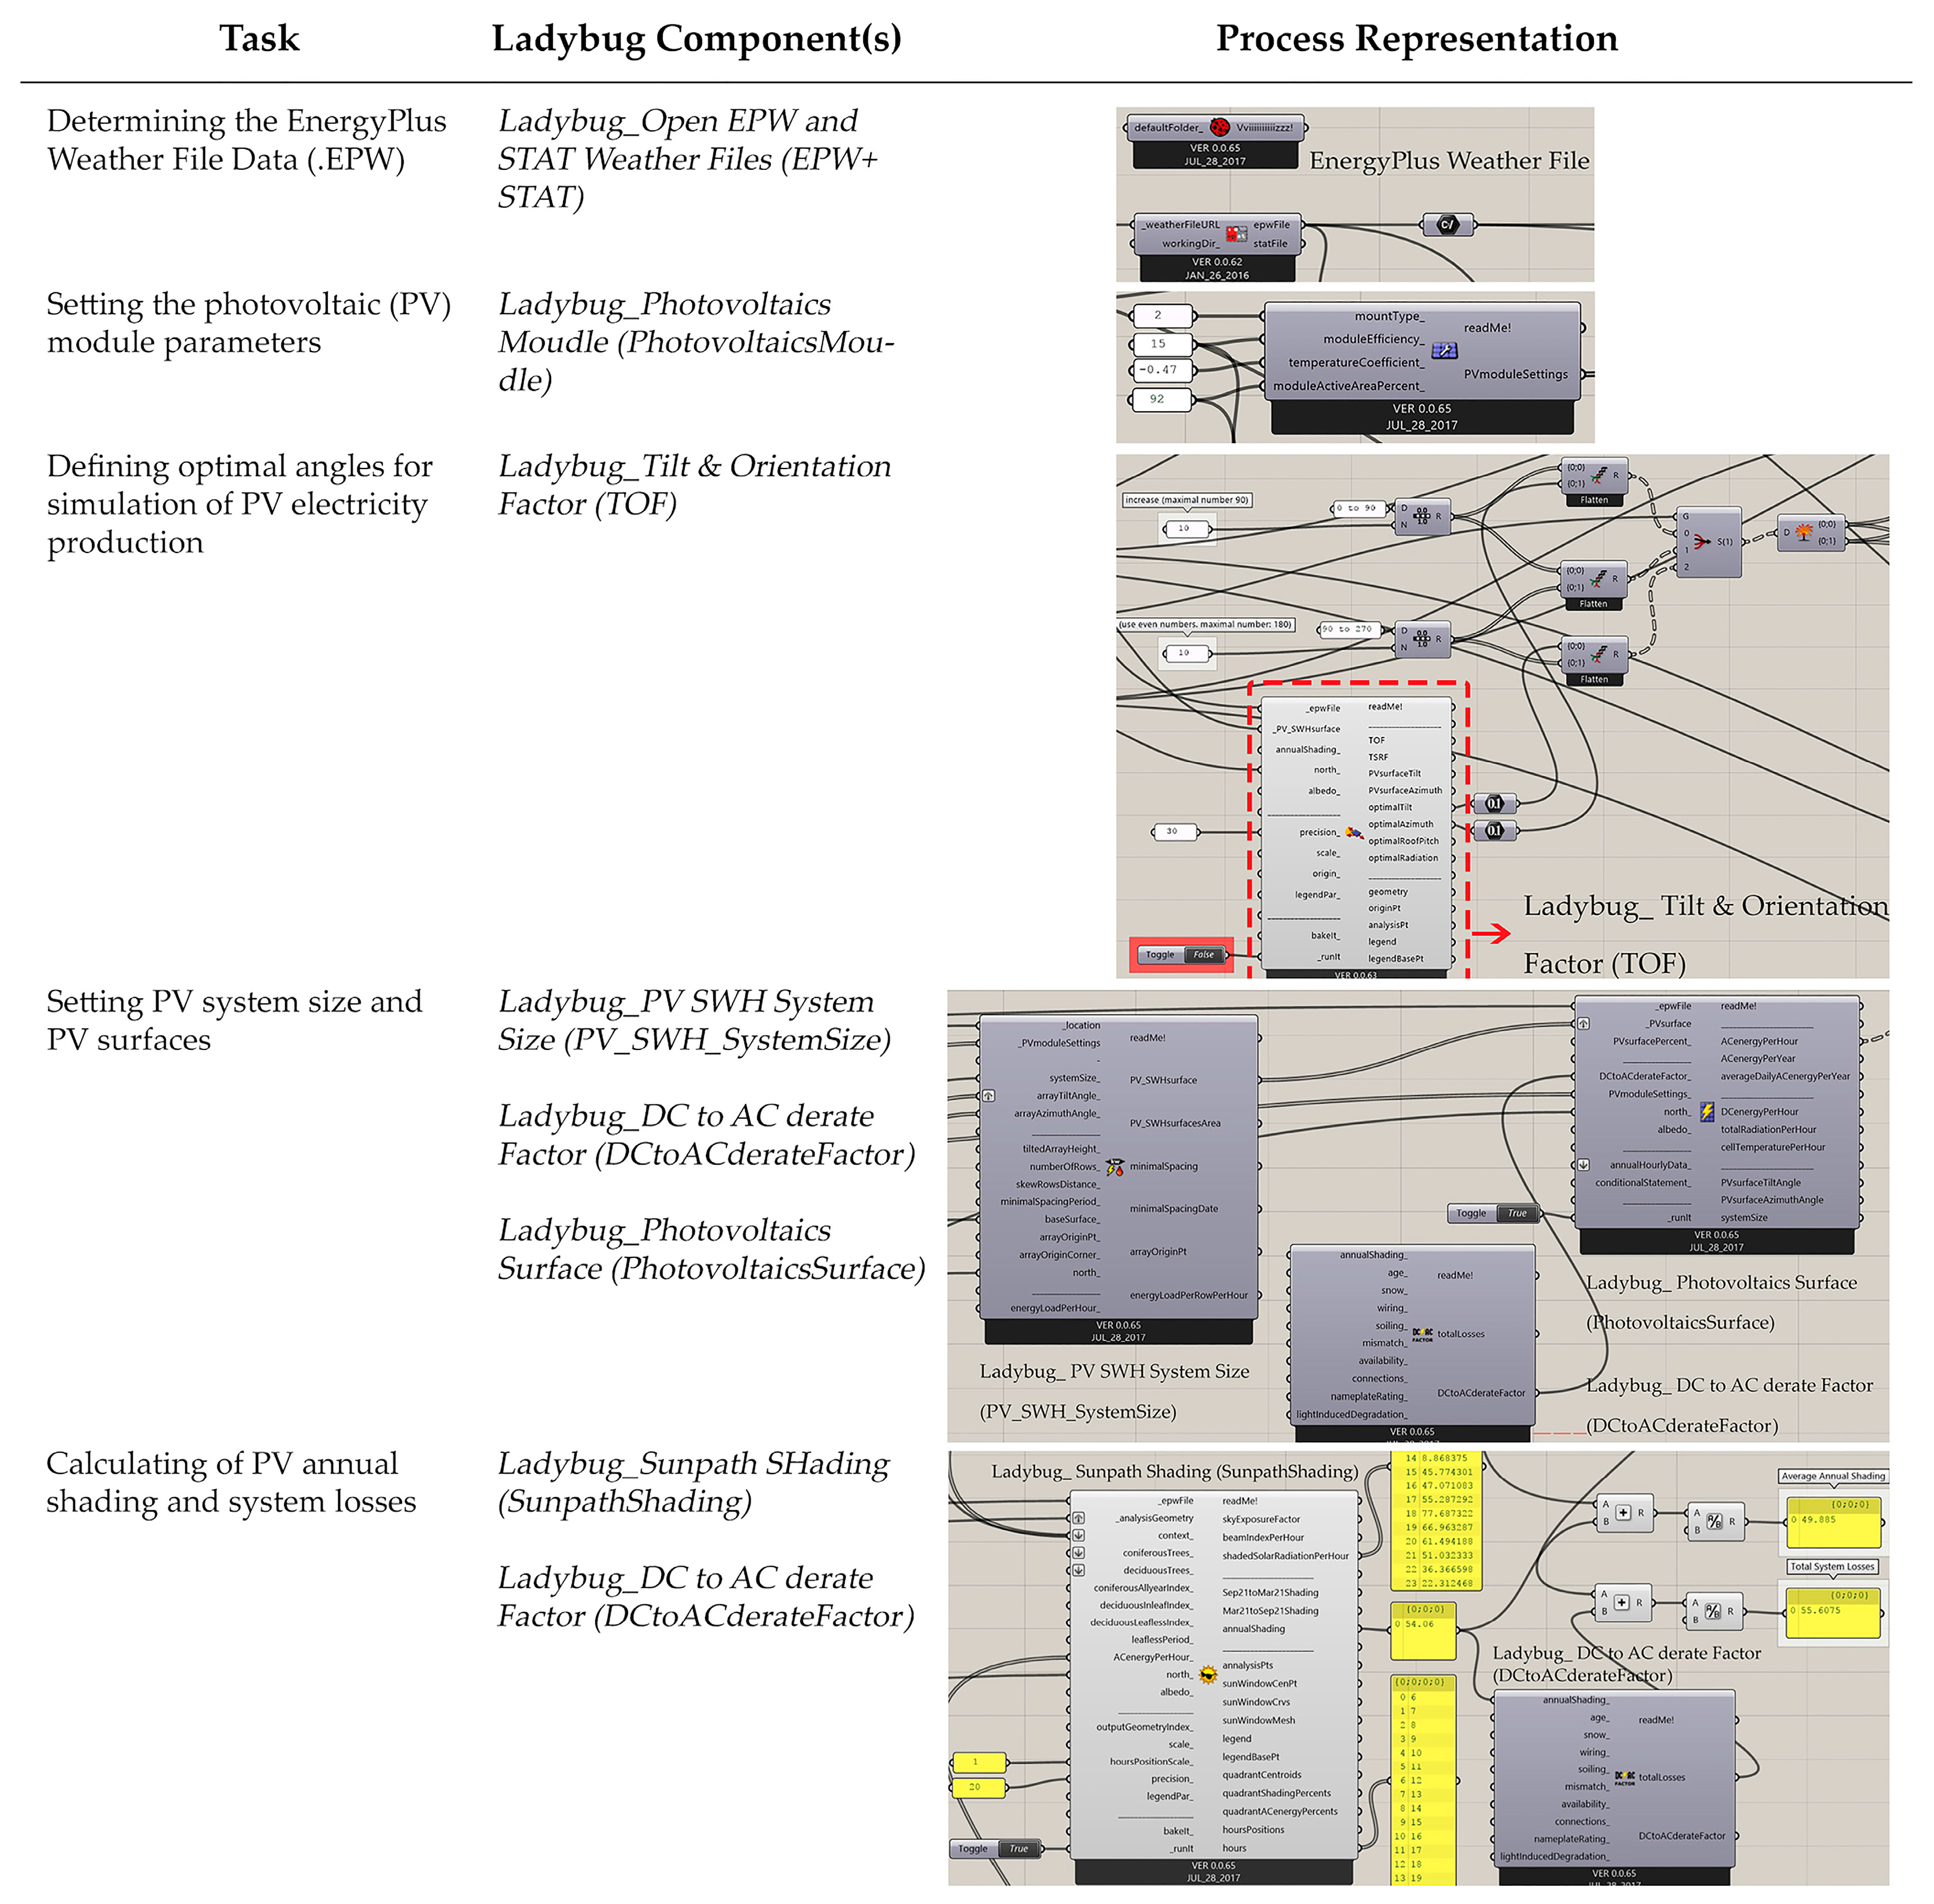
Figure 10.
Grasshopper and Ladybug definition of the PV-integrated shading devices.
Figure 10.
Grasshopper and Ladybug definition of the PV-integrated shading devices.
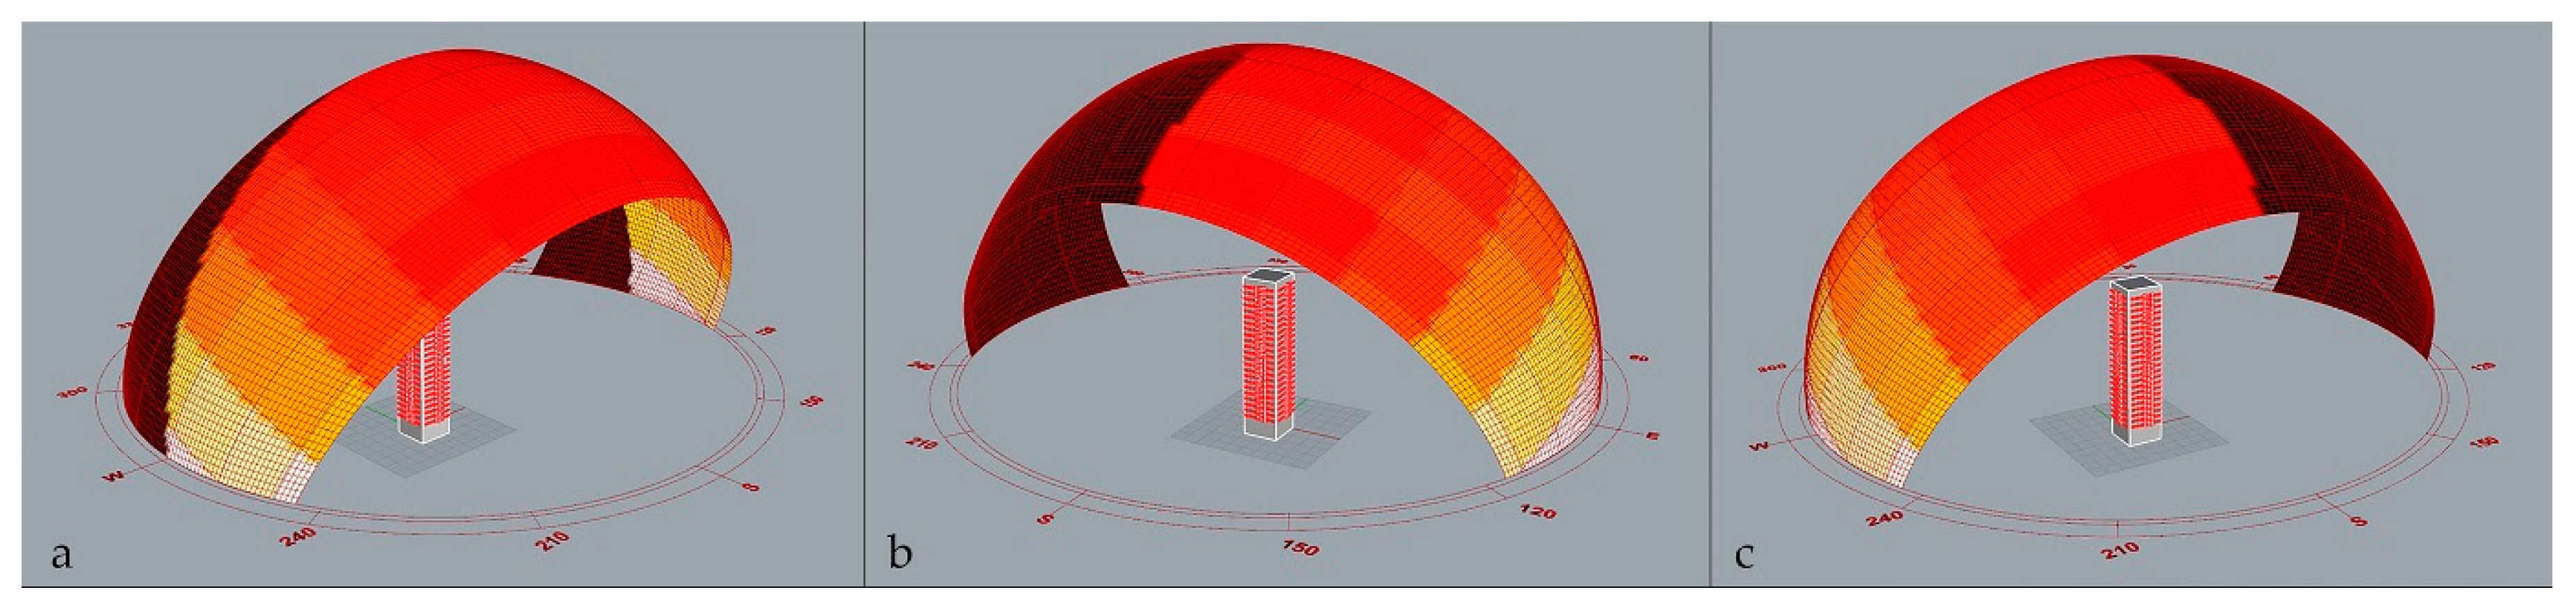
Figure 11.
Ladybug_Sunpath Shading diagram for the (a) south, (b) east, and (c) west façades.
Figure 11.
Ladybug_Sunpath Shading diagram for the (a) south, (b) east, and (c) west façades.
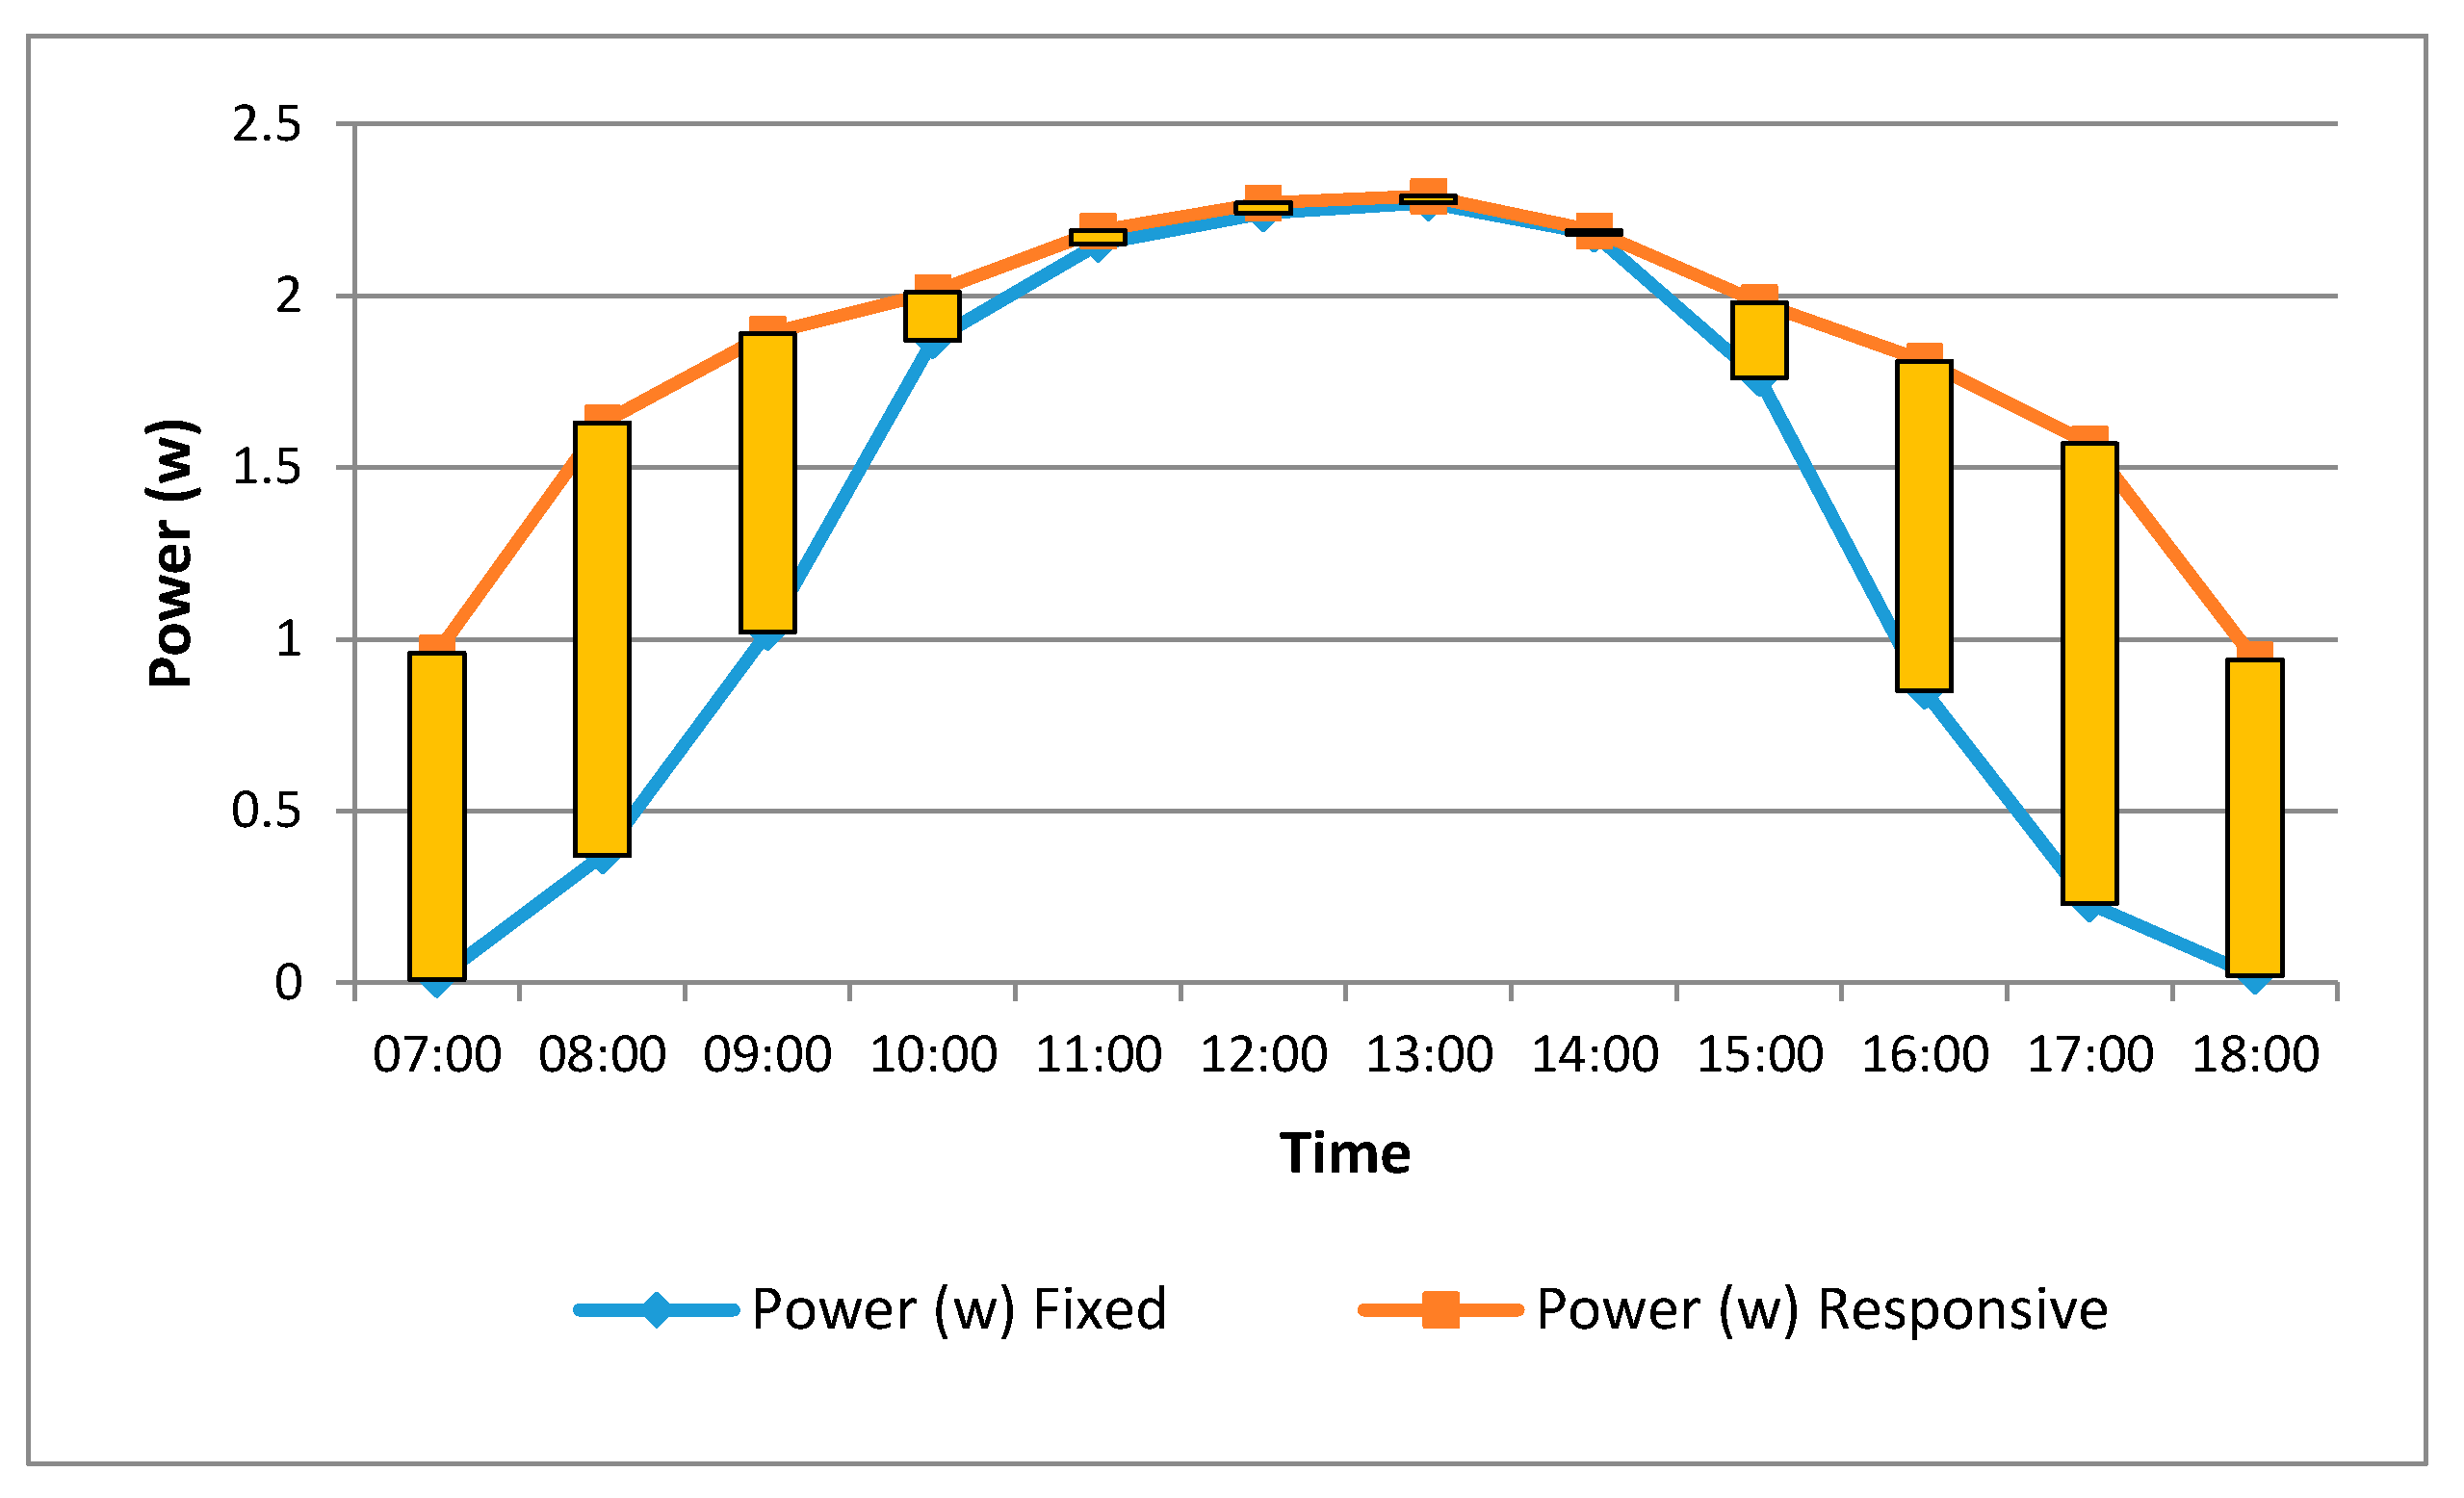
Figure 12.
Power producing differences between both PV systems.
Figure 12.
Power producing differences between both PV systems.
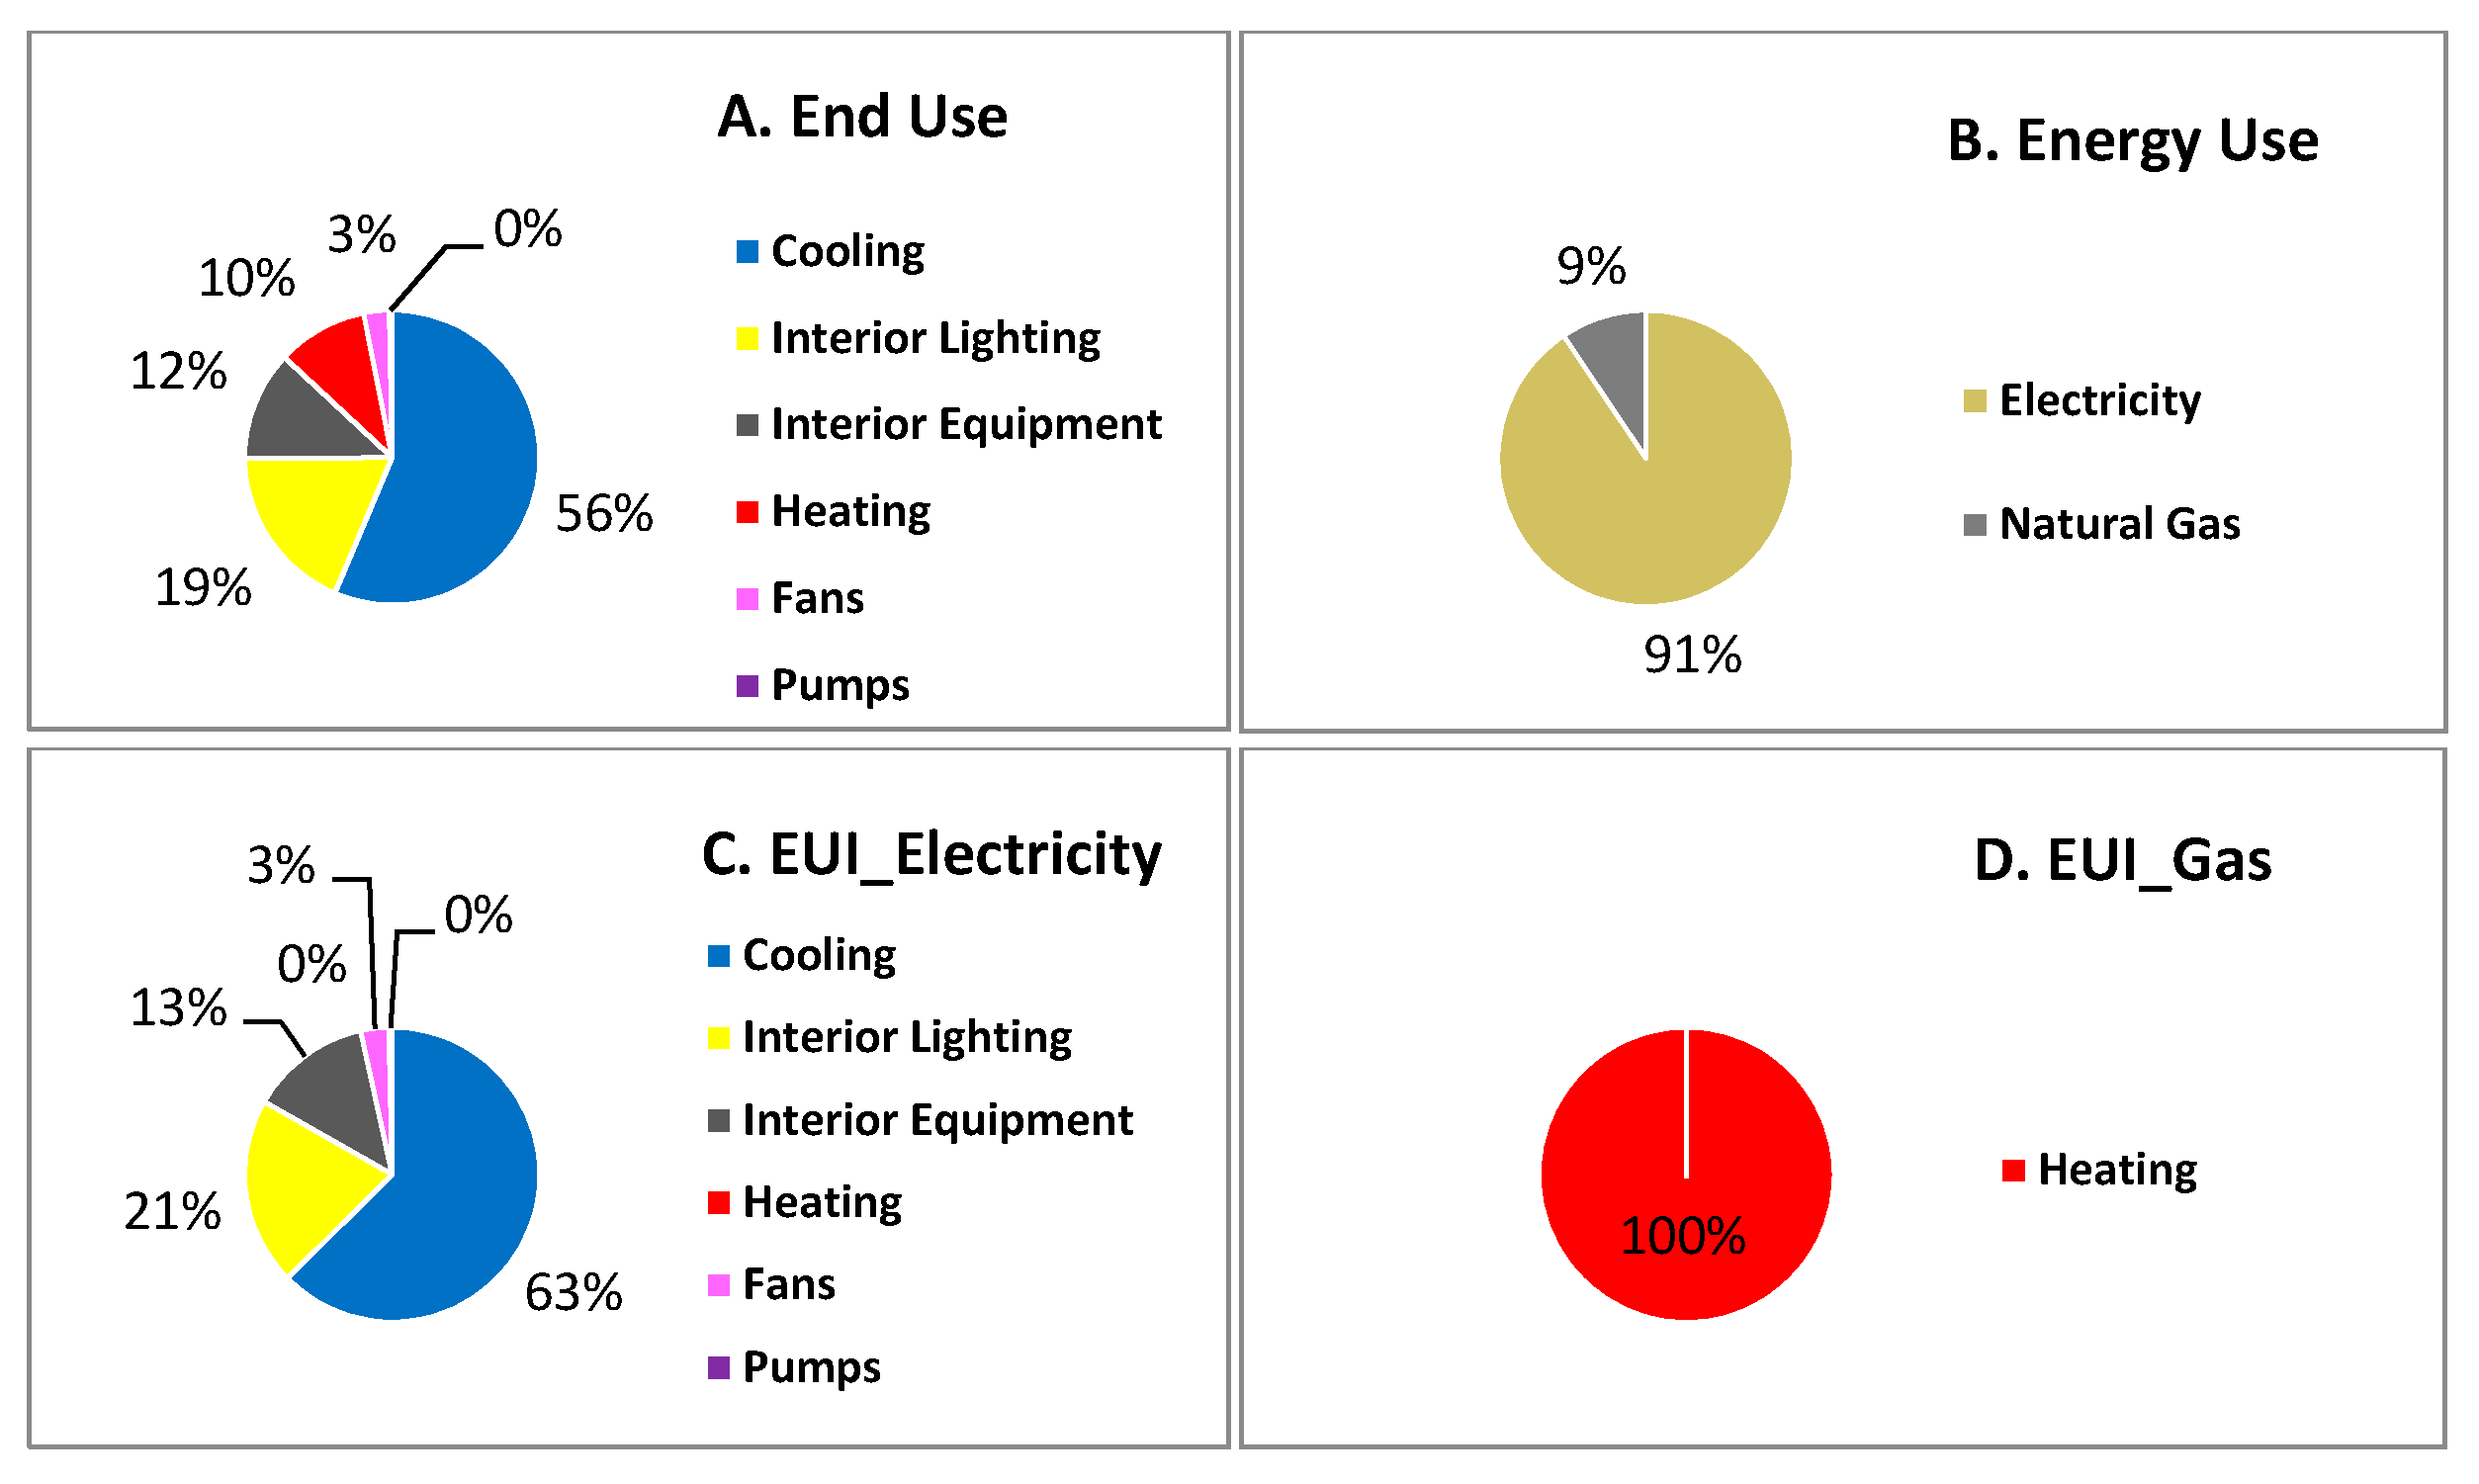
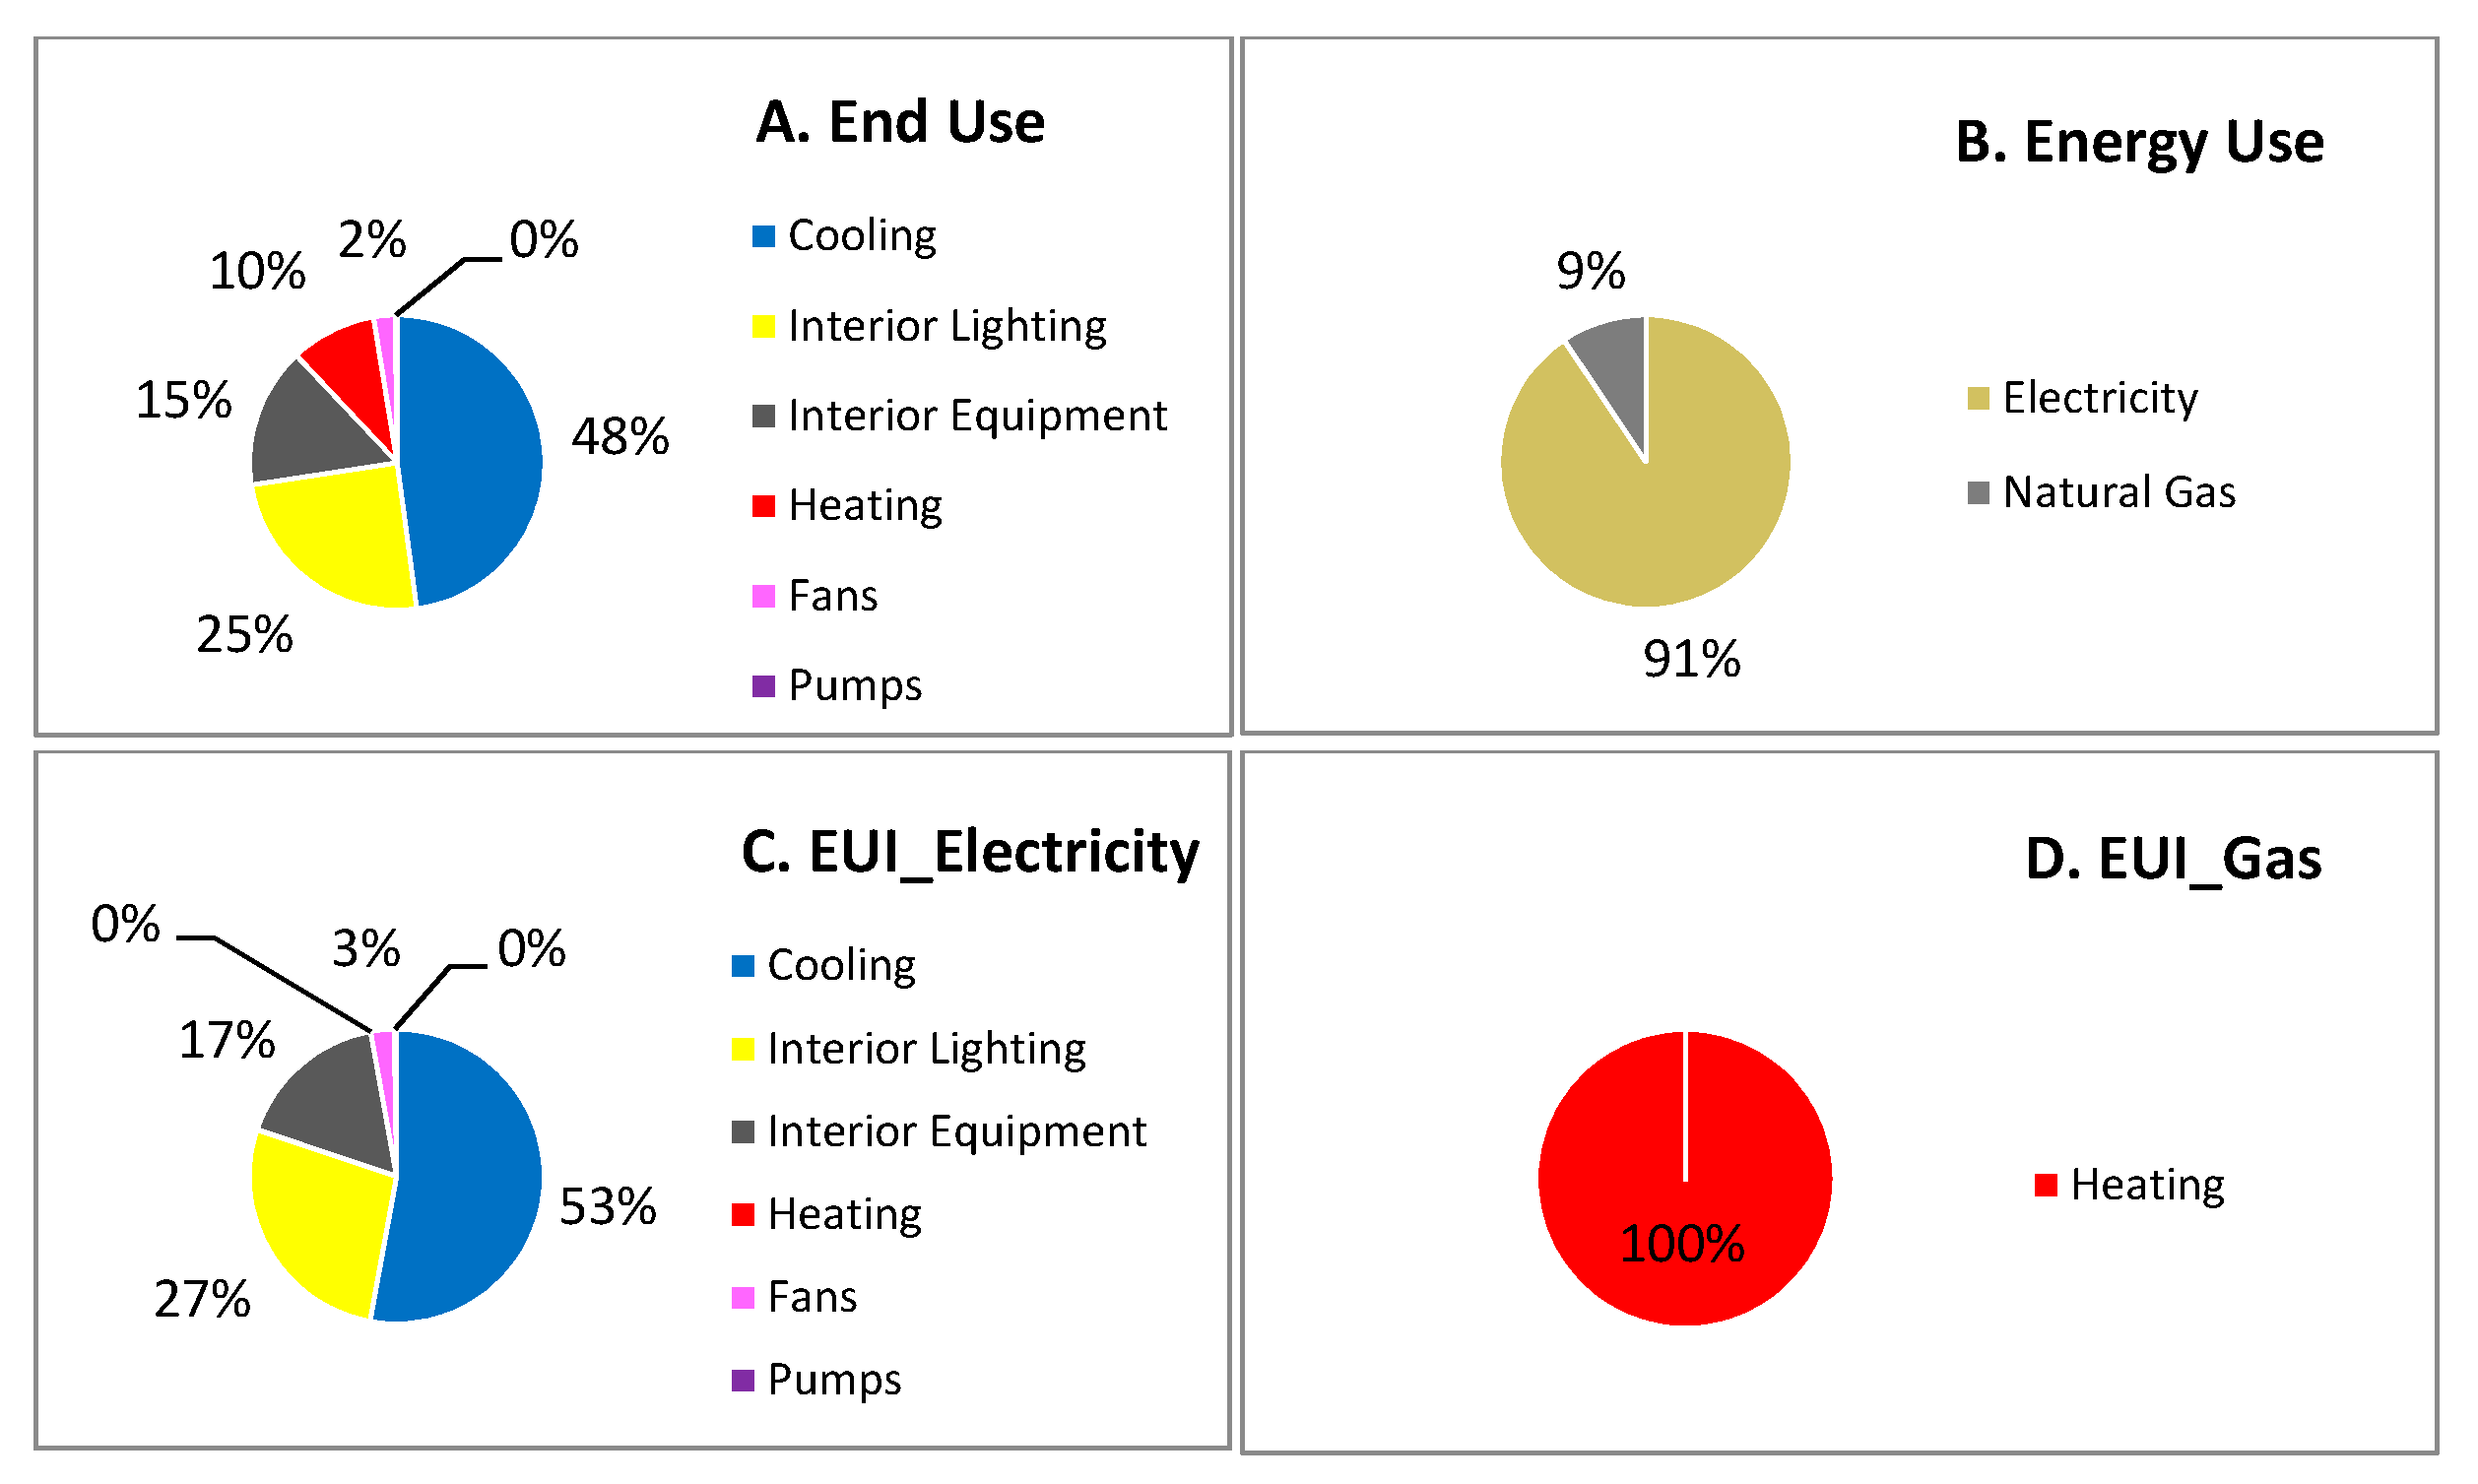
Figure 13.
(A–D) An overview of annual energy use and end-use per category.
Figure 13.
(A–D) An overview of annual energy use and end-use per category.
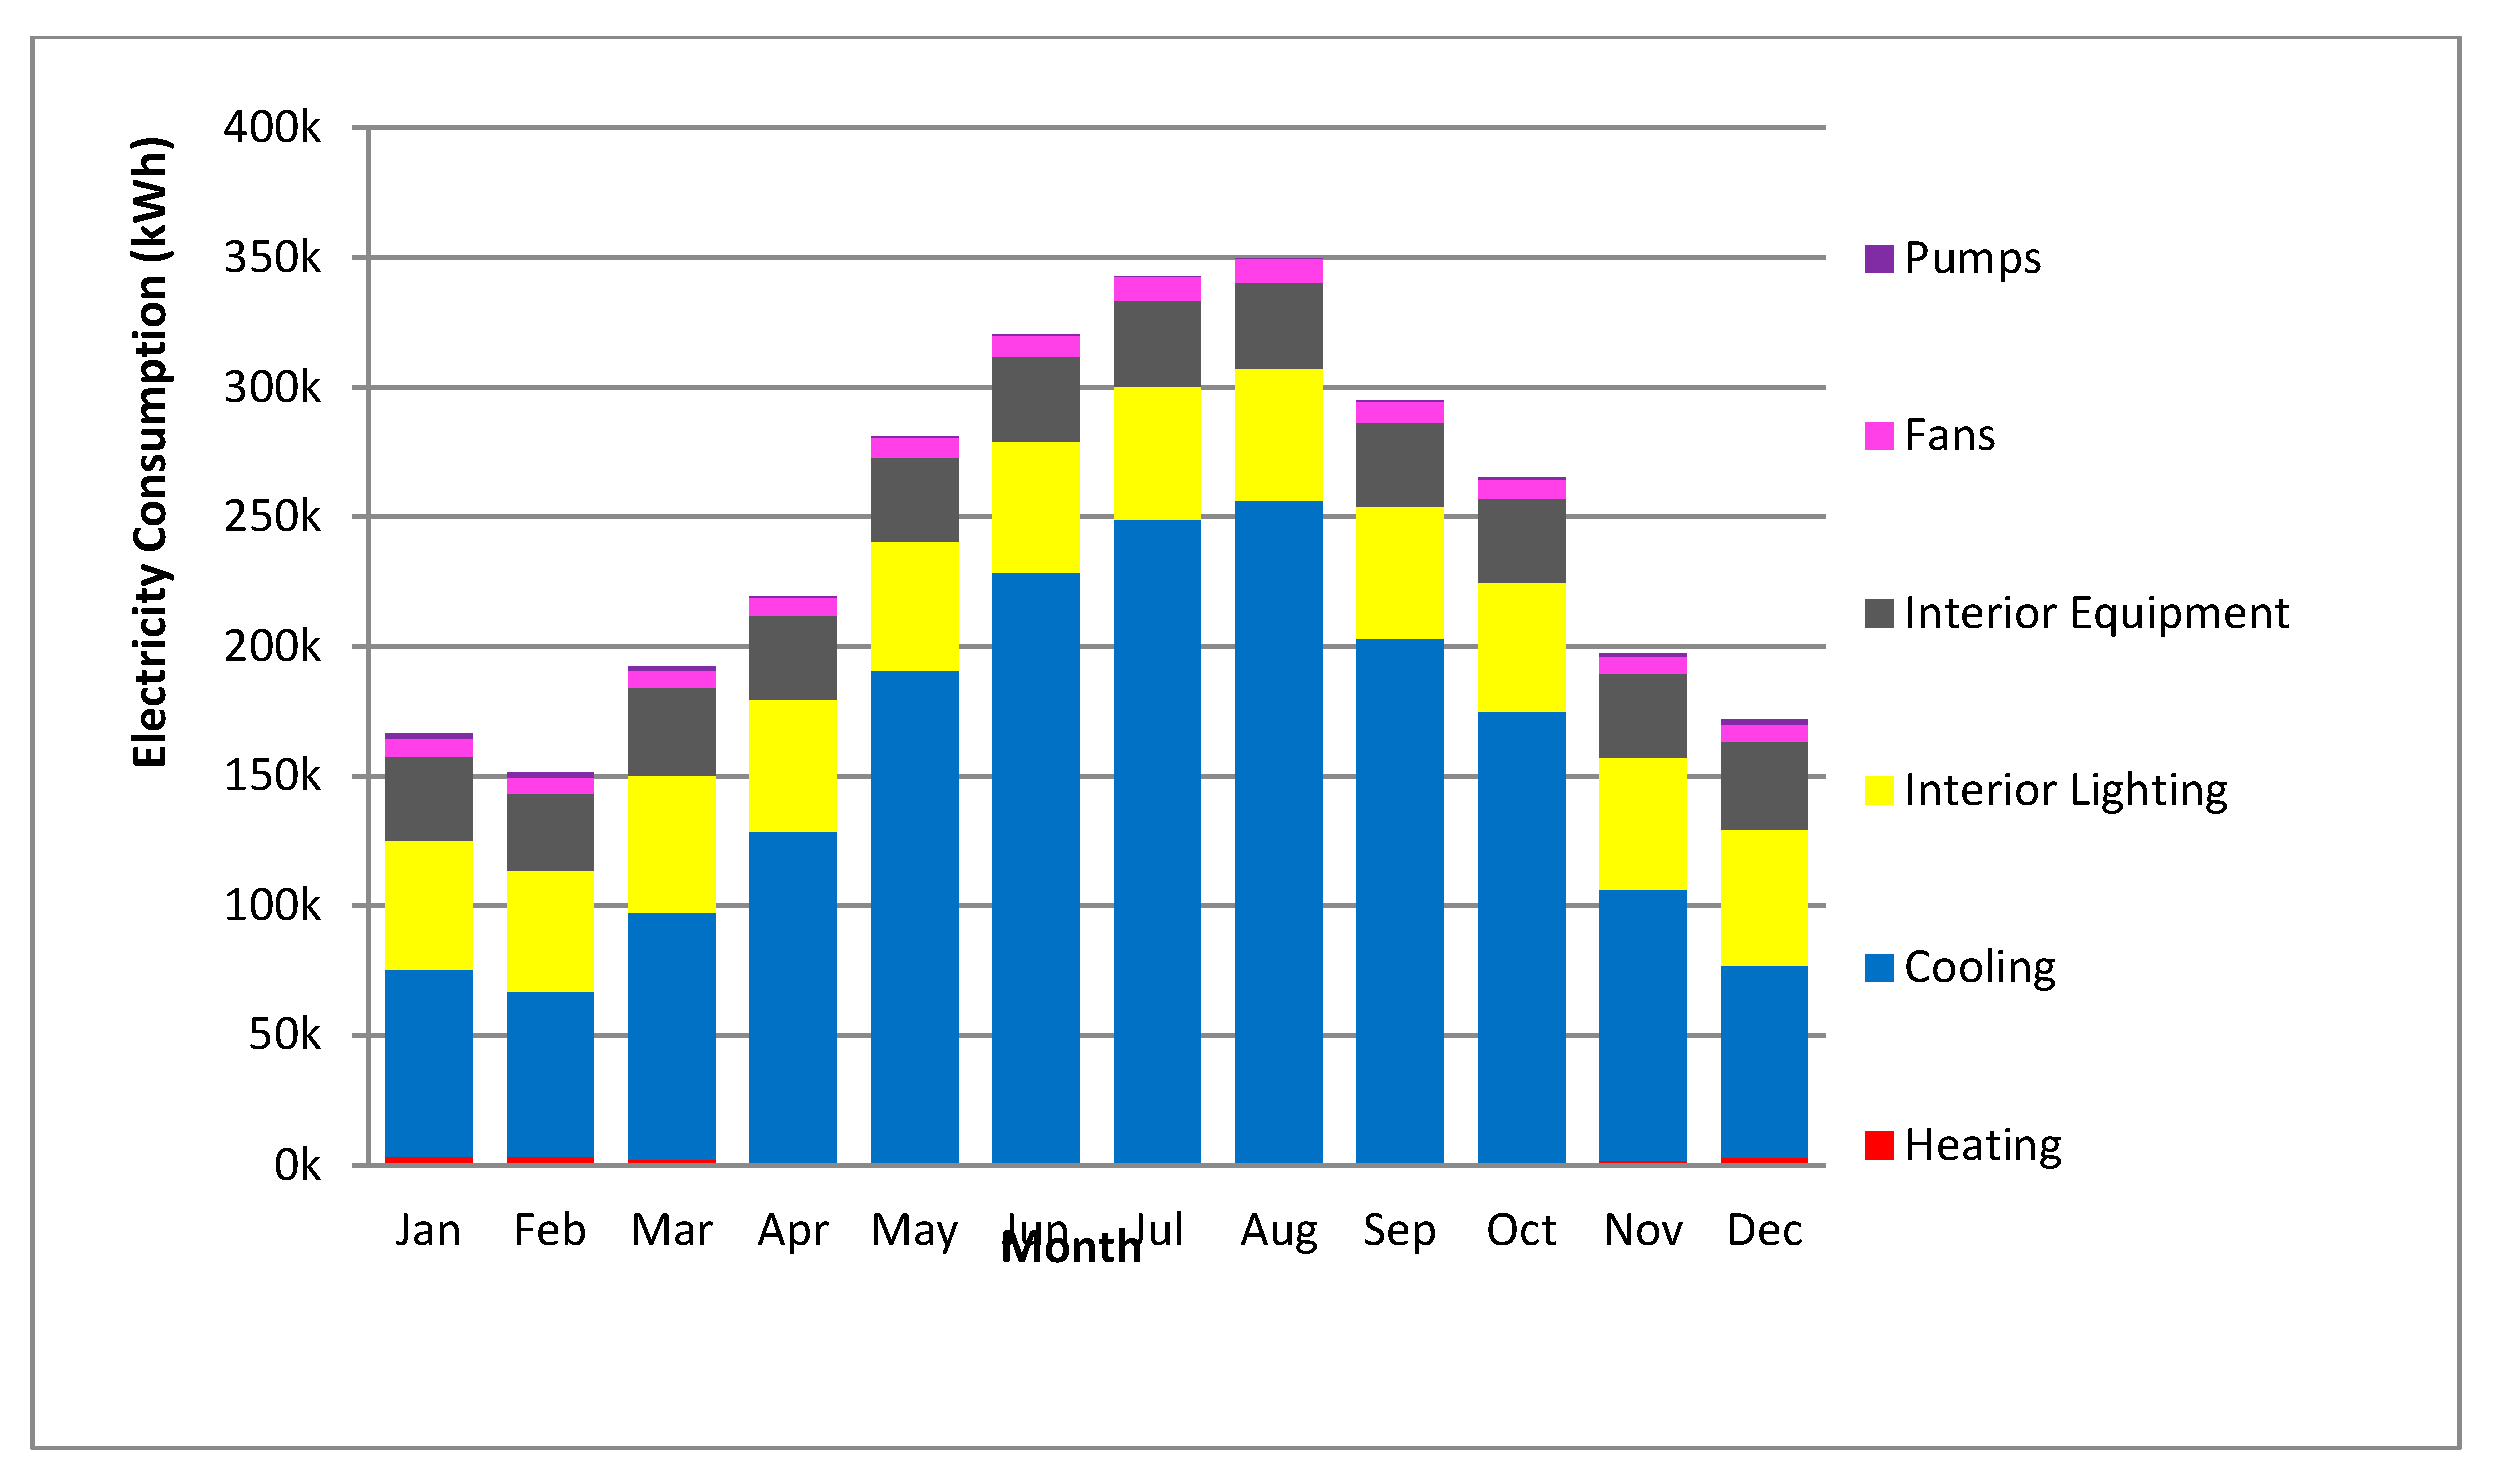
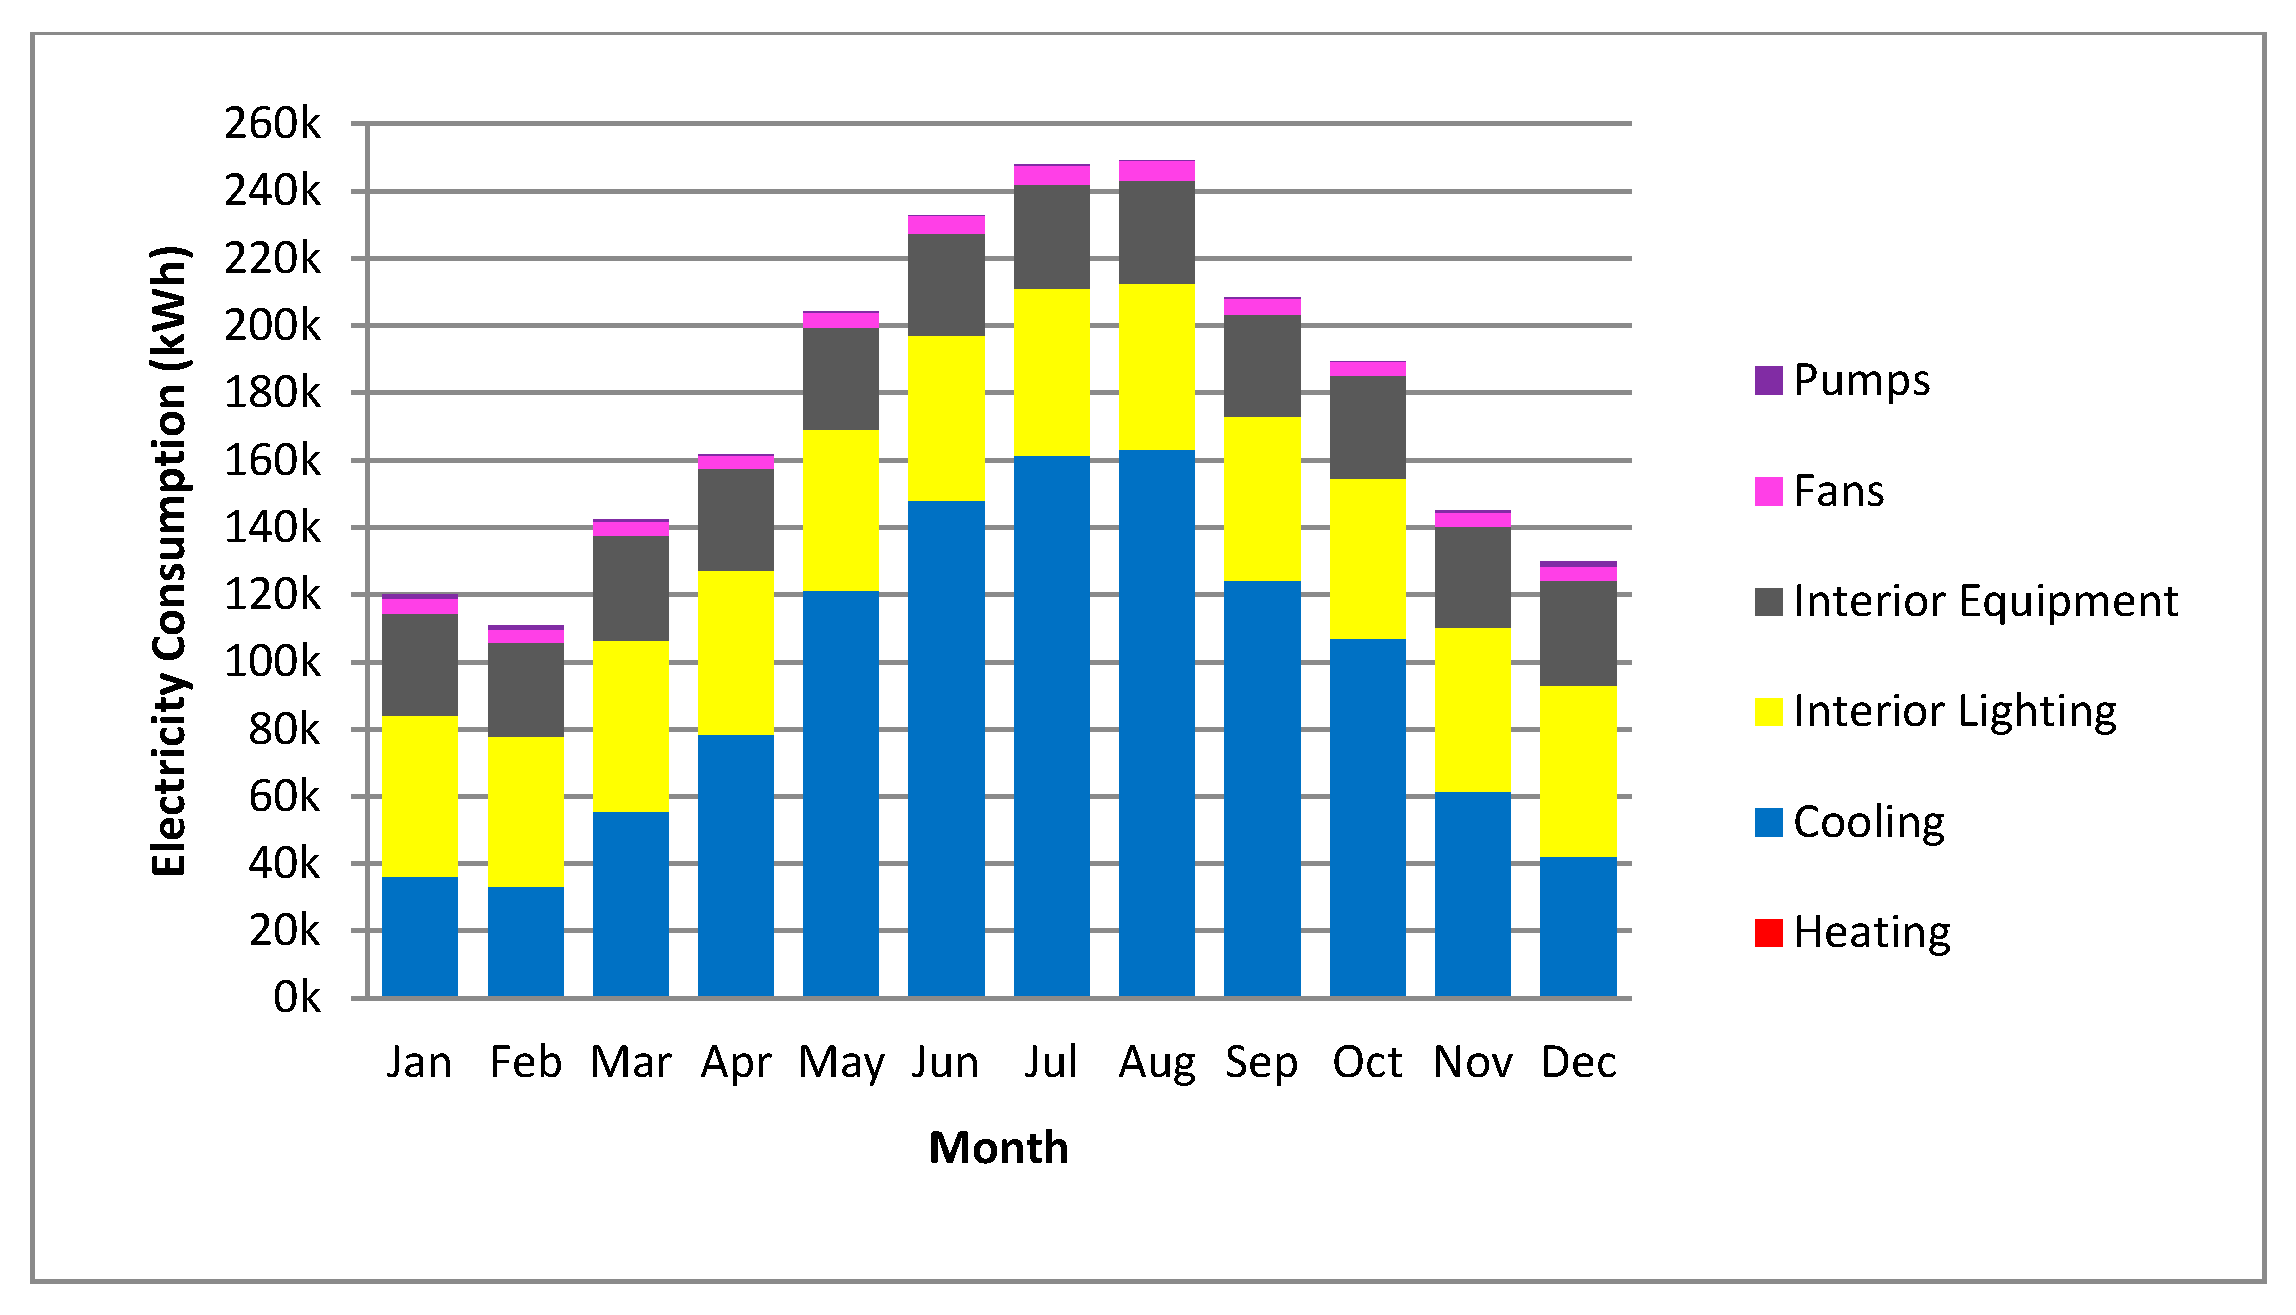
Figure 14.
An overview of monthly electricity consumption.
Figure 14.
An overview of monthly electricity consumption.
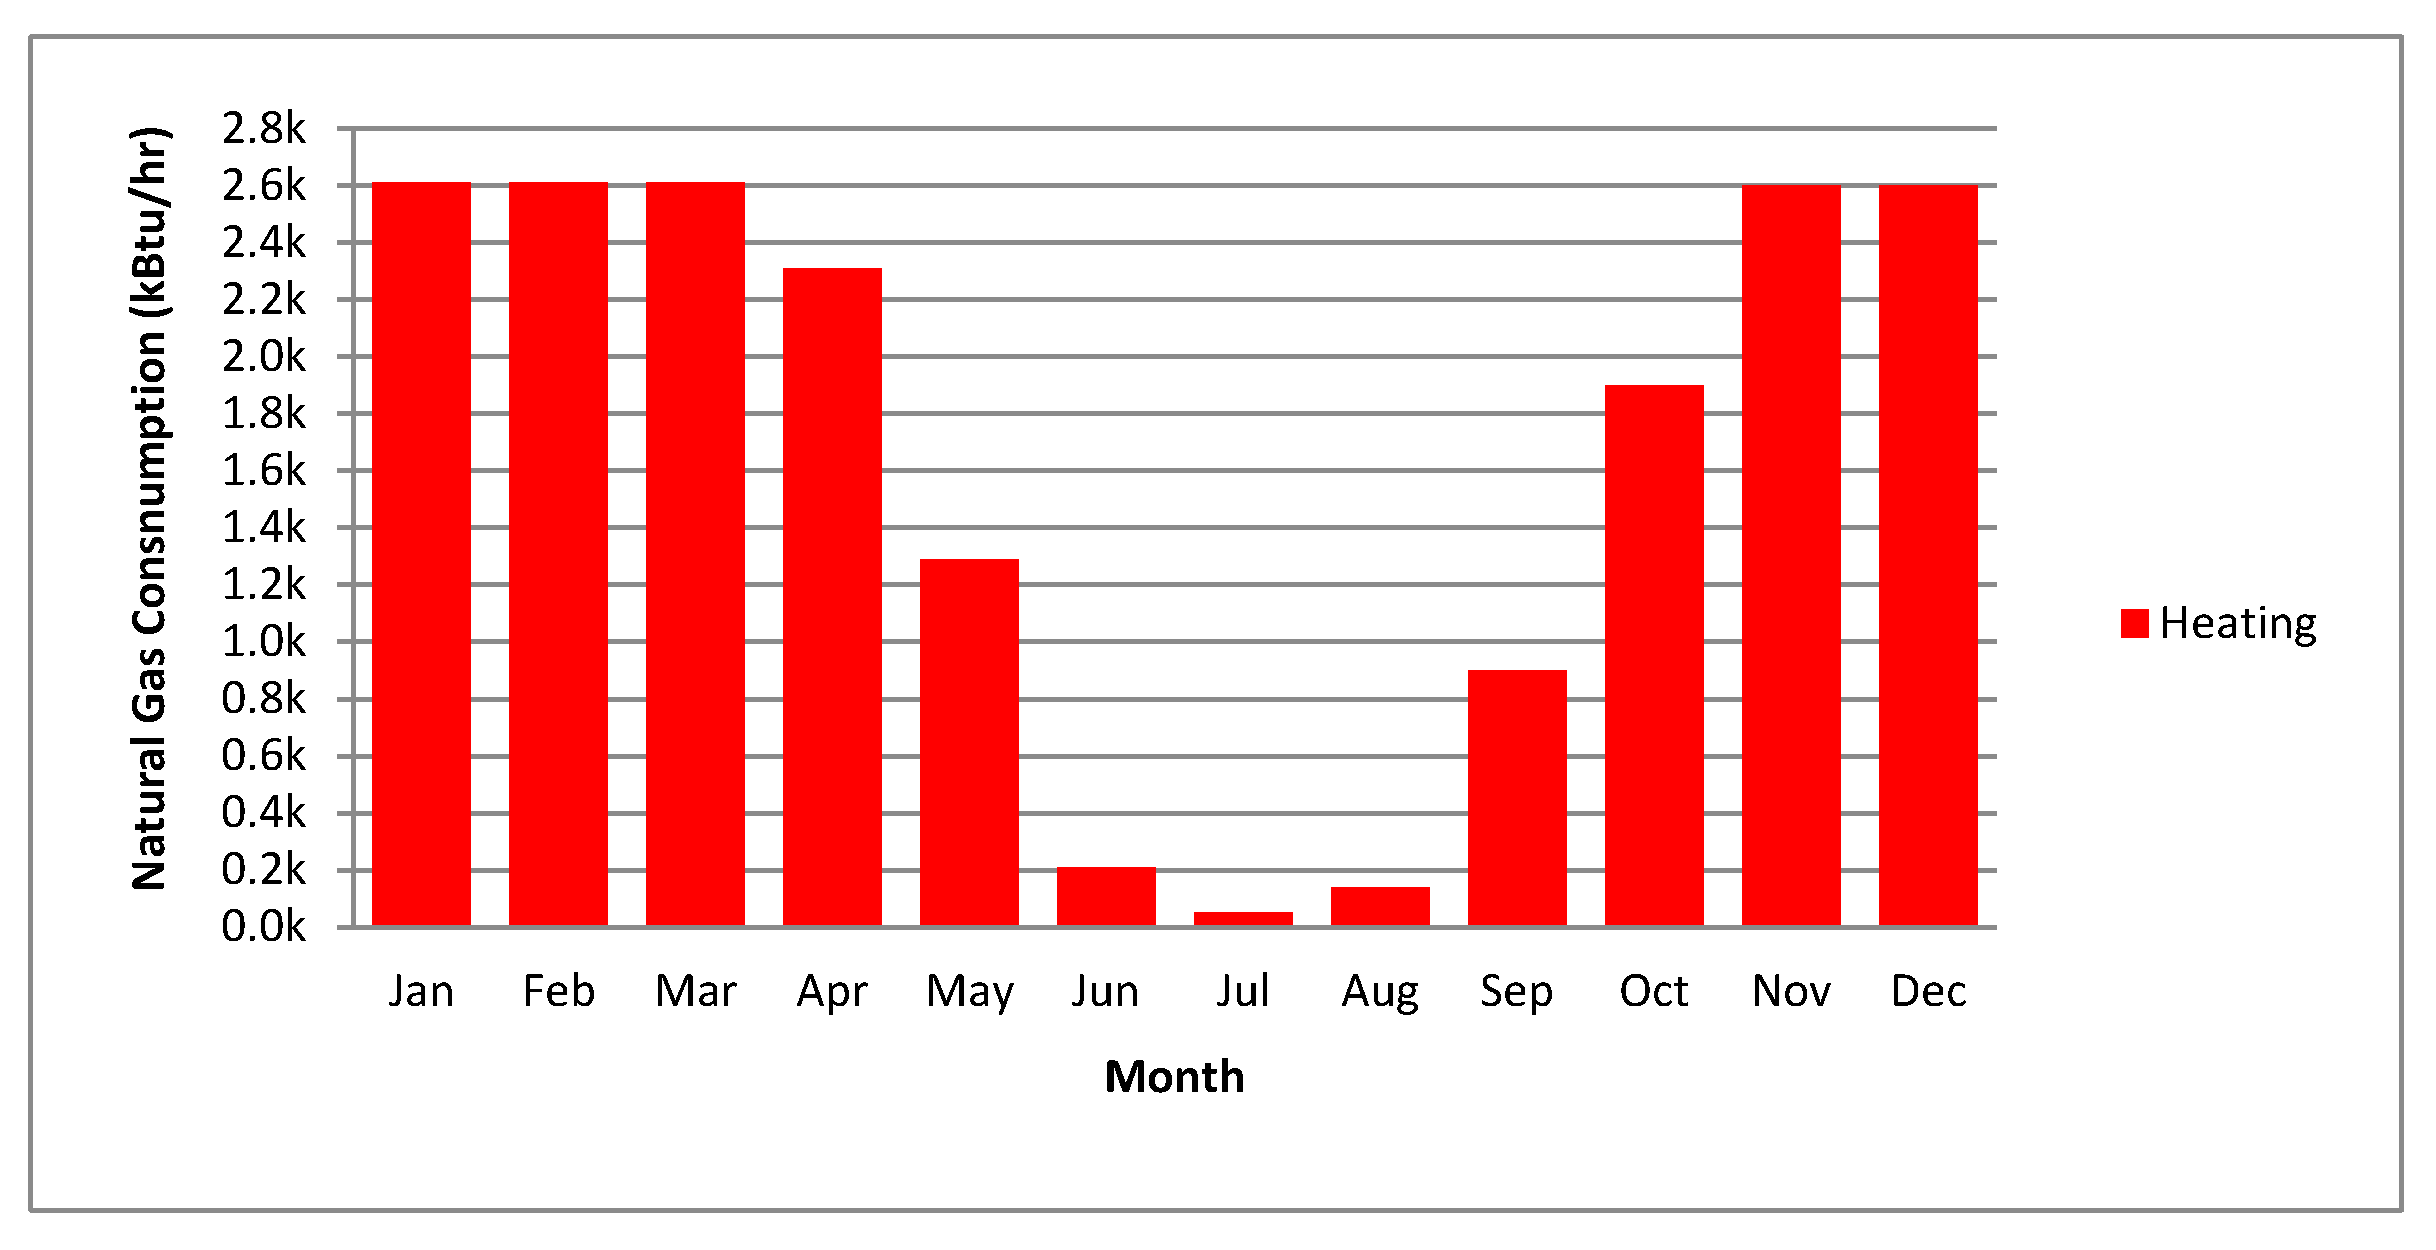
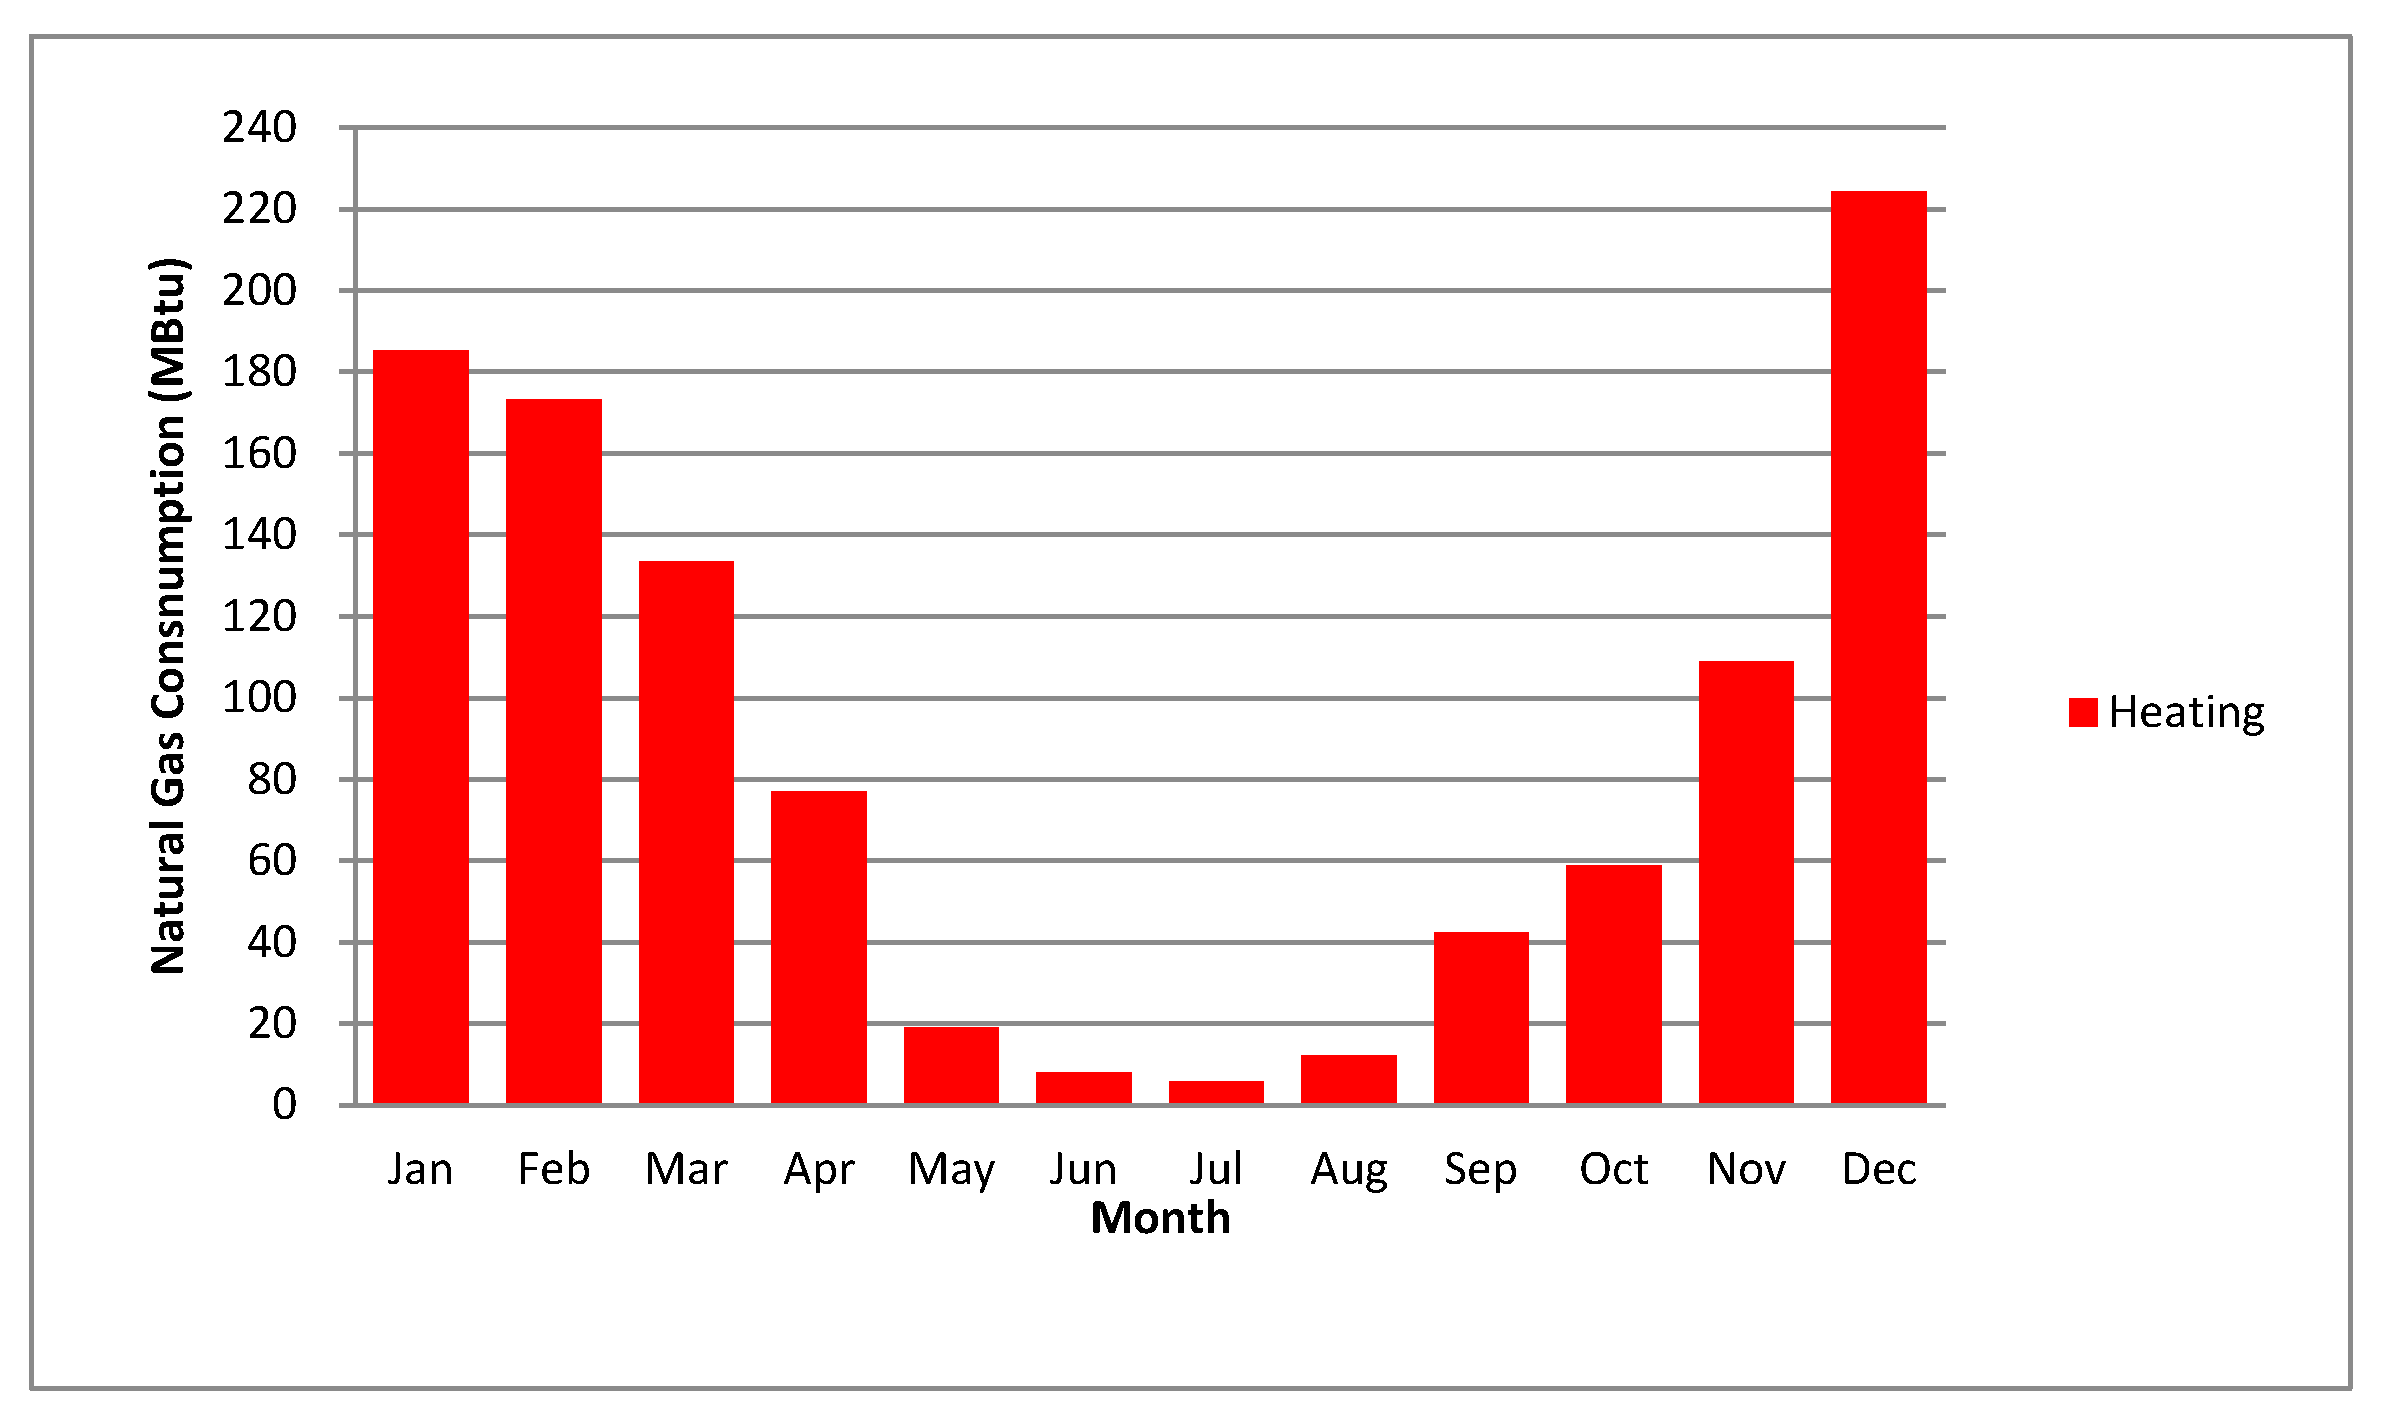
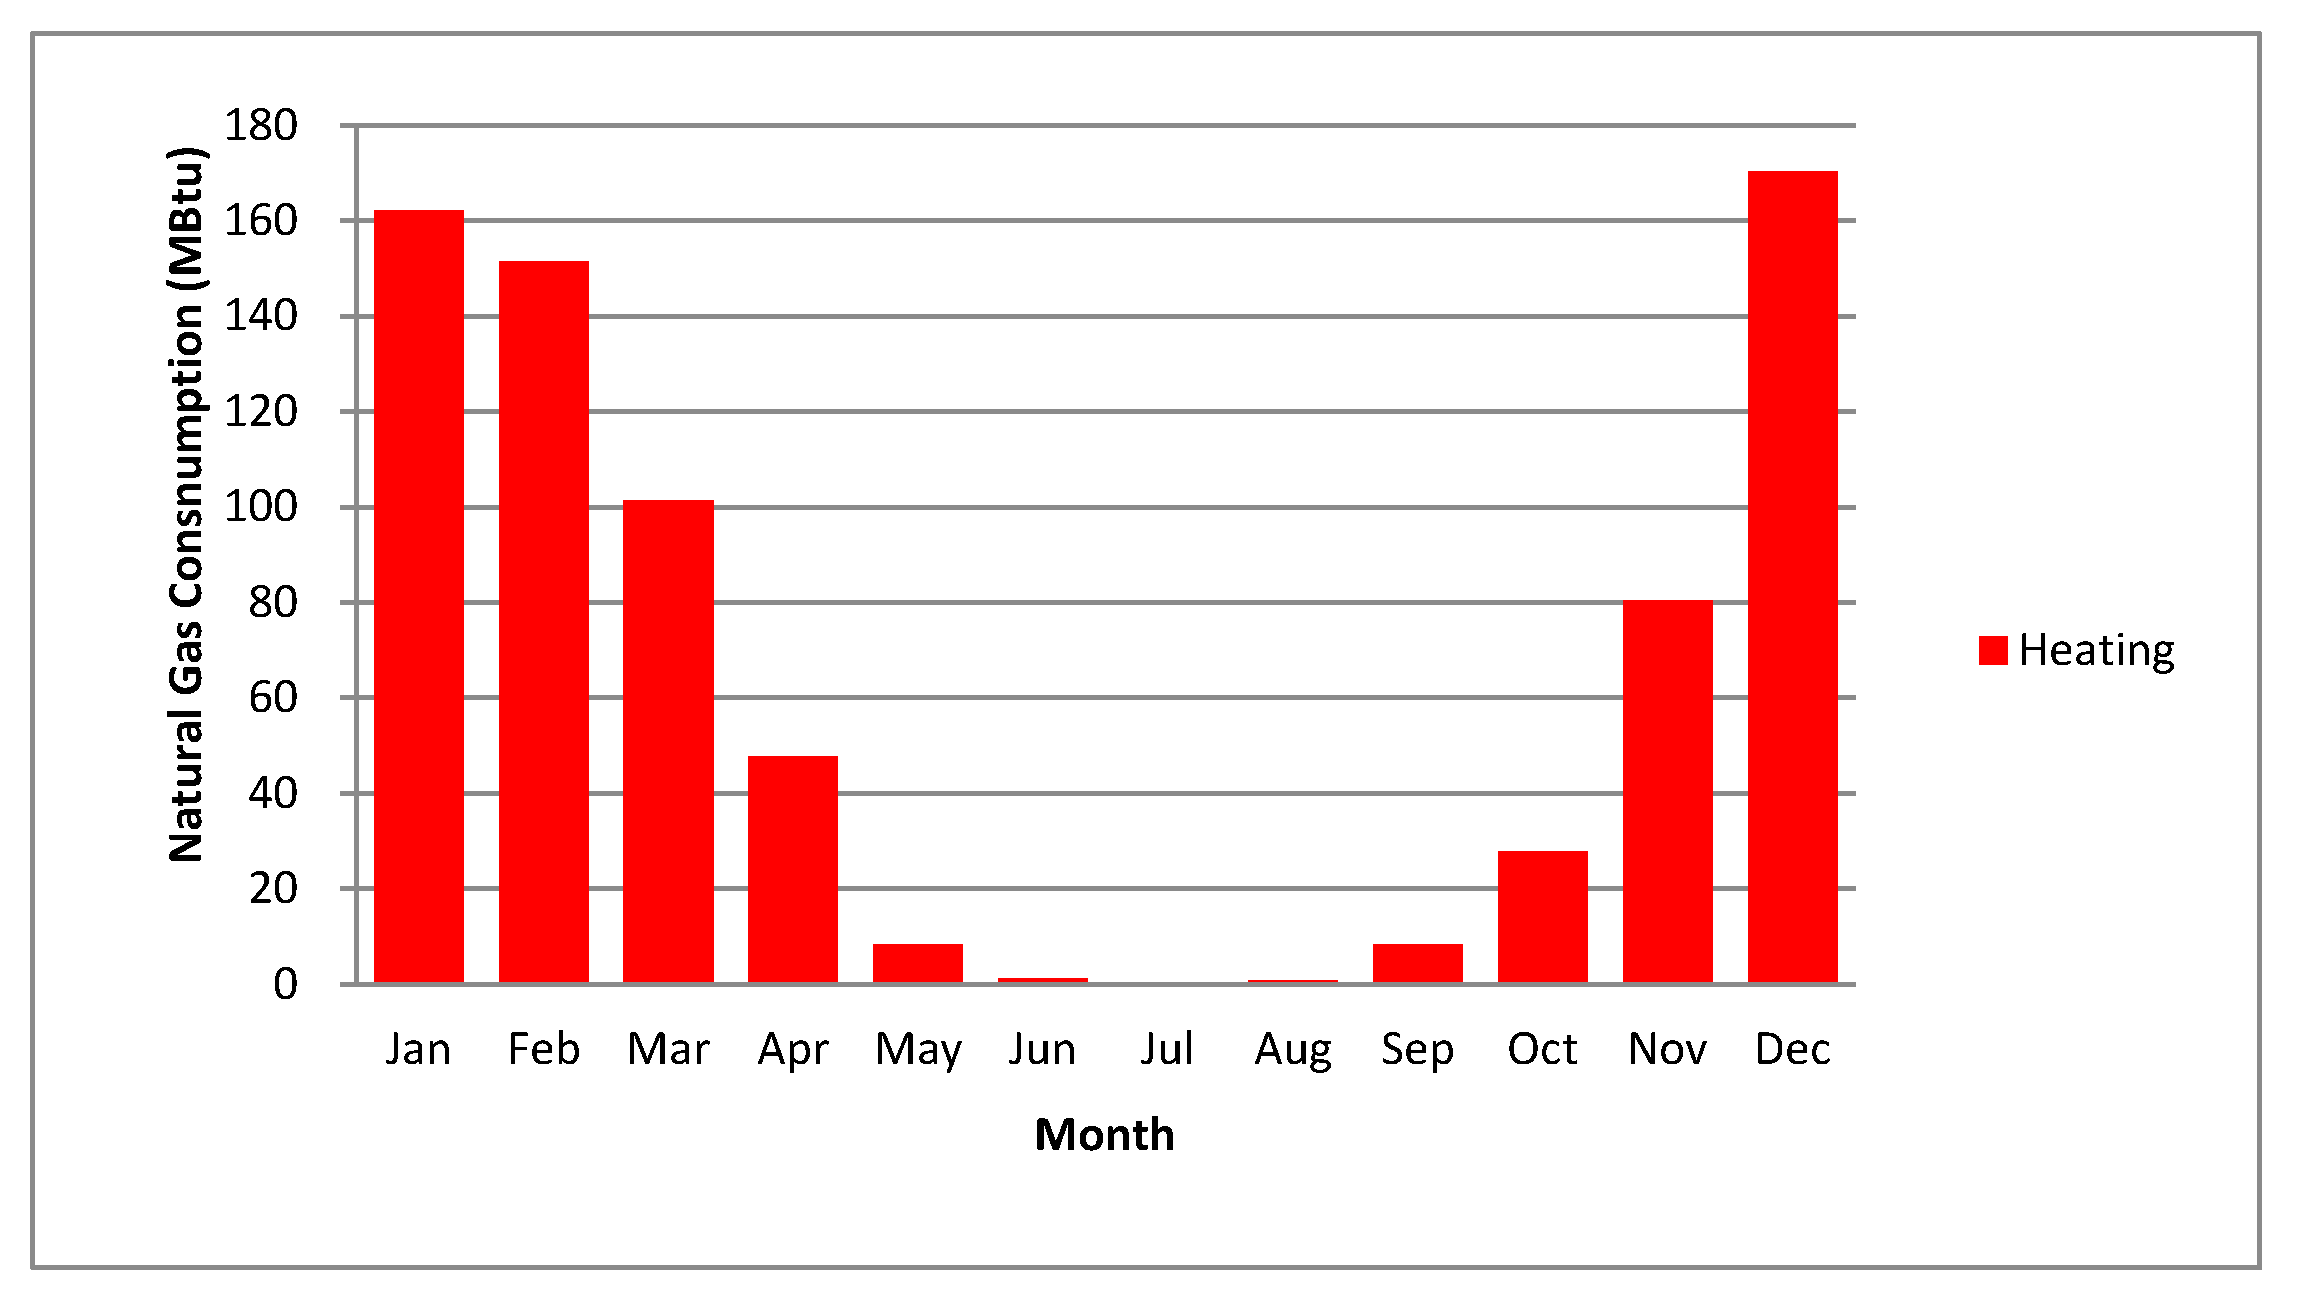
Figure 15.
An overview of monthly natural gas consumption.
Figure 15.
An overview of monthly natural gas consumption.
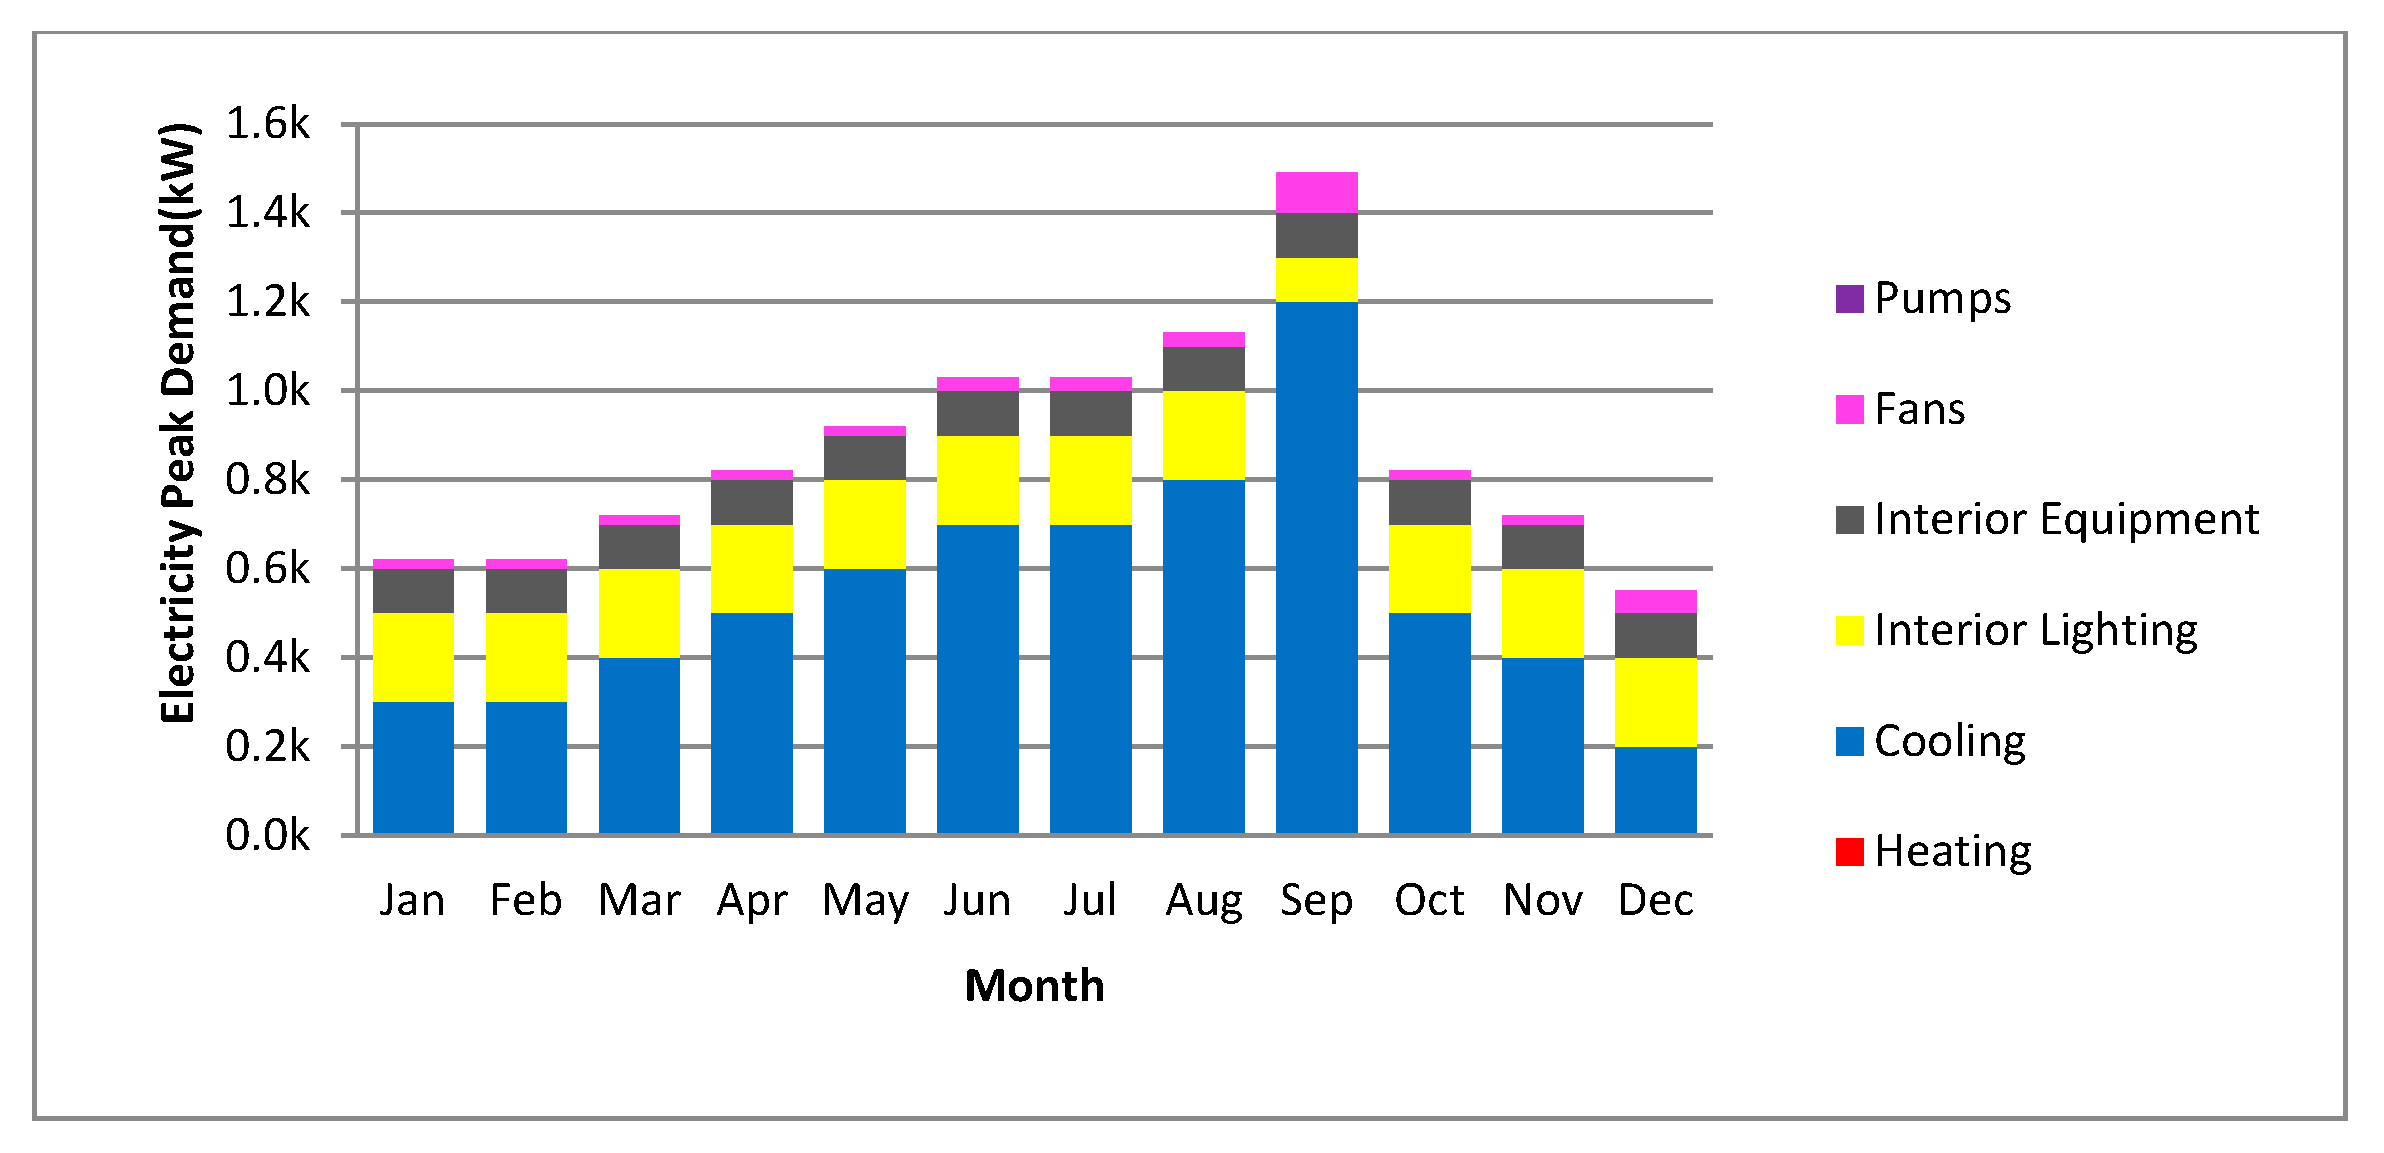
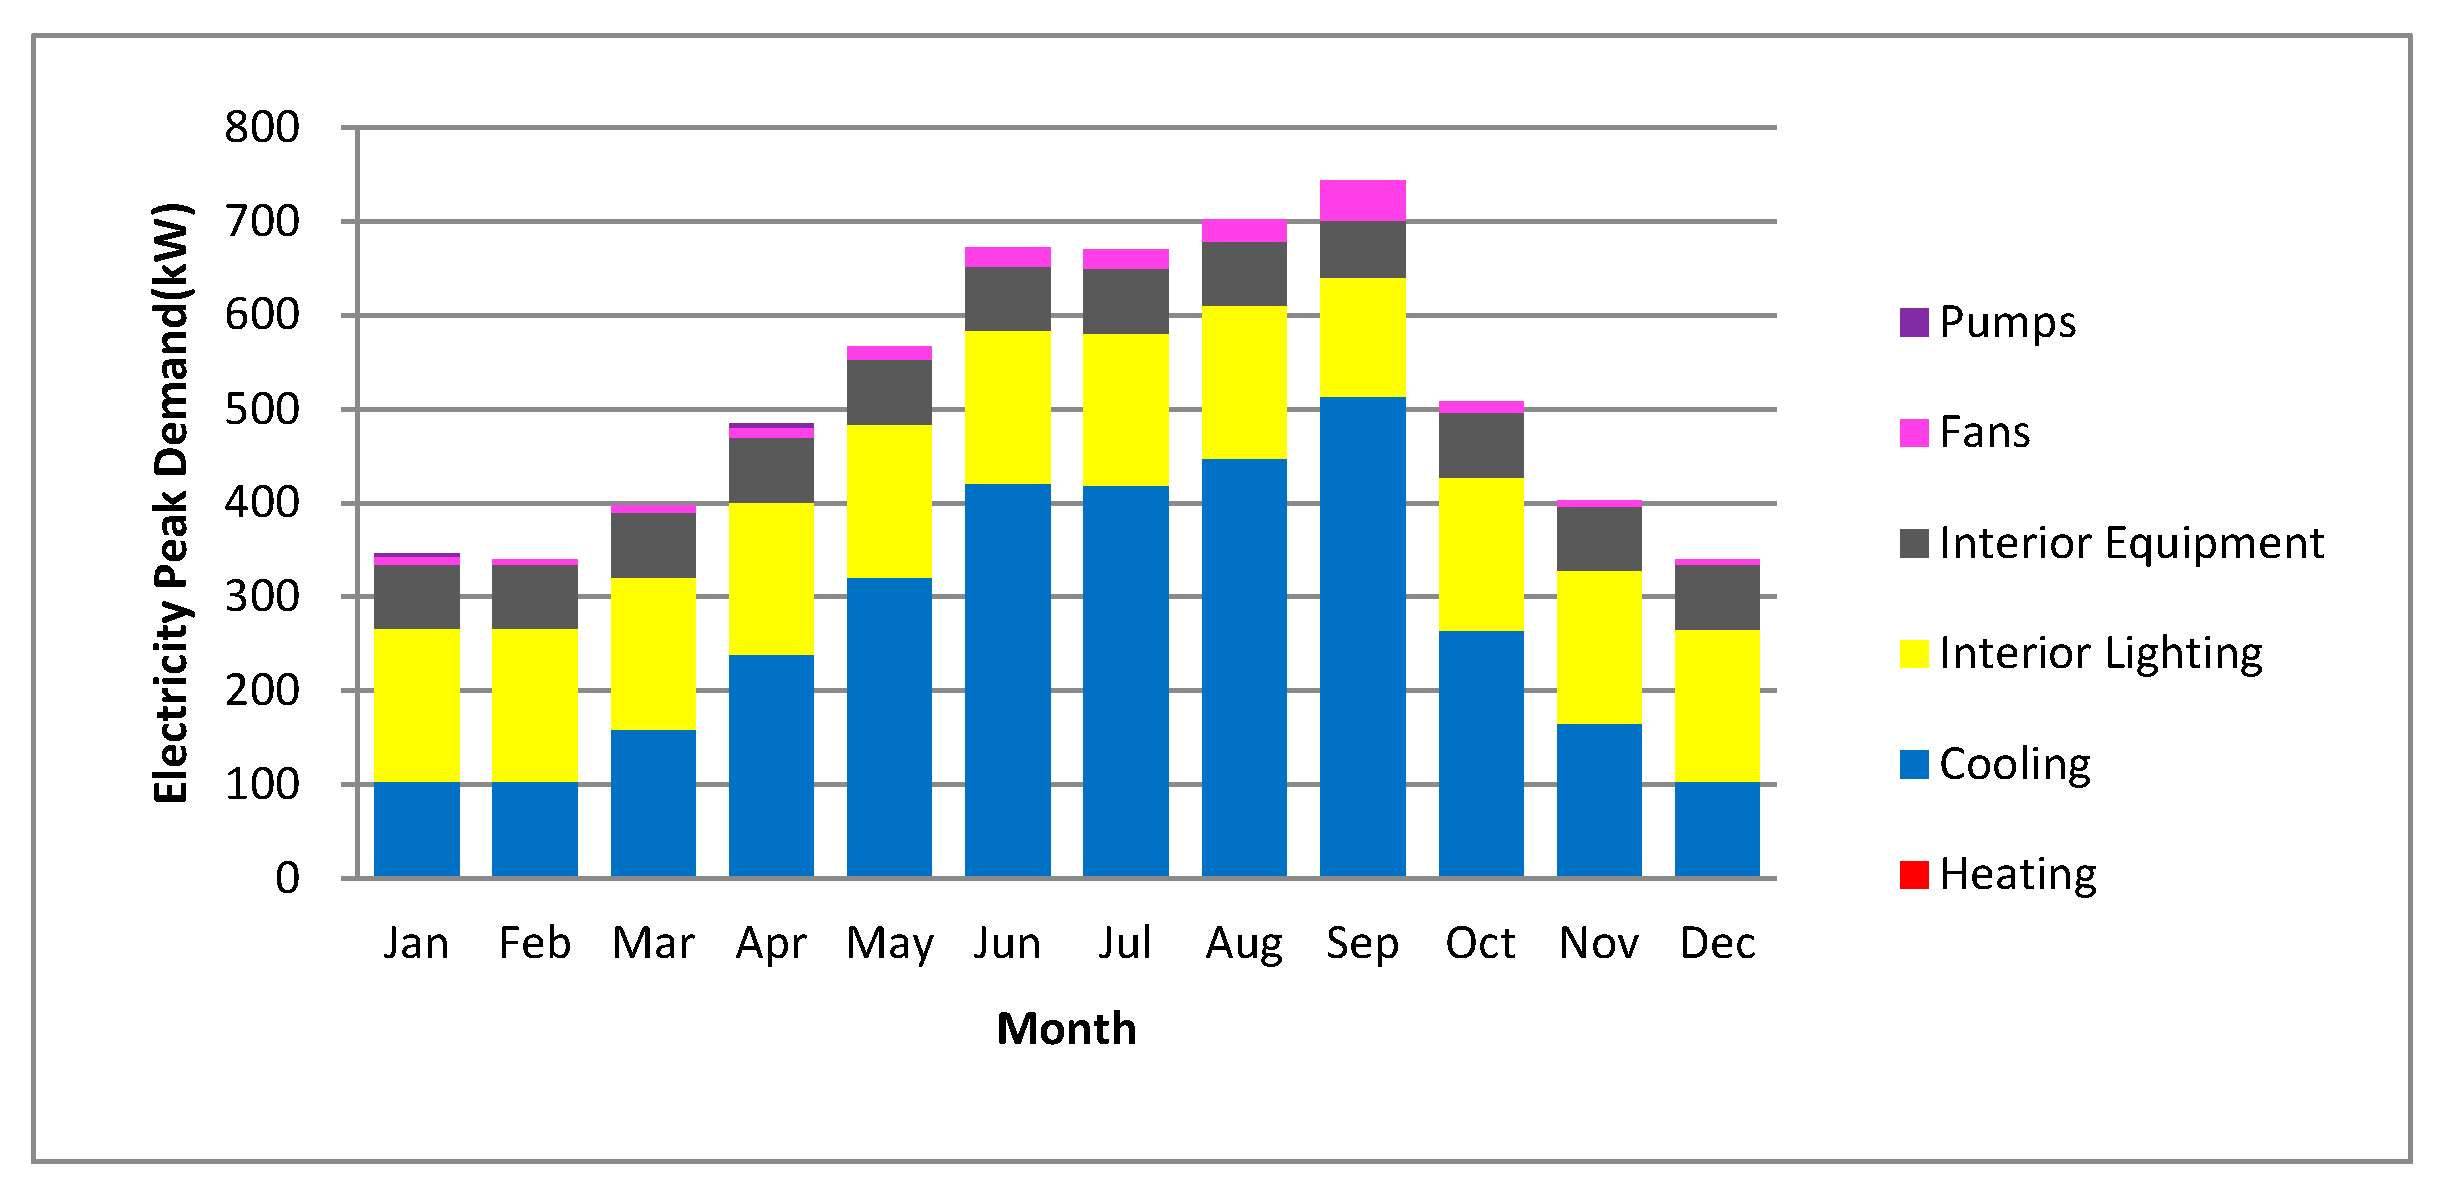
Figure 16.
An overview of monthly electricity peak demand.
Figure 16.
An overview of monthly electricity peak demand.
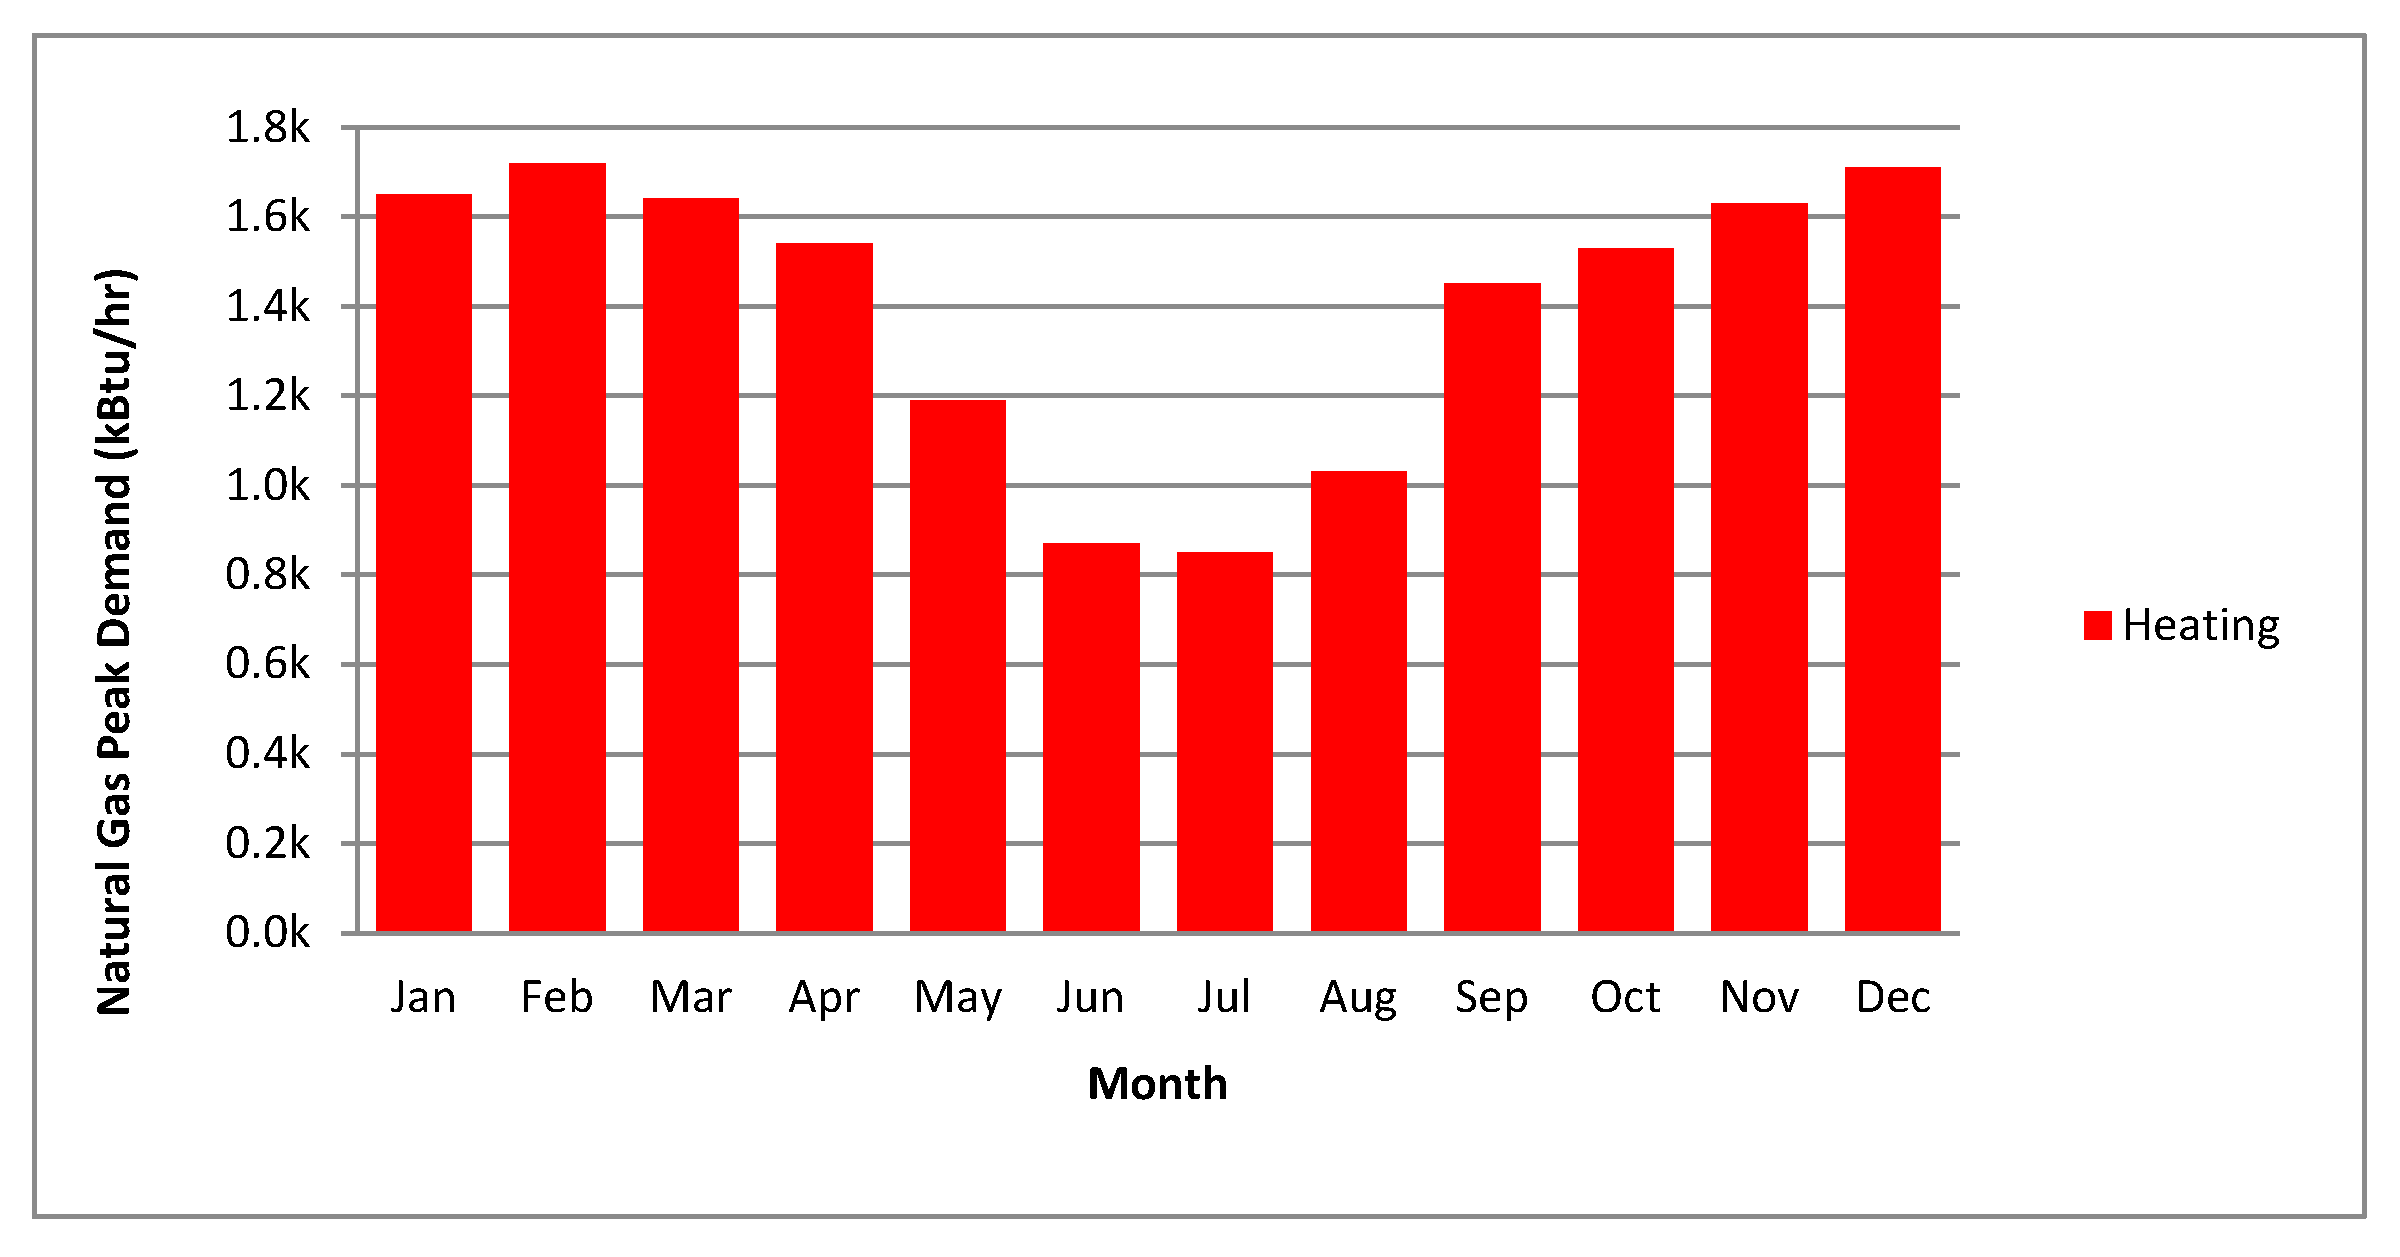
Figure 17.
An overview of monthly natural gas peak demand.
Figure 17.
An overview of monthly natural gas peak demand.
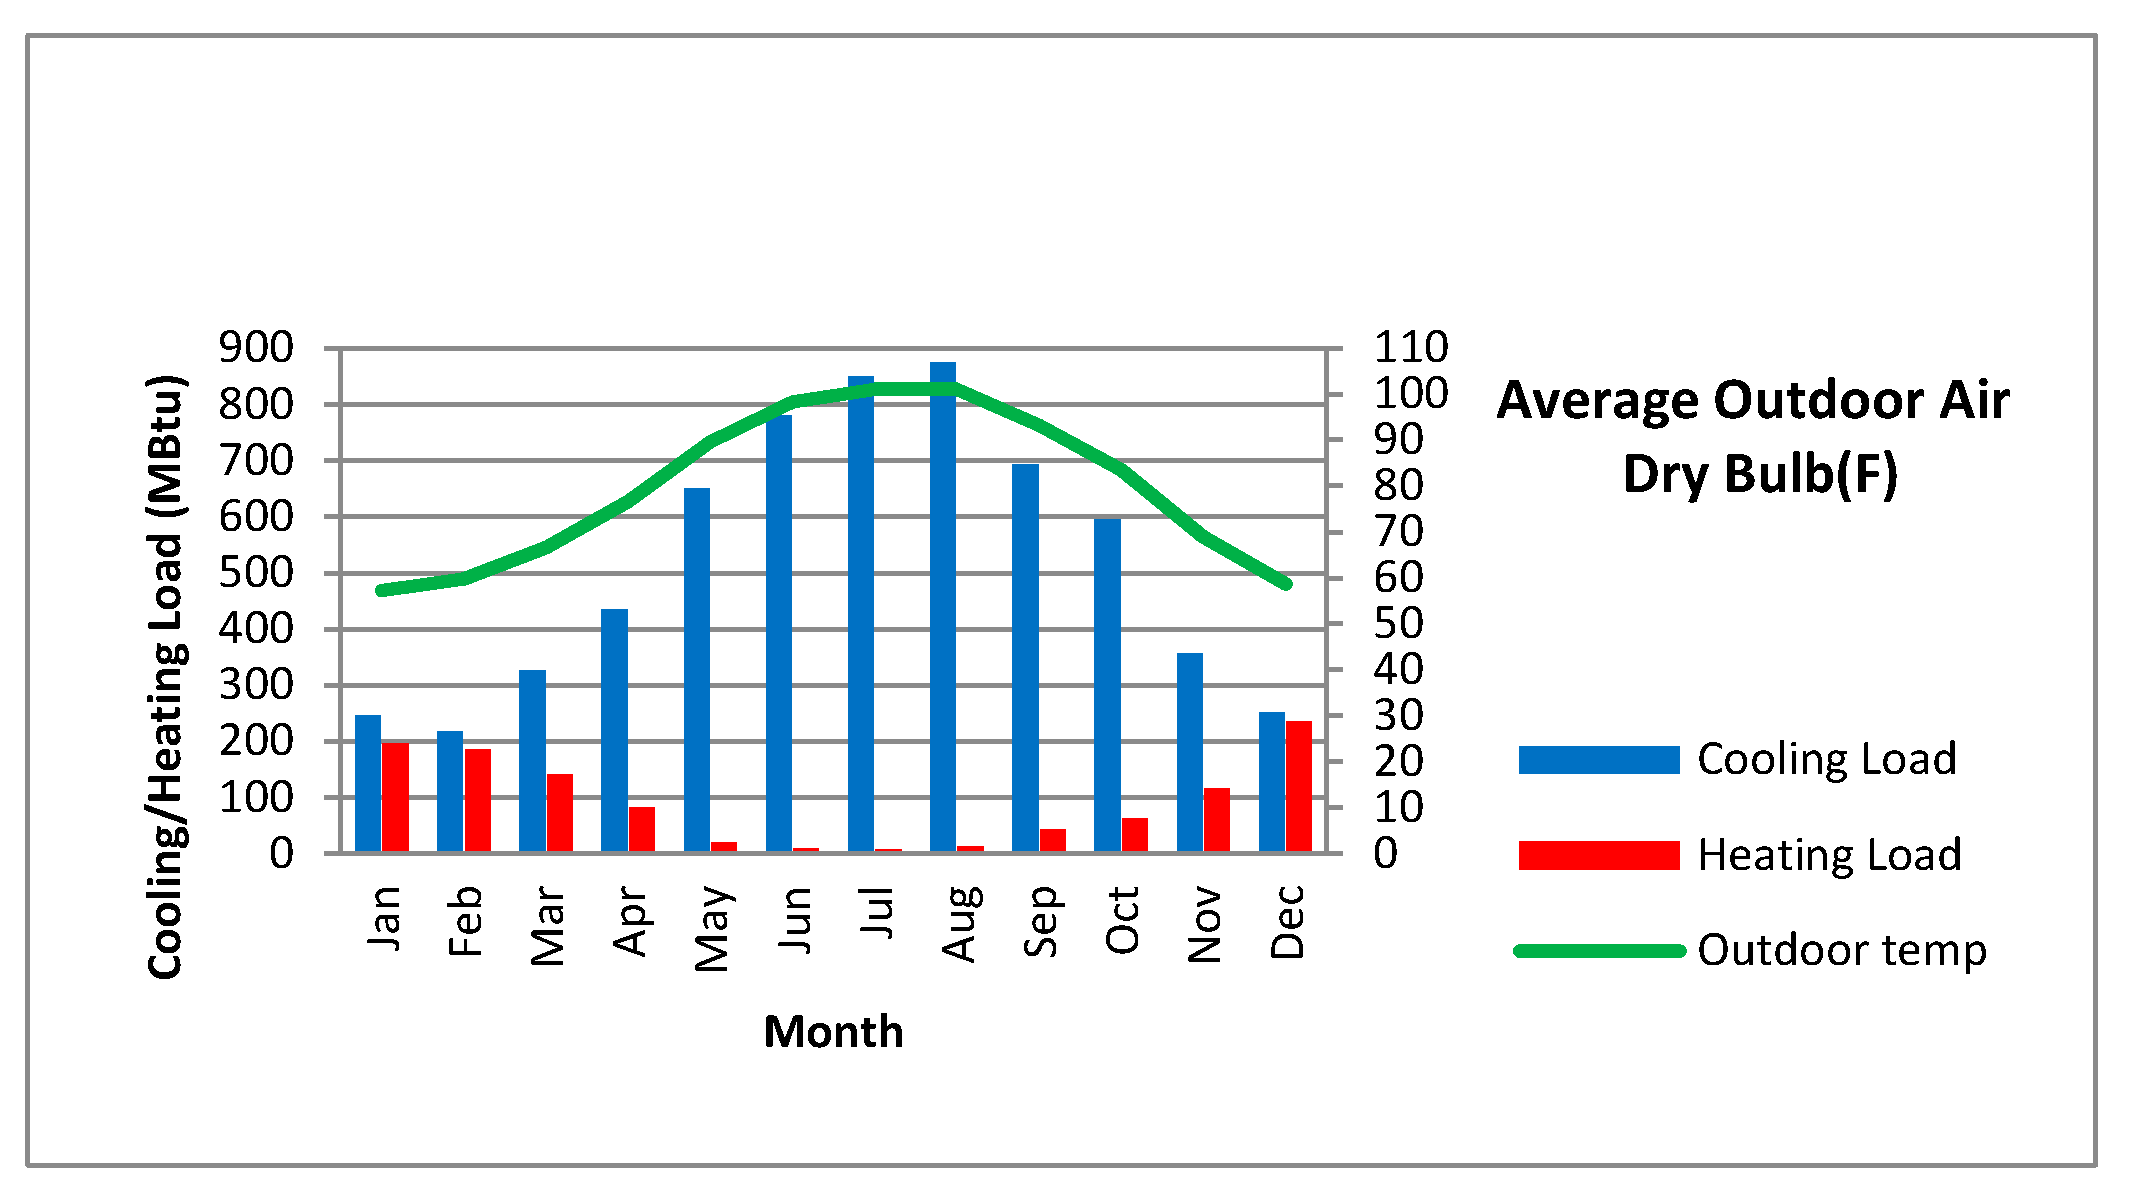
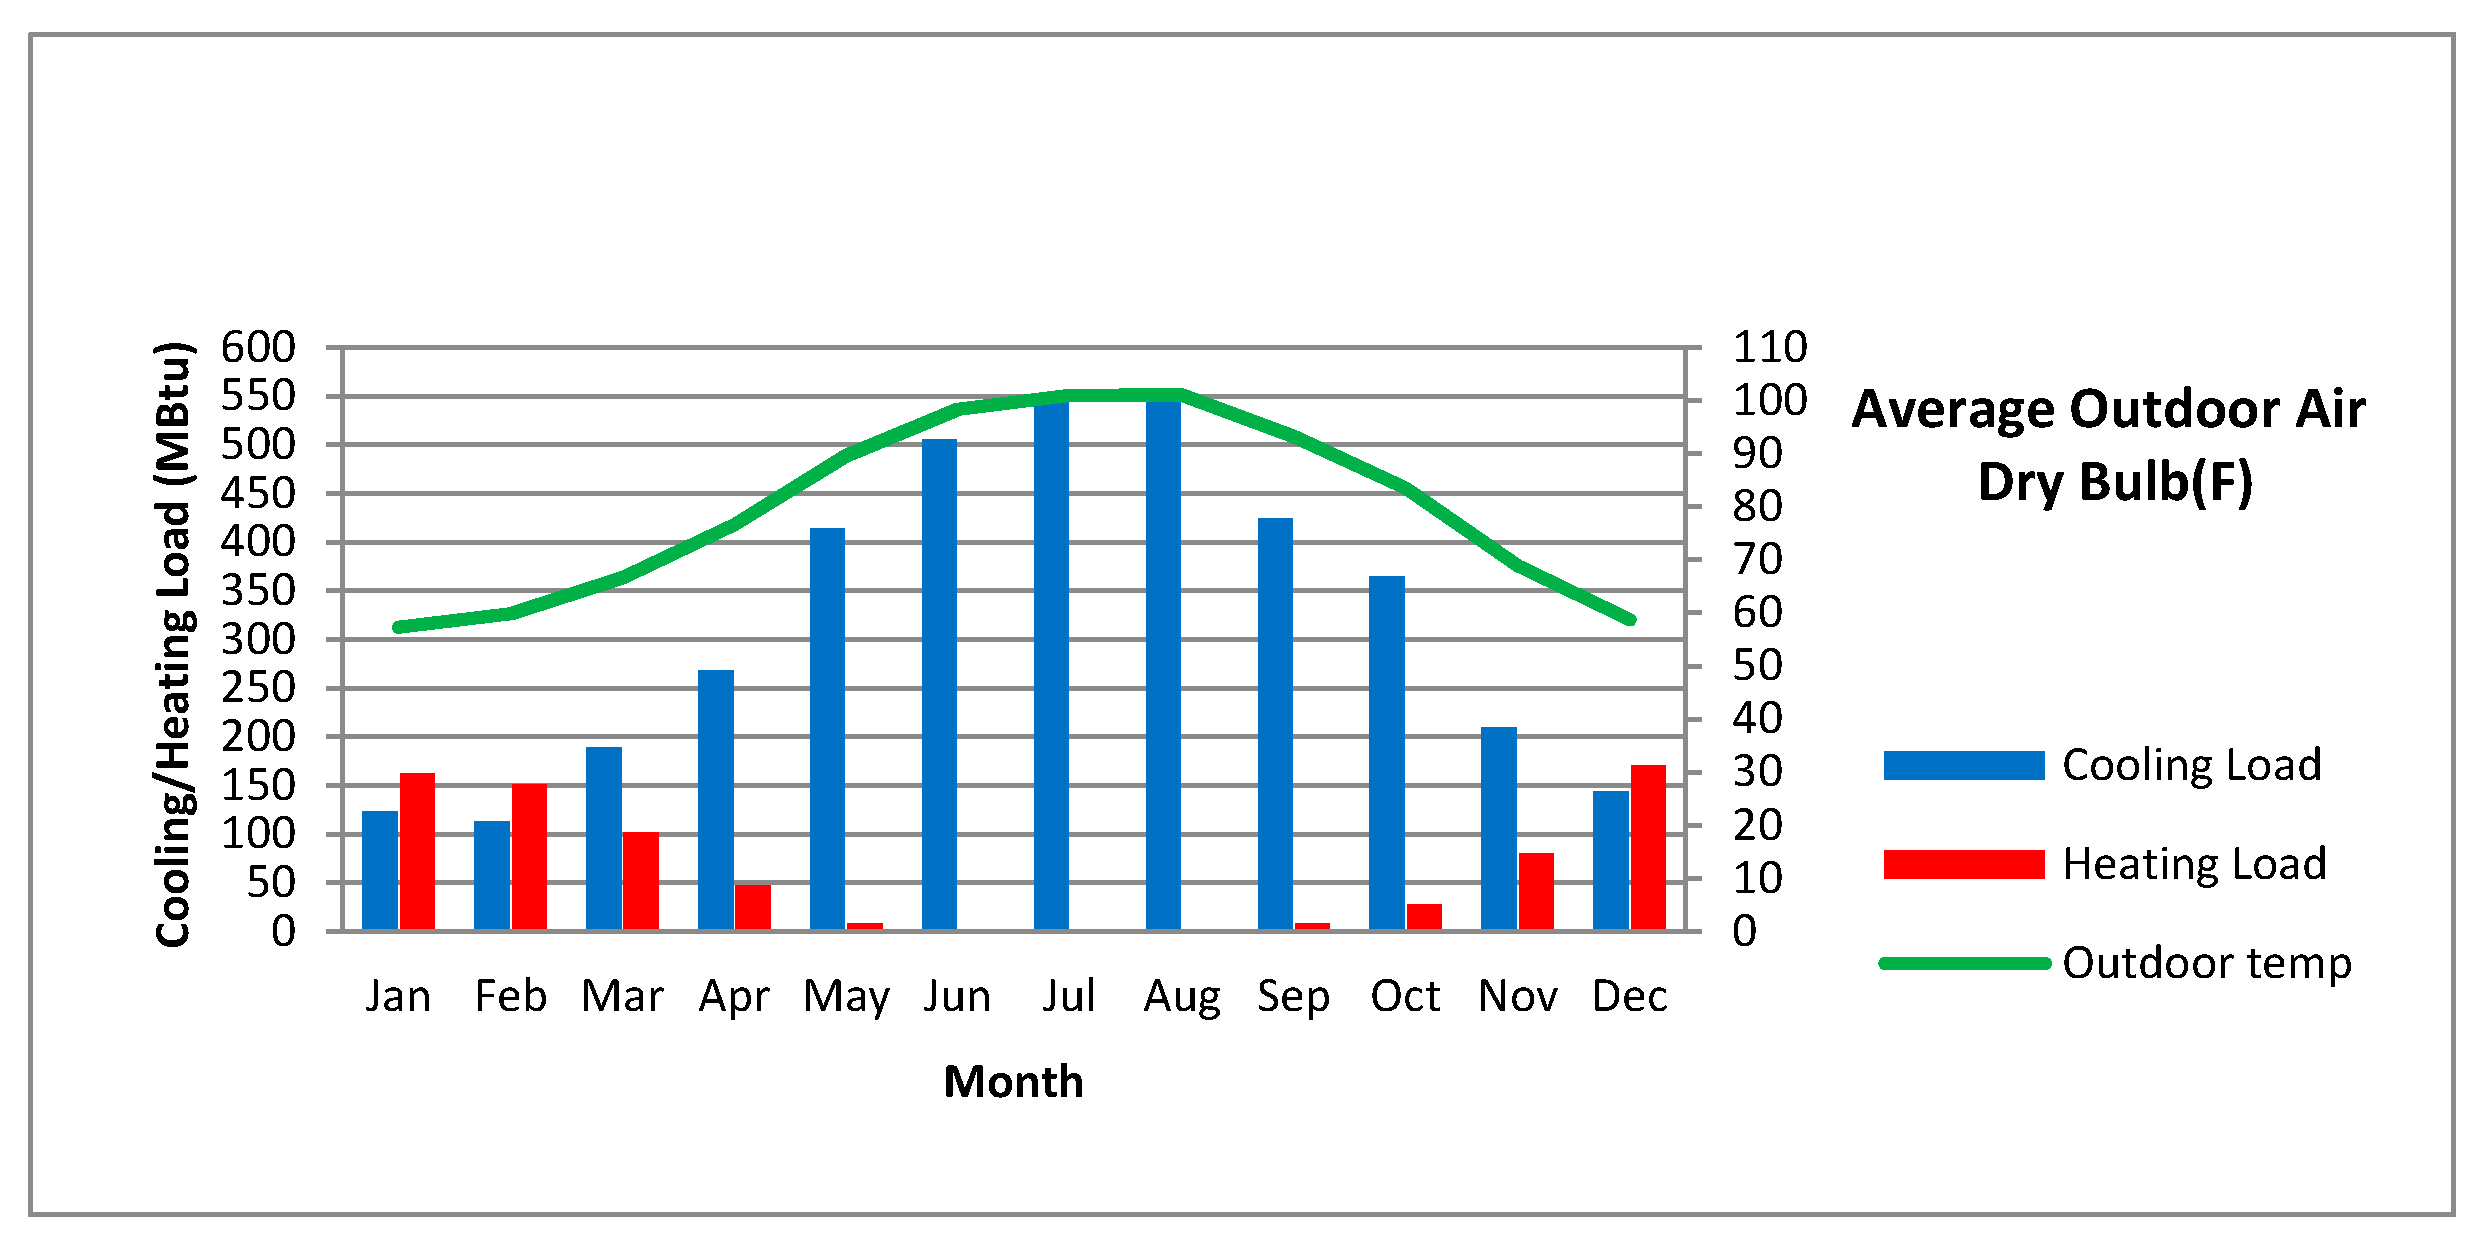
Figure 18.
Monthly heating, ventilation, and air conditioning (HVAC) load profiles.
Figure 18.
Monthly heating, ventilation, and air conditioning (HVAC) load profiles.
Figure 19.
(A–D) An overview of annual energy use and end-use per category.
Figure 19.
(A–D) An overview of annual energy use and end-use per category.
Figure 20.
An overview of monthly electricity consumption.
Figure 20.
An overview of monthly electricity consumption.
Figure 21.
An overview of monthly natural gas consumption.
Figure 21.
An overview of monthly natural gas consumption.
Figure 22.
An overview of monthly electricity peak demand.
Figure 22.
An overview of monthly electricity peak demand.
Figure 23.
An overview of monthly natural gas peak demand.
Figure 23.
An overview of monthly natural gas peak demand.
Figure 24.
Monthly HVAC load profiles.
Figure 24.
Monthly HVAC load profiles.
Table 1.
Average annual temperatures and sunshine hours in Erbil [
9].
Table 1.
Average annual temperatures and sunshine hours in Erbil [
9].
| MONTH | Jan | Feb | Mar | Apr | May | Jun | Jul | Aug | Sep | Oct | Nov | Dec |
|---|
| AVG MAX TEMP | 12 | 15 | 19 | 25 | 32 | 39 | 43 | 42 | 38 | 29 | 21 | 14 |
| AVG MIN TEMP | 2 | 3 | 7 | 11 | 16 | 21 | 25 | 24 | 19 | 14 | 8 | 4 |
| Cold period | Moderate | Hot period | Moderate | Cold |
| AVG HRS SUNSHINE/DAY | 5 | 6 | 7 | 8 | 10 | 14 | 14 | 13 | 11 | 8 | 6 | 5 |
Table 2.
ASHRAE (American Society of Heating, Refrigerating and Air-Conditioning Engineers)-based assigned features to the model.
Table 2.
ASHRAE (American Society of Heating, Refrigerating and Air-Conditioning Engineers)-based assigned features to the model.
| Building Type | Space Type | Construction Set | Schedule Set |
|---|
| Office Bldg | 189.1-2009-Office-OpenOffice-CZ1-3 | 189.1-2009-CZ2-Office | 189.1-2009-Office-WholeBuilding-Lg Office-CZ1-3 Schedule set |
Table 3.
ASHRAE-based building component features of the model and actual features.
Table 3.
ASHRAE-based building component features of the model and actual features.
| Component Name | Construction Name | Actual Features |
|---|
| Fixed and operable windows | ASHRAE 189.1-2009 Ext. Window Climate Zone 2 | Glass with aluminum frame (8 mm thick blue-green tempered + 12 mm air vacuum + 6 mm low-E tempered clear) |
| Walls | ASHRAE 189.1-2009 Ext. Wall Mass Climate Zone 2 | Composite aluminum cladding (4 mm thick) |
| Roof ceiling | ASHRAE 189.1-2009 Ext. Roof IEAD Climate Zone 2 | Reinforced concrete without insulation (200 mm thick) |
| Floor | ExtSlabCarpet 101.6 mm ClimateZone 1–8 | Reinforced concrete (200 mm thick) and marble tiles (20 mm thick) |
Table 4.
Module type options and features [
30].
Table 4.
Module type options and features [
30].
| Type | Approx. Efficiency | Module Cover | Temperature Coefficient of Power |
|---|
| Standard (crystalline silicon) | 15% | Glass | −0.47%/°C |
| Premium (crystalline silicon) | 19% | Anti-reflective | −0.35%/°C |
Table 5.
Power (W) produced from both PV installation methods.
Table 5.
Power (W) produced from both PV installation methods.
| Time (h) | Power (W) (Fixed) | Power (W) (Responsive) |
|---|
| 07:00 | 0.01 | 0.96 |
| 08:00 | 0.37 | 1.63 |
| 09:00 | 1.02 | 1.89 |
| 10:00 | 1.87 | 2.01 |
| 11:00 | 2.15 | 2.19 |
| 12:00 | 2.24 | 2.27 |
| 13:00 | 2.27 | 2.29 |
| 14:00 | 2.18 | 2.19 |
| 15:00 | 1.76 | 1.98 |
| 16:00 | 0.85 | 1.81 |
| 17:00 | 0.23 | 1.57 |
| 18:00 | 0.02 | 0.94 |
| ∑ (W) | 14.97 | 21.73 |
Table 6.
Annual total site and source energy summary.
Table 6.
Annual total site and source energy summary.
| Total Energy (GJ) | Energy Per Total Building Area (MJ/m2) |
|---|
| Site Energy | 11,910.18 | 661.10 |
| Source Energy | 35,436.81 | 1967.00 |
Table 7.
Annual building end-uses.
Table 7.
Annual building end-uses.
| Electricity (GJ) | Natural Gas (GJ) |
|---|
| Heating | 58.37 | 1095.89 |
| Cooling | 6793.30 | 0.00 |
| Interior Lighting | 2182.53 | 0.00 |
| Interior Equipment | 1406.15 | 0.00 |
| Fans | 336.76 | 0.00 |
| Pumps | 37.19 | 0.00 |
| Total End-Uses | 10,814.29 | 1095.89 |
Table 8.
The utility uses per total floor area.
Table 8.
The utility uses per total floor area.
| Electricity Intensity (MJ/m2) | Natural Gas Intensity (MJ/m2) |
|---|
| Lighting | 121.15 | 0.00 |
| HVAC | 401.07 | 60.83 |
| Other | 78.05 | 0.00 |
| Total | 600.27 | 60.83 |
Table 9.
Annual total site and source energy summary.
Table 9.
Annual total site and source energy summary.
| Total Energy (GJ) | Energy Per Total Building Area (MJ/m) |
|---|
| Site Energy | 8512.17 | 493.70 |
| Source Energy | 25,287.24 | 1466.63 |
Table 10.
Annual building end-uses.
Table 10.
Annual building end-uses.
| Electricity (GJ) | Natural Gas (GJ) |
|---|
| Heating | 0.00 | 802.11 |
| Cooling | 4076.73 | 0.00 |
| Interior Lighting | 2102.39 | 0.00 |
| Interior Equipment | 1310.97 | 0.00 |
| Fans | 198.08 | 0.00 |
| Pumps | 21.88 | 0.00 |
| Total End-Uses | 7710.06 | 802.11 |
Table 11.
The utility uses per total floor area.
Table 11.
The utility uses per total floor area.
| Electricity Intensity (MJ/m2) | Natural Gas Intensity (MJ/m2) |
|---|
| Lighting | 121.94 | 0.00 |
| HVAC | 249.20 | 46.52 |
| Other | 76.03 | 0.00 |
| Total | 447.17 | 46.52 |
Table 12.
Photovoltaic annual shadings and total system losses.
Table 12.
Photovoltaic annual shadings and total system losses.
| Orientation | Average Annual Shading (%) | Total System Losses (%) |
|---|
| East | 37.43 | 44.57 |
| South | 11.22 | 21.35 |
| West | 37.57 | 44.69 |
| Total Average | 28.74 | 36.87 |
Table 13.
The amount of photovoltaic electricity produced from each orientation.
Table 13.
The amount of photovoltaic electricity produced from each orientation.
| Orientation | Generated Electricity (kWh/Year) |
|---|
| East | 101,483.6381 |
| South | 160,304.2698 |
| West | 102,065.8843 |
| Total Amount | 363,853.7922 |
Table 14.
PV Watts® Calculator (NREL, Washington, DC, USA) system information.
Table 14.
PV Watts® Calculator (NREL, Washington, DC, USA) system information.
| Parameters | Inputs |
|---|
| DC System Size (kW) | 235.26 |
| Module Type | Standard (crystalline silicon) |
| Array Type | Two-Axis Tracking |
| System Losses (%) | 14 |
| Tilt (deg) | 0 |
| Azimuth (deg) | 180 |
| Dc to Ac Size Ratio | 1.1 |
| Inverter Efficiency (%) | 96 |
| Ground Coverage Ratio | 0.4 |
| System Type | Commercial |
| Cost of Electricity ($/kWh) | 0.12 |
Table 15.
PV Watts® Calculator results.
Table 15.
PV Watts® Calculator results.
| Solar Radiation (kWh/m2/Day) | AC Energy (kWh) | Energy Value ($) |
|---|
| Annual | 8.50 | 529,896 | $63,588 |


