Article

Two-Stage Integer Programing Model for Building Retrofit Planning for Energy Saving in South Korea

Department of Industrial Engineering, Yonsei University, 50 Yonsei-ro Seodaemun-gu, Seoul 03722, Korea
*
Author to whom correspondence should be addressed.
Sustainability 2017, 9(11), 2087; https://doi.org/10.3390/su9112087
Submission received: 28 September 2017 / Revised: 25 October 2017 / Accepted: 7 November 2017 / Published: 13 November 2017
(This article belongs to the Special Issue Sustainability Assessments of Buildings)

Abstract

:
Due to the heightened concerns of global environmental problems caused by the heavy use of fossil fuels, the sharp increase of energy use in the building sector has been recognized as an important environmental issue. One solution for efficient energy consumption in the building sector is building retrofits. This study proposes a two-stage integer programing model to select building retrofit materials and retrofit planning. The first model is based on a multi-objective optimization that derives an optimal retrofit strategy considering both energy savings and retrofit costs. Using the results of the first model, the second model finds an optimal retrofit plan to minimize losses for the building owner. Based on a real general hospital building in Korea, a simplified case building was used to verify the proposed models and for experimental analyses. According to the results of the second model, the building owner could adopt a building retrofit with less than 30–40% of the initial budget when compared to the total retrofit costs.

1. Introduction

Today, energy shortage problems are being highlighted as serious concern. The imbalance in power supply and demand should be taken into consideration to prevent serious damage such as large power outages. Most of these power problems are caused by failing to meet the peak-time power demand. Since it is very difficult to increase the power supply, power management at the demand side is required. Hardesty [1] provided global states of energy consumption where the United States’ energy consumption rate in 1990 was high for transportation and industrial sectors, at 36%, and 33%, respectively. In residential and commercial sectors the consumption rate was low at 17% and 14%, respectively. However, in 2012, the transportation and industrial sectors decreased to 28% and 33%, respectively, while the residential and commercial sectors increased to 21% and 18% respectively. Furthermore, the European Union transport figures presented in Reference [2] showed that Europe’s energy use by sector was highest in the residential sector at 38.8%, followed by transportation at 33%, and the industrial sector at 26%. In 2010, Korea used 22% of the total energy in building, and the average annual increase amounted to 2.6% [3]. In addition, the building sector accounts for 30% of global greenhouse gases emissions [4]. In Korea, 25.2% of greenhouse gases are generated in the building sector [5]. From this, we concluded that a proper methodology for managing the energy used in residential and commercial buildings was required.
Building retrofits, as a way to improve the energy performance of buildings, are being highlighted to manage energy use in buildings. Building retrofits can be defined as entire activities aimed to improve the energy performance of a building, and includes the replacement of facilities and insulation [6]. In particular, replacing building insulation can improve the energy performance of buildings in a more fundamental aspect. The characteristics of the external wall, roof insulation, and the type of glass used for windows can make a significant difference to energy consumption in buildings [7,8,9].
Therefore, a study to calculate the energy usage in buildings by reflecting the characteristics of insulation requires finding an optimal combination of building retrofit materials. Furthermore, energy consumption in the building, as well as the total retrofit cost for the building retrofit, is important for the propagation of building retrofits.
However, the existing studies only consider the effects after the retrofit to choose optimal building retrofit materials, and ignore specific building retrofit planning [10,11]. Detailed scheduling for building retrofits is required due to the lead time of a building retrofit. Considering that current commercial buildings are complex structures with many participants acting in the building, there are many constrains when applying building retrofits due to a specific building user’s requests. Therefore, detailed building retrofit planning is more realistic than applying retrofit to the entire building at the same time.
In this study, we propose two models to derive the optimal retrofit materials and detailed retrofit planning. The first model is to optimally select building retrofit materials to improve the energy performance of the building. The second one is an optimal retrofit planning model to minimize losses for building owners. Therefore, the proposed models can encourage building owners to adopt the building retrofit activity and solve the energy shortage problem.
The rest of the paper is organized as follows. Review of existing studies for building retrofits is presented in Section 2 where various methodologies to solve the selection of construction materials are introduced. In Section 3, the optimal retrofit material selection model and optimal retrofit planning model are proposed. Experimental results and analysis are presented in Section 4. Finally, Section 5 concludes the paper by stating that the application of the proposed model can save both energy usage in the building and total construction costs.

2. Related Literatures

Many studies have been carried out on building retrofits that improve the energy performance of a building. The related studies can be categorized into two types of methods. The first one is to make retrofit candidate scenarios and check the effect of each scenario by using simulation models. The other method is to use optimization models to make a set of optimal retrofit materials for a building by reflecting the characteristics of each building. Some studies have proposed a hybrid of both methods.
Building retrofit action should be carried out very carefully due to impossible restoration, one of the most important characteristics of construction. There have been some studies on the effect of building retrofits. The most commonly used approach is the construction of simulation models based on an expert’s decision. For instance, Xing et al. [12] applied the Heating, Ventilation and Air conditioning (HVAC) system to a specific hotel building and deduced the results using eQuest software. Peng et al. [13] proposed building energy performance checking models by using the Designer’s Simulation Toolkit (DeST) under various conditions, and suggested effective energy saving methods such as adding extra external wall insulation, changing the type of external window, and introducing LED lighting for diverse building characteristics. Woo and Menassa [14] applied the virtual retrofit model to cope with threats like lack of budget, and the unstructured decision-making process in a smart grid environment.
To improve the energy performance of a building, defining the variables related to the energy characteristics of the building and constructing a proper management of the variables are important. There have been many studies on the effects of building retrofits using simulation models based on predefined sets of retrofit strategies. However, a simulation model with predefined sets leaves doubt as to whether an optimal retrofit strategy is adopted if the number of predefined alternatives is not large enough. When considering a large number of alternatives, the curse of dimensionality remains. Thus, our study focused on the replacement of building retrofit materials in a building by using an optimization model. The retrofit actions consisted of selecting external wall insulation, roof insulation, and external wall windows. Based on the characteristics of the buildings, the optimal combination of retrofit materials is selected by the first model, i.e., the retrofit material selection model.
The optimization model, especially in our study, was necessary to determine the materials and retrofit actions under various constraints, while a simulation model requires a pre-defined set of decisions which are very difficult to find in advance. In the multi-objective optimization model, it suggested Pareto optimal by making a trade-off between several objectives, which could be helpful to decision makers. There are many studies that have used the multi-objective optimization model for building retrofits. Asadi et al. [15] presented a multi-objective optimization model to minimize energy usage in buildings and simultaneously maximize the building user’s comfort level. Kumbaroğlu and Madlener [16] suggested a solution for improving the energy performance of a building by using an economical evaluation method for technical factors of building retrofits by using a multi-objective optimization model. Diakaki et al. [6] developed an optimization model for understanding the effect of external wall thickness to retrofit effect, and Privitera et al. [17] investigated the effect of renewable energy on a building retrofit for reducing CO 2 emissions while considering the retrofit cost and environmental impacts.
Some studies have suggested that the multi-objective optimization model for considering the lifecycle of retrofit materials in buildings. Brás and Gomes [18] dealt with external wall insulation selection while considering the environmental impact of insulation materials. As per the result of insulation material selection, CO 2 emissions decreased by 30% and the total energy usage amount also decreased by 20%. Dong et al. [19] considered the environmental impact and economics simultaneously to decide on proper action between applying the retrofit and reconstruction. The analysis of the effects of a single retrofit was also one of the most popular research topics such as the effects of replacing windows (either external or internal), the use of green roofs, the selection of internal walls, or the selection of ventilation methods [20,21,22,23,24].
Since the optimization model has some disadvantages when reflecting deterministic circumstances and has a computational time problem, heuristic methods were developed to solve multi-objective optimization model. Lu et al. [25] developed an NSGA-2 model for introducing a renewable energy system for buildings and compared it to a single-objective optimization model for model validation. Malatji et al. [10] suggested a multi-objective optimization model for maximizing energy savings in buildings, and minimizing the return period of the initial budget with the genetic algorithm. Asadi et al. [26] proposed an energy consumption prediction model through an artificial neural network and genetic algorithm to solve the multi-objective optimization problem.
A hybrid method to incorporate the advantages of both the emulation and optimization models was proposed as the HVAC system of Balocco and Marmonti [27], who analyzed energy using patterns in buildings and a glass roof for effect analysis. For the hybrid system, Asadi et al. [28] used the TRNSYS simulation program and optimization model to reflect the characteristics of various external wall insulation, roof insulation, window, and solar energy collector for minimizing the retrofit cost and maximizing energy savings. Additionally, Koo and Hong [29] employed a case-based reasoning method for building retrofits to examine the energy performance of buildings per building status and derived an energy performance curve. In addition, due to the nature of construction, delays inevitably occur, so the task completion may not occur within the specific contract period. Interestingly, Kao and Yang [30] investigated the delays in construction sites to analyze the causes in real time.
Although the optimization model has a few disadvantages, it can extract the optimal solution much quicker than other methods. From the literature review, we can see that multi-objective optimization models are very helpful for decision makers when deciding on the most efficient retrofit strategy based on the judgment of energy experts. Furthermore, most studies related to retrofit material selection analyzed the effect of the retrofit based on the effect of the retrofit only after the completion of construction. Therefore, situations during construction cannot be included in this model, which led to a large amount of burden on the decision-maker, who was the building owner in this case. Additionally, it is difficult to say that the previous studies reflected the retrofit strategies comprehensively. Furthermore, users and owners are usually different in commercial buildings. However, the building owners pay for the building retrofit, but all advantages from the building retrofit go to the building users as the building retrofit reduces operational costs. This strange profit-sharing structure is an important obstacle in implementing building retrofits. In this study, we proposed two mathematical models using integer linear programming. The first model solved the problem of selecting the optimal building construction materials that maximized a building’s energy saving and minimized the building retrofit cost. Furthermore, based on the first model’s results, the second model decides an optimal construction period using the construction materials and building floors to consider individual construction planning in order to minimize the building owner’s loss. We expect that with the results of our study, more building owners will adopt building retrofits and achieve a higher level of energy saving.

3. Mathematical Models

In this section, we present two mathematical models for applying retrofits to existing buildings. The first model selects the optimal retrofit materials to be used for the building retrofit and the second one derives the optimal building retrofit planning for each floor and the retrofit materials. Both models are based on integer linear programming.

3.1. Retrofit Material Selection Model

This model selected the most appropriate materials for a building retrofit from the sets of external wall windows and insulation, roof insulation, and solar energy collectors. The energy collected from solar energy collectors heats the water used in the building. The model estimated the energy consumption before and after the building retrofit as well as the retrofit cost to find the optimal combination of retrofit materials. The formulas for calculating energy use in the building were based on the work by Asadi et al. [15].

3.1.1. Decision Variables

When examining the sources of energy consumed in a building, the lack of insulation capability is one of the critical sources along with the energy used by electrical equipment. Therefore, it is important to take insulation capability into consideration for the model. In this study, the types of window, external wall insulation, and roof insulation of a building were considered as the basic decision variables. Additionally, the types of solar energy collectors were considered for the hot water used in a building. These decision variables are as follows:
  • Types of windows
  • Types of external wall insulation
  • Types of roof insulation
  • Types of solar energy collector
The binary variables x i w i n ,   x j w a l ,   x k r o f , and x l s c , presented below to select optimal retrofit materials with I alternative types of window, J alternative types of external wall insulation, K alternative types of roof insulation, L alternative types of solar collector respectively are defined as Equations (1)–(4).
x i w i n = { 1 , if   window   candidate   i   is   selected 0 , otherwise
x j w a l = { 1 , if   external   wall   insulation   candidate   j   is   selected 0 , otherwise
x k r o f = { 1 , if   roof   insulation   candidate   k   is   selected 0 , otherwise
x l s c = { 1 , if   solar   energy   collector   candidate   l   is   selected 0 , otherwise
Energy used in the building was calculated by the retrofit materials and classified into three categories: (1) energy for space heating; (2) energy for space cooling; and (3) energy for hot water supply. Total energy consumption in the building was calculated by adding three energy categories. The detailed formulas for each energy consumption category are presented in the following sections.

3.1.2. Energy Saving

In this study, the amount of energy saving, ES was calculated by subtracting the energy consumption before and after the retrofit. The formula is presented in Equation (5).
E S = E p r e E p o s t
where Epre is the energy consumption amount before the building retrofit; and Epost is the energy consumption amount after the building retrofit.
In this study, the energy consumption of a building was classified into three categories, and the total energy consumption is defined as Energy Use, as shown in the equation below.
E U = E H + E C + E H W
where EU is the energy use in building; E H is the energy for space heating to cover heat loss through insulation; E C is the energy for space cooling to cover heat inflow through insulation; and E H W is the energy for hot water boiling.

Energy for Space Heating

<Nomenclature>
  • Q H ( x ) : Energy for space heating ( kWh / year )
  • Q t r ( x ) : Heat loss through heat conduction ( kWh / year )
  • Q v e : Heat loss through ventilation ( kWh / year )
  • Q g n ( x ) : Heat gain ( kWh / year )
  • B L C e x t : Building energy load coefficient ( W / ° C )
  • α : time coefficient
  • D D : Heating degree day ( ° C × day )
  • U i : Thermal conduction coefficient of window ( W / m 2   ° C )
  • d j : Thickness of external wall insulation ( m )
  • λ j : Thermal conduction of external wall insulation ( W / m 2   ° C )
  • d k : Thickness of roof insulation ( m )
  • λ k : Thermal conduction of roof insulation ( W / m 2   ° C )
  • ACH: Air circulating rate per hour ( h 1 ) A f : Area of floor ( m 2 )
  • H f : Height of floor ( m )
  • η : Coefficient of heat generated from inside
  • M H : Heating period ( months )
  • G : Average solar energy that reaches a south oriented vertical surface (kWh/ m 2   month )
  • A e , i : energy efficiency coefficient for incident solar energy to window
  • q i : Heat generated from inside ( W / m 2 )
  • A w i n : Total area of window ( m 2 )
  • A w a l : Total area of external wall ( m 2 )
  • A r o f : Total area of roof ( m 2 )
Energy for space heating is defined as Q H ( x ) , where x denotes the decision variables above-mentioned. Total energy for space heating is presented as Equation (7). Heat loss through heat conduction, ventilation, and the amount of heat gain was considered when computing the energy for space heating. Equations (8)–(10) compute the heat loss through heat conduction; the building energy load coefficient; heat loss through ventilation; and the heat gain from inside of the building, respectively.
Q H ( x ) = Q t r ( x ) + Q v e η × Q g n ( x )
Q t r ( x ) = α × D D × B L C e x t
B L C e x t = A w i n i = 1 I U i × x i w i n + A w a l j = 1 J x j w a l d j / λ j + A r o f k = 1 K x k r o f d k / λ k
Q v e = α × A C H × A f × H f × D D
Q g n ( x ) = { ( M H × G × i A e , i × x i w i n ) + ( M H × A f × q i ) }

Energy for Space Cooling

<Nomenclature>
  • Q C ( x ) : Heat for space cooling ( kWh / year )
  • Q g n , e ( x ) : Heat gain from external wall ( kWh / year )
  • Q g n , i : Heat generate inside ( kWh / year )
  • Q g n , v e : Heat gain through ventilation ( kWh / year )
  • β : Coefficient for time setting
  • θ c , p : Outdoor temperature at period p in cooling period
  • θ s e t : Standard temperature in cooling period
  • A f : Area of floor ( m 2 )
  • q i : Heat generated from inside ( W / m 2 )
The energy for space cooling is presented as Q C ( x ) and the total energy for space cooling was calculated using Equation (12). Heat gained from the external wall, heat generated inside, and heat gained through ventilation were considered. Equations (13)–(15) denote three main causes for space heating: heat gained from the external wall, heat generated inside, and heat gained through ventilation, respectively.
Q C ( x ) = ( 1 η ) × ( Q g n , e ( x ) + Q g n ( x ) + Q g n , i + Q g n , v e )
Q g n , e ( x ) = β × B L C e x t × ( θ c , p θ s e t )
Q g n , i = β × A f × q i
Q g n , v e = β × ( A C H × A f × H f ) × ( θ c , p θ s e t )

Energy for Hot Water Supply

<Nomenclature>
  • Q W ( x ) : Heat for hot water supply ( kWh / year )
  • Q a : Energy consumption of existing facility ( kWh / year )
  • E s o l a r ( x ) : Heat from solar energy collector ( kWh / year )
  • γ : Coefficient for time setting
  • C W : Average hot water usage per day
  • M W : Length of using hot water
  • E l s c : Energy collecting amount of l solar energy collector
Energy for hot water supply and its detailed formulas are presented as Equations (16)–(18). Equation (16) indicates that the energy for hot water was obtained by subtracting the energy generated by the solar energy collector from the total energy demand for hot water supply.
Q W ( x ) = ( Q a η E s o l a r ( x ) )
Q a = γ × C W × M W
E s o l a r ( x ) = l = 1 L E l s c x l s c

3.1.3. Building Retrofit Cost

The building retrofit cost is the total cost for replacing construction materials. In general, the cost is proportional to the size of the construction unit as shown in Equation (19).
<Nomenclature>
  • A w i n : Total area of window ( m 2 )
  • A w a l : Total area of external wall ( m 2 )
  • A r o f : Total area of roof ( m 2 )
  • C i w i n . : Construction cost for window i per unit area ( / m 2 )
  • C j w a l : Construction cost for external wall insulation j per unit area ( / m 2 )
  • C k r o f : Construction cost for roof insulation k per unit area ( / m 2 )
  • C l s c : Installation cost for solar energy collector l ( / m 2 )
Retrofit   Cos t = i = 1 I A w i n × C i w i n × x i w i n + j = 1 J A w a l × C j w a l × x i w a l + k = 1 K A r o f × C k r o f × x k r o f + l = 1 L C l s c × x l s c

3.1.4. Model Formulation

We present a multi-objective optimization model with the decision variables and constraints as defined below.
Min   Z 1 = R e t r o C o s t ( x ) Max   Z 2 = E S ( x ) Subject   to x i w i n i { 1 , 2 , ,   I } x j w a l j { 1 , 2 , , J } x k r o f k { 1 , 2 , , K } x l s c l { 1 , 2 , , L } i = 1 I x i w i n = 1 j = 1 J x j w a l = 1 k = 1 K x k r o f = 1 l = 1 L x l s c = 1 x i w i n ,   x j w a l ,   x k r o f ,   x l s c 0
The weighted-sum method was applied to transform the multi-objective optimization model to a single-objective one to find the optimal combination of construction materials. Based on the amount of energy saved and the total retrofit cost, the second model found the optimal retrofit period by each floor and construction material. ILOG CPLEX STUDIO 6.0 was used to derive the solution.

3.2. Retrofit Planning Model

The optimal retrofit planning model determined the most efficient way to apply the building retrofit plan for each construction material and floor. The total amount of energy to be saved and the total retrofit cost derived from the first model were used for optimal retrofit planning.

3.2.1. Decision Variables and Input Data

Our retrofit planning model had three decision variables based on the retrofit materials selected in the first model. The binary variables R e C o n t ,   m t y p e were to decide the starting period retrofit for each floor and retrofit material, E n e r S t ,   m t y p e to reflect energy savings through retrofit, and R e t r o t , m to reflect the retrofit of each floor in each period as follows:
(1)
Decision variable for retrofit period
R e C o n t ,   m t y p e = { 1 , if   period   t   is   selected   for   floor   m   and   material   t y p e 0 , otherwise
(2)
Decision variable for reflecting energy saving after the retrofit
E n e r S t ,   m t y p e = { 1 , if   k = 1 t R e C o n k ,   m t y p e 1 0 , otherise
(3)
Decision variable for building retrofit
R e t r o t , m = { 1 , R e C o n t ,   m w i n d o w + R e C o n t ,   m e x t e r n a l   w a l l   i n s u l a t i o n 1 0 , otherwise

3.2.2. Model Formulation

The objective was to maximize energy saving profits for the end of the planning horizon to minimize the building owner’s loss. In building construction, construction delays frequently occur. To deal with delays in construction, we used a penalty function instead of the construction lead time constraint. In addition, since the building owner uses the space of the building to generate revenue, the proposed model reflected an idle penalty for the unused building space. Our retrofit planning model assumed that the building owner could obtain profits from energy savings and reinvest the profit, which resulted in reducing the total retrofit cost. We developed two scenarios to allocate the initial budget: (1) make the initial budget equal to the total retrofit cost; and (2) make the initial budget less than the total retrofit cost and proceed to build the retrofit gradually. The retrofit planning model was formulated as follows:
<Nomenclature>
  • Delay: Construction delay (unit period)
  • RCoD: Rate of Compensation of Deferment (%/day)
  • P r o f i t ( t ) : Energy saving profit (KRW/period)
  • r t : Interest rate (%/period)
  • δ : Coefficient for time setting
  • E B t , m w i n ,   E B t , m w a l ,   E B t r o f ,   E B t s c : Energy saving profit for each type and floor m in period t (KRW)
  • C C t , m w i n ,   C C t , m w a l ,   C C t r o f ,   C C t s c : Retrofit cost for each type and floor m in period t (KRW)
  • T p l a n : Length of planning horizon
  • M: Total number of floors
    Max   Z 3 = P r o f i t ( T p l a n ) ( L a t e   p e n a l t y + I d l e   p e n a l t y )
    Subject to
    Late   Penalty = t = T p l a n + 1 T D e l a y × R C o D × d a y × ( 1 + r t ) T p l a n t
    D e l a y = { A c t u a l P l a n n e d , i f   t h e   b u i l d i n g   c o n s t r u c t i o n   i s   d e l a y e d 0 , o t h e r w i s e
    Idle   Penalty = t = 1 T m = 1 M R e t r o t , m × B u i l d i n g   C o s t n u m b e r   o f   f l o o r s × δ × ( 1 + r t ) T p l a n t
    t = 1 T R e C o n t , m t y p e = 1 ,   t y p e
    m = 1 M t = 1 T R e C o n t , m t y p e = M ,   for   t y p e = window ,   external   wall   insulation
    E n e r S k + 1 , m t y p e = t = 1 k R e C o n t , m t y p e ,   k t
    1 st   period C C m w i n d o w × R e C o n 1 ,   m w i n d o w + C C m w a l l × R e C o n 1 ,   m w a l l + C C r o o f × R e C o n t = 1 r o o f + C C s o l a r × R e C o n t = 1 s o l a r + P r o f i t ( 1 ) B u d g e t
    2 nd   period   to   end C C m w i n d o w × R e C o n t ,   m w i n d o w + C C m w a l l × R e C o n t ,   m w a l l + C C r o o f × R e C o n t r o o f + C C s o l a r × R e C o n t s o l a r + P r o f i t ( t ) = E B   m w i n d o w × E n e r S t ,   m t y p e + E B   m w a l l × E n e r S t ,   m t y p e + E B r o o f × E n e r S t ,   m t y p e + E B s o l a r × E n e r S t ,   m t y p e + ( 1 + r t ) × P r o f i t ( t 1 )
Equation (24) is the objective function to maximize the profit at the end of the planning horizon. Equation (25) reflects the construction delay. Equation (26) denotes the idle penalty due to construction which reflects the value of the building. Equation (27) presents a single construction constraint for each floor and construction material. Equation (28) denotes the construction for the windows and external wall insulation that must be completed for each floor. Equation (29) is the precedence constraints for the building construction and energy savings. Equations (30) and (31) indicate the limitations for the construction budget.

4. Experimental Analysis and Results

For the experiments, a case building was used to analyze the effect of the retrofit actions. The case building was designed by simplifying the actual building. For ease of analysis, the building was divided into two parts, the lower and upper parts to reflect various characteristics.

4.1. Experiment Design

4.1.1. Description of the Case Building

Figure 1 presents a sketch of the case building. Detailed descriptions are shown in Table 1. The case building was a simplified version of the actual building in Seoul, Korea, which was a general hospital. It had an excessive energy consumption problem and also had various situations to analyze the effects of a building retrofit. It is 10-story building with different features of both low-rise and high-rise areas, which was suitable for analyzing the effect of area differences.

4.1.2. Types of Retrofit Materials

For the optimal retrofit material selection model, the specifications for windows, external wall insulation, roof insulation, and solar energy collector are presented in Table 2, Table 3, Table 4 and Table 5. The experiments were conducted by using data from Reference [15].

4.2. Results

4.2.1. Results of the Retrofit Material Selection Model

The optimal retrofit materials selected using the retrofit material selection model reflected the characteristics of the retrofit materials and the case building. Table 6 presents the results of the retrofit material selection model by considering both the energy savings and retrofit cost.
The energy savings and retrofit cost for each floor and retrofit material were calculated for the selected retrofit materials. Table 7, Table 8, Table 9 and Table 10 present the profits from energy saving and the retrofit cost for each selected retrofit material. This dataset was used to find the optimal retrofit planning.
Table 11 presents the energy saving amount and total retrofit cost for the case building. The energy usage of the case building was 377,000 kWh before applying the retrofit. After applying the building retrofit, 58,910 kWh of energy was saved, which is approximately 15–16% reduction in annual energy use. The total retrofit cost was about 40 million won.

4.2.2. Results of the Retrofit Planning Model

Our model considered both the floor and retrofit material for building retrofit planning while previous models only considered the effects of the retrofit after construction was completed. This provided meaningful benefits to both the building owners and users when the retrofit was applied to residential buildings as a building has both users and owners who are usually different. An owner always has some burden in the retrofit and the users demand it whenever it is needed. The proposed retrofit planning model could deal with conflicts between the building owners and users by reinvesting the profits from energy saving through the retrofit. The reinvesting mechanism reduces the burden of the building owner by decreasing the initial investment budget.
Table 12, Table 13, Table 14 and Table 15 present the results of the retrofit planning model. The horizontal axis denotes time periods and the vertical axis denotes floors. The asterisk (*) in a cell indicates the starting period of the building retrofit for the corresponding floor. The initial budget was reduced to 25 million won, which was more than 35% of the total retrofit cost obtained from the retrofit material selection model. Due to the idle penalty, the retrofit of windows and external wall insulation proceeded at the same time. If the idle penalty was not considered, the retrofit starting period for the windows and external walls could be different, but leads to additional losses for the building owner. In the next section, the effect of the initial budget is analyzed.

4.2.3. Analysis

Table 16 presents the profit and net profit at the end of the planning horizon for the different initial budgets. The profit increased at a steeper rate than the net profit, which meant that the effect of the initial budget during the retrofit period was not critical when the return of initial budget was considered.
For a more accurate analysis of the relationship between the initial budget and net profit, the increasing rate of net profit and the increasing rate of the budget are presented in Table 17. The initial budget increased by 28% from 25 million won to 32 million won, while the net profit increased only 20%. Similarly, the initial budget increased by 25% from 32 million won to 40 million won, while net profit increased by only 19%. The results showed that the effect of investing initial budget decreased.
Figure 2 graphically presents the profit and net profit changes for the different initial budgets. Figure 2a assumes that the building owner could proceed with the retrofit without any loans. In this case, the profit and initial budget showed a strong positive correlation. However, in the case of Figure 2b, which assumed that the building owner must pay the initial budget back, the net profit and initial budget showed a weak positive relation when compared to Figure 2a.
Under the assumption that the building owner paid back the initial budget, we defined the marginal asset effect, which denotes the net profit increase for the initial budget. As the initial budget increases, the marginal asset effect decreases, which indicates that larger initial budgets have fewer impacts on return on investment. Figure 3 shows the peak point of the marginal asset effect is located where the initial budget is 30 million won, rather than the initial budget of 40 million won. Therefore, the building owner does not need to invest the entire retrofit costs at once and can proceed with the building retrofit with a 25–37.5% reduced amount of budget under the results of the optimal retrofit planning model.
In short, the results showed that the net profit became larger when the initial budget was less than the cost of the total retrofit. However, the profit was higher when the initial budget was equal to the total retrofit cost. Thus, it was necessary to analyze the break-even points for both cases where the initial budget was less than the total retrofit cost and equal to the total retrofit cost. Figure 4 presents the results of the break-even analyses for both cases. The results showed that the recovery period of investing a reduced initial budget was an 18.5-unit period and the recovery period of investing the total retrofit cost was a 16-unit period. Considering that the total revenue per unit period after the completion of the building retrofit was about 4 million won, the difference of the break-even point for both cases was acceptable.

5. Conclusions

This study dealt with building retrofit planning, one of the methods used to solve the current power problems by improving the energy performance of existing buildings. Two mathematical models were proposed in this study. First, the retrofit material selection model, based on multi-objective optimization, was developed to consider both the energy savings and retrofit cost of the building retrofit materials. Second, the retrofit planning model was proposed to minimize losses to the building owner by applying the retrofit action in stages.
Previous studies have not accurately reflected real retrofit circumstances as they only considered the effect of the building retrofit after the construction was completed. These studies assumed the application of the building retrofit to the entire building at once, and ignored the relationship between the building owners and building users. This led to disharmony in the profit-sharing structure between the building owners and building users, one of the most important issues for building retrofit. The building owners must pay for the building retrofit to improve the energy performance of their buildings; however, the profit from the building retrofit goes to the building users who use the building space for a certain period of time. Thus, we suggested a retrofit planning model that incorporated specific planning for each retrofit material and floor to minimize the building owner’s loss by reducing the initial budget. Using the retrofit planning model, the adoption rate of building retrofit can be increased by creating a virtuous cycle of the profit.
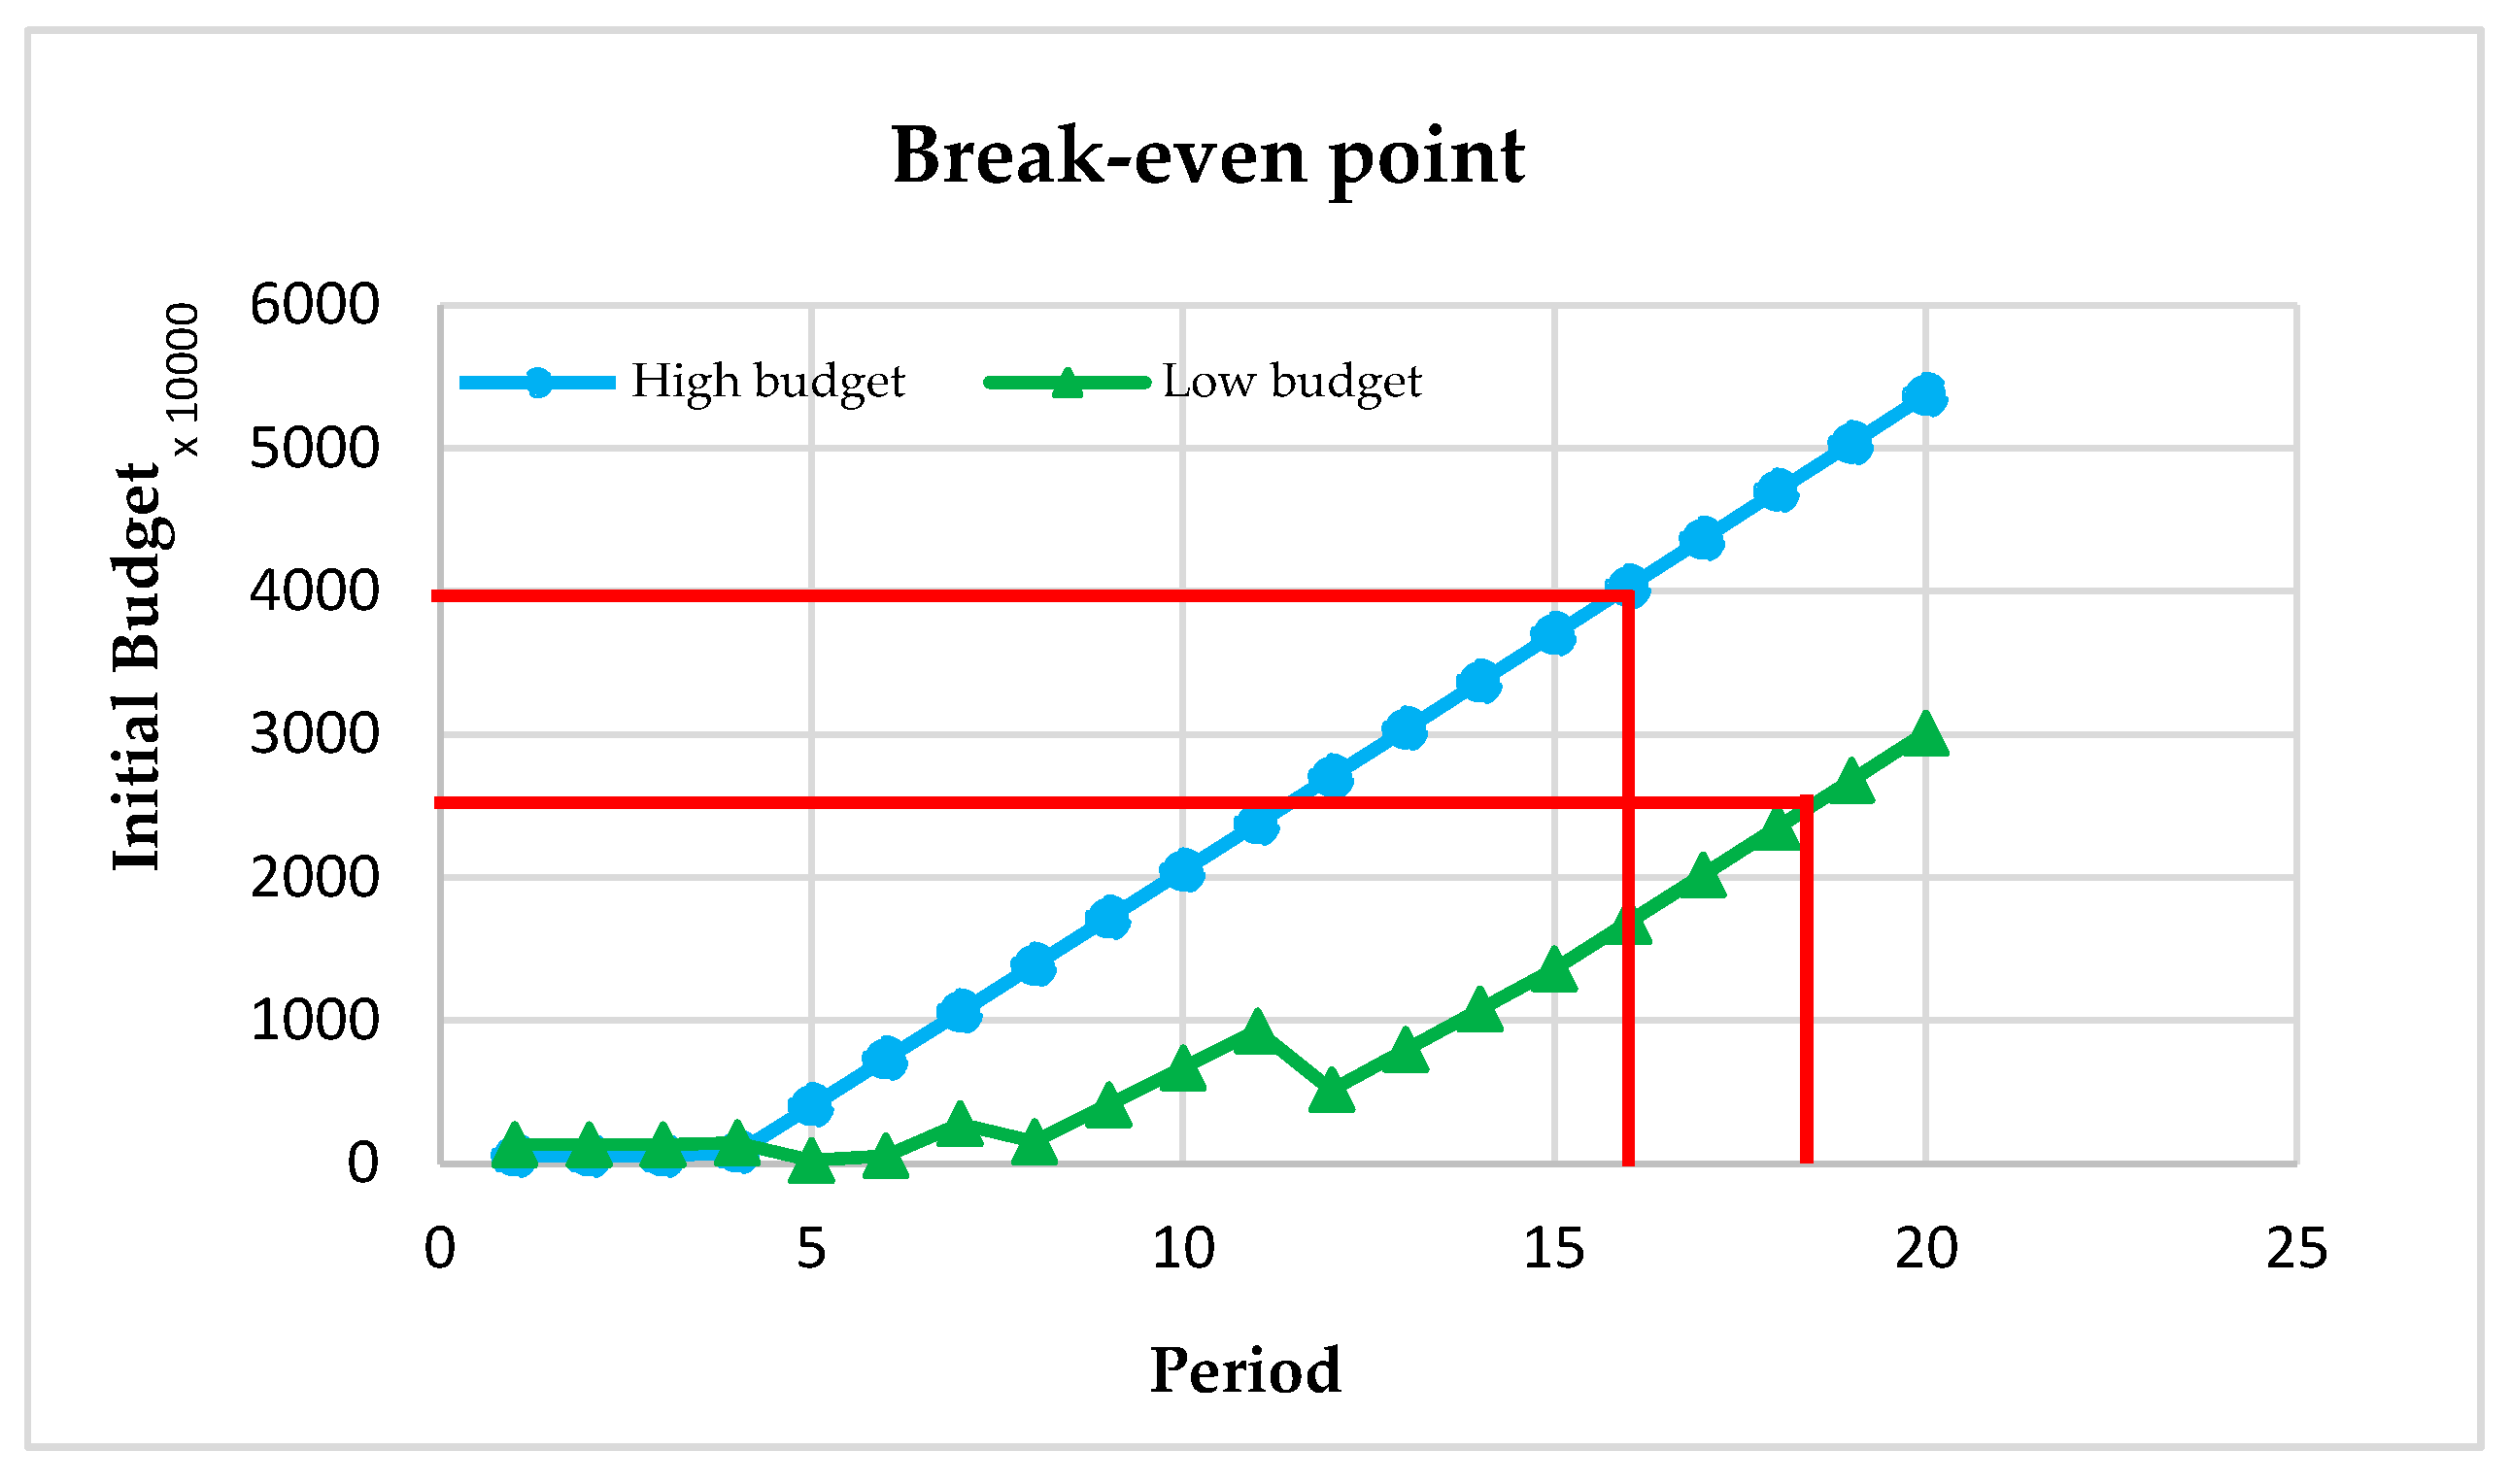
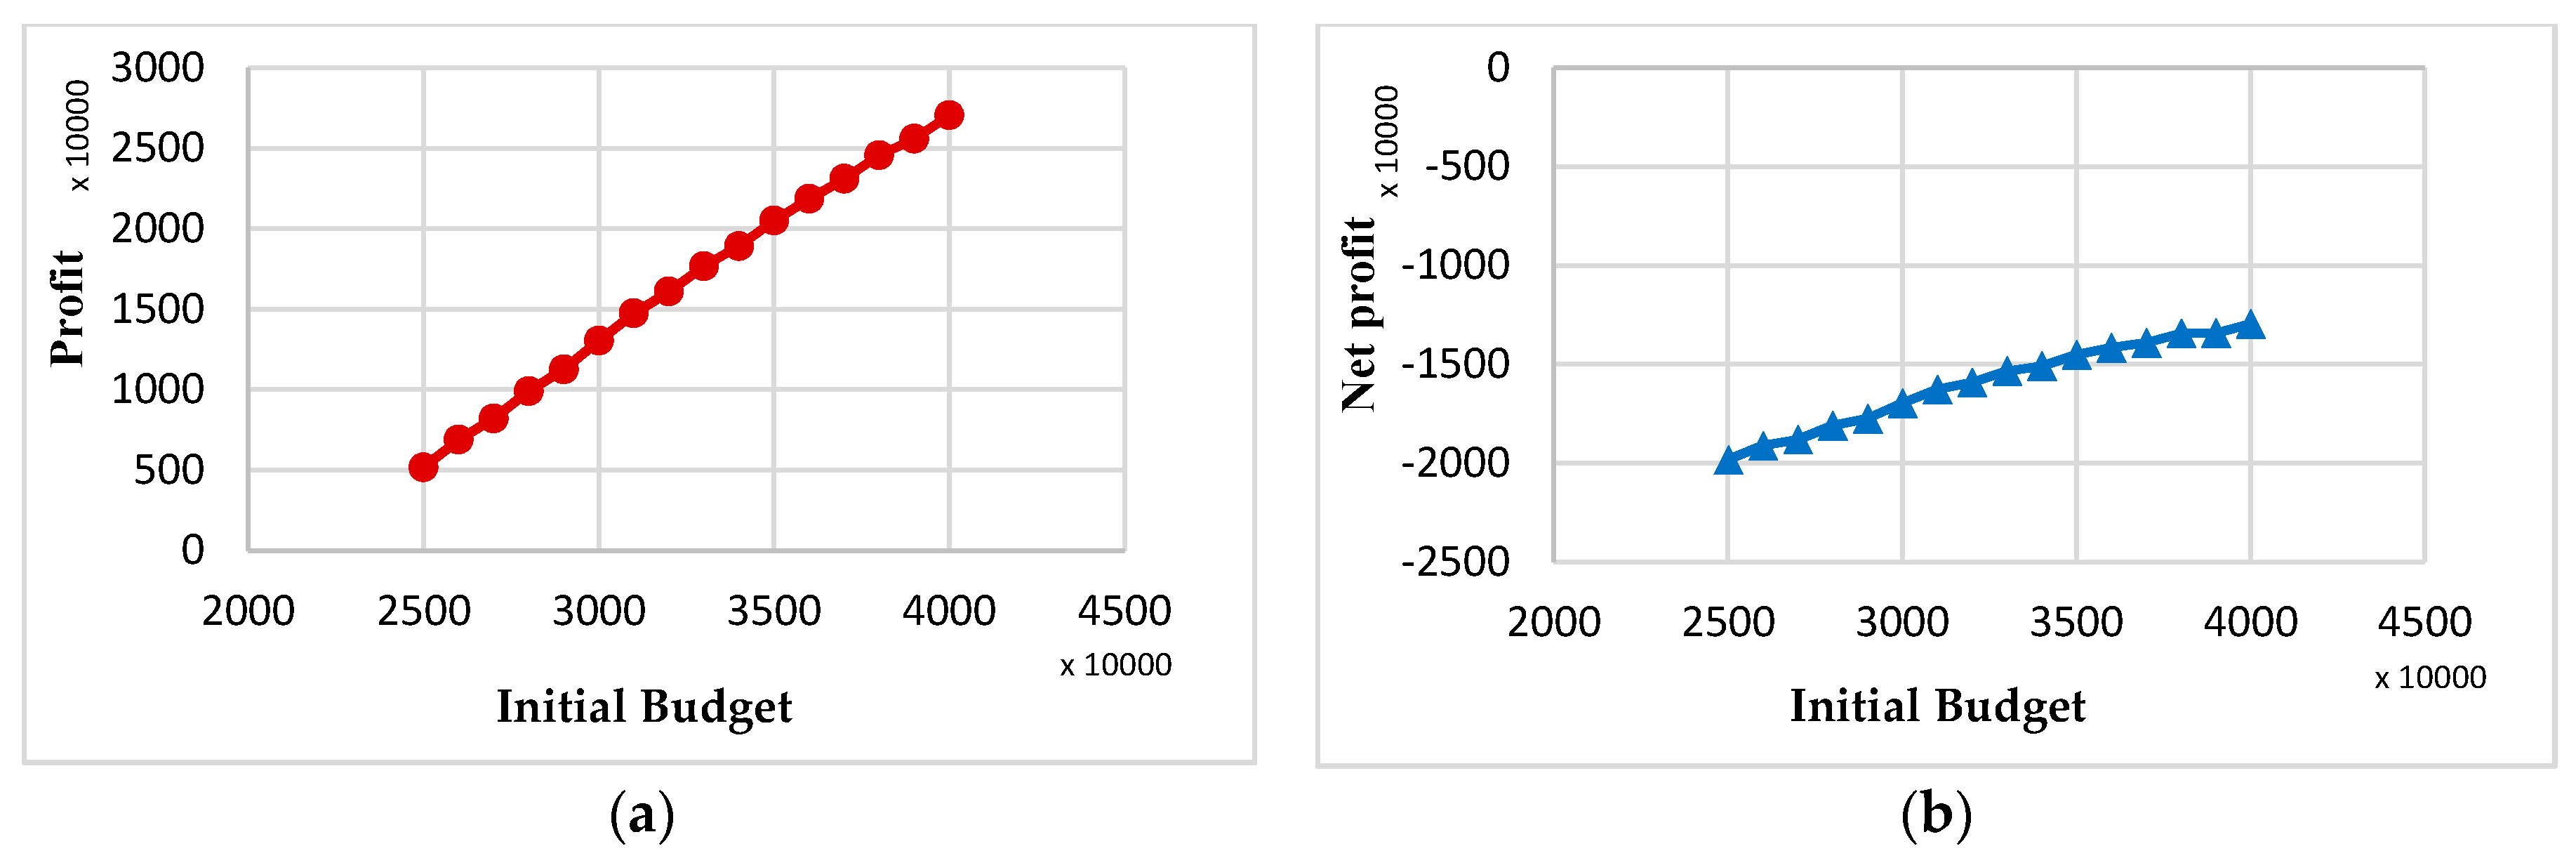
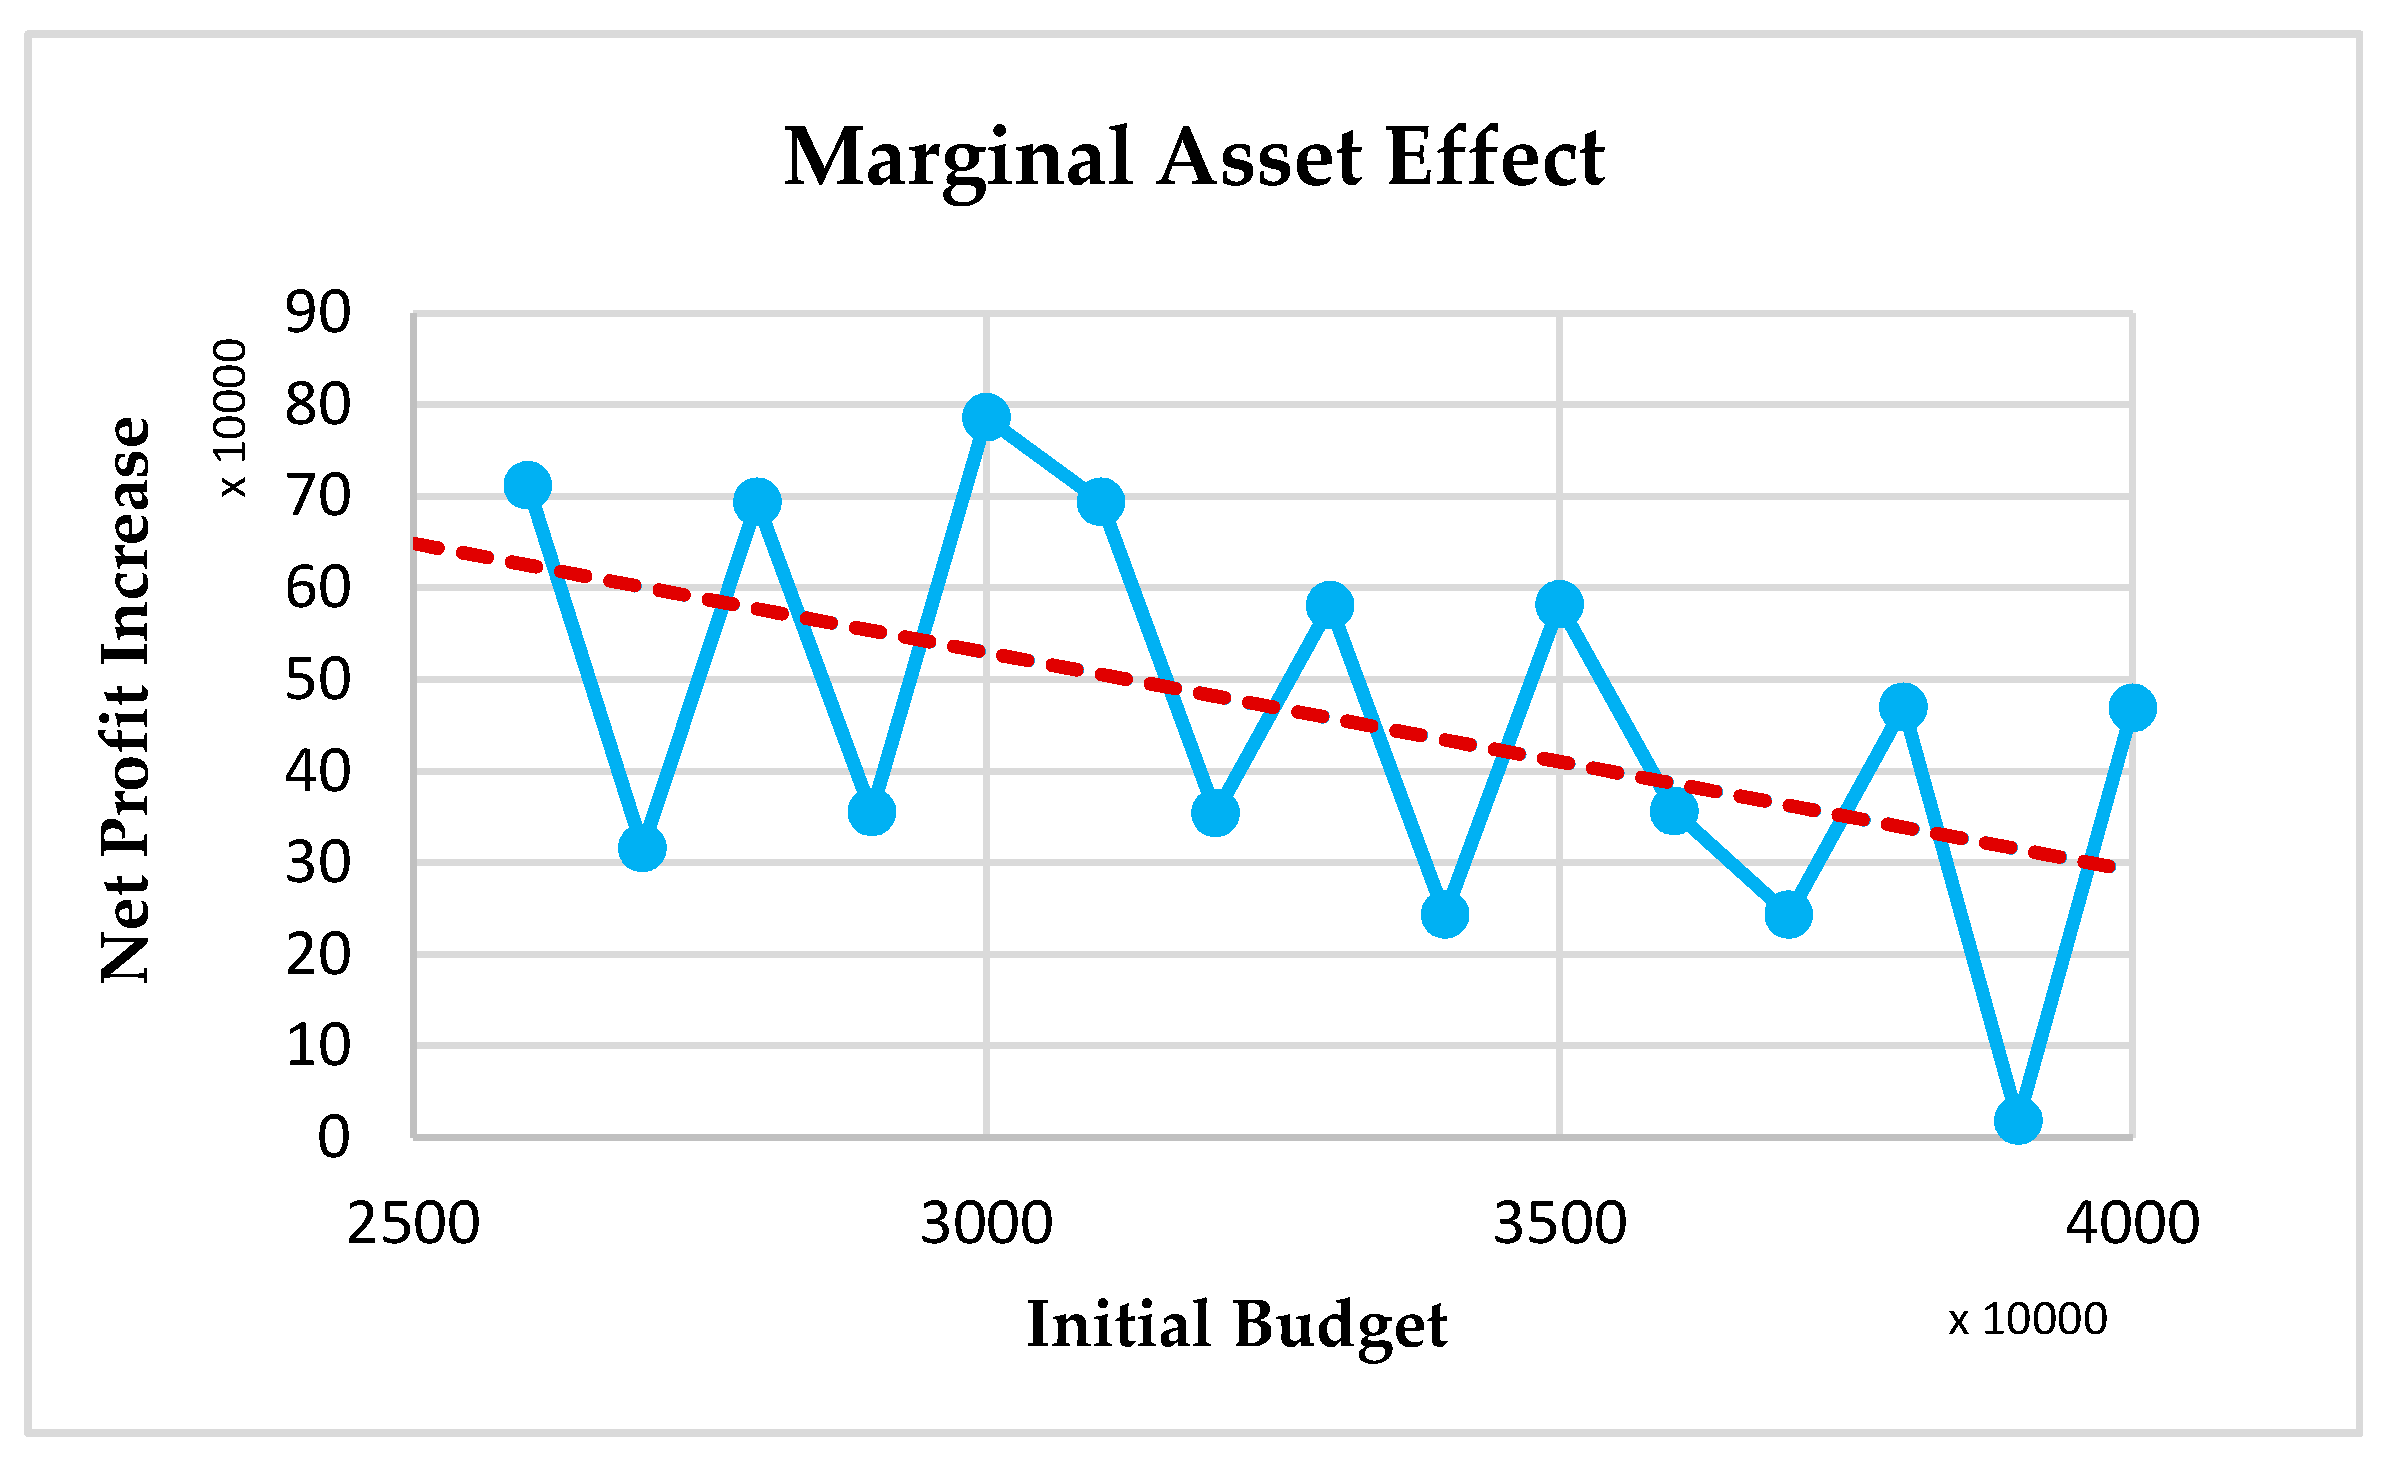
The experimental results using the simplified case building showed that the profit of the building retrofit was linearly increased with increases in the initial budget. However, if the payback of the initial budget was considered, the increasing rate of net profit decreased significantly. The results of the retrofit planning model showed that the building retrofit action could be applied with about a 40% reduction of the initial budget. Additionally, we evaluated the marginal asset effect to analyze the relationship between the initial budget and net profit. The results showed that adoption of the building retrofit with a reduced initial budget was more efficient in terms of net profit increase. Furthermore, the break-even analysis showed that the difference of the return period of the initial budget was not significant based on the revenue per unit period. This reduces the burden on the retrofit cost, which has been a big obstacle to adopting building retrofits and we can expect an increase in the adoption rate by using the proposed models. The results of the study could justify increasing the rent of the building due to a reduction in building operating costs. In addition, as mentioned in Reference [31], energy efficiency measures can affect the economic value of building. Through building retrofits, the building owner can earn more profit, and tenants can save on operating costs. The other important factor is that with building retrofits, the appearance of buildings can become better, which increases the social surplus in lagging regions, especially in Korea.
In future study, the optimal budget planning for building retrofits is needed. An efficient budget planning will increase the adoption rate of building retrofits when combined with the national subsidy system. Furthermore, we can consider the value increase of buildings after adopting building retrofits to reflect future profits for the building owner.

Acknowledgments

This research was supported by the Basic Science Research Program through the National Research Foundation of Korea (NRF), funded by the Ministry of Education (NRF-2016R1D1A1B03933014).

Author Contributions

Joonrak Kim wrote the manuscript and participated in all phases. Dongmin Son investigated the data for the experiments. Bongju Jeong conceived the theme of this study, guided the whole research process, and responded to the reviewers. All authors have read and approved the final manuscript.

Conflicts of Interest

The authors declare no conflict of interest.

References

  1. Hardesty, L. Energy Manager Today. Available online: http://www.energymanagertoday.com/industry-accounts-for-33-of-us-primary-energy-use-099763/ (accessed on 30 March 2015).
  2. European Commission. 2013: EU Transport in Figures—Statistical Pocketbook; Publications Office: Luxembourg, 2013. [Google Scholar]
  3. Park, K.H. Financing Energy Efficiency Building; Korea Energy Economic Institute (KEEI): Ulsan, Korea, 2011.
  4. Lee, K.; Koo, B.; Park, B.; Ahn, Y.H. The development of an energy-efficient remodeling framework in South Korea. Habitat Int. 2016, 53, 430–441. [Google Scholar] [CrossRef]
  5. South Korean Ministry of Trade, Industry and Energy (MOTIE). Greenhouse Gas Emission in South Korea; MOTIE: Sejong City, Korea, 2009.
  6. Diakaki, C.; Grigoroudis, E.; Kolokotsa, D. Towards a multi-objective optimization approach for improving energy efficiency in buildings. Energy Build. 2008, 40, 1747–1754. [Google Scholar] [CrossRef]
  7. Suehrcke, H.; Peterson, E.L.; Selby, N. Effect of roof solar reflectance on the building heat gain in a hot climate. Energy Build. 2008, 40, 2224–2235. [Google Scholar] [CrossRef]
  8. Berardi, U.; Ghaffarian Hoseini, A. State-of-the-art analysis of the environmental benefits of green roofs. Appl. Energy 2014, 115, 411–428. [Google Scholar] [CrossRef]
  9. Saadatian, O.; Sopian, K.; Salleh, E.; Lim, C.H.; Riffat, S.; Saadatian, E.; Sulaiman, M.Y. A review of energy aspects of green roofs. Renew. Sustain. Energy Rev. 2013, 23, 155–168. [Google Scholar] [CrossRef]
  10. Malatji, E.M.; Zhang, J.; Xia, X. A multiple objective optimization model for building energy efficiency investment decision. Energy Build. 2013, 61, 81–87. [Google Scholar] [CrossRef]
  11. Wang, B.; Xia, X.; Zhang, J. A multi-objective optimization model for the life-cycle cost analysis and retrofitting planning of buildings. Energy Build. 2014, 77, 227–235. [Google Scholar] [CrossRef]
  12. Xing, J.; Ren, P.; Ling, J. Analysis of energy efficiency retrofit scheme for hotel buildings using eQuest software: A case study from Tianjin, China. Energy Build. 2015, 87, 14–24. [Google Scholar] [CrossRef]
  13. Peng, C.; Wang, L.; Zhang, X. DeST-based dynamic simulation and energy efficiency retrofit analysis of commercial buildings in the hot summer/cold winter zone of China: A case in Nanjing. Energy Build. 2014, 78, 123–131. [Google Scholar] [CrossRef]
  14. Woo, J.H.; Menassa, C. Virtual Retrofit Model for aging commercial buildings in a smart grid environment. Energy Build. 2014, 80, 424–435. [Google Scholar] [CrossRef]
  15. Asadi, E.; Da Silva, M.G.; Antunes, C.H.; Dias, L. Multi-objective optimization for building retrofit strategies: A model and an application. Energy Build. 2012, 44, 81–87. [Google Scholar] [CrossRef]
  16. Kumbaroğlu, G.; Madlener, R. Evaluation of economically optimal retrofit investment options for energy savings in buildings. Energy Build. 2012, 49, 327–334. [Google Scholar] [CrossRef]
  17. Privitera, G.; Day, A.R.; Dhesi, G.; Long, D. Optimizing the installation costs of renewable energy technologies in buildings: A linear programming approach. Energy Build. 2011, 43, 838–843. [Google Scholar] [CrossRef]
  18. Brás, A.; Gomes, V. LCA implementation in the selection of thermal enhanced mortars for energetic rehabilitation of school buildings. Energy Build. 2015, 92, 1–9. [Google Scholar] [CrossRef]
  19. Dong, B.; Kennedy, C.; Pressnail, K. Comparing life cycle implications of building retrofit and replacement options. Can. J. Civ. Eng. 2005, 32, 1051–1063. [Google Scholar] [CrossRef]
  20. Carletti, C.; Sciurpi, F.; Pierangioli, L. The Energy Upgrading of Existing Buildings: Window and Shading Device Typologies for Energy Efficiency Refurbishment. Sustainability 2014, 6, 5354–5377. [Google Scholar] [CrossRef]
  21. Castleton, H.F.; Stovin, V.; Beck, S.B.M.; Davison, J.B. Green roofs; building energy savings and the potential for retrofit. Energy Build. 2010, 42, 1582–1591. [Google Scholar] [CrossRef]
  22. Kaklauskas, A.; Zavadskas, E.K.; Raslanas, S.; Ginevicius, R.; Komka, A.; Malinauskas, P. Selection of low-e windows in retrofit of public buildings by applying multiple criteria method COPRAS: A Lithuanian case. Energy Build. 2006, 38, 454–462. [Google Scholar] [CrossRef]
  23. Vereecken, E.; Van Gelder, L.; Janssen, H.; Roels, S. Interior insulation for wall retrofitting—A probabilistic analysis of energy savings and hydrothermal risks. Energy Build. 2015, 89, 231–244. [Google Scholar] [CrossRef]
  24. Wang, L.; Greenberg, S. Window operation and impacts on building energy consumption. Energy Build. 2015, 92, 313–321. [Google Scholar] [CrossRef]
  25. Lu, Y.; Wang, S.; Zhao, Y.; Yan, C. Renewable energy system optimization of low/zero energy buildings using single-objective and multi-objective optimization methods. Energy Build. 2015, 89, 61–75. [Google Scholar] [CrossRef]
  26. Asadi, E.; da Silva, M.G.; Antunes, C.H.; Dias, L.; Glicksman, L. Multi-objective optimization for building retrofit: A model using genetic algorithm and artificial neural network and an application. Energy Build. 2014, 81, 444–456. [Google Scholar] [CrossRef]
  27. Balocco, C.; Marmonti, E. Optimal and Sustainable Plant Refurbishment in Historical Buildings: A Study of an Ancient Monastery Converted into a Showroom in Florence. Sustainability 2013, 5, 1700–1724. [Google Scholar] [CrossRef]
  28. Asadi, E.; da Silva, M.G.; Antunes, C.H.; Dias, L. A multi-objective optimization model for building retrofit strategies using TRNSYS simulations, GenOpt and MATLAB. Build. Environ. 2012, 56, 370–378. [Google Scholar] [CrossRef]
  29. Koo, C.; Hong, T. A dynamic energy performance curve for evaluating the historical trends in the energy performance of existing buildings using a simplified case-based reasoning approach. Energy Build. 2015, 92, 338–350. [Google Scholar] [CrossRef]
  30. Kao, C.K.; Yang, J.B. Comparison of windows-based delay analysis methods. Int. J. Proj. Manag. 2009, 27, 408–418. [Google Scholar] [CrossRef]
  31. Popescu, D.; Bienert, S.; Schützenhofer, C.; Boazu, R. Impact of energy efficiency measures on the economic value of buildings. Appl. Energy 2012, 89, 454–463. [Google Scholar] [CrossRef]
Figure 1. The case study building.
Sustainability 09 02087 g001
Figure 2. Profit and net profit with an initial budget. (a) Profit for the different initial budgets; and (b) Net profit for the different initial budgets.
Sustainability 09 02087 g002
Figure 3. Profit per unit initial budget.
Sustainability 09 02087 g003
Figure 4. Break-even point for the high initial budget and the low initial budget.
Sustainability 09 02087 g004
Table 1. The dimension of the case study building.
Building Area (m2)Wall Area (m2)Window Area (m2)
1–3 floors222144.377.7
4–10 floors192124.867.2
Energy usage (before)377,000 kWh/year
Table 2. Window specifications.
Window TypeHeat Transmission ( U i )Solar Efficiency ( A e , i )Cost ( C i w i n )
15.10.8534.08
22.80.07539.42
32.70.754.031
41.60.6255.72
51.60.44135.53
Table 3. Specifications of the external wall insulation.
Wall Insulation TypeThickness ( d j )Heat Transmission ( λ j )Cost ( C j w a l )
10.030.03411.25
20.050.03812.67
30.030.0367.64
40.070.03610.44
50.080.03611.15
60.080.03316.38
70.040.0368.1
80.060.0369.56
90.020.0426.39
100.010.043.05
110.10.0417.95
120.150.0432.93
130.30.0453.85
Table 4. Specifications of roof insulation.
Roof Insulation TypeThickness ( d k )Heat Transmission ( λ j )Cost ( C k r o f )
10.020.0426.39
20.030.0334.32
30.040.0335.6
40.050.0336.87
50.060.0338.14
60.070.0339.43
70.080.03310.7
80.040.03411.64
90.0650.03724.67
100.1050.03734.8
Table 5. Specifications of solar energy collectors.
Solar Collector TypeSolar Energy ( E l s c )Cost ( C l s c )
110611645.1
218652402.27
310481900.9
410481465.47
519002113.5
619203135.54
Table 6. Selected retrofit materials.
w 1 w 2 Roof InsulationSolar Energy CollectorWindowExternal Wall Insulation
0124101
0.10.924101
0.20.824101
0.30.724101
0.40.624101
0.50.524101
0.60.424101
0.70.325101
0.80.225101
0.90.12572
10106134
Table 7. Energy savings and retrofit cost for windows.
WindowEnergy Saving (KRW/Period)Retrofit Cost (KRW)
1–3 floors164,1083,442,400
4–10 floors80,4802,977,200
Table 8. Energy savings and retrofit cost for external wall insulation.
WallEnergy Saving (KRW/Period)Retrofit Cost (KRW)
1–3 floors302,708572,150
4–10 floors147,666494,830
Table 9. Energy savings and retrofit cost for the roof insulation.
RoofEnergy Saving (KRW/Period)Retrofit Cost (KRW)
135,8411,213,100
Table 10. Energy Saving and Retrofit Cost for Solar Energy Collector.
Solar CollectorEnergy Saving (KRW/Period)Retrofit Cost (KRW)
114,0001,905,100
Table 11. Annual energy savings and total retrofit cost of the case building.
Energy Saving (kWh/Year)Expected Profit (KRW/Period)Retrofit Cost (KRW)
58,9104,136,22339,466,700
Table 12. The optimal retrofit planning for windows.
Floor (m)Period (t)
123456789101112131415
1*
2*
3*
4*
5*
6*
7*
8*
9*
10*
* Starting period of building retrofit for corresponding floor.
Table 13. The optimal retrofit planning for external wall insulation.
Floor (m)Period (t)
123456789101112131415
1*
2*
3*
4*
5*
6*
7*
8*
9*
10*
* Starting period of building retrofit for corresponding floor.
Table 14. The optimal retrofit planning for roof insulation.
Period (t)
123456789101112131415
*
* Starting period of building retrofit for corresponding floor.
Table 15. The optimal retrofit planning for solar energy collectors.
Period (t)
123456789101112131415
*
* Starting period of building retrofit for corresponding floor.
Table 16. Profit and net profit for different initial budgets.
BudgetProfitNet Profit (Actual Flow of Money) = Profit − Budget
40,000,0002,7038,000−12,962,000
32,000,0001,6076,000−15,924,000
25,000,0005,165,000−19,835,000
Table 17. Increasing rate of budget and net profit for different initial budgets.
BudgetIncreasing Rate of BudgetNet ProfitIncreasing Rate of Net Profit
40,000,0000.25−12,962,0000.19
32,000,0000.28−15,924,0000.20
25,000,000-−19,835,000-

