Article

Charge Pricing Optimization Model for Private Charging Piles in Beijing

1
School of Economics and Management, North China Electric Power University, Beijing 102206, China
2
Research Center for Beijing Energy Development, Beijing 102206, China
3
Ministry of Industry and Information Technology, Beijing 100804, China
*
Author to whom correspondence should be addressed.
Sustainability 2017, 9(11), 2075; https://doi.org/10.3390/su9112075
Submission received: 30 July 2017 / Revised: 8 October 2017 / Accepted: 7 November 2017 / Published: 11 November 2017
(This article belongs to the Section Economic and Business Aspects of Sustainability)

Abstract

:
This paper develops a charge pricing model for private charging piles (PCPs) by considering the environmental and economic effects of private electric vehicle (PEV) charging energy sources and the impact of PCP charging load on the total load. This model simulates users’ responses to different combinations of peak-valley prices based on the charging power of PCPs and user charging transfer rate. According to the regional power structure, it calculates the real-time coal consumption, carbon dioxide emissions reduction, and power generation costs of PEVs on the power generation side. The empirical results demonstrate that the proposed peak-valley time-of-use charging price can not only minimize the peak-valley difference of the total load but also improve the environmental effects of PEVs and the economic income of the power system. The sensitivity analysis shows that the load-shifting effect of PCPs will be more obvious when magnifying the number of PEVs by using the proposed charging price. The case study indicates that the proposed peak, average, and valley price in Beijing should be 1.8, 1, and 0.4 yuan/kWh, which can promote the large-scale adoption of PEVs.

1. Introduction

In order to alleviate the problem of environmental pollution and the greenhouse gas effect, many countries, including China, have formulated relevant policies to promote the development of electric vehicles (EVs). However, the uncontrolled charging behavior of increasing numbers of EVs will not only affect the stability of the power grid, but also the coal consumption and carbon emissions of EV charging energy sources. The charge pricing of EVs is the key to guide the orderly charging of EV users and, importantly, to ensure the benefits of charging facility operators. The research on charge pricing of EVs can be divided into three aspects.
From the perspective of stakeholders’ economic benefits: Finn et al. [1] determined the charging price of EVs to increase the economic benefits of participants; Anderson [2] proposed a two-stage charge pricing approach to balance the interests between public institutions and consumers; Lv [3] designed an optimal time-of-use (TOU) tariff scheme to balance the interests of the users and the power grid by using a multi-objective genetic algorithm; to minimize the users’ charging costs, Zhang et al. [4] set a charging price to standardize their charging behavior, Yu et al. [5] introduced an incentive factor into the charging/discharging power limitation and charging/discharge price, and Zhang and Li [6] proposed a regime-switching based risk management scheme against the electricity peak prices.
From the perspective of smoothing the power grid’s load: Ge et al. [7] ordered the charging of EVs to achieve the peak-filling effect of EVs by optimizing the valley price; Xiang et al. [8] established the vehicle-to-grid charging and discharging period model and the peak-valley electricity price model to determine the optimal charge-discharge period and corresponding electricity price; Dai et al. [9] applied the particle swarm optimization algorithm to solve the electricity price which can smooth the load of the power grid and ensure the users’ benefits; Xu et al. [10] utilized the heuristic algorithm to define the TOU tariff of EVs; Dufo-López and Bernal-Agustín [11] presented a methodology to evaluate the technical and economic performance of a grid-connected system with electricity storage under a TOU electricity tariff; to smooth the power load profiles, Hu et al. [12] designed two valley-filling pricing mechanisms under non-cooperative and cooperative scenarios, respectively, to schedule EV owners’ charging; Deng et al. [13] presented a bi-level programming approach that coordinated the charging of private electric vehicles (PEVs) with the network load and open market electricity price.
From the perspective of environmental protection: in order to reduce the load fluctuation of the renewable energy power, Dallinger and Wietschel [14] suggested to provide EV users with the preferential charging price when the supply of renewable energy power was high; Foley et al. [15] determined the charging price of EVs by considering CO2 emissions and new energy input as a proportion of the transport industry; Zhang et al. [16] analyzed fuel costs and CO2 emissions of EVs in three power generation combinations, two charging control strategies, and two real-time pricing scenarios; to improve energy supply patterns, reduce energy system costs and abate pollutant emissions, Yu et al. [17] developed a robust flexible probabilistic programming method for planning municipal energy systems considering peak electricity prices and EVs.
In summary, previous studies have addressed charge pricing of EVs mainly from the three perspectives of stakeholders’ economic benefits, the power load’s stability, and environmental protection. They demonstrate that these three effects are important to the charge pricing of EVs. Temporal price differentiation has a significant impact on users’ charging time and the price level [18]. The charging and discharging of batteries can be coordinated by formulating a ladder-type electricity price [19]. TOU schemes are more beneficial to plug-in hybrid EV owners than real time pricing [20]. It is estimated that the demand number of EVs will be 600,000 in Beijing by 2020, and the proportion of PEV number in this will be more than 60% [21]. Therefore, these motivations have led the authors to work on the peak-valley TOU charge pricing for private charging piles (PCPs) by considering their economic and environmental effects at the generation side and the impact of PCP charging load on the total load. Diminishing the peak-valley difference of the power load can mitigate the peak-load regulation pressure of power supply enterprises during peak hours, and decrease the unit operating costs of the power grid by increasing the electricity sales during valley hours. Moreover, it can enhance the utilization of power generation equipment which results in reducing the coal consumption of power supply unit. Furthermore, this will not only lower the coal consumption of thermal power generator sets but also be favorable to the utilization of night wind power during the valley period. Thus, this paper chooses the peak-valley difference of the total load as the criterion to reflect if the power grid’s load is stability.
The contributions of this study include: (1) to minimize the peak-valley difference of the total load, this paper analyzes multiple factors influencing the charge pricing, and proposes a peak-valley TOU charge pricing model; (2) the optimal charging price is identified according to the energy-saving, emission-reduction, and load-shifting effects of PCPs; (3) the proposed model introduces the existing charging price to realistically simulate user price response, and determines economic benefits of PCPs from the point of view of the power system; (4) according to PEV users’ driving and charging patterns and the local power structure, this paper calculates the real-time coal consumption and carbon emissions reduction of PEVs and the electricity-sale incomes of the power system; and (5) to analyze the load-shifting effect of the proposed charging price, this paper magnifies the number of PEVs to test the peak-valley difference reduction rate. The purpose of this study is to develop a peak-valley TOU charge pricing model which can take into account the environmental performance of the PEV energy sources, the impact of the PCP charging load on the power grid, and the net income of the power system. This model simulates the real-time charging power of PEVs and price response of users based on the PEV charging probability and the regional power structure. Considering five constraints of the price limitation, generator sets’ installed capacity, PEV energy sources’ coal consumption and emissions reduction, and the power system’s electricity-sale incomes, the peak-valley TOU charging price is proposed to minimize the peak-valley difference of the total load.

2. Charge Pricing Factors of PEVs

In the process of PEV charge pricing, this paper considers factors including the charging probability of PEVs, price response of PEV users, charging load forecast of PCPs, energy saving and emissions reduction of PEVs, and economic benefits of the power system. The charging load of PCPs is predicted according to the PEV charging probability and users’ price response. Considering the line loss and charge loss, the sum of PEV load and conventional load equals the total load. Based on the total load and the local power structure, the environmental and economic effects of PCPs are calculated.

2.1. Charging Probability of PEVs

This paper divides a day into 24 h (t = 0, 1, 2, …, 23). PEV users are assumed to immediately charge when they return home. According to the total number of PEVs (N) and the travel final return probability of PEVs (f(t)), the number of PEVs beginning to charge (Nr(t)) can be expressed as:
N r ( t ) = [ N × f ( t ) ]
where [] is the rounding symbol.

2.2. Price Response of PEV Users

The equations of user price response are provided by Chang et al. [22]: the dead zone thresholds (yuan/kWh) of peak-valley, peak-average, and valley-average price differences mean the peak-valley, peak-average, and valley-average price differences which users begin to respond to, and their values are 0.2, 0.2, and 0.1 respectively; the saturated zone thresholds (yuan/kWh) of peak-valley, peak-average, and valley-average price differences represent the peak-valley, peak-average, and valley-average price differences which users no longer response to, and their values are 1.4, 0.8, and 0.6 respectively; 0.25, 1, and 0.8 are price response curve linear region slopes in peak-valley, peak-average, and valley-average periods; 30%, 60%, and 40% are the saturation values of user transfer percentages in peak-valley, peak-average, and valley-average periods. Furthermore, this paper introduces the existing charging price (P0, yuan/kWh) into Equations (2)–(4) by considering its influence on user price response. Thus, peak-valley (apv), peak-average (apa), and valley-average (aav) user response transfer percentage can be adjusted as
a p v ( t ) = { 0 , P p P v 0.2 0.25 × ( P p P v 0.2 ) × ( P 0 / P v ) , 0.2 < P p P v 1.4 30 % × ( P 0 / P v ) , P p P v > 1.4
a p a ( t ) = { 0 , P p P a 0.2 ( P p P a 0.2 ) × ( P 0 / P a ) , 0.2 < P p P a 0.8 60 % × ( P 0 / P a ) , P p P a > 0.8
a a v ( t ) = { 0 , P a P v 0.1 0.8 × ( P a P v 0.1 ) × ( P 0 / P v ) , 0.1 < P a P v 0.6 40 % × ( P 0 / P v ) , P a P v > 0.6
where Pp, Pa, and Pv are the peak, average, and valley charging prices, yuan/kWh.
After users respond to the TOU tariff, the number of PEVs beginning to charge at each moment (Nc(t)) should be an non-negative integer. Thus, the equation of Nc(t) in the research of Chang et al. [22] is adjusted as:
N c 0 ( t ) = { [ N r ( t ) a p a N p / T p a p v N p / T p ] , v ( t ) = 1 [ N r ( t ) + a p a N p / T a a a v N a / T a ] , v ( t ) = 2 [ N r ( t ) + a p v N p / T v + a a v N a / T v ] , v ( t ) = 3
N c ( t ) = { N c 0 ( t ) , N c 0 ( t ) 0 0 , N c 0 ( t ) < 0
where Np and Na are the sum of the number of PEVs beginning to charge at peak and average period respectively; Values of v(t) can be 1, 2, and 3 which represents the peak, average, and valley period, respectively.

2.3. Charging Load Forecast of PCPs

This paper assumes that the daily travel mileage of private vehicles are the same, which is determined by the annual travel mileage of private vehicles. The charging time (Tc, hour) in the research of Su and Liang [23] is determined as:
T c = L M e 365 × 100 p
where p is the charging power of a single PCP, MW; Me is the 100-kilometer electric consumption of fuel vehicles, kWh; L is the annual travel mileage of private vehicles, km.
According to Equation (7), the charging time is 2 h. Thus, the charging power of PCPs (pc(t), MW) at each moment is expressed as:
p c ( t ) = { ( N c ( 23 ) + N c ( 0 ) ) × p , t = 0 ( N c ( t 1 ) + N c ( t ) ) × p , t 0
The load of PCPs (Fe(t), MW) with the line loss (ω) at each moment is calculated as:
F e ( t ) = p c ( t ) / ( 1 ω )
Considering the charging loss (η) of PCPs, the purchased electric quantity of EV users (Q(t), MWh) is:
Q ( t ) = p c ( t ) × ( 1 η ) × 1
The total load (F(t), MW) can be expressed as
F ( t ) = F e ( t ) + F t ( t )
where Ft(t) is the conventional load, MW.

2.4. Energy-Saving and Emission-Reduction Effects of PCPs

Considering the intermittency of wind power and hydroelectric power, this paper introduces the utilization rate of wind power (α(t)) in 24 h and the generating guarantee rate of hydroelectric power (β) to determine their available generation capacities (Gw(t) and Gh(t), MW) in each moment.
G w ( t ) = G w × α ( t )
G h ( t ) = G h × β
where Gw and Gh are the installed capacities of wind power and hydroelectric power, MW.
Coal power generating units are assumed to be peaking units. Coal consumption per electricity unit (s(t), t/MWh) is determined as:
s ( t ) = { 0 , F ( t ) G w ( t ) + G h ( t ) + G n c × ( F ( t ) G w ( t ) G h ( t ) G n ) × 1 / ( F ( t ) × 1 ) , G w ( t ) + G h ( t ) + G n < F ( t )
where Gn is the installed capacity of nuclear power, MW; c is the coal consumption of coal power per electricity unit, t/MWh.
Coal consumption of PEVs (S(t), t) is calculated as:
S ( t ) = s ( t ) × F e ( t ) × 1
Carbon emissions per electricity unit (ee(t), t/MWh) is defined as:
e e ( t ) = { ( e w × F ( t ) ) / ( F ( t ) × 1 ) , F ( t ) G w ( t ) ( e w × G w ( t ) + e h × ( F ( t ) G w ( t ) ) ) / ( F ( t ) × 1 ) , G w ( t ) < F ( t ) G w ( t ) + G h ( t ) ( e w × G w ( t ) + e h × G h ( t ) + e n × ( F ( t ) G w ( t ) G h ( t ) ) ) / ( F ( t ) × 1 ) , G w ( t ) + G h ( t ) < F ( t ) G w ( t ) + G h ( t ) + G n ( e w × G w ( t ) + e h × G h ( t ) + e n × G n + e c × ( F ( t ) G w ( t ) G h ( t ) G n ) ) / ( F ( t ) × 1 ) , G w ( t ) + G h ( t ) + G n < F ( t )
where ew, eh, en, and ec are carbon emissions of wind, hydroelectric, nuclear, and coal power respectively, t/MWh.
Carbon emissions of PEVs (Ee(t), t) is calculated as
E e ( t ) = e e ( t ) × F e ( t ) × 1
Carbon emissions of fuel vehicles (Eg(t), t) is determined as
E g ( t ) = ( Q ( t ) × 1000 ) / W e × W g × e g
where Wg is 100kilometer gasoline consumption of fuel vehicles, L; eg is carbon emissions of gasoline, t/L.

2.5. Economic Benefits of the Power System

The power plants generate the electricity from the wind, hydroelectric, nuclear, and thermal energy, and then the electricity is transferred by the power grid to PCPs for PEVs’ charging. Thus, this paper takes power plants and the power grid as an integrated system to calculate the economic benefits that the power system supplies energy to PEVs. The equation of generation costs per electricity unit (C(t), yuan/MWh) is expressed as
C ( t ) = { ( C w × F ( t ) ) / ( F ( t ) × 1 ) , F ( t ) G w ( t ) ( C w × G w ( t ) + C h × ( F ( t ) G w ( t ) ) ) / ( F ( t ) × 1 ) , G w ( t ) < F ( t ) G w ( t ) + G h ( t ) ( C w × G w ( t ) + C h × G h ( t ) + C n × ( F ( t ) G w ( t ) G h ( t ) ) ) / ( F ( t ) × 1 ) , G w ( t ) + G h ( t ) < F ( t ) G w ( t ) + G h ( t ) + G n ( C w × G w ( t ) + C h × G h ( t ) + C n × G n + C c × ( F ( t ) G w ( t ) G h ( t ) G n ) ) / ( F ( t ) × 1 ) , G w ( t ) + G h ( t ) + G n < F ( t )
where Cw, Ch, Cn, and Cc are generation costs of wind, hydroelectric, nuclear, and coal power respectively, yuan/MWh.
Net incomes that the power system sells to PEV users (I(t), yuan) is calculated as:
I ( t ) = { P p × 1000 × Q ( t ) C ( t ) × F e ( t ) × 1 , v ( t ) = 1 P a × 1000 × Q ( t ) C ( t ) × F e ( t ) × 1 , v ( t ) = 2 P v × 1000 × Q ( t ) C ( t ) × F e ( t ) × 1 , v ( t ) = 3

3. Charge Pricing Model of PCPs

Based on the work of Section 2, the charge pricing model aims at proposing an optimized peak-valley TOU charging price which could minimize the peak-valley difference of the total load and achieve better environmental and economic effects of PCPs.

3.1. Constraints

(1) Price constraint
The order in magnitude of charging prices should be valley price, average price and peak price, and the charging prices should be in the range limit of charging price.
P l o w P v < P a < P p P u p
where the upper limit of charging price is Pup, yuan/kWh; the lower limit of charging price is Plow, yuan/kWh.
(2) Energy-saving effect constraint
Coal consumption of PEVs (S(t)) should not be higher than the initial one (S0(t)).
t = 0 23 S 0 ( t ) t = 0 23 S ( t ) 0
(3) Emission-reduction effect constraint
Carbon emissions reduction of PEVs equals carbon emissions of fuel vehicles minus carbon emissions of PEVs, which should not be less than the initial one.
t = 0 23 ( E g ( t ) E e ( t ) ) t = 0 23 ( E g 0 ( t ) E e 0 ( t ) ) 0
(4) Economic benefit constraint
Net incomes of the power system cannot be lower than initial ones.
t = 0 23 I ( t ) t = 0 23 I 0 ( t ) 0
(5) Peak-valley load difference constraint
The peak-valley difference of the total load should not be higher than the initial one.
( M A X ( F 0 ( t ) ) M I N ( F 0 ( t ) ) ) ( M A X ( F ( t ) ) M I N ( F ( t ) ) ) 0

3.2. Optimization Goals

Minimize the peak-valley difference of the total load:
min Z = M A X ( F ( t ) ) M I N ( F ( t ) )

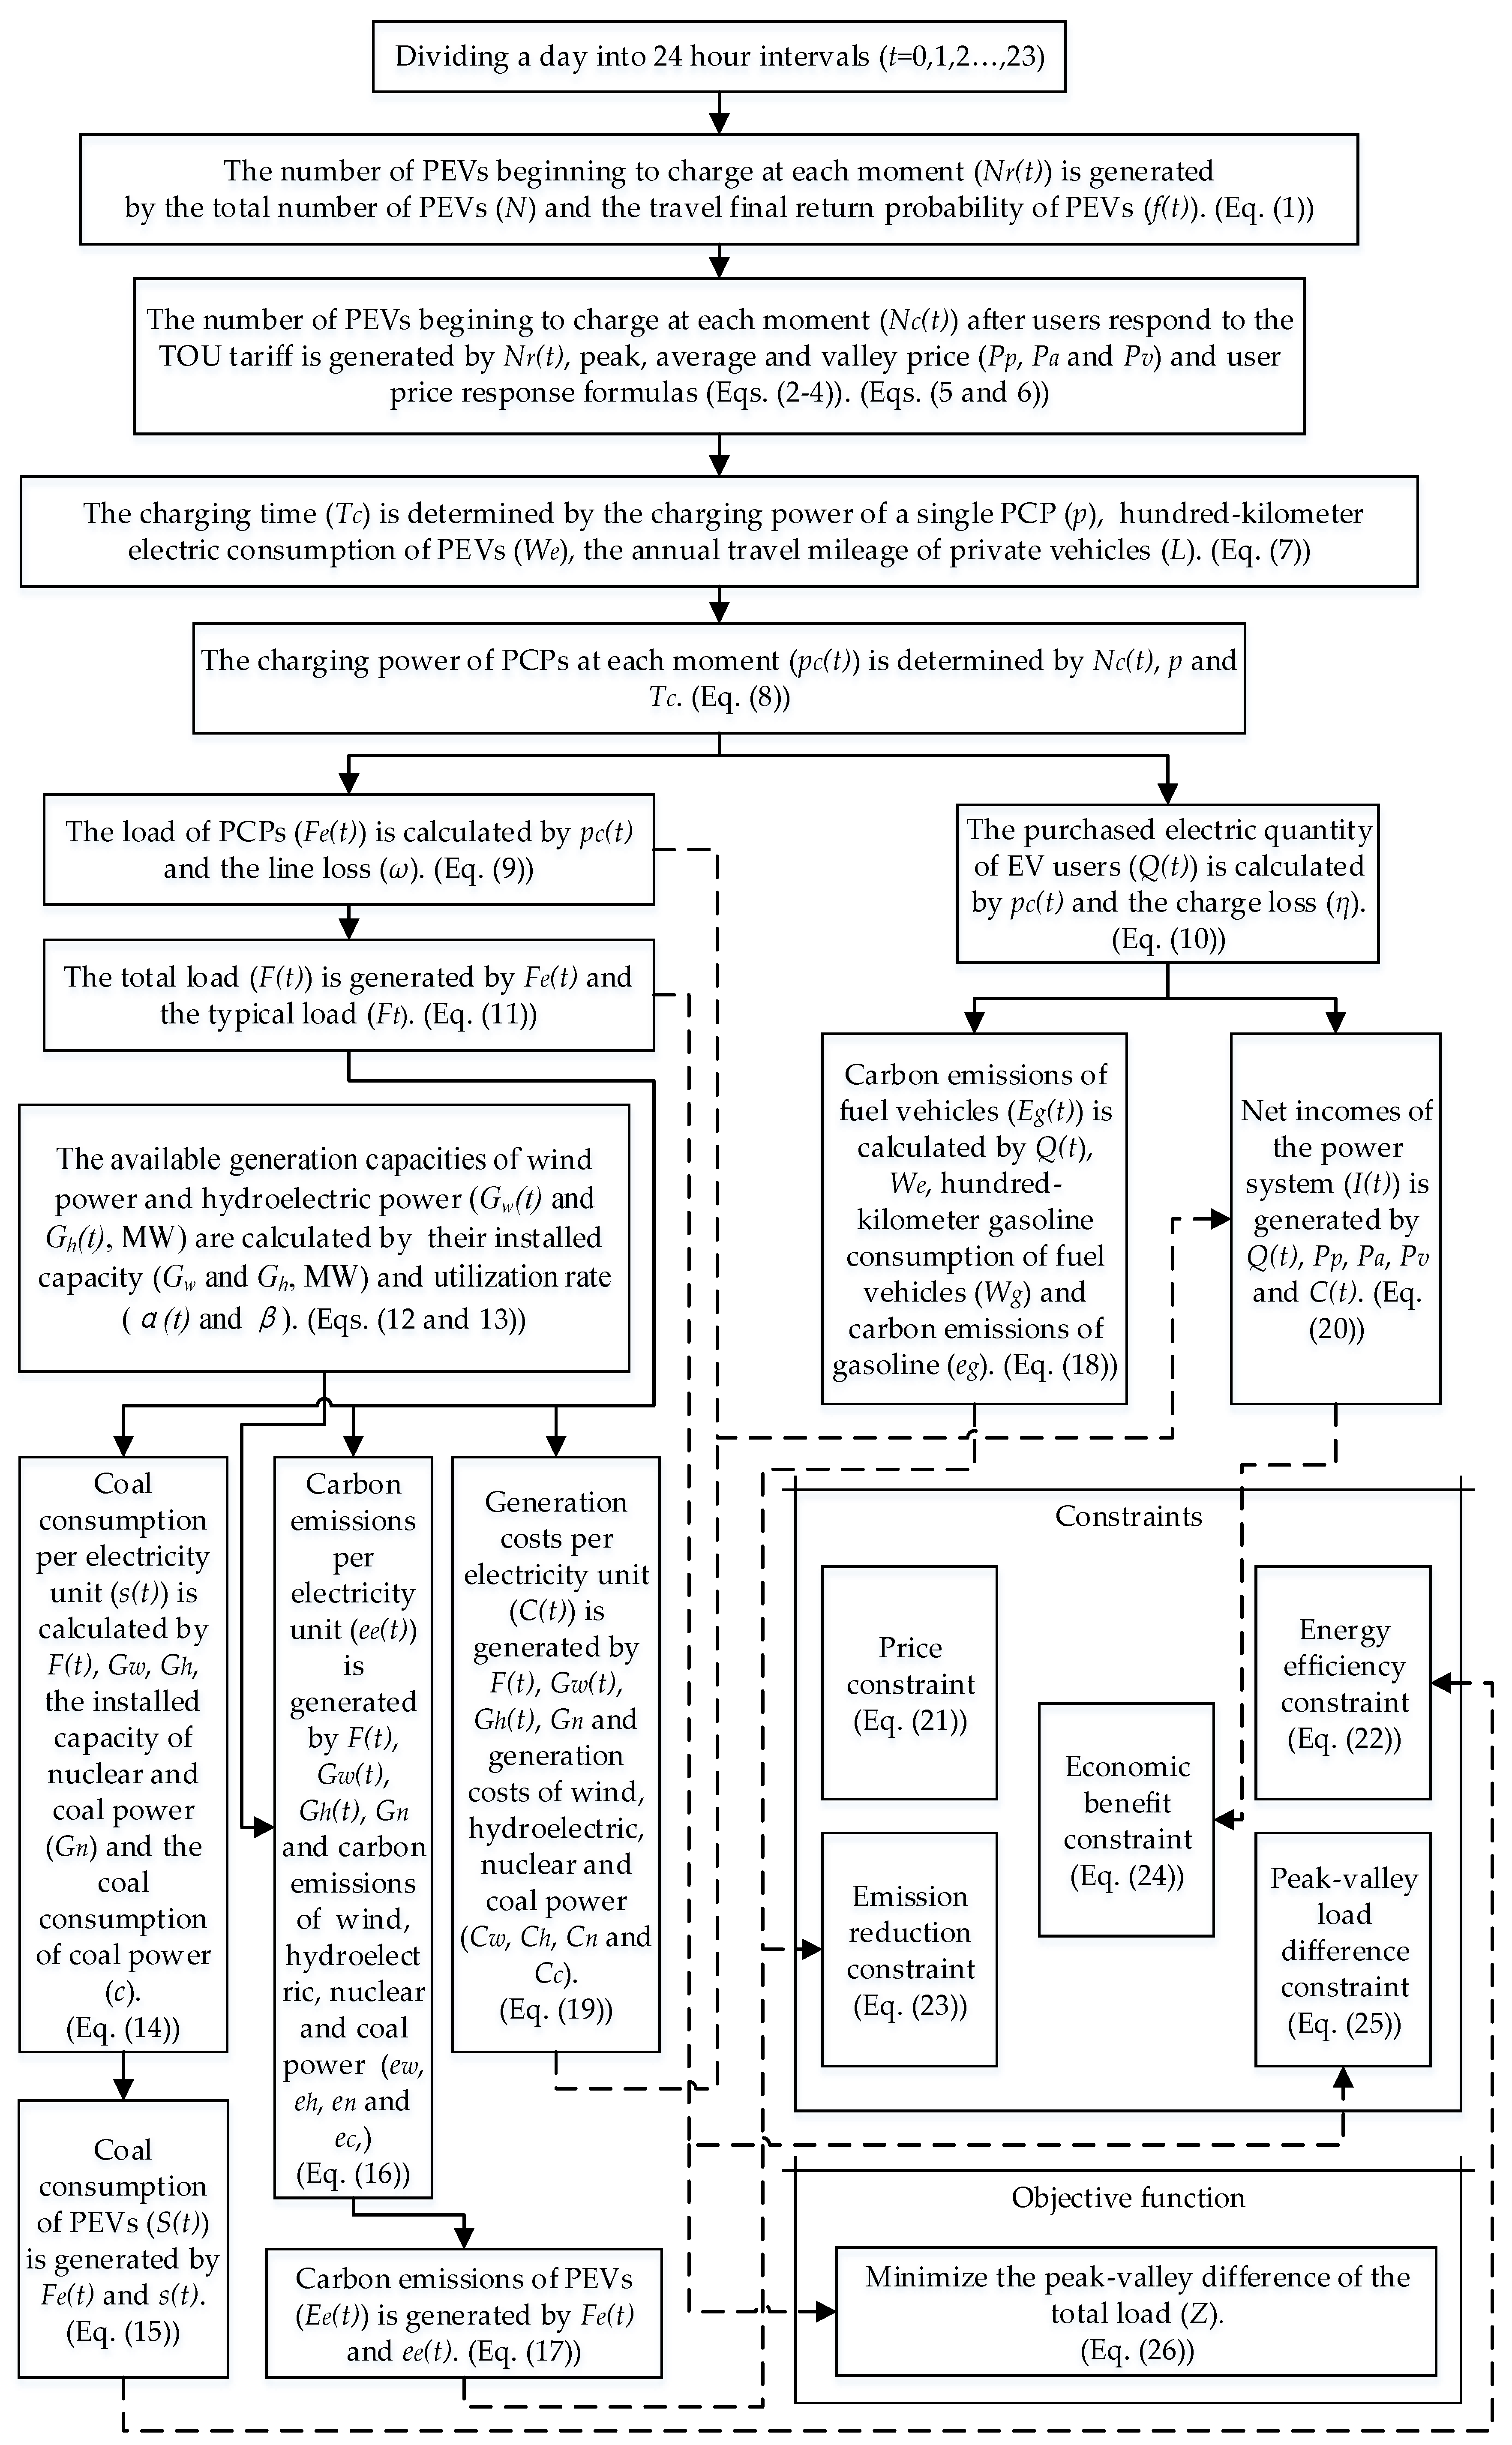
3.3. Flow Chart of the Optimized Peak-Valley TOU Charging Price

Figure 1 shows the design of the peak-valley TOU charge pricing optimization model for PCPs. The coal consumption of PEVs, carbon emissions reduction of PEVs, and net incomes of the power system are determined by the charging regularity of PEVs, the price response of users and the local power structure. Under the constraints of price range limit, generation set installed capacity, energy-saving and emission-reduction effects, economic benefit, and peak-valley load difference constraints, the peak-valley TOU charging price is proposed to minimize the peak-valley difference of the total load.

4. Empirical Results

This paper takes Beijing as an empirical case, and uses the energy consumption and carbon emissions coefficients of BAIC EV200 and Beijing Hyundai Elantra.

4.1. Initial Data of the Model

According to the investigated data of United States Transportation Department on household vehicles of United States, Su and Liang [23] approximated PEV travel final return time to the normal distribution by using the maximum likelihood estimation method. This paper transfers the probability density distribution function of PEV travel final return time [23] into a segmentation function by dividing a day into 24 h periods, and uses the rectangle method to integrate the segmentation function with MATLAB. The calculated travel final return probability of PEVs (f(t)) of each moment is shown as Table 1.
Beijing plans to construct 360,000 PCPs and basically achieve equipping each PEV with a PCP by 2020 [21]. Thus, the total number of PEVs should be 360,000. Currently, the charging price of PCP (P0) is 0.4733 yuan/kWh in Beijing [24]. The charging power of a single PCP (p) is 0.0025 MW [23]. The 100-kilometer electric consumption of BAIC EV200 (M) is 15 kWh [22]. The annual travel mileage of private vehicles (L) is 12,566 km [25]. The line loss (ω) and the charge loss (η) are 6.68% and 17%, respectively [26]. According to the research of Zhang et al. [26], the conventional load and the power structure of Beijing are shown as Table 2 and Table 3. It can be seen that the peak load concentrates on the period from 10:00 to 18:00 and the valley one distributed from 23:00 to 7:00 in Table 2. Table 3 shows that coal power is the main energy source to supply the charging of PEVs. Unlike other generation technology, coal power generates more carbon emissions. This means that more electricity from the coal power will cause PEVs produce more carbon emissions. Table 4 shows the utilization rate of wind power in 24 h which is provided by Song [27]. According to Table 3, hydroelectric-power installed capacity as a proportion of all power installed capacity is 21.05%. Thus, the hydroelectric power's generating guarantee rate should be 80–90% [28]. This paper uses the middle value, 85%, to estimate the utilization rate of hydroelectric power. Unlike the research of Zhang et al., this paper introduces the utilization rate of wind power and hydroelectric power, and assumes to use coal power to modulate the peak load of the power grid. This is to say that the generating capacity of coal power can be more than 10,000 MW when the other power is not enough to fit the electricity demand in the power grid.
According to the energy-saving power generation dispatching method, the order of the power generation should be wind power, hydroelectric power, nuclear power, and coal power [31]. The coal consumption of coal power per electricity unit (c) is 4.47 t/MWh [32]. Carbon emissions of gasoline (eg) are 0.002135 t/L [33]. According to the research of Chang et al. [22], the 100kilometer gasoline consumption of Elantra (sg) is 9L, the upper limit of charging price (Pup) is 3.576 yuan/kWh and the lower limit of charging price (Plow) is 0.396 yuan/kWh. Due to the existing charging price being 0.4733 yuan/kWh and the acceptable highest charging price for users being 3.576 yuan/kWh, there is a lot consumer surplus. It is feasible to adopt the peak-valley TOU charging price to guide PEV users’ charging behavior and make PCP operators more profitable.

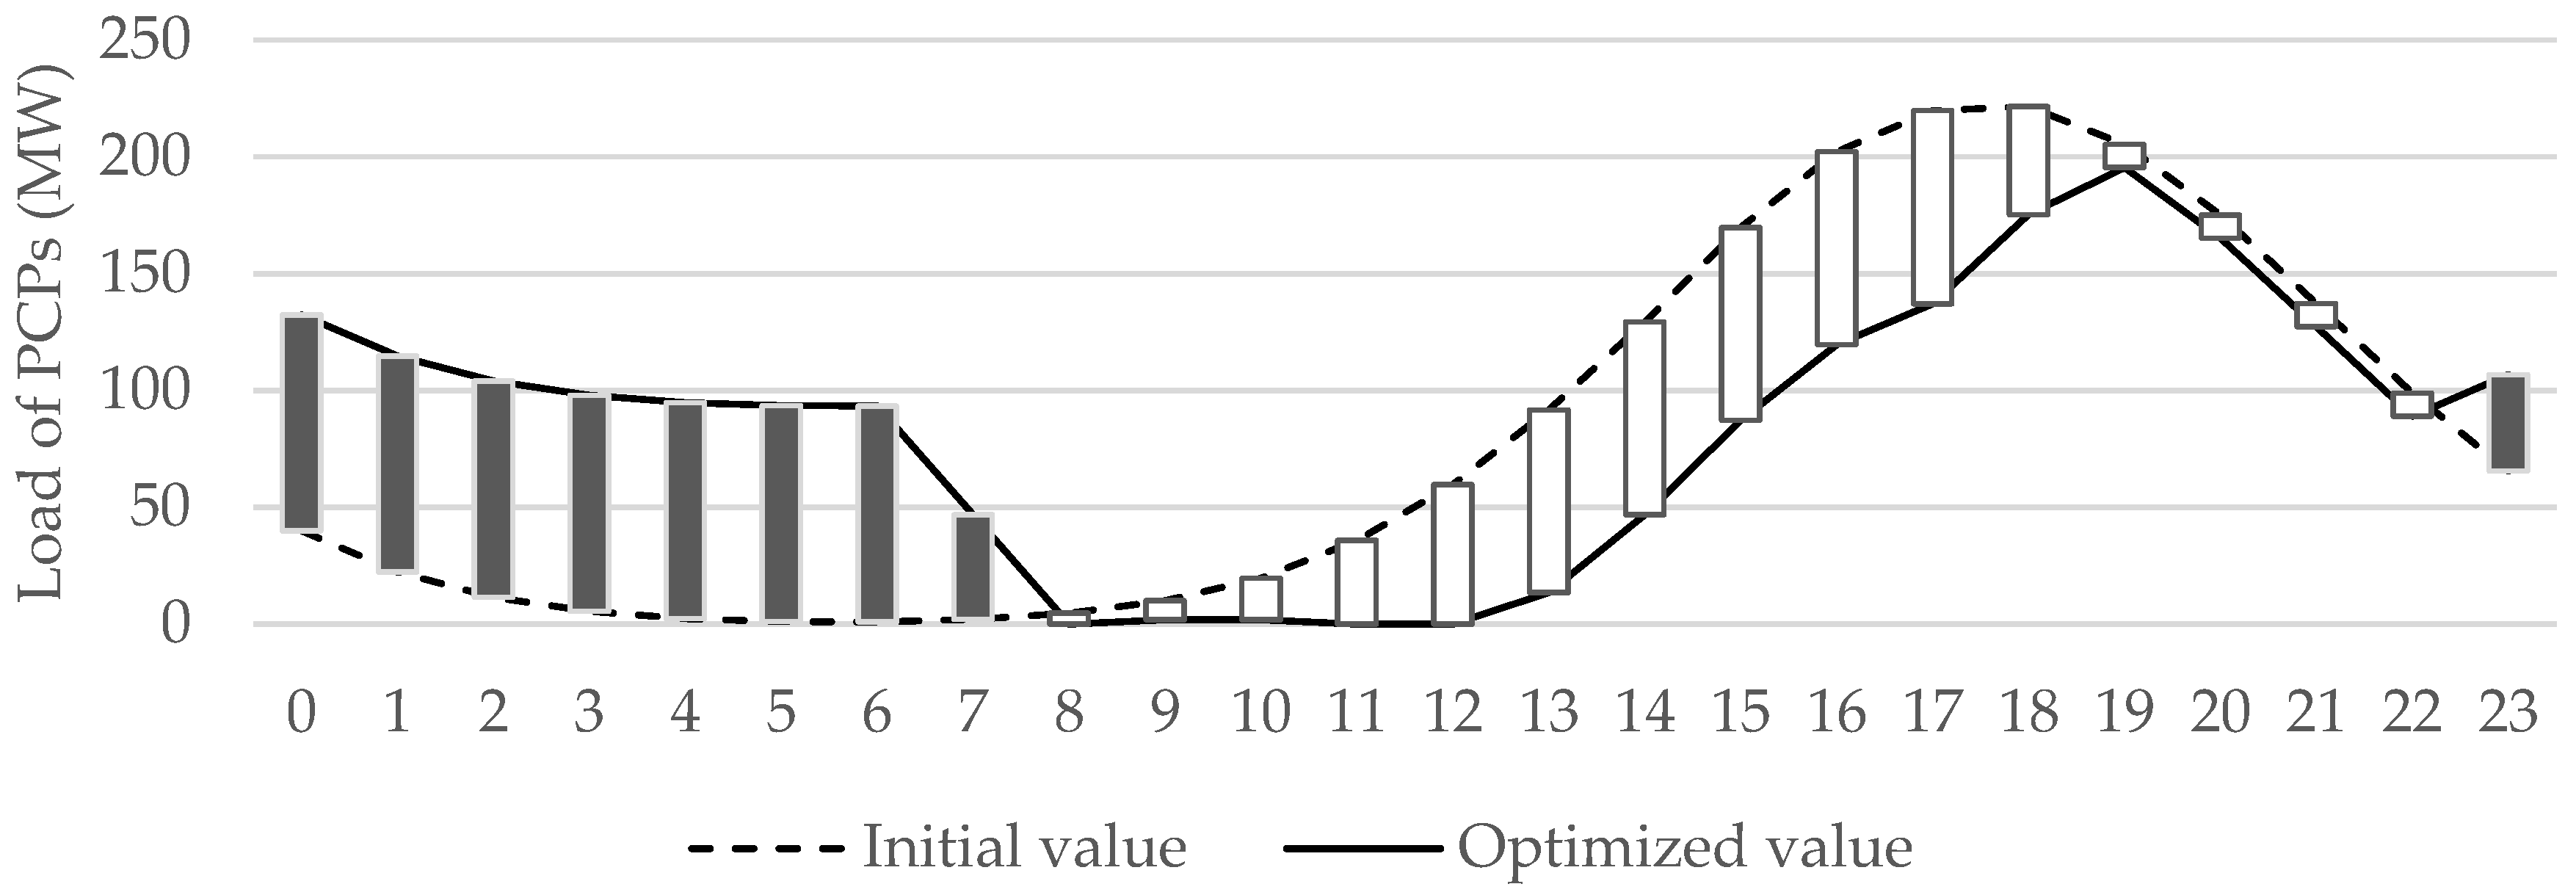
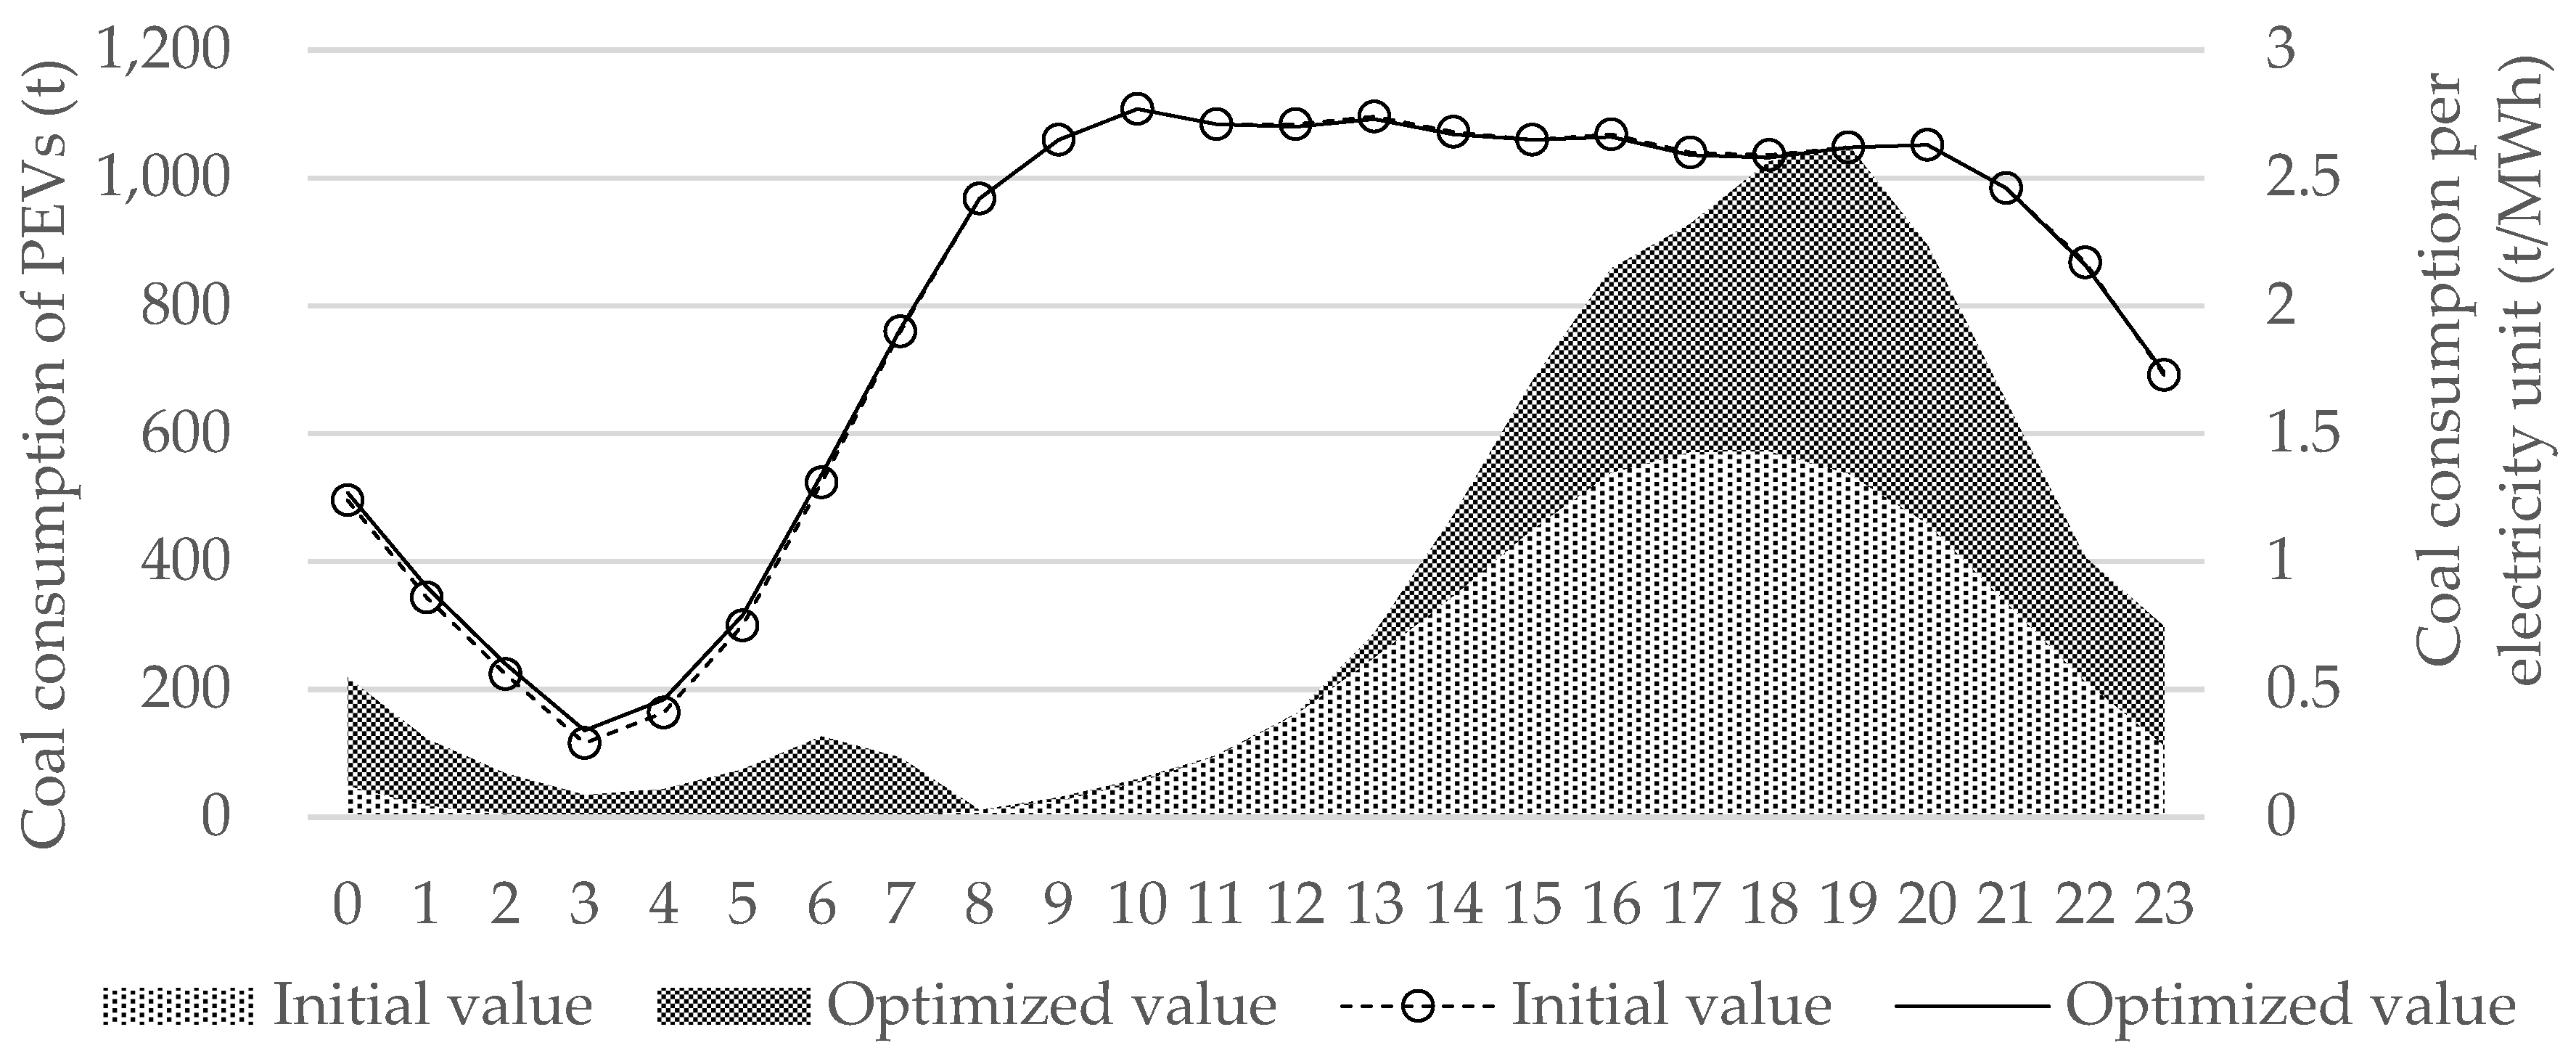
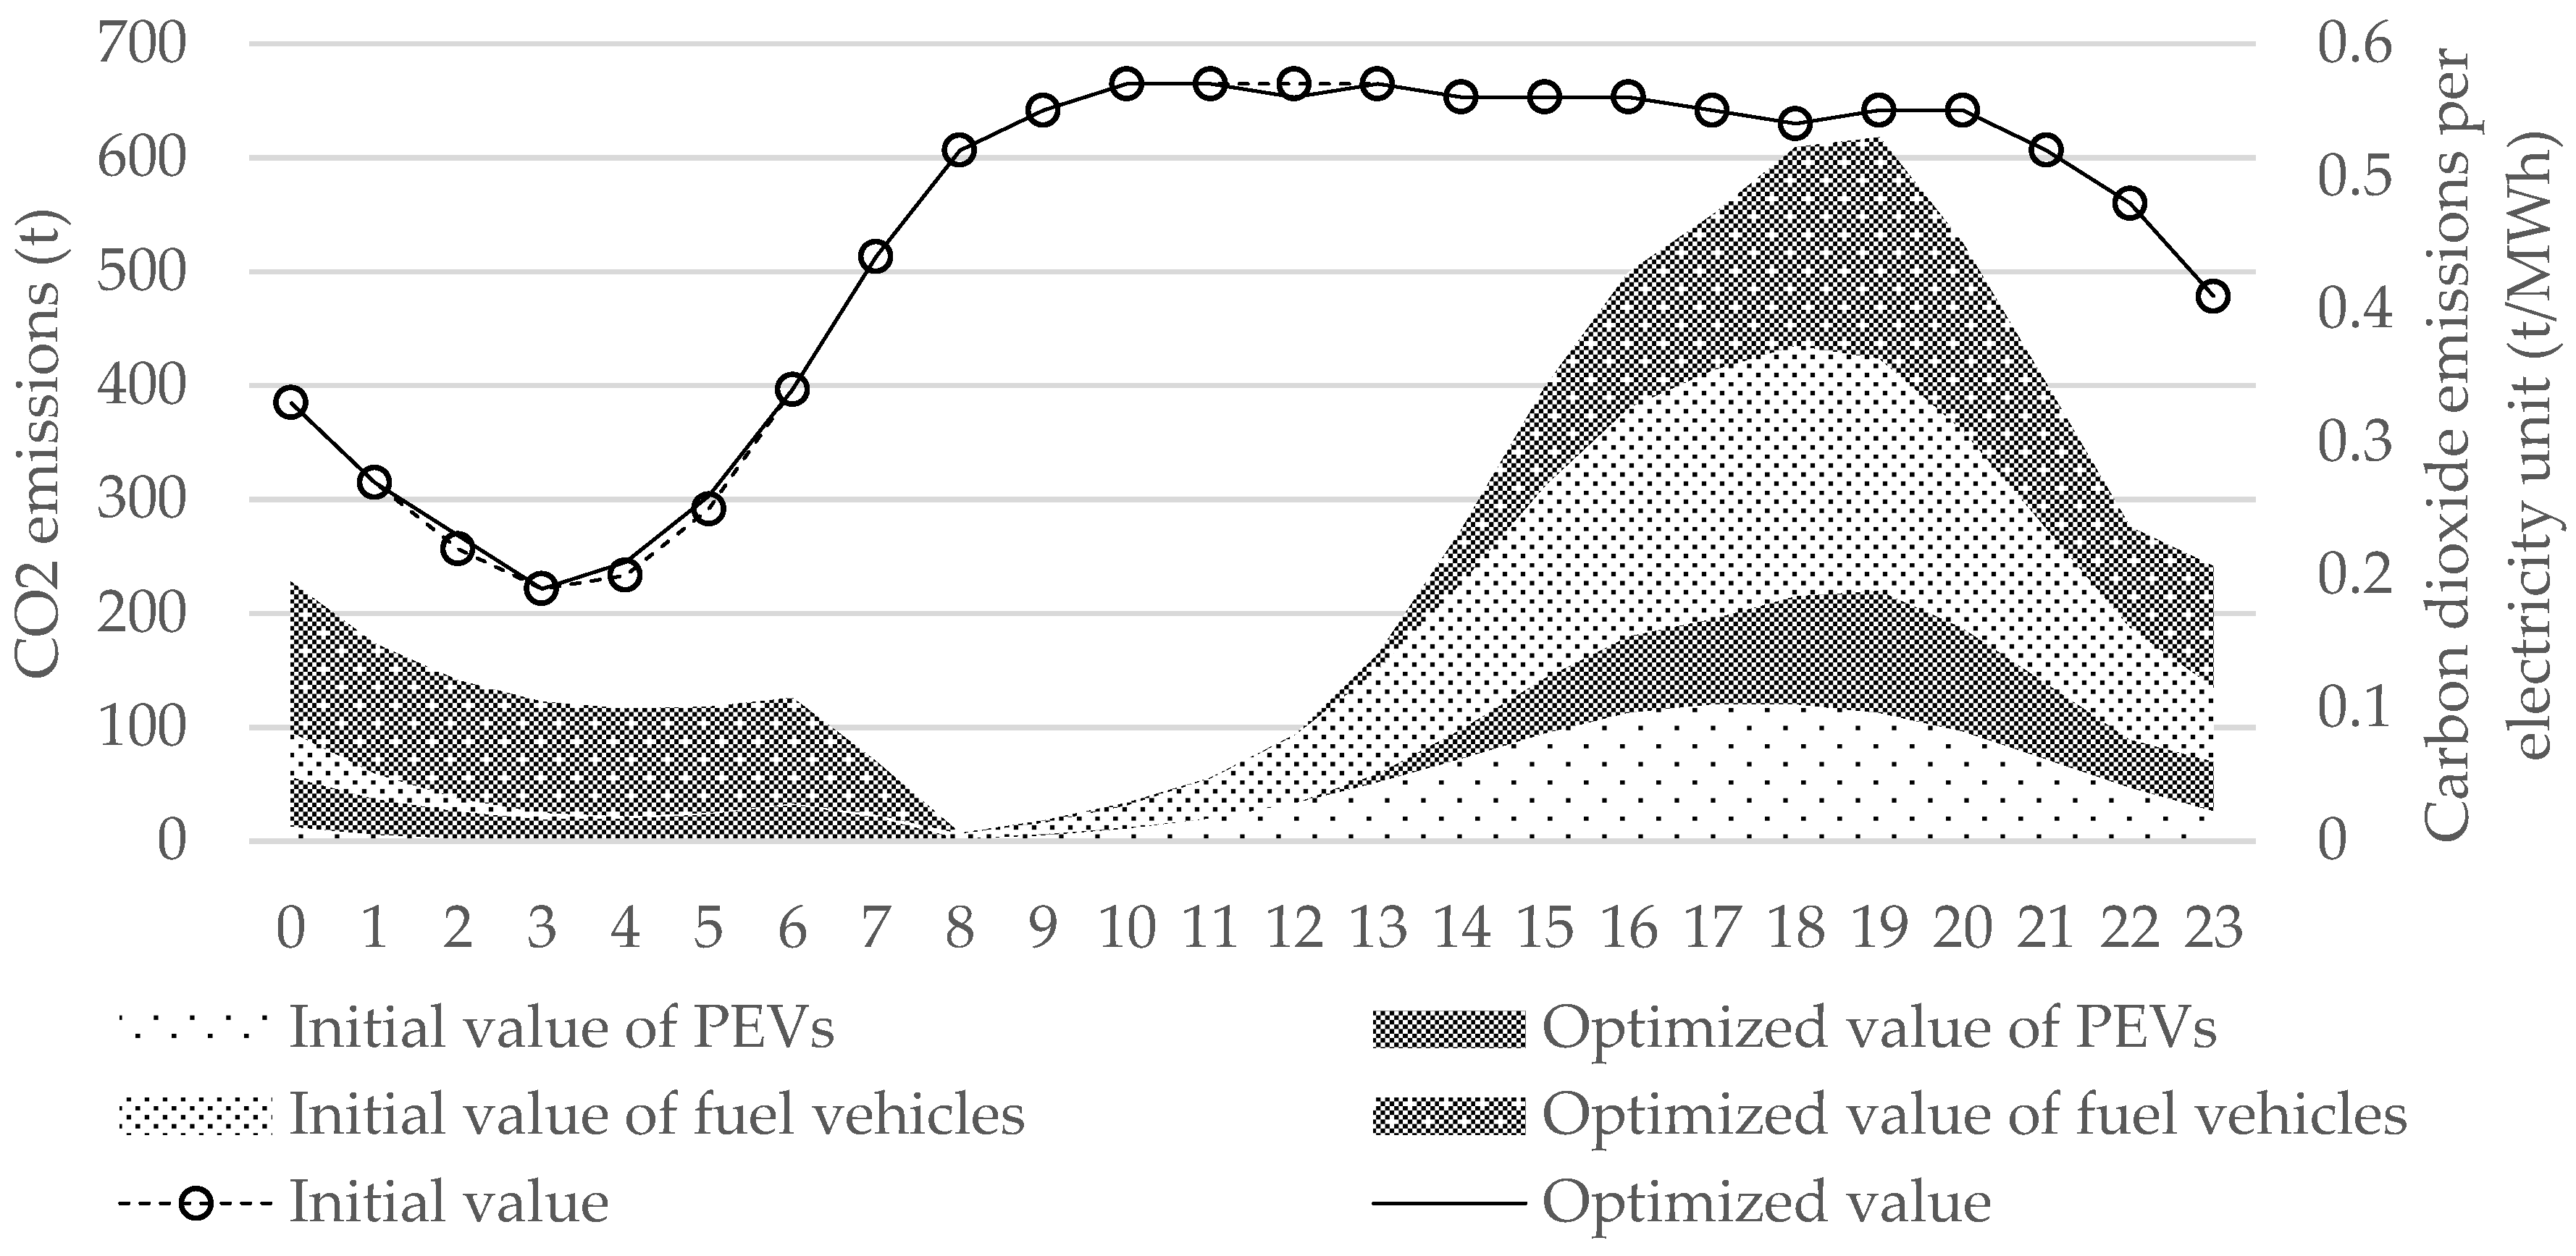
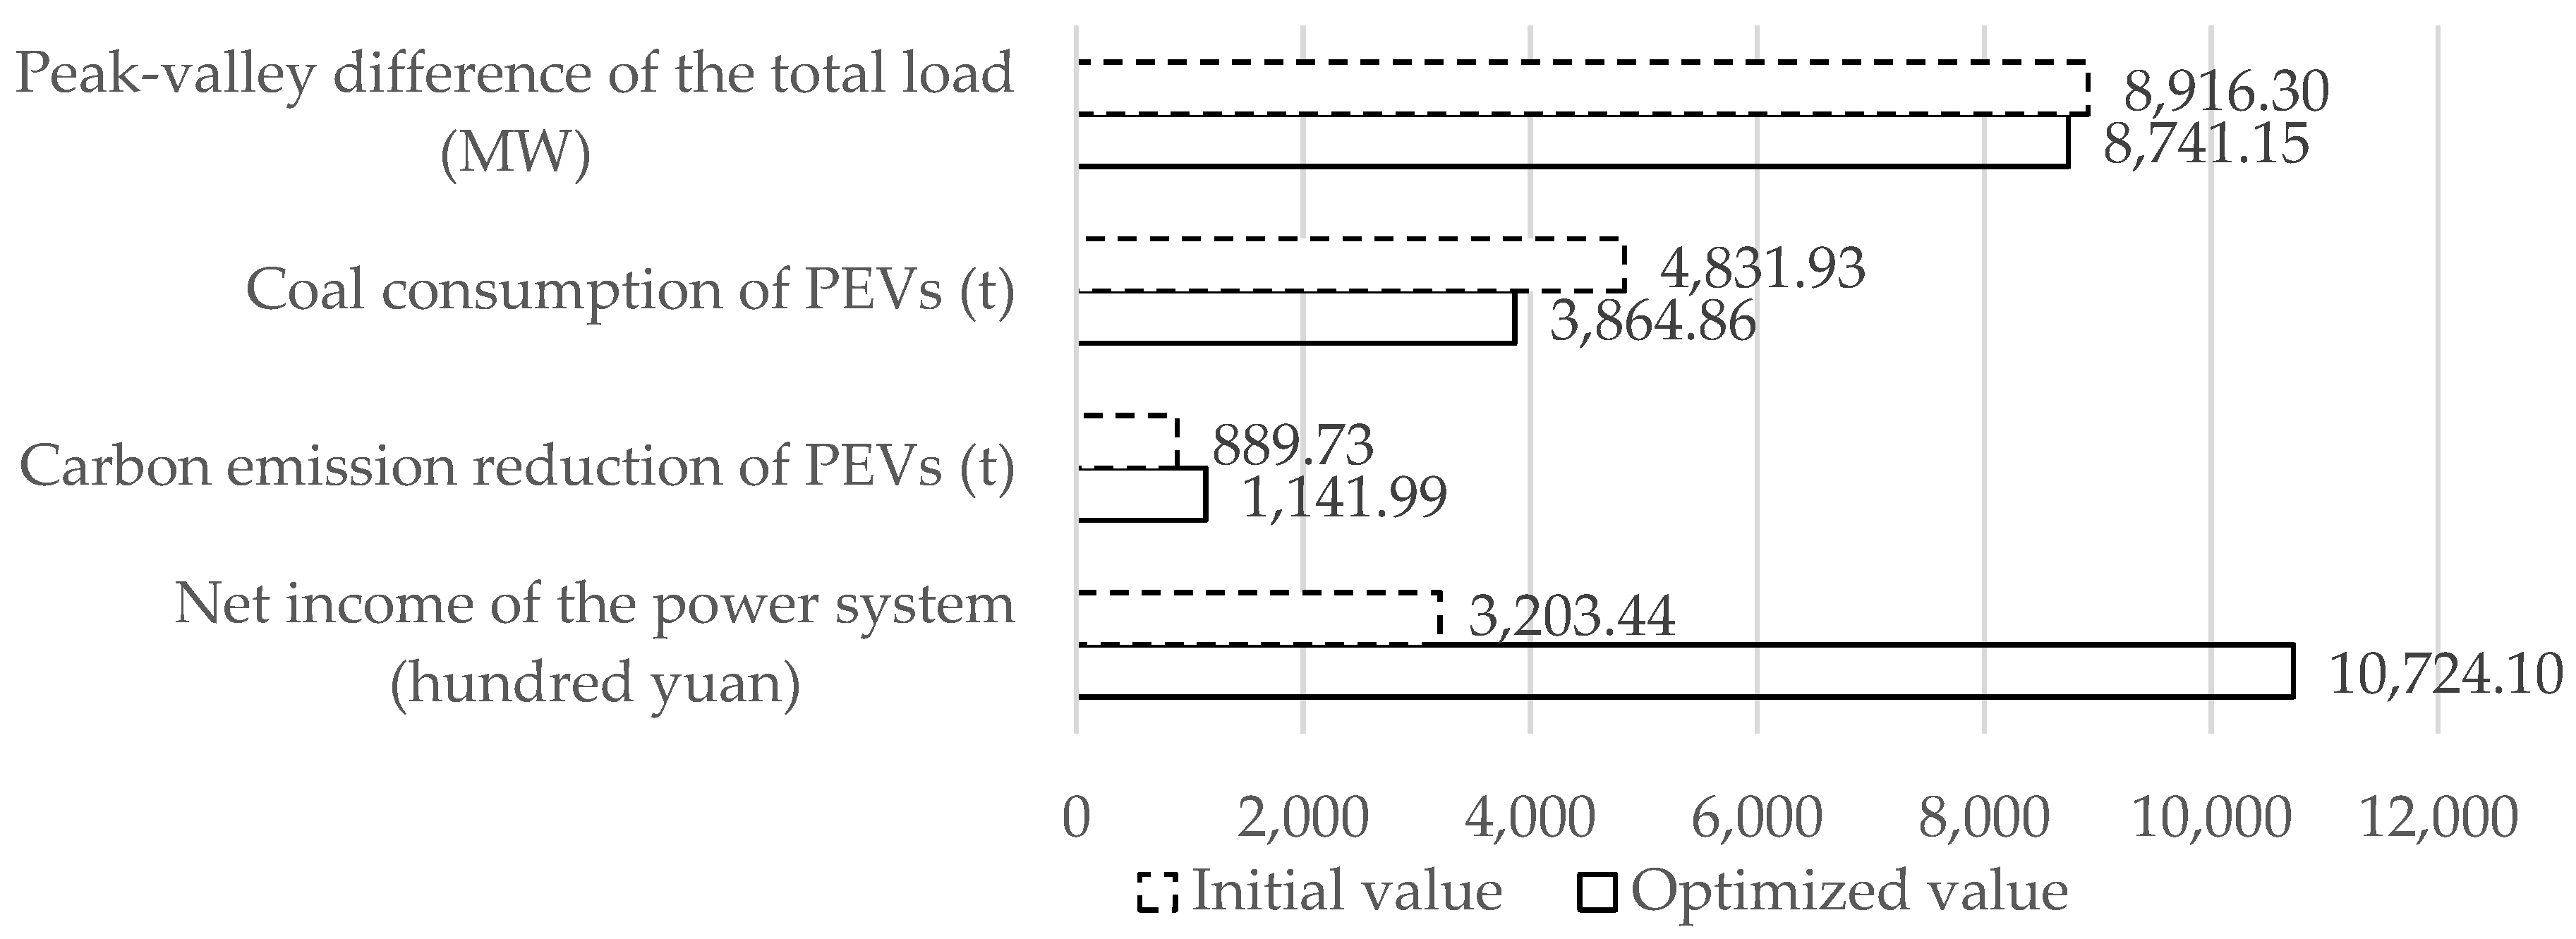
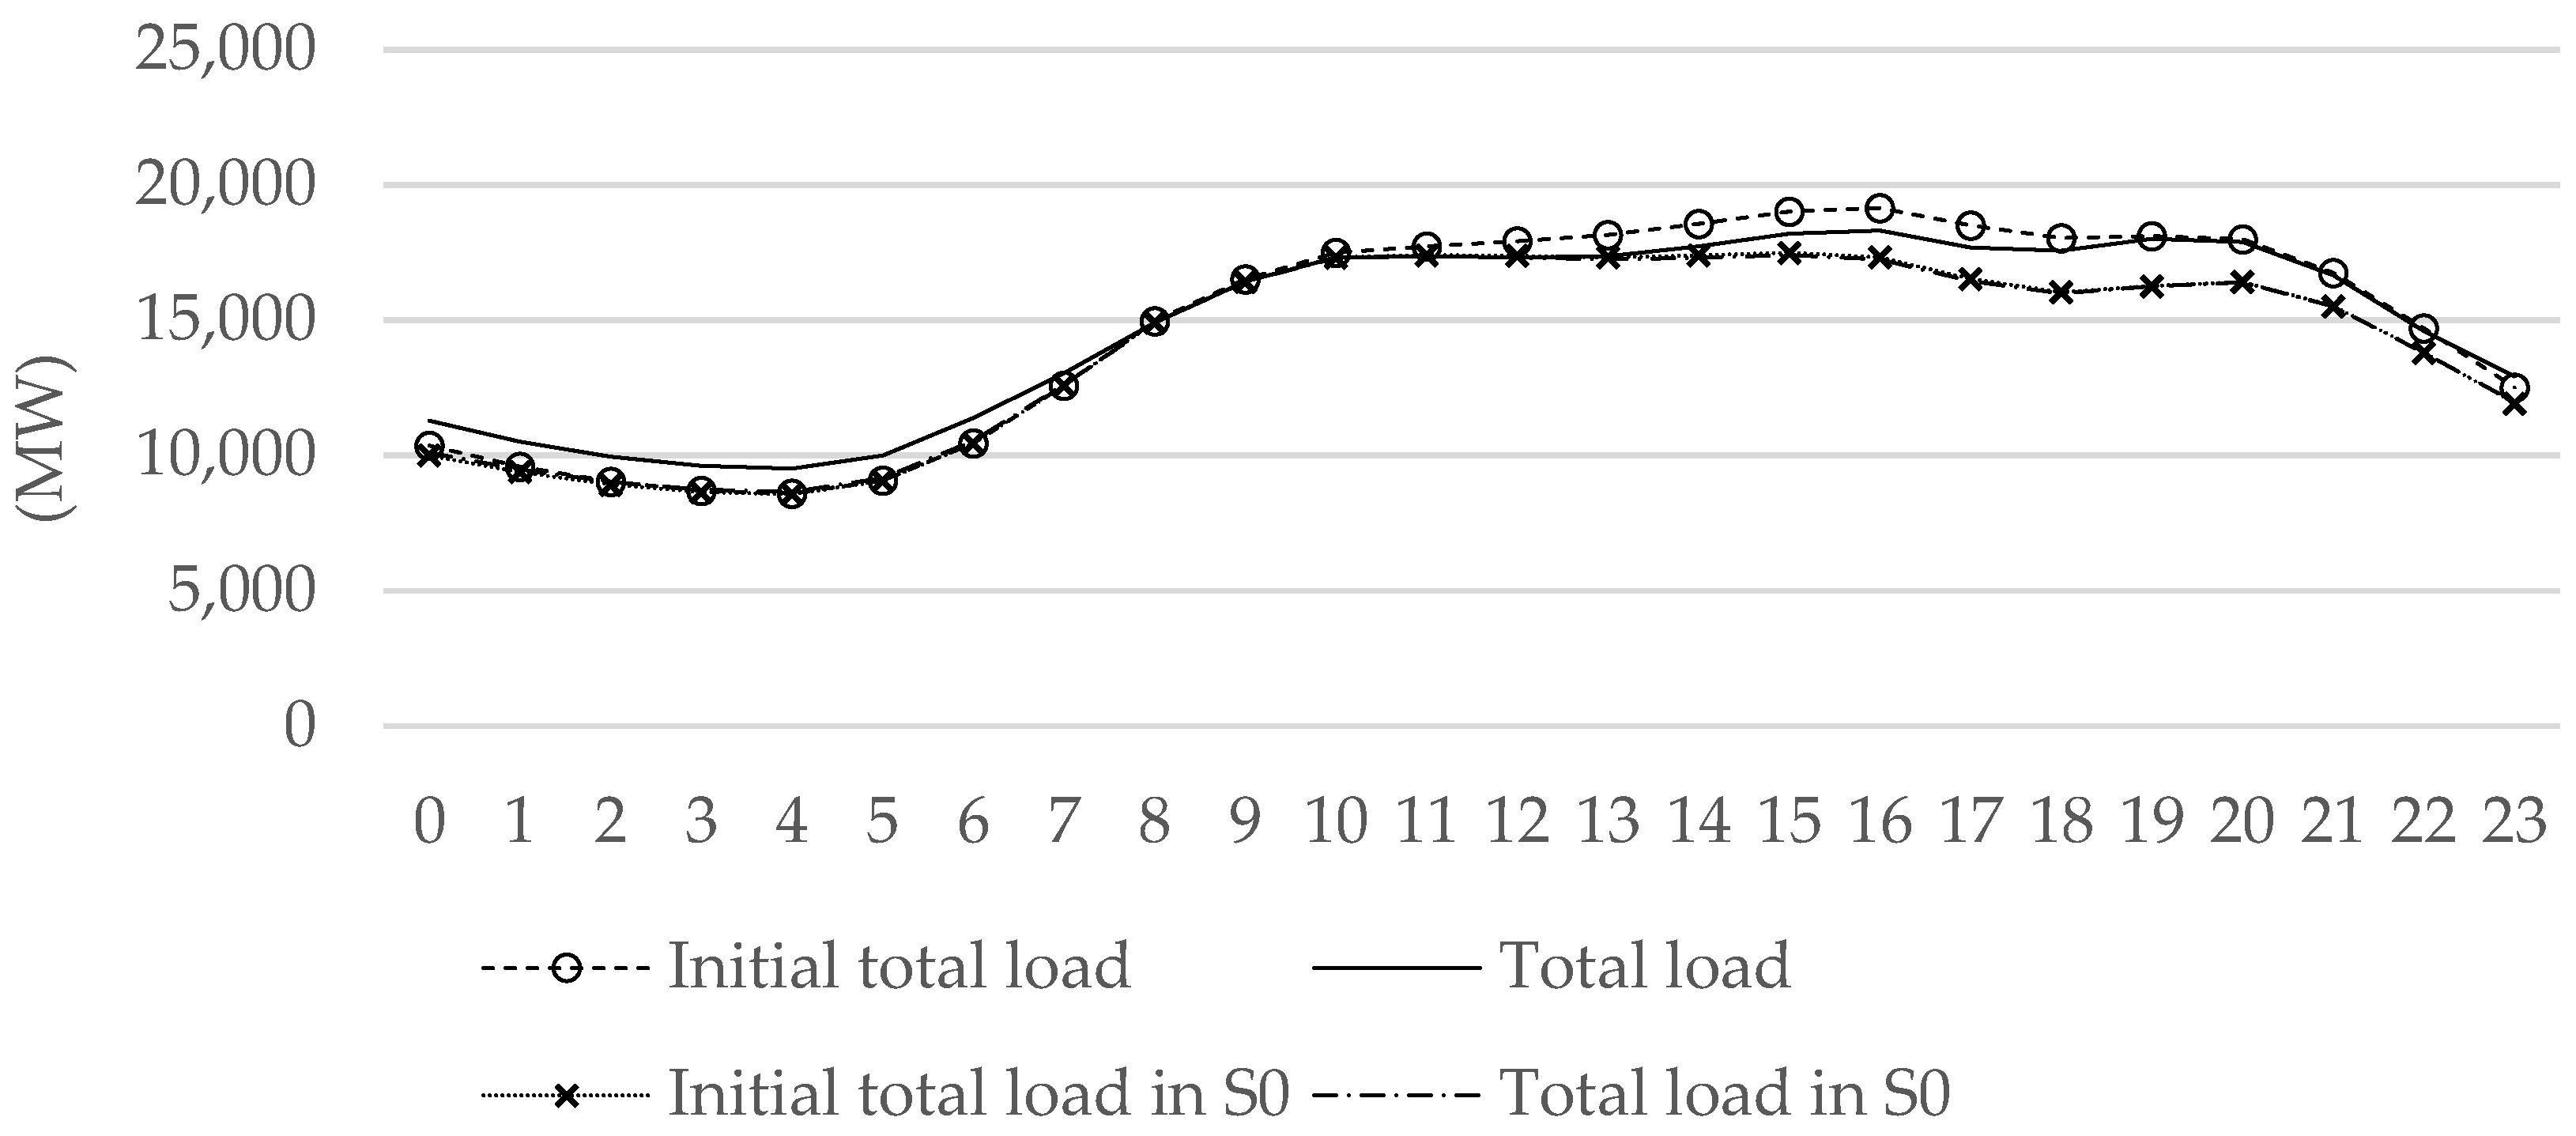
4.2. Optimization Results

In order to effectively achieve the load-shifting effect of PEVs, 24 h are divided into three periods—peak period, average period, and valley period—according to the distribution time of Beijing grid peak, average and valley load in Table 2. Based on the charge pricing model in Section 3, the optimized peak-valley TOU charging price is proposed to minimize the peak-valley difference of the total load in Table 5. It can be seen that the peak and average prices are more than double and quadruple of the valley one, and the valley one is lower than the existing charging price 0.4733 yuan/kWh.
Comparing with the initial PCP load, the black part indicates the increased load of optimized PCP load and the white part indicates the decreased one in Figure 2. It can be seen that the charging load of PCPs transfers from peak and average period to the valley one. Due to the low valley charging price in Table 5, the charging loads of PCPs at 8:00 and 9:00 in average period decrease to 0 MW and 1.78 MW, and the ones at 10:00, 11:00 and 12:00 in peak period reduced to 1.78 MW, 0 MW and 0 MW, respectively. The price difference between peak period and valley period is much more than that between average period and valley period. Thus, the charging load of PCPs from 10:00 to 18:00 decreases much more than that of 7:00–10:00 and 18:00–23:00. Apart from dead zone thresholds and saturated zone thresholds, the determination of user price response is based on price response curve linear region slopes, saturation values of user transfer percentages, and the comparison of the existing charging price in Equations (2)–(4). It means that only the large price difference can not cause a great number of users to change charging behavior. Thus, the decreased charging load of PCPs between 17:00 and 21:00 is still high.
Figure 3 shows that the coal consumption per electricity unit of the valley period is extremely low, and the one between 0:00 and 6:00 is much less than 1.5 t/MWh. While the coal consumption per electricity unit of the peak and average period is particularly high, especially the one between 9:00 and 20:00 which is higher than 2.5 t/MWh. Although the load of PCPs increases during the valley period and decreases during the peak and average period in Figure 2, the increased area of PEV coal consumption during the valley period are much less than the decreased one during the peak and average period in Figure 3. It results in decreasing coal consumption of PEVs in Figure 5.
Figure 4 shows that carbon dioxide emissions per electricity during the valley period are lower than 0.35 t/MWh, while the ones during the peak period are much higher than 0.55 t/MWh. Like coal consumption of EVs in Figure 3, the increased carbon emissions of PEVs during the valley period are much lower than the decreased ones during the peak and average period. Due to TOU stimulation, some users transfer their charging from the average and peak period to the valley one in Figure 2. Moreover, the low valley price has encouraged the more charging of users during the valley period, and make the optimized charging power of PCPs more than the initial one. According to Equations (10) and (18), it can be known that carbon emissions of fuels vehicles will rise in Figure 4. Thus, the decreased carbon emissions of PEVs and the increased carbon emissions of fuels vehicles result in the increased carbon emissions reduction in Figure 5.
Figure 5 shows the initial and optimized values of the total load’s peak-valley difference, PEVs’ coal consumption, PEVs’ carbon emissions reduction, and the power system’s net incomes. The optimized peak-valley difference of the total load reaches a minimum value of 8741.15 MW, which decreases 2% of the initial total load’s peak-valley difference. The coal consumption of PEVs at the power generation side reduces 20%. Carbon emissions reduction at the power generation side increases 28%. Net incomes of the power system that sell to PEV users enhances more than two times. Combining with Figure 3, Figure 4, and Figure 5, it can be known that minimizing the peak-valley difference of the total load is beneficial to reduce the coal consumption and carbon emissions of EV charging energy sources.

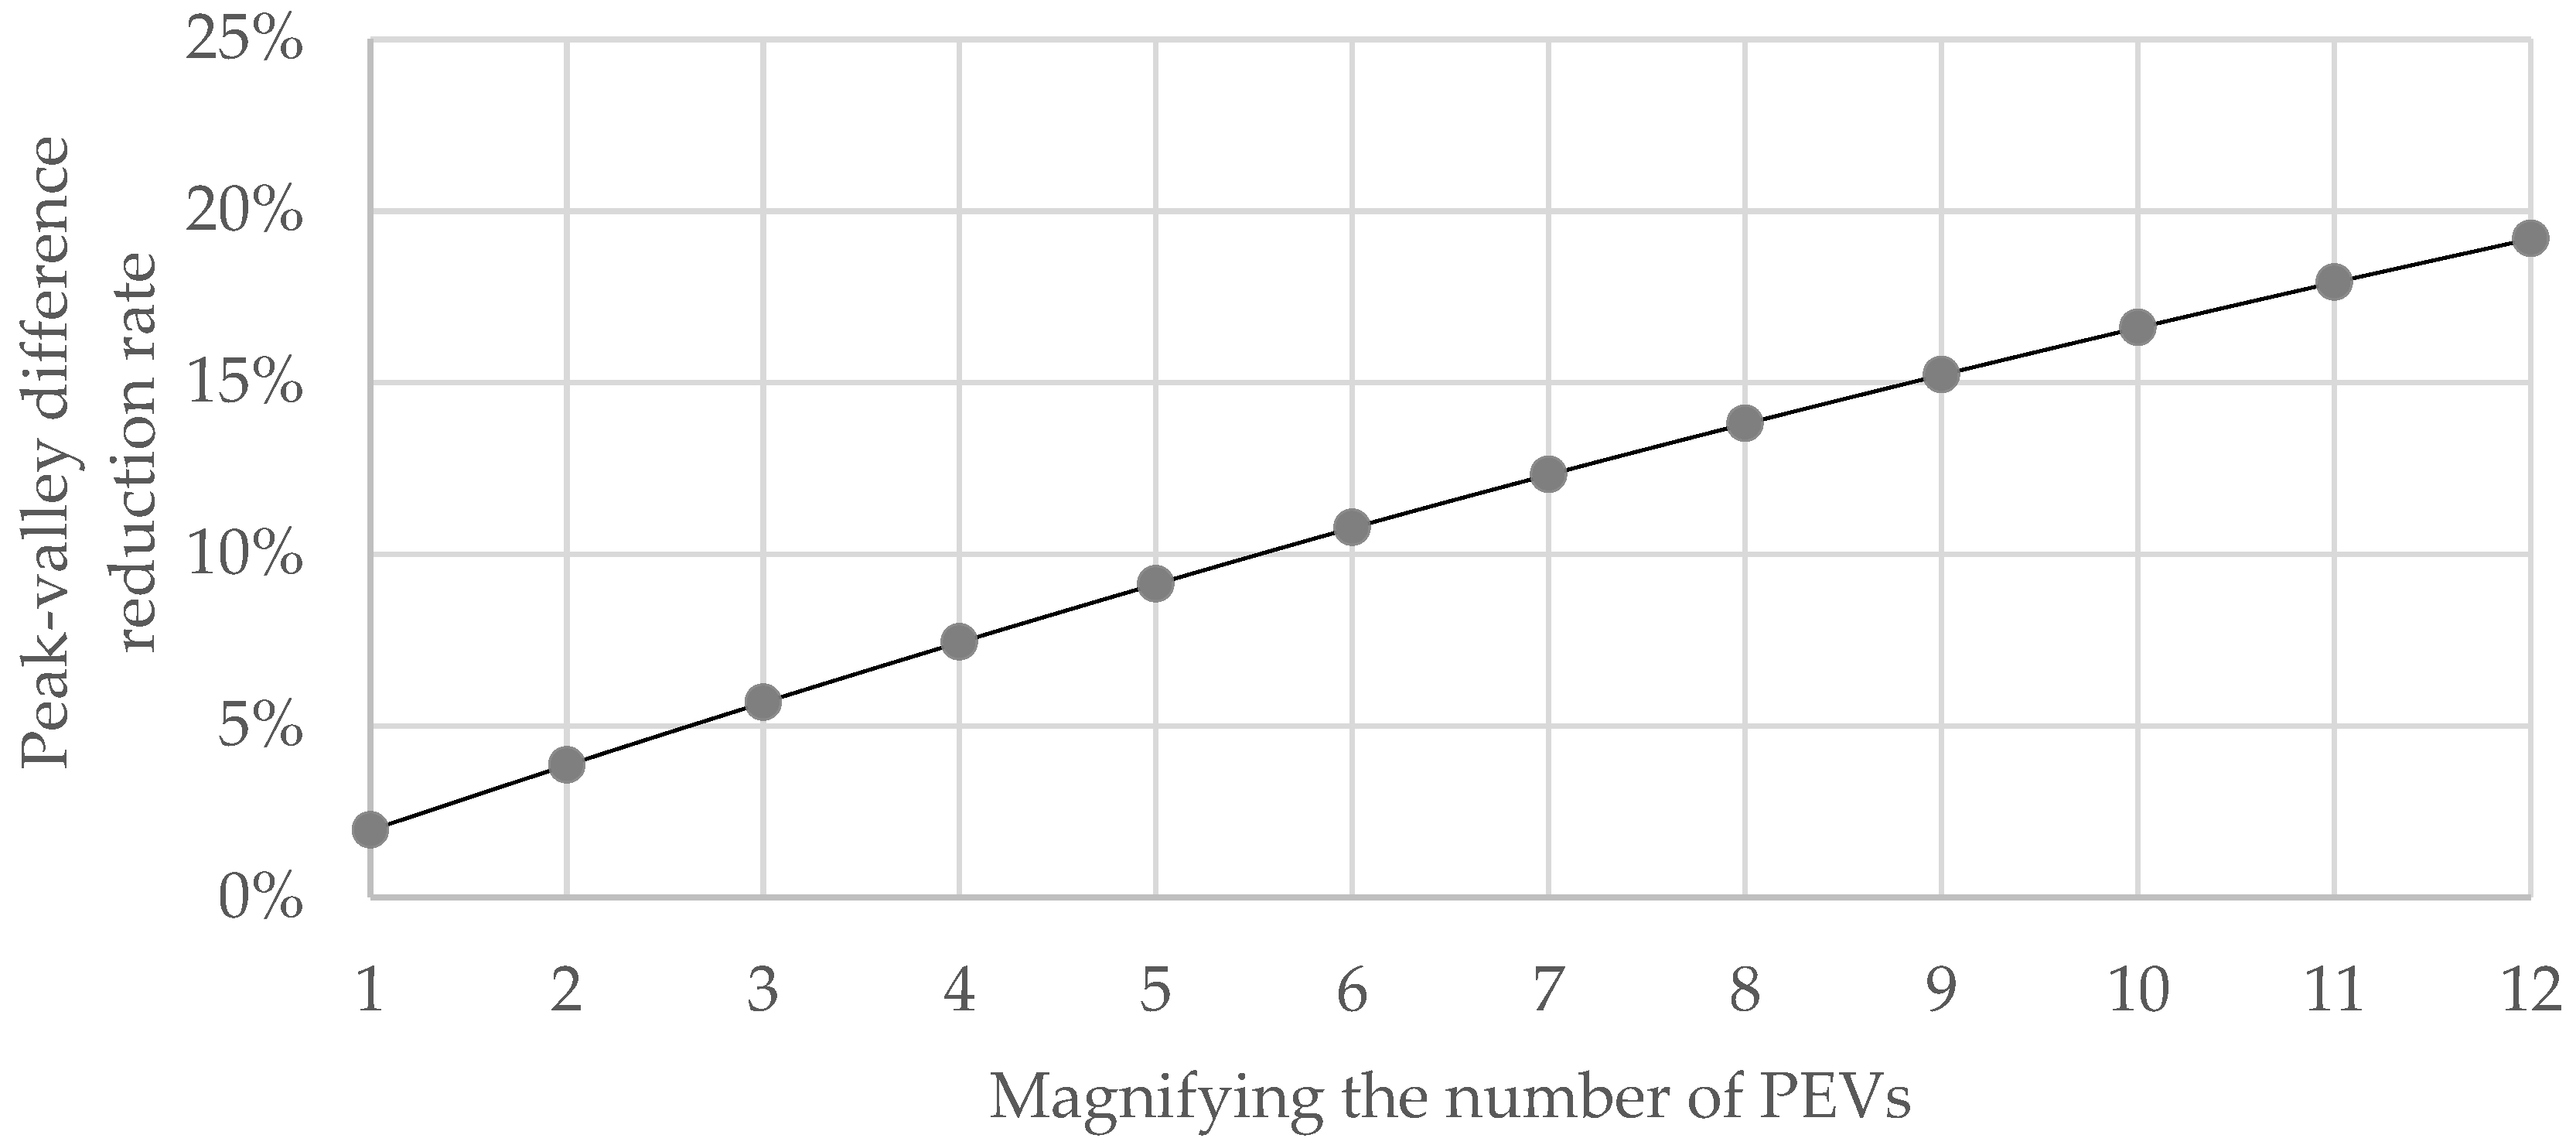
4.3. Sensitivity Analysis

The total number of private vehicles is 4,523,000 [18] in Beijing, which is 12 times more than that of PEVs. Thus, we magnify the number of PEVs from 1 to 12 times to analyze its impact on the peak-valley difference of the total load. The peak-valley difference reduction rate means the decreased peak-valley difference as a proportion of initial peak-valley difference, which can be expressed as:
r = ( ( M A X ( F 0 ( t ) ) M I N ( F 0 ( t ) ) ) ( M A X ( F ( t ) ) M I N ( F ( t ) ) ) ) / ( M A X ( F 0 ( t ) ) M I N ( F 0 ( t ) ) )
In Figure 6, the value of peak-valley difference reduction rate rises with the magnifying number of PEVs, which means that the optimized peak-valley TOU charging price can achieve the load-shifting effect of PCPs. In addition, the load-shifting effect is enhanced with the increasing number of PEVs. When all the private vehicles in Beijing are replaced by PEVs, the peak-valley difference reduction rate will reach 20%.
Figure 7 shows the total load with magnifying the number of PEVs 10-fold. At that time, PEVs’ number will account for 80% of private vehicles. The initial scenario (S0) means the scenario that the initial number of PEVs which is 360,000 [1]. The magnifying number of PEVs will rise the peak load and enlarge the peak-valley difference of the total load. It can be seen that the load-shifting effect of PCPs in S0 is not obvious. However, the proposed charging price displays a better load-shifting effect with the magnifying number of PEVs, which can decrease 16.6% of the total load’s peak-valley difference. It means that the proposed peak-valley TOU charging price can effectively achieve the load-shifting effect of PCPs with the magnifying number of PEVs.

5. Conclusions

To minimize the peak-valley difference of the total load, this paper proposes a peak-valley TOU charge pricing model for PCPs with five constraints including charging price range limit, energy-saving and emission-reduction effects, economic benefit and peak-valley load difference constraints. This model analyzes factors that influence the charge pricing and simulates the charging load of PEVs and price response of users to determine the coal consumption and carbon emissions of PEVs and net incomes of the power system. The charging load of PCPs is predicted according to the charging probability of PCPs and PCP constructing number of Beijing in 2020. The analysis results show that the optimized peak, average and valley charging price in Beijing should be 1.8 yuan/kWh from 10:00 to 17:00, 1 yuan/kWh and 0.4 yuan/kWh from 23:00 to 6:00. The proposed peak-valley TOU charging price can minimize the peak-valley difference of the total load. Moreover, the load-shifting effect of PCPs will be improved with magnifying the number of PEVs. When the proportion of PEVs in total private vehicles numbers reaches 80%, the proposed charging price can decrease 16.6% of the total load’s peak-valley difference. Therefore, the proposed charging price is beneficial for the government to promote the large-scale development of PEVs. The proposed charging price can reduce 20% coal consumption and increase 28% carbon emissions reduction of PEVs at the power generation side. Additionally, it enhances more than 2 times net incomes from PEV electricity sales of the power system.

Acknowledgments

The authors would like to thank the anonymous referees and the editor of this journal. The authors also gratefully acknowledge the financial support of the National Natural Science Foundation of China (Grant No. 71473083), the Major Program of the National Social Science Fund of China (Grant No. 15ZDB165), and the Fundamental Research Funds for the Central Universities (2016XS86).

Author Contributions

In this paper, Yakun Zhang sorted out the studies on charge pricing in Section 1; Yanni Liang analyzed the factors that influence the charge pricing, designed the charge pricing model for PCPs, and wrote Section 1, Section 2, and Section 3; Xingping Zhang analyzed the results of the optimization model and sensitivity analysis, drew the conclusions for this paper, and wrote Section 4 and Section 5; Yinhe Bo and Hongyang Zhang collected the related data and basic parameters for the charge pricing model in Section 4.

Conflicts of Interest

The authors declare no conflict of interest.

References

  1. Finn, P.; Fitzpatrick, C.; Connolly, D. Demand side management of electric car charging: Benefits for consumer and grid. Energy 2012, 42, 358–363. [Google Scholar] [CrossRef]
  2. Anderson, E. Real-time pricing for charging electric vehicles. Electr. J. 2014, 27, 105–111. [Google Scholar] [CrossRef]
  3. Lv, M. Research on TOU Price Considering Electric Vehicles Charging and Discharging. Master’s Thesis, North China Electric Power University, Beijing, China, 2014. [Google Scholar]
  4. Zhang, K.; Xu, L.; Ouyang, M.; Wang, H.; Lu, L.; Li, J.; Zhe, L. Optimal decentralized valley-filling charging strategy for electric vehicles. Energy Convers. Manag. 2014, 78, 537–550. [Google Scholar] [CrossRef]
  5. Yu, H.; Huang, C.; Zhang, L.; Zhao, W. Coordinated charge and discharge control strategy based on time-of-use price from electric vehicle customer side. Electr. Power 2014, 47, 95–98. [Google Scholar]
  6. Zhang, L.; Li, Y. Regime-switching based vehicle-to-building operation against electricity price spikes. Energy Econ. 2017, 66, 1–8. [Google Scholar] [CrossRef]
  7. Ge, S.; Wang, L.; Liu, H.; Peng, L.; Huang, L.; Zhu, T. An optimization model of peak-valley price time-interval considering vehicle-to-grid. Power Syst. Technol. 2013, 37, 2316–2321. [Google Scholar]
  8. Xiang, D.; Song, Y.; Hu, Z.; Xu, Z. Research on optimal time of use price for electric vehicle participating V2G. Proc. CSEE 2013, 33, 15–25. [Google Scholar]
  9. Dai, S.; Lei, X.; Cheng, D.; Ye, T.; Yang, Y. Study on electric vehicle charging and discharging TOU price. Power Syst. Clean Energy 2013, 29, 77–82. [Google Scholar]
  10. Xu, Z.; Hu, Z.; Song, Y.; Zhang, H.; Chen, X. Coordinated charging strategy for PEV charging stations based on dynamic time-of-use tariffs. Proc. CSEE 2014, 34, 3638–3646. [Google Scholar]
  11. Dufo-López, R.; Bernal-Agustín, J.L. Techno-economic analysis of grid-connected battery storage. Energy Convers. Manag. 2015, 91, 394–404. [Google Scholar] [CrossRef]
  12. Hua, Z.; Zhan, K.; Zhang, H.; Song, Y. Pricing mechanisms design for guiding electric vehicle charging to fill load valley. Appl. Energy 2016, 178, 155–163. [Google Scholar] [CrossRef]
  13. Deng, C.; Liang, N.; Tan, J.; Wang, G. Multi-objective scheduling of electric vehicles in smart distribution network. Sustainability 2016, 8, 1234. [Google Scholar] [CrossRef]
  14. Dallinger, D.; Wietschel, M. Grid integration of intermittent renewable energy sources using price-responsive plug-in electric vehicles. Renew. Sustain. Energy Rev. 2012, 16, 3370–3382. [Google Scholar] [CrossRef]
  15. Foley, A.; Tyther, B.; Calnan, P.; Gallachóir, B.Ó. Impacts of electric vehicle charging under electricity market operations. Appl. Energy 2013, 101, 93–102. [Google Scholar] [CrossRef]
  16. Zhang, Q.; Mclellan, B.C.; Tezuka, T.; Ishihara, K.N. A methodology for economic and environmental analysis of electric vehicles with different operational conditions. Energy 2013, 61, 118–127. [Google Scholar] [CrossRef]
  17. Yu, L.; Li, Y.P.; Huang, G.H.; An, C.J. A robust flexible-probabilistic programming method for planning municipal energy system with considering peak-electricity price and electric vehicle. Energy Convers. Manag. 2017, 137, 97–112. [Google Scholar] [CrossRef]
  18. Langbroek, J.H.M.; Franklina, J.P.; Susilo, Y.O. When do you charge your electric vehicle? A stated adaptation approach. Energy Policy 2017, 108, 565–573. [Google Scholar] [CrossRef]
  19. Liang, Y.; Zhang, X.; Xie, J.; Liu, W. An optimal operation model and ordered charging/discharging strategy for battery swapping stations. Sustainability 2017, 9, 700. [Google Scholar] [CrossRef]
  20. Shang, D.R.; Sun, G. Electricity-price arbitragewithplug-inhybridelectricvehicle: Gain or loss. Energy Policy 2016, 95, 402–410. [Google Scholar] [CrossRef]
  21. The Window of the Capital Notice on the Special Plan of Electric Vehicle Charging Infrastructure (2016–2020). Available online: http://zhengwu.beijing.gov.cn/ghxx/qtgh/t1433110.htm (accessed on 6 April 2017).
  22. Chang, F.; Huang, M.; Zhang, W. Research on coordinated charging of electric vehicles based on TOU charging price. Power Syst. Technol. 2016, 40, 2609–2615. [Google Scholar]
  23. Su, H.; Liang, Z. Orderly charging control based on pea-valley electricity tariffs for household electric vehicles of residential quarter. Electr. Power Autom. Equip. 2015, 35, 17–22. [Google Scholar]
  24. Geng, X. 4440 Charging Piles Perform Peak-Valley Charging Price. Leg. Evening News 4. Available online: http://dzb.fawan.com/html/2016-06/14/content_603952.htm (accessed on 5 September 2017).
  25. Beijing Transportation Development Research Institute Beijing Transportation Development Annual Report of 2016. Available online: http://www.bjtrc.org.cn/JGJS.aspx?id=5.2&Menu=GZCG (accessed on 8 April 2017).
  26. Zhang, X.; Liang, Y.; Liu, W. Pricing model for the charging of electric vehicles based on system dynamics in Beijing. Energy 2017, 119, 218–234. [Google Scholar] [CrossRef]
  27. Song, Y. Research on Inter-Regional Allocation Optimization Model of Electric Power Resource in China. Ph.D. Thesis, North China Electric Power University, Beijing, China, 2014. [Google Scholar]
  28. Ji, S.; Chen, B.; Li, S. Carbon emission accounting for wind farm based on life cycle assessment. Acta Ecol. Sin. 2016, 36, 915–923. [Google Scholar]
  29. Xia, D. The Rsearch on Life Cycle Carbon Emissions Measurement of Electric Power Generation Side Based on the Scenario Analysis Method. Master’s Thesis, Chongqing University, Chongqing, China, 2010. [Google Scholar]
  30. Baidu Baike. The Hydropower Station Guarantees the Force. Available online: https://baike.baidu.com/item/%E6%B0%B4%E7%94%B5%E7%AB%99%E4%BF%9D%E8%AF%81%E5%87%BA%E5%8A%9B/4667120?fr=aladdin (accessed on 15 September 2017).
  31. National Energy Board Energy-Saving Power Generation Dispatching Approach. Available online: http://www.nea.gov.cn/2007-08/28/c_131053158.htm (accessed on 8 April 2017).
  32. Lu, X. Development of Nuclear Power with Data Evidence. Available online: http://www.chinatimes.com/cn/newspapers/20130528000512-260109 (accessed on 11 April 2017).
  33. Zhang, X.; Rao, R.; Feng, Y. Analysis on charging behavior of electric taxis and comparative research of the comprehensive benefits in multi-Region. Electr. Power 2016, 49, 141–147. [Google Scholar]
Figure 1. Design flow chart of the charge pricing model.
Sustainability 09 02075 g001
Figure 2. Load of PCPs.
Sustainability 09 02075 g002
Figure 3. Coal consumption of PEVs.
Sustainability 09 02075 g003
Figure 4. Carbon emissions of PEVs and fuel vehicles.
Sustainability 09 02075 g004
Figure 5. Optimized results of the charge pricing model.
Sustainability 09 02075 g005
Figure 6. Peak-valley difference reduction rate with magnifying PEVs’ number.
Sustainability 09 02075 g006
Figure 7. Total load with magnifying 10 times PEVs’ number.
Sustainability 09 02075 g007
Table 1. Travel final return probability of PEVs.
TimeProbabilityTimeProbability
00.0151120.0383
10.0080130.0568
20.0039140.0774
30.0017150.0987
40.0007160.1110
50.0003170.1169
60.0006180.1129
70.0015190.1001
80.0033200.0815
90.0070210.0608
100.0134220.0417
110.0237230.0262
Table 2. Conventional load of Beijing grid.
TimeLoad (MW)TimeLoad (MW)
09962.861217,322.84
19369.531317,228.38
28919.591417,261.56
38643.241517,316.02
48567.241617,118.31
59066.061716,306.82
610,450.951815,813.80
712,571.511916,056.32
814,914.152016,239.37
916,413.022115,380.58
1017,297.232213,709.11
1117,366.192311,860.02
Table 3. Schedule of generation sets.
Wind PowerHydroelectric PowerNuclear PowerCoal Power
Installed capacity (MW)20004000300010,000
Generation costs (yuan/MWh)24812080270
Generation carbon emissions (t/MWh)0.298 a0.1733 b0.00675 b0.86252 b
a The data were derived from the research of Ji et al. [29]; b The data were from the master graduation thesis of Xia [30].
Table 4. Utilization rate of wind power.
TimeUtilization RateTimeUtilization Rate
00.41120.23
10.59130.16
20.71140.28
30.84150.35
40.69160.29
50.57170.25
60.49180.18
70.41190.16
80.22200.18
90.15210.29
100.09220.36
110.22230.46
Table 5. Optimized peak-valley TOU charging price.
Period DivisionPrice (yuan/kWh)
Peak period10:00–18:001.8
Average period7:00–10:00, 18:00–23:001
Valley period23:00–7:000.4

