Article

Assessing Urban Sustainability Using a Multi-Scale, Theme-Based Indicator Framework: A Case Study of the Yangtze River Delta Region, China

1
Guangdong Key Laboratory of Integrated Agro-environmental Pollution Control and Management, Guangdong Institute of Eco-environmental Science and Technology, Guangzhou 510650, China
2
School of Ecological and Environmental Sciences, East China Normal University, Shanghai 200241, China
3
Shanghai Key Laboratory of Urbanization and Ecological Restoration, Shanghai 200241, China
*
Author to whom correspondence should be addressed.
Sustainability 2017, 9(11), 2072; https://doi.org/10.3390/su9112072
Submission received: 11 October 2017 / Revised: 2 November 2017 / Accepted: 6 November 2017 / Published: 10 November 2017

Abstract

:
Urban sustainability is a great concern worldwide. However, how to evaluate urban sustainability is still a big challenge because sustainable development is multifaceted and scale dependent, which demands various assessment methods and indicators that often do not reach a consensus. In this study, we assessed urban sustainability of the Yangtze River Delta (YRD), China during 2000–2014 at two spatial scales (corresponding to the administrative levels of province and prefecture). A theme-based indicator framework, cluster analysis and Mann–Kendall test were used for urban sustainability assessment. Our results showed that the overall (OS), social (SS), and economic sustainability (EcS) scores for two provinces and sixteen prefectural cities increased from 2000 to 2014 in general, but the environmental sustainability (EnS) scores decreased over time. According to the performance of SS, EnS and EcS at the prefectural level, three distinct city clusters were identified: Cluster 1 with high SS and EcS but low EnS; Cluster 2 with low SS and EcS but high EnS; and Cluster 3 with moderate SS, EnS and EcS. The three sustainability dimensions—society, environment and economy—all changed over time and differed among cities at the two administrative levels. Our results implied that, according to the “strong sustainability” perspective, the cities of the YRD became less sustainable or unsustainable because the social and economic progresses were at the expense of the environment. The level of urban sustainability was lower at the provincial level than the prefectural level, implying that the problems of unsustainability are even greater at the provincial level than the prefectural level in the YRD region.

1. Introduction

The world’s population has been growing exponentially since the industrial revolution of the late 18th century, and this trend will continue for at least several decades, especially in developing countries [1,2,3]. By 2050, it is projected that about 64% of the developing countries’ people will live in urban areas [2], and this number will be 77.5% for China [4]. The rapid urbanization has caused a series of environmental and socioeconomic problems globally [4,5,6] and led to more concerns about urban sustainability in both political and scientific arena [3,7,8,9].
It is difficult to specifically define sustainability (i.e., sustainable development) let alone urban sustainability due to different development trajectories and policy of different countries and complex interactions between the multiple components [10]. A popular but vague definition of sustainable development was proposed by the Brundtland Report for the first time [11]: “the development that meets the needs of the present without compromising the ability of future generations to meet their needs”. Based on whether natural capital can be substituted by human-made capital, two contrasting perspectives of sustainability are identified in the literature [9]: “weak sustainability” (allowing for substitutability) and “strong sustainability” (not allowing for or setting a limit to substitutability). Following either of these two views, numerous definitions of urban sustainability have been proposed [3,8,12]. Most of them are related to the Brundtland definition of sustainability, as the concept of urban sustainability often emphasizes the balance among the environmental, economic, and social dimensions of a city or an urban region. In particular, Wu [3] defined urban sustainability as follows:
“Urban sustainability may refer to a set of dynamic conditions that satisfy the needs of current and future generations in an urban area, but it is more fundamentally an ongoing adaptive process of achieving and maintaining those conditions. Urban sustainability is defined as an adaptive process of facilitating and maintaining a virtuous cycle between ecosystem services and human well-being through concerted ecological, economic, and social actions in response to changes within and beyond the urban landscape”.
(pp. 212–213)
In this study, we adopt this definition of urban sustainability by Wu [3], and explicitly recognize the three dimensions of sustainability with a strong sustainability perspective.
Having emerged as a new transdisciplinary scientific enterprise since the late 20th century, sustainability science focuses on the dynamic relationship between society and nature through placed-based research, monitoring, and assessment [9,13,14,15]. Assessing the state and progress of sustainable development is an essential part of sustainability science, and a number of methods for sustainability assessment have been developed based on different theoretical frameworks and research objectives, among which the sustainability indicators-based approach has been most widely used [12,16,17,18]. The main reasons for the popularity of sustainability indicators include their simplicity in math, ease in analysis, and effectiveness in communication with decision-makers and other stakeholders [8,12,16,19,20].
A sustainability indicator is usually a mathematical representation of a certain property of human–environmental systems, which is relevant to the overall performance and health of the system [8,18]. An indicator framework (“a conceptual structure facilitating the selection, development and interpretation of indicators”) is often used to guide the construction and application of sustainability indicators [18]. Several indicator frameworks for sustainable development assessment have been developed by academics, governmental agencies, and international organizations such as the United Nations. Wu and Wu [18] recognized five commonly used indicator frameworks: (1) the pressure-state-response (PSR) framework; (2) the theme-based framework; (3) the capital-based framework; (4) the integrated accounting framework; and (5) Bossel’s orientor framework. Among these indicator sets, the theme-based indicator framework has a flexible conceptual structure that organizes indicators hierarchically along environmental, economic, social, and institutional dimensions of sustainable development [2,18]. In this study, we adopted the well-established theme-based indicator framework adopted by United Nations Commission on Sustainable Development (UNCSD) [21] for urban sustainability assessment.
The Yangtze River Delta (YRD) is one of the most urbanized and economically developed regions of China. During the past few decades, concerns about urban sustainability have been growing due to the rapid urbanization and associated environmental problems. A number of recent studies have examined various environmental and socioeconomic effects of urbanization [22,23,24] and urban sustainability trend of cities in this region [8], however, as Bell and Morse [25] argued that three key questions, i.e., the meaning of sustainability, and the spatial and temporal scales of the sustainability to be achieved, should be considered when measuring sustainability. In this term, few have systematically evaluated its overall sustainability on multiple spatial scales. Thus, this study was designed to assess the urban sustainability of the YRD region from environmental, economic, and social dimensions on two spatial scales corresponding to the administrative levels of province and prefecture, respectively. Specially, this study had two main objectives: (1) to evaluate urban sustainability of the YRD using the theme-based indicator framework; and (2) to quantify how the different sustainability dimensions differ on different spatial scales and change over time in the YRD region.

2. Materials and Methods
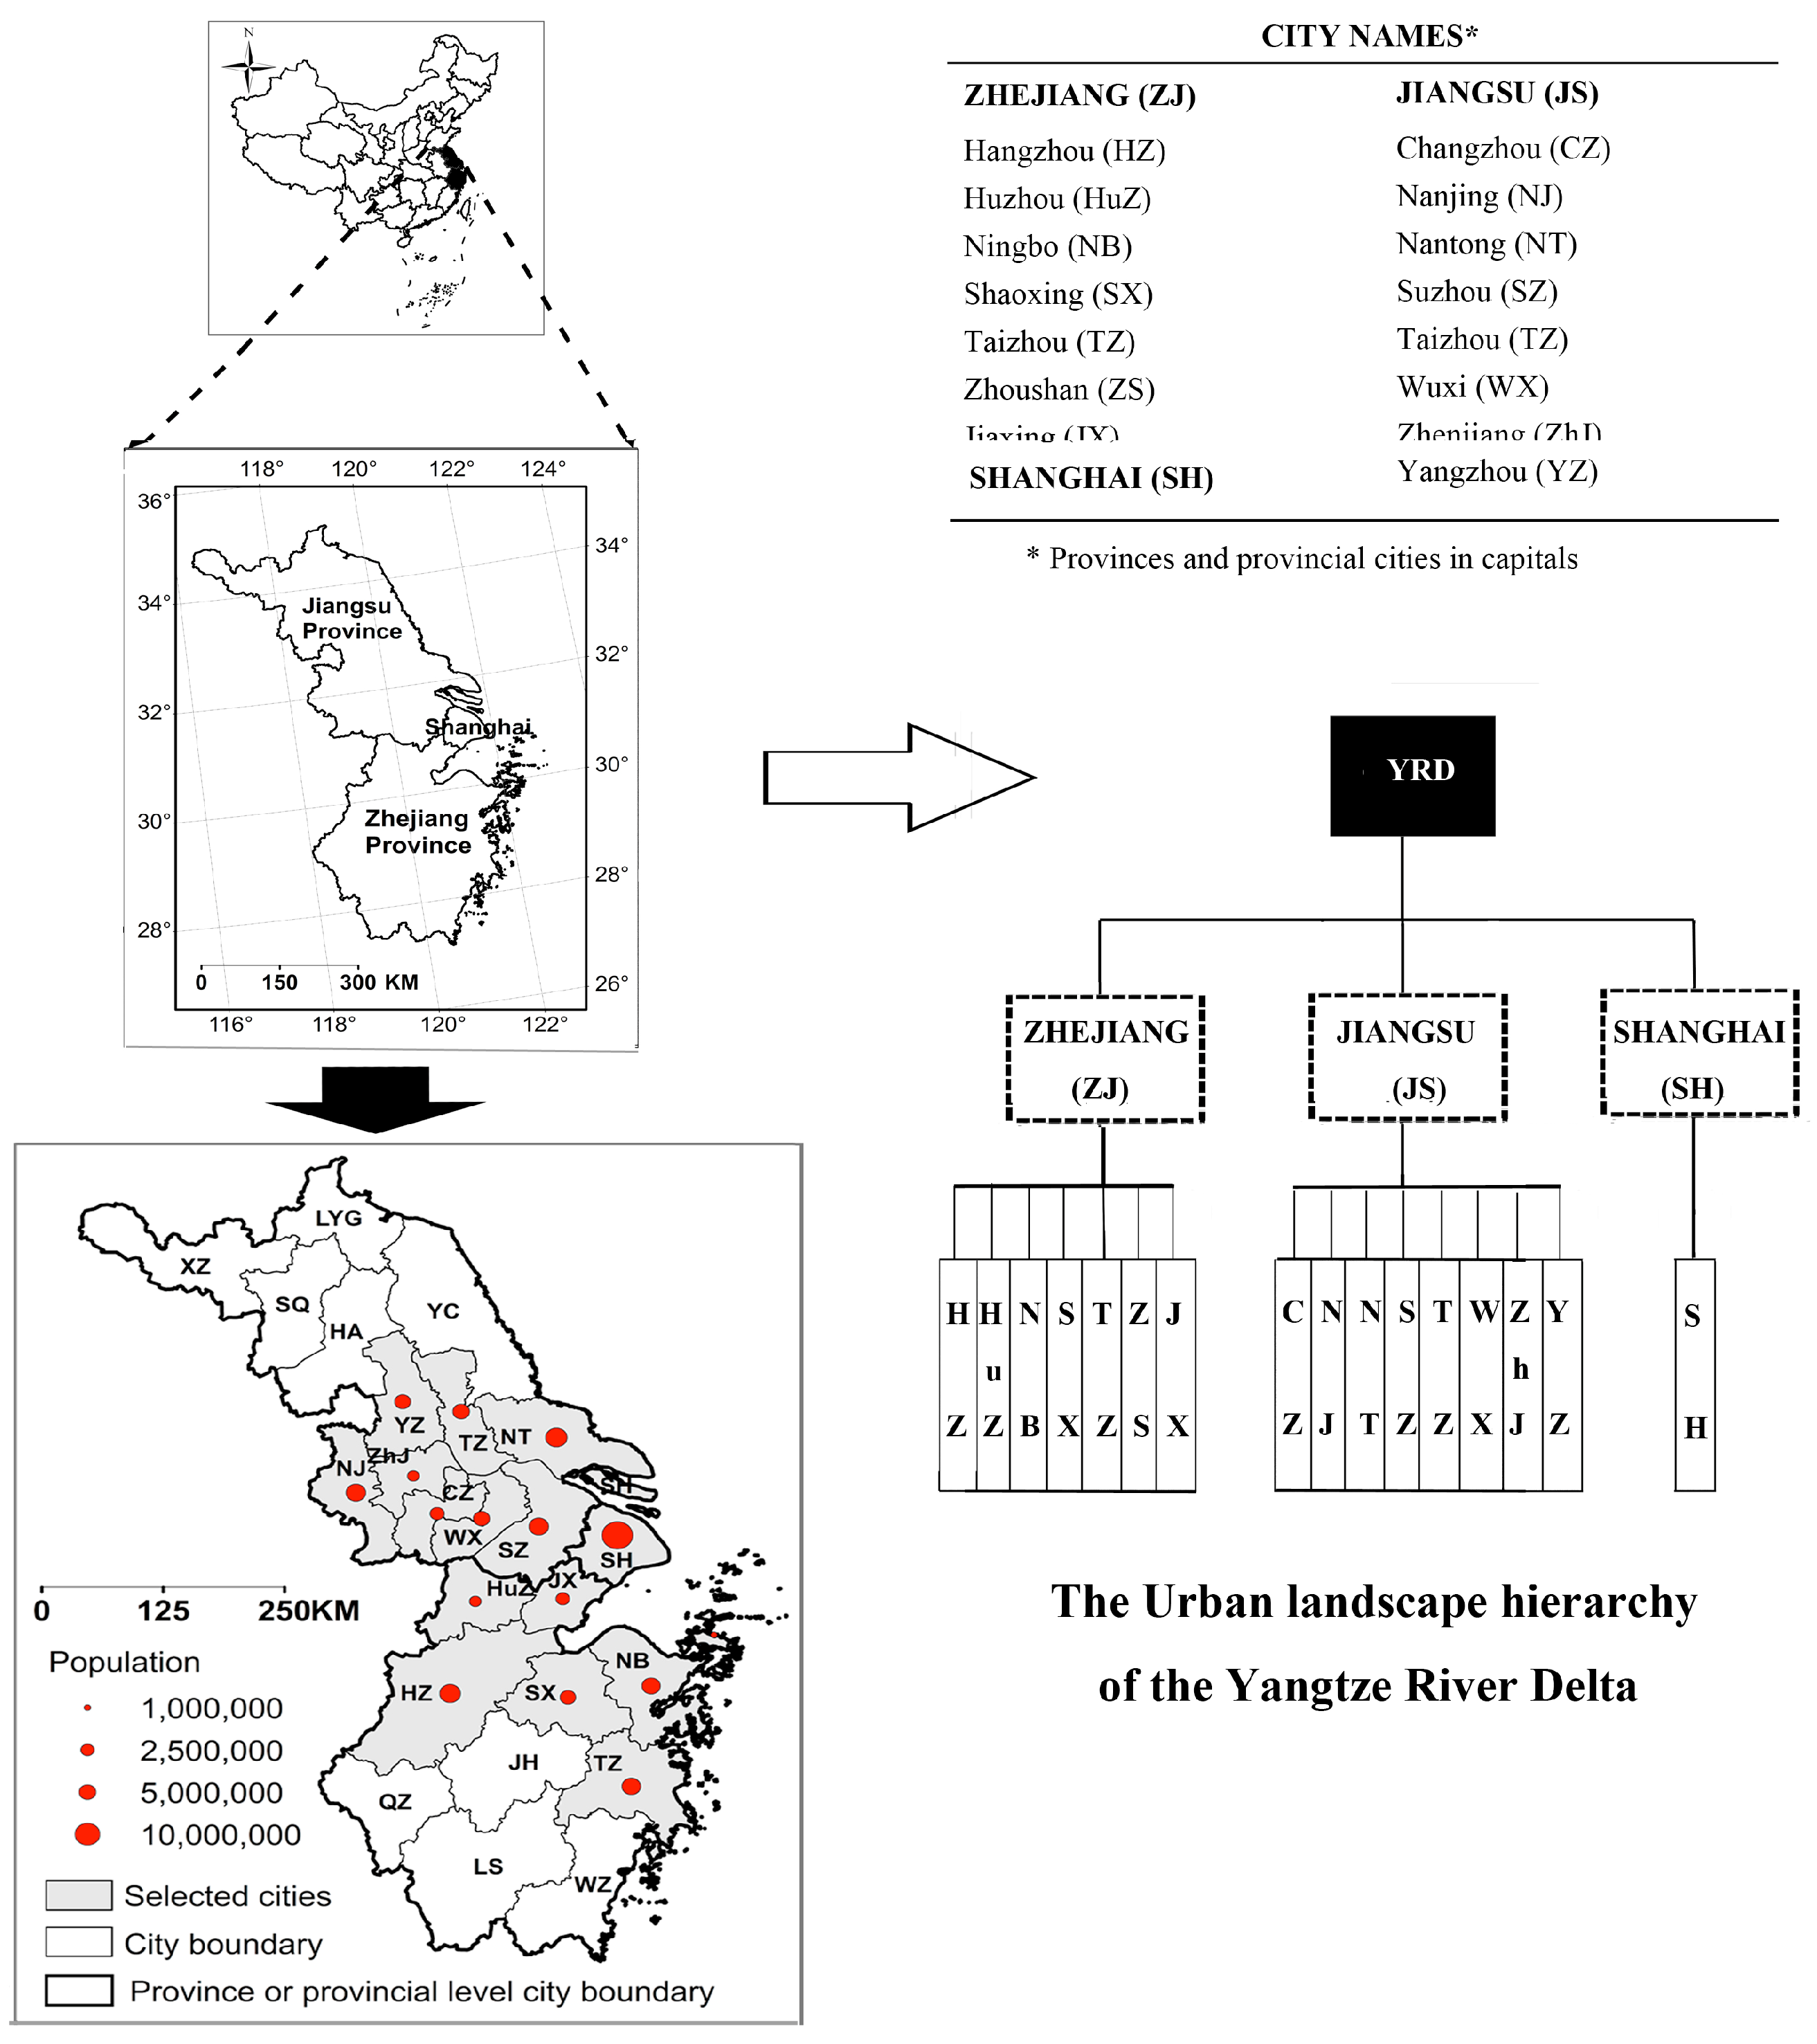
2.1. Study Area

Our study area is the Yangtze River Delta (YRD), covering about 13,244 km2 (117–123° N and 27–36° E) and dominated by northern subtropical monsoon climate with a long history of agriculture (Figure 1). Since the implementation of the government’s economic reform policy in 1978, the YRD region has become one of the mostly densely populated and developed economies in China. During 1978–2014, its population increased from 108.84 to 142.58 million and the non-agricultural population accounted for ~58% of the total population at the end of 2014 [26,27,28,29]. The total GDP of YRD region increased nearly 169 times and it exceeded 11,032 billion RMB (~1751.11 billion US dollars; 1 US$ = 6.3 RMB in 2012) at the end of 2012, accounting for 19.5% of the totals for the whole country.
The urban administrative hierarchy of the YRD includes three levels: (1) two provinces (Jiangsu (JS) and Zhejiang (ZJ)) and a provincial-level city (Shanghai); (2) twenty-three prefectural-level cities; and (3) forty-nine county-level cities (not shown) (Figure 1). Limited by the accessibility of data, we focused on central YRD at two administrative levels: the urban region (i.e., two provinces of JS and ZJ) and 16 provincial- and prefectural-level cities that belong exclusively to the higher-level cities. Specifically, these sixteen cities are the provincial city of Shanghai (SH), eight prefectural cities of JS province (i.e., Wuxi (WX), Changzhou (CZ), Suzhou (SZ), Nanjing (NJ), Yangzhou (YZ), Nantong (NT), Zhenjiang (ZhJ), and Taizhou (TZ-JS)) and seven prefectural cities of ZJ province (i.e., Jiaxing (JX), Hangzhou (HZ), Huzhou (HuZ), Zhoushan (ZS), Taizhou (TZ-ZJ), Ningbo (NB) and Shaoxing (SX)) (Figure 1). Cities at each level of central YRD landscape hierarchy have comparable geophysical and socioeconomic characteristics.

2.2. Data and Methods

2.2.1. Data Collection and Urban Sustainability Indicators

According to the theme-based indicator framework for sustainability assessment adopted by UNCSD in 2001 [21] and data availability, we chose to assess the social, environmental, economic, and overall sustainability of the central YRD region at the provincial and prefectural levels from 2000 to 2014 (see Table 1). We did not assess institutional sustainability, as institutional data were difficult to obtain. For social, environmental and economic sustainability assessment, most indicators were available from Chinese city statistical yearbook [29], Statistical yearbook of Jiangsu and Zhejiang provinces (2001–2015) [26,28], and Statistical yearbook of each prefectural city (2001–2015) [27]. For the unavailable indicators, new ones used in other indicator framework, e.g., Sustainable Seattle and Sustainable Leister [10], or used in the literature published in China were used instead [30,31,32,33,34,35]. For the missing data of one or two years, we used the values of the adjacent years, i.e. mean values of the year before and after. When the missing data were more than two but with significantly linear increase through the year, we interpolated them by linear function (e.g., the housing construction area per capita).
To make the sustainability development comparable across scales, all indicators of cities at both provincial and prefectural levels were combined, and normalized into unit-free values in the range from 0 to 1, using Equation (1) [36]. Before the normalization, all the inverse indicators of which the smaller values indicated the more sustainable (e.g., environmental pollution data per unit area) were reciprocated.
U i j = C i j C j m i n C j m a x C j m i n
where Uij represents the standardized values of indicator j of city i during 2000–2014, Cij, Cjmax and Cjmin represent the actual, maximum and minimum values of indicator j of city i, respectively.
We aggregated the normalized scores (i.e., Uij) of each component into scores of social, environmental and social sustainability of city i using Equation (2):
S i j = U i j
Similarly, the overall sustainability scores (Sij) were yielded by summing up the social, environmental and economic sustainability scores. This kind of form calculated by Equation (2) measures the weak sustainability. For strong sustainability, it is difficult to measure. Based on to what extent the natural capital could be substituted by human-made capital, the “absurdly strong sustainability” (not allowing for substitutability) and “strong sustainability” (setting a limit or threshold to substitutability) were further identified [37]. Wilson and Wu [37] provided mathematical forms of the three sustainability perspectives (for details, refer to their paper). Considering the critical thresholds were arbitrarily selected for calculating strong sustainability, we only considered the absurdly strong sustainability in our study. The absurdly strong sustainability could be measured by the changes of environmental sustainability scores over time [37]. More simply, if the environmental sustainability score increases with time, the absurdly strong sustainability score is positive; otherwise, it is negative. In addition, mean values of sustainability scores and hierarchical cluster analysis (Ward Method) were used to compare the sustainability performances of cities at both provincial and prefectural levels from 2000 to 2014.

2.2.2. Data Gaps and Reliability

Due to the data availability, a few indicators were not considered in our study, although they are also important. Examples include air pollution, soil pollution and water pollution in environmental dimension, and the data in institutional dimension of sustainability. All data were either directly acquired from or calculated based on the data from national, provincial and prefectural statistical yearbooks [26,27,28,29]. Due to the differences of statistical methods, calibers and standards, some statistical data might be over- or underestimated. However, we considered they were still useful or reliable for the comparison through time and over space.

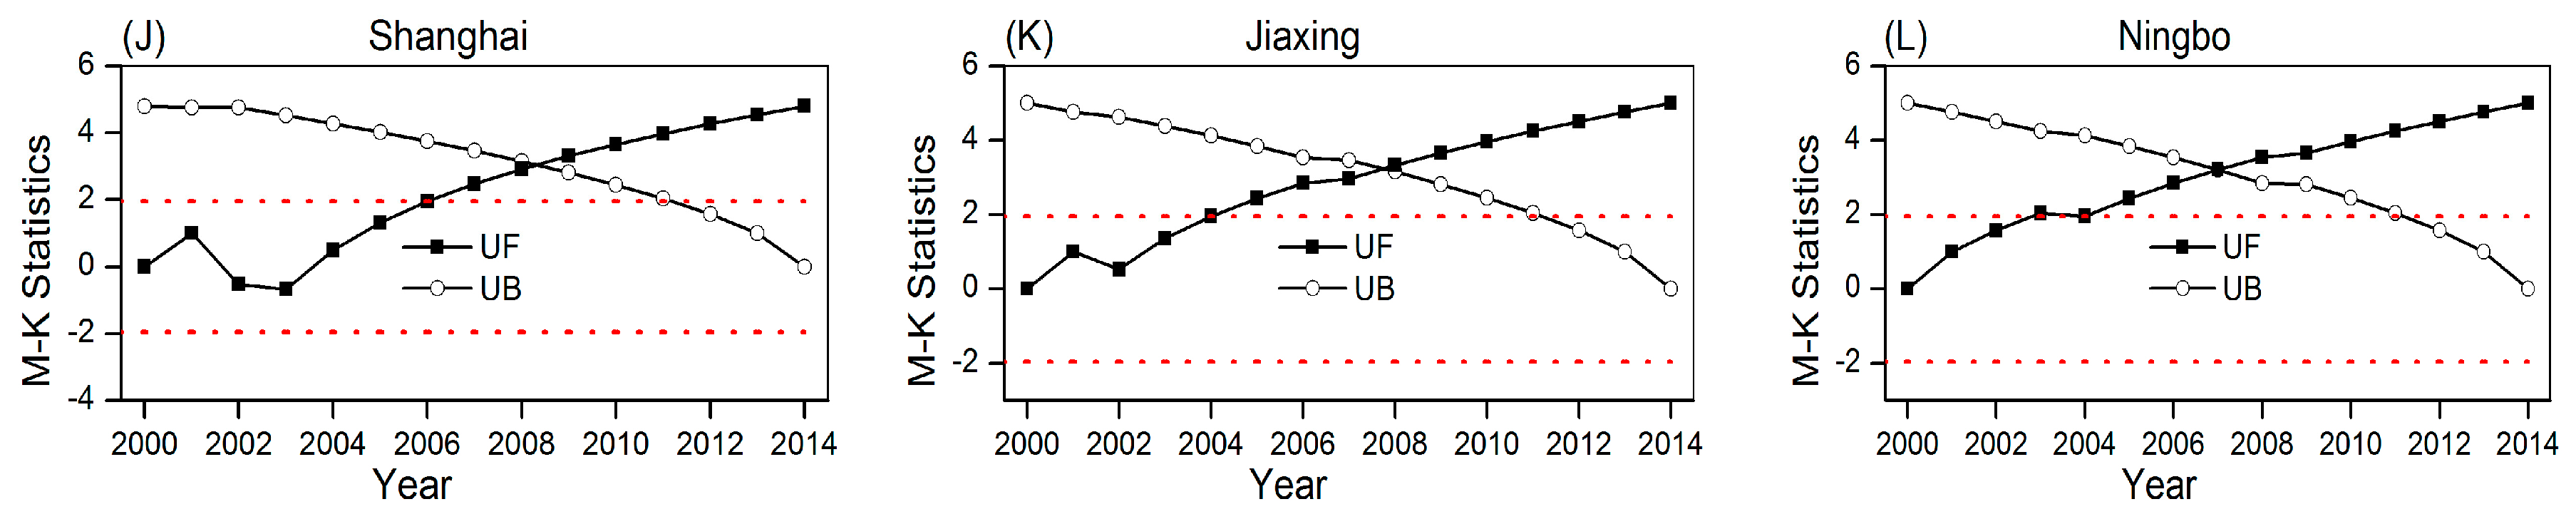
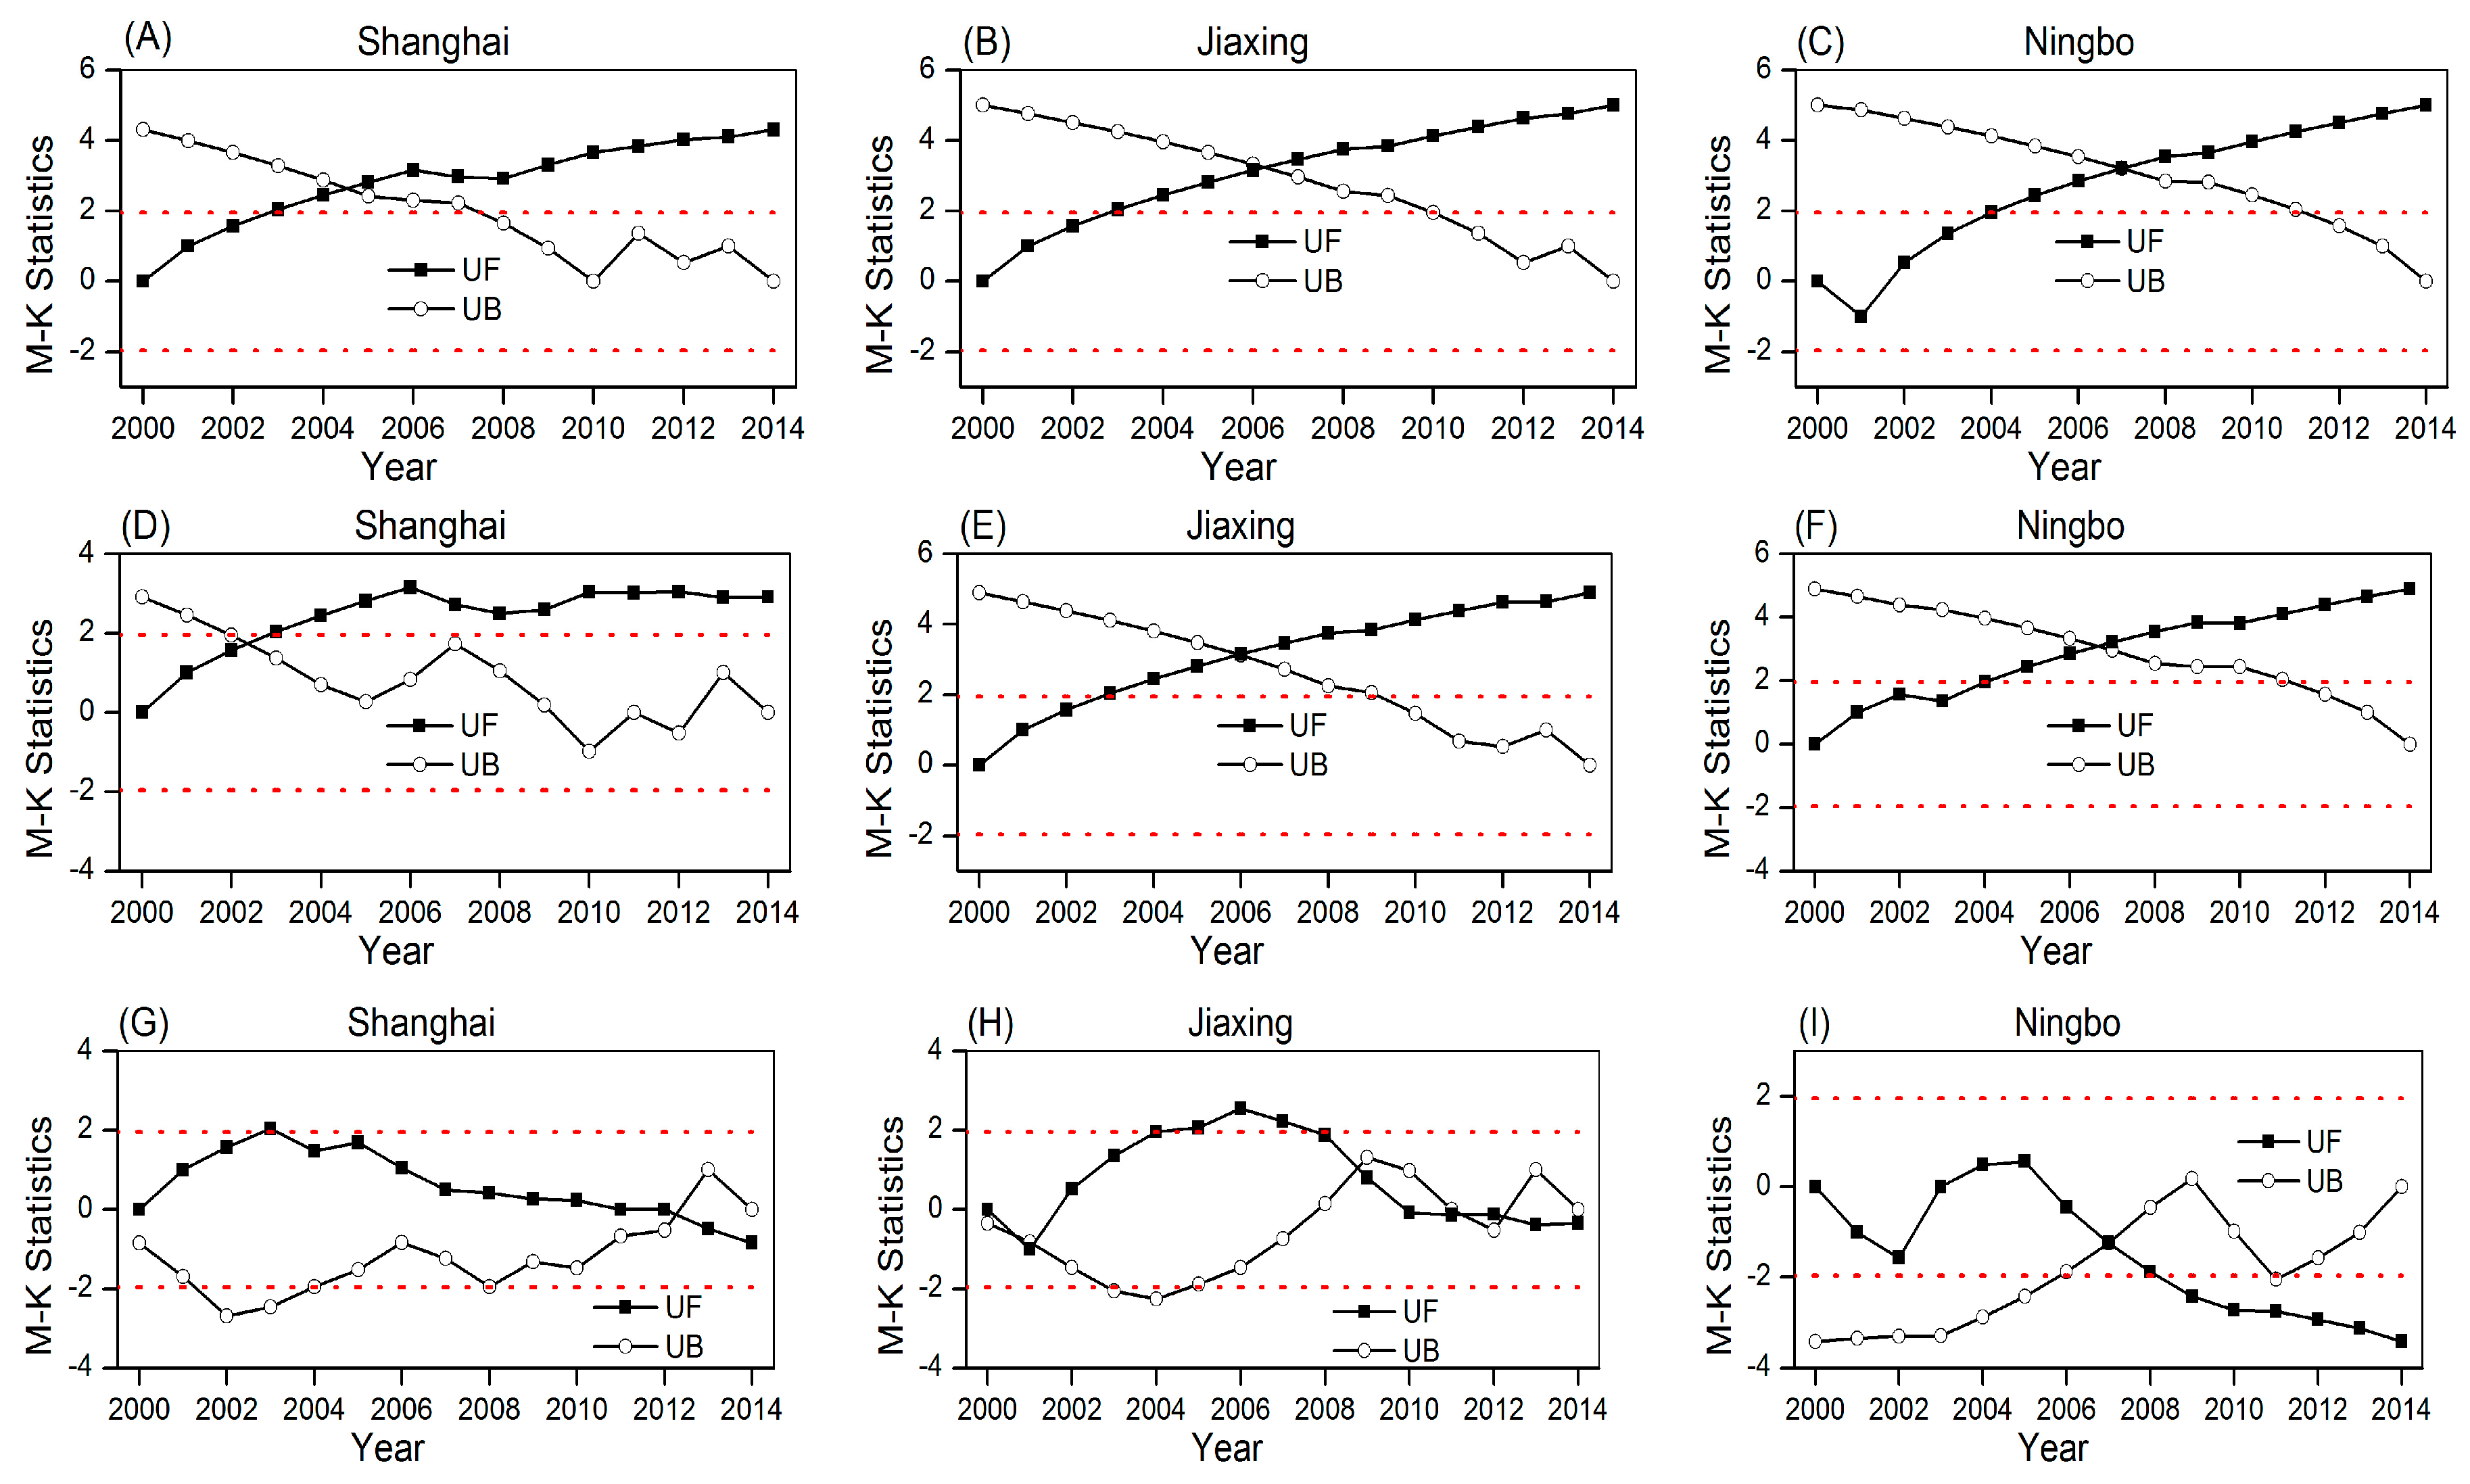
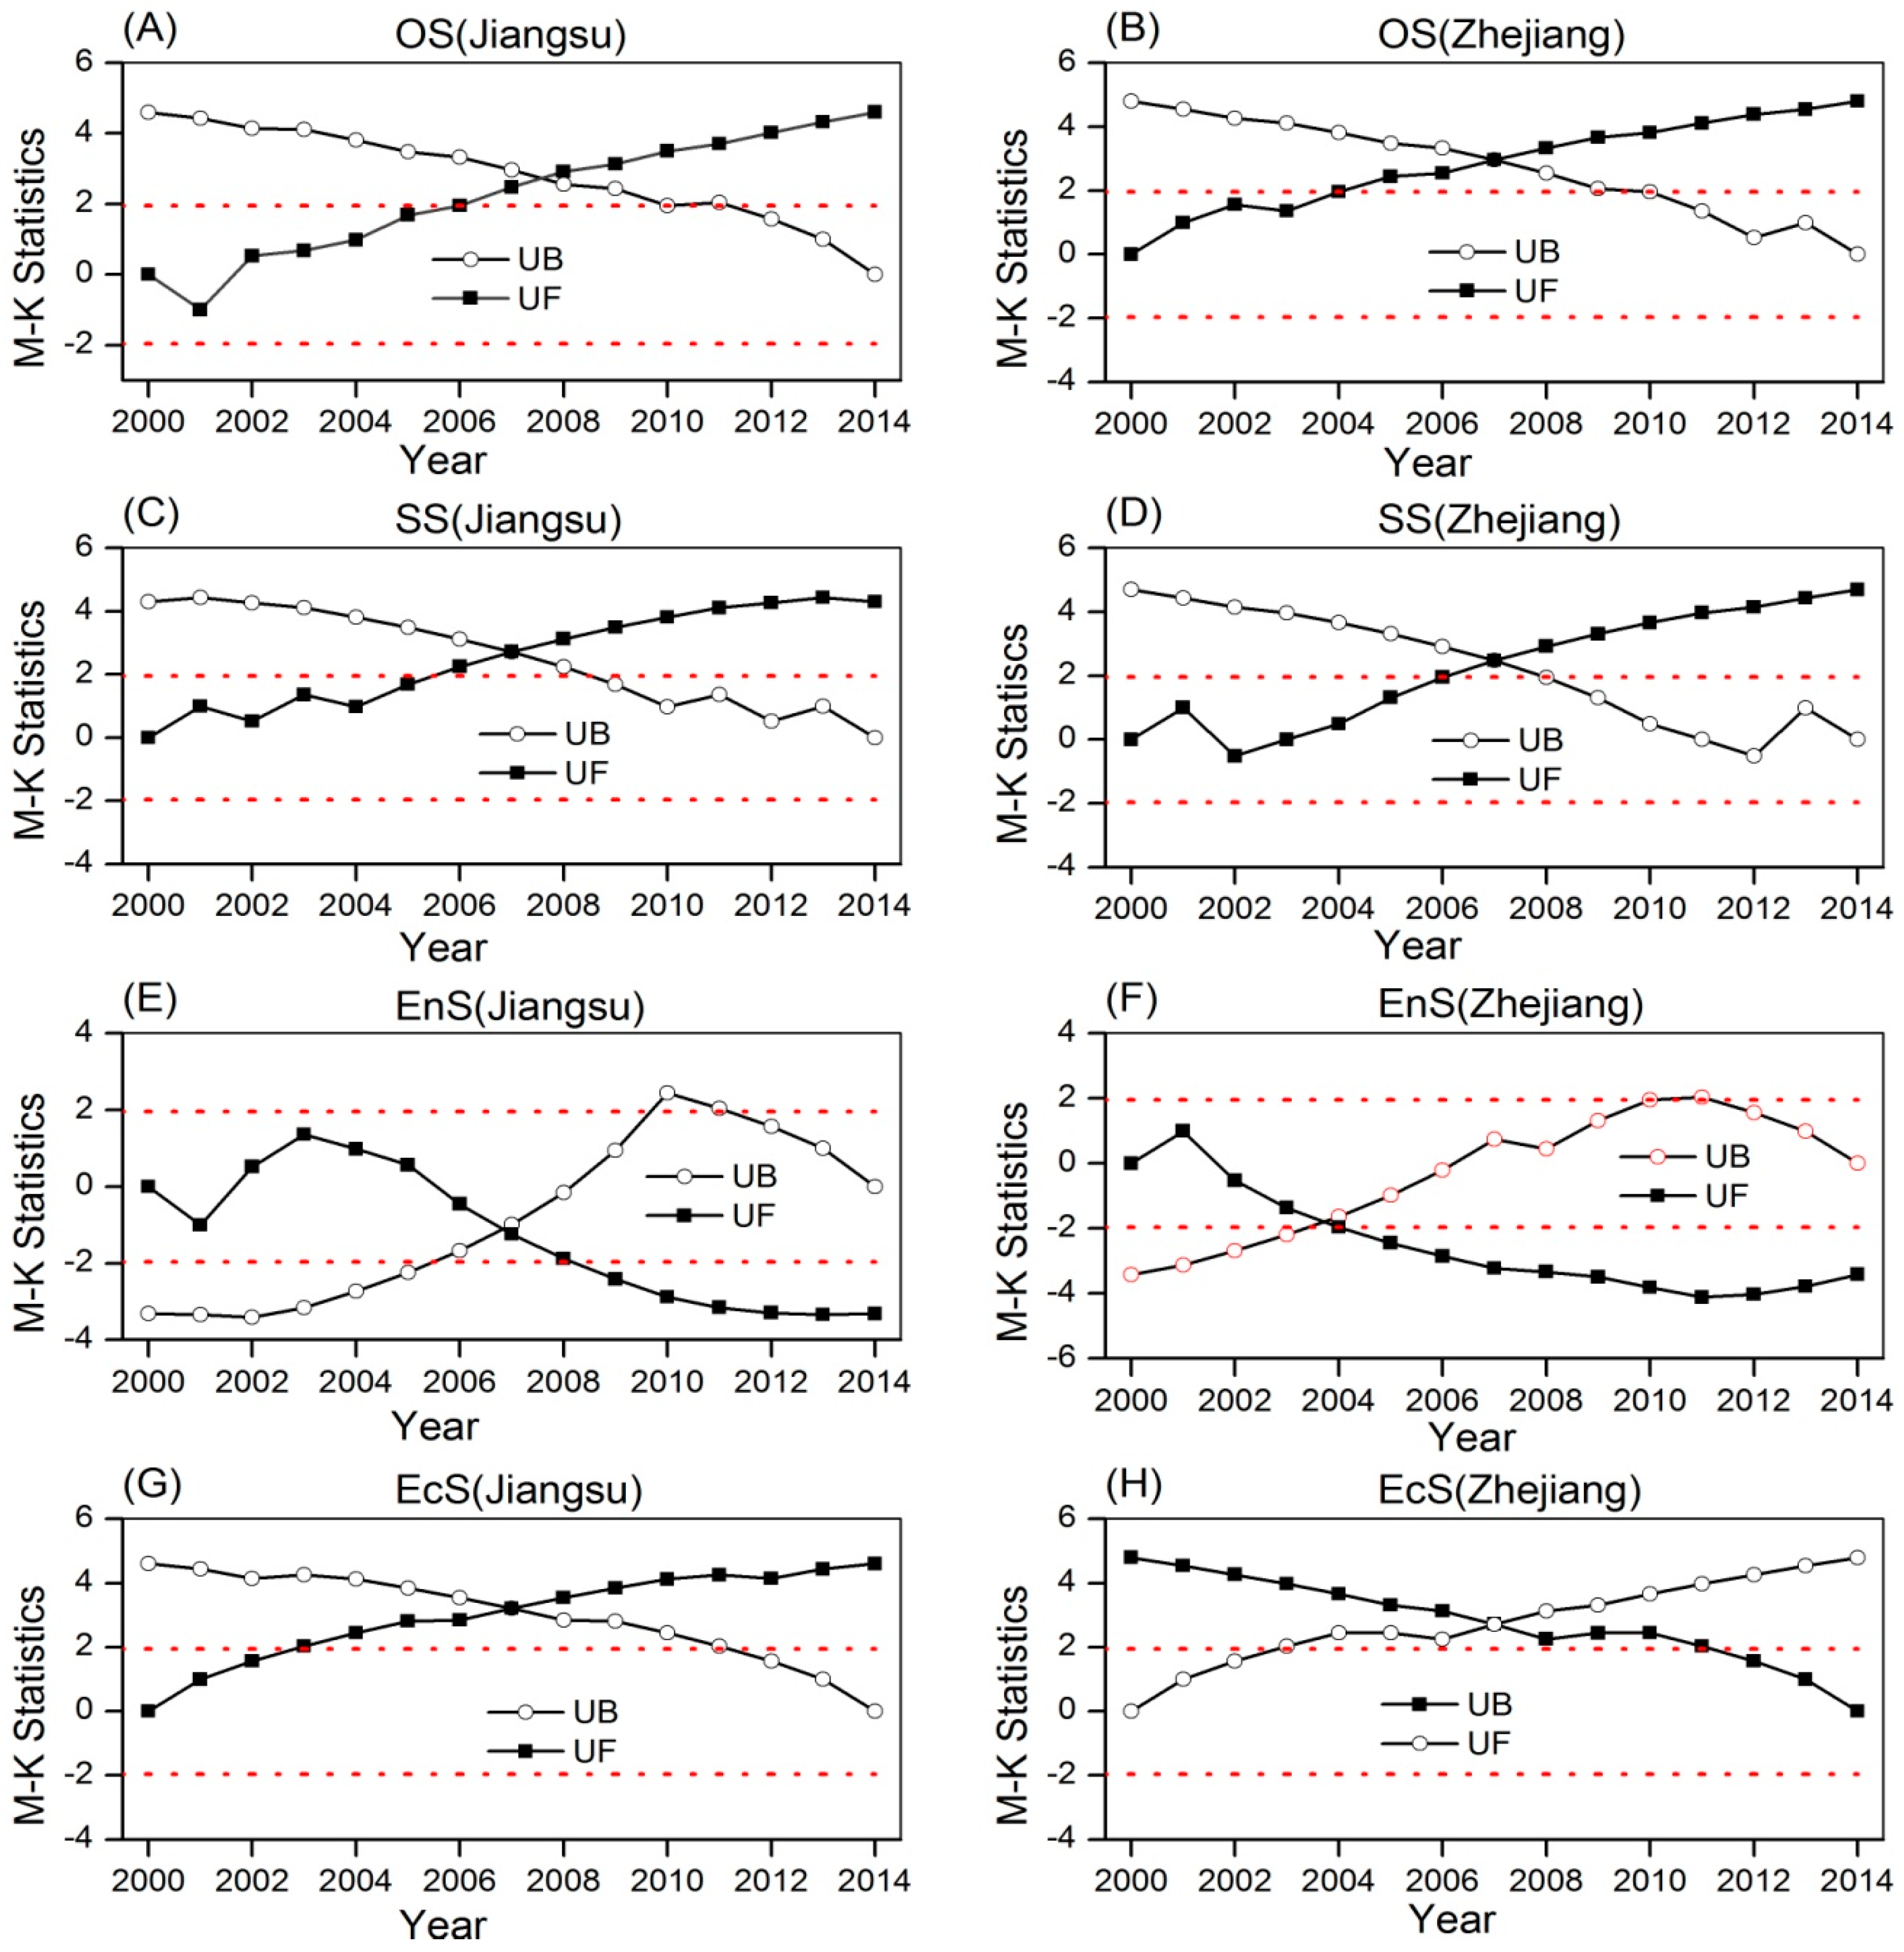
2.2.3. Mann-Kendall (M-K) Statistical Analysis

The Mann–Kendall test (MK test) [39,40,41], a nonparametric statistical test, is commonly used for trend analysis and detecting mutation of a time series. It determines the change trend of sequence by calculating the standardization of time series statistics based on the correlation between the ranks of a time series and their time order [42,43]. It works for all distributions, and has been widely used in hydroclimatic fields [42,44,45,46] (see the previous studies mentioned above for more details on the algorithm). Two parameters of UF and UB are usually used to represent the curve and reverse curve of the statistical sequence, respectively. A UF or UB value larger than zero indicates an increasing trend. Otherwise, it indicates a downward trend. Given a level of significance α, when the absolute value of MK statistics (ZMK) is larger than the confidence limit (Zα) (e.g., α = 0.05, Zα = ±1.96), the trend of the sequence is significant. If UF and UB intersect, the intersection is the abrupt change point (i.e., mutation). When the intersection falls between the confidence limit (e.g., ±1.96), there is a significant mutation in the sequence. In this study, M-K test was used to detect the trend of OS, SS, EnS and EcS from 2000 to 2014, as well as the mutation in the time series. It was calculated by MATLAB (version: 2015a, The MathWorks Incorporated, Natick, MA, USA).

3. Results

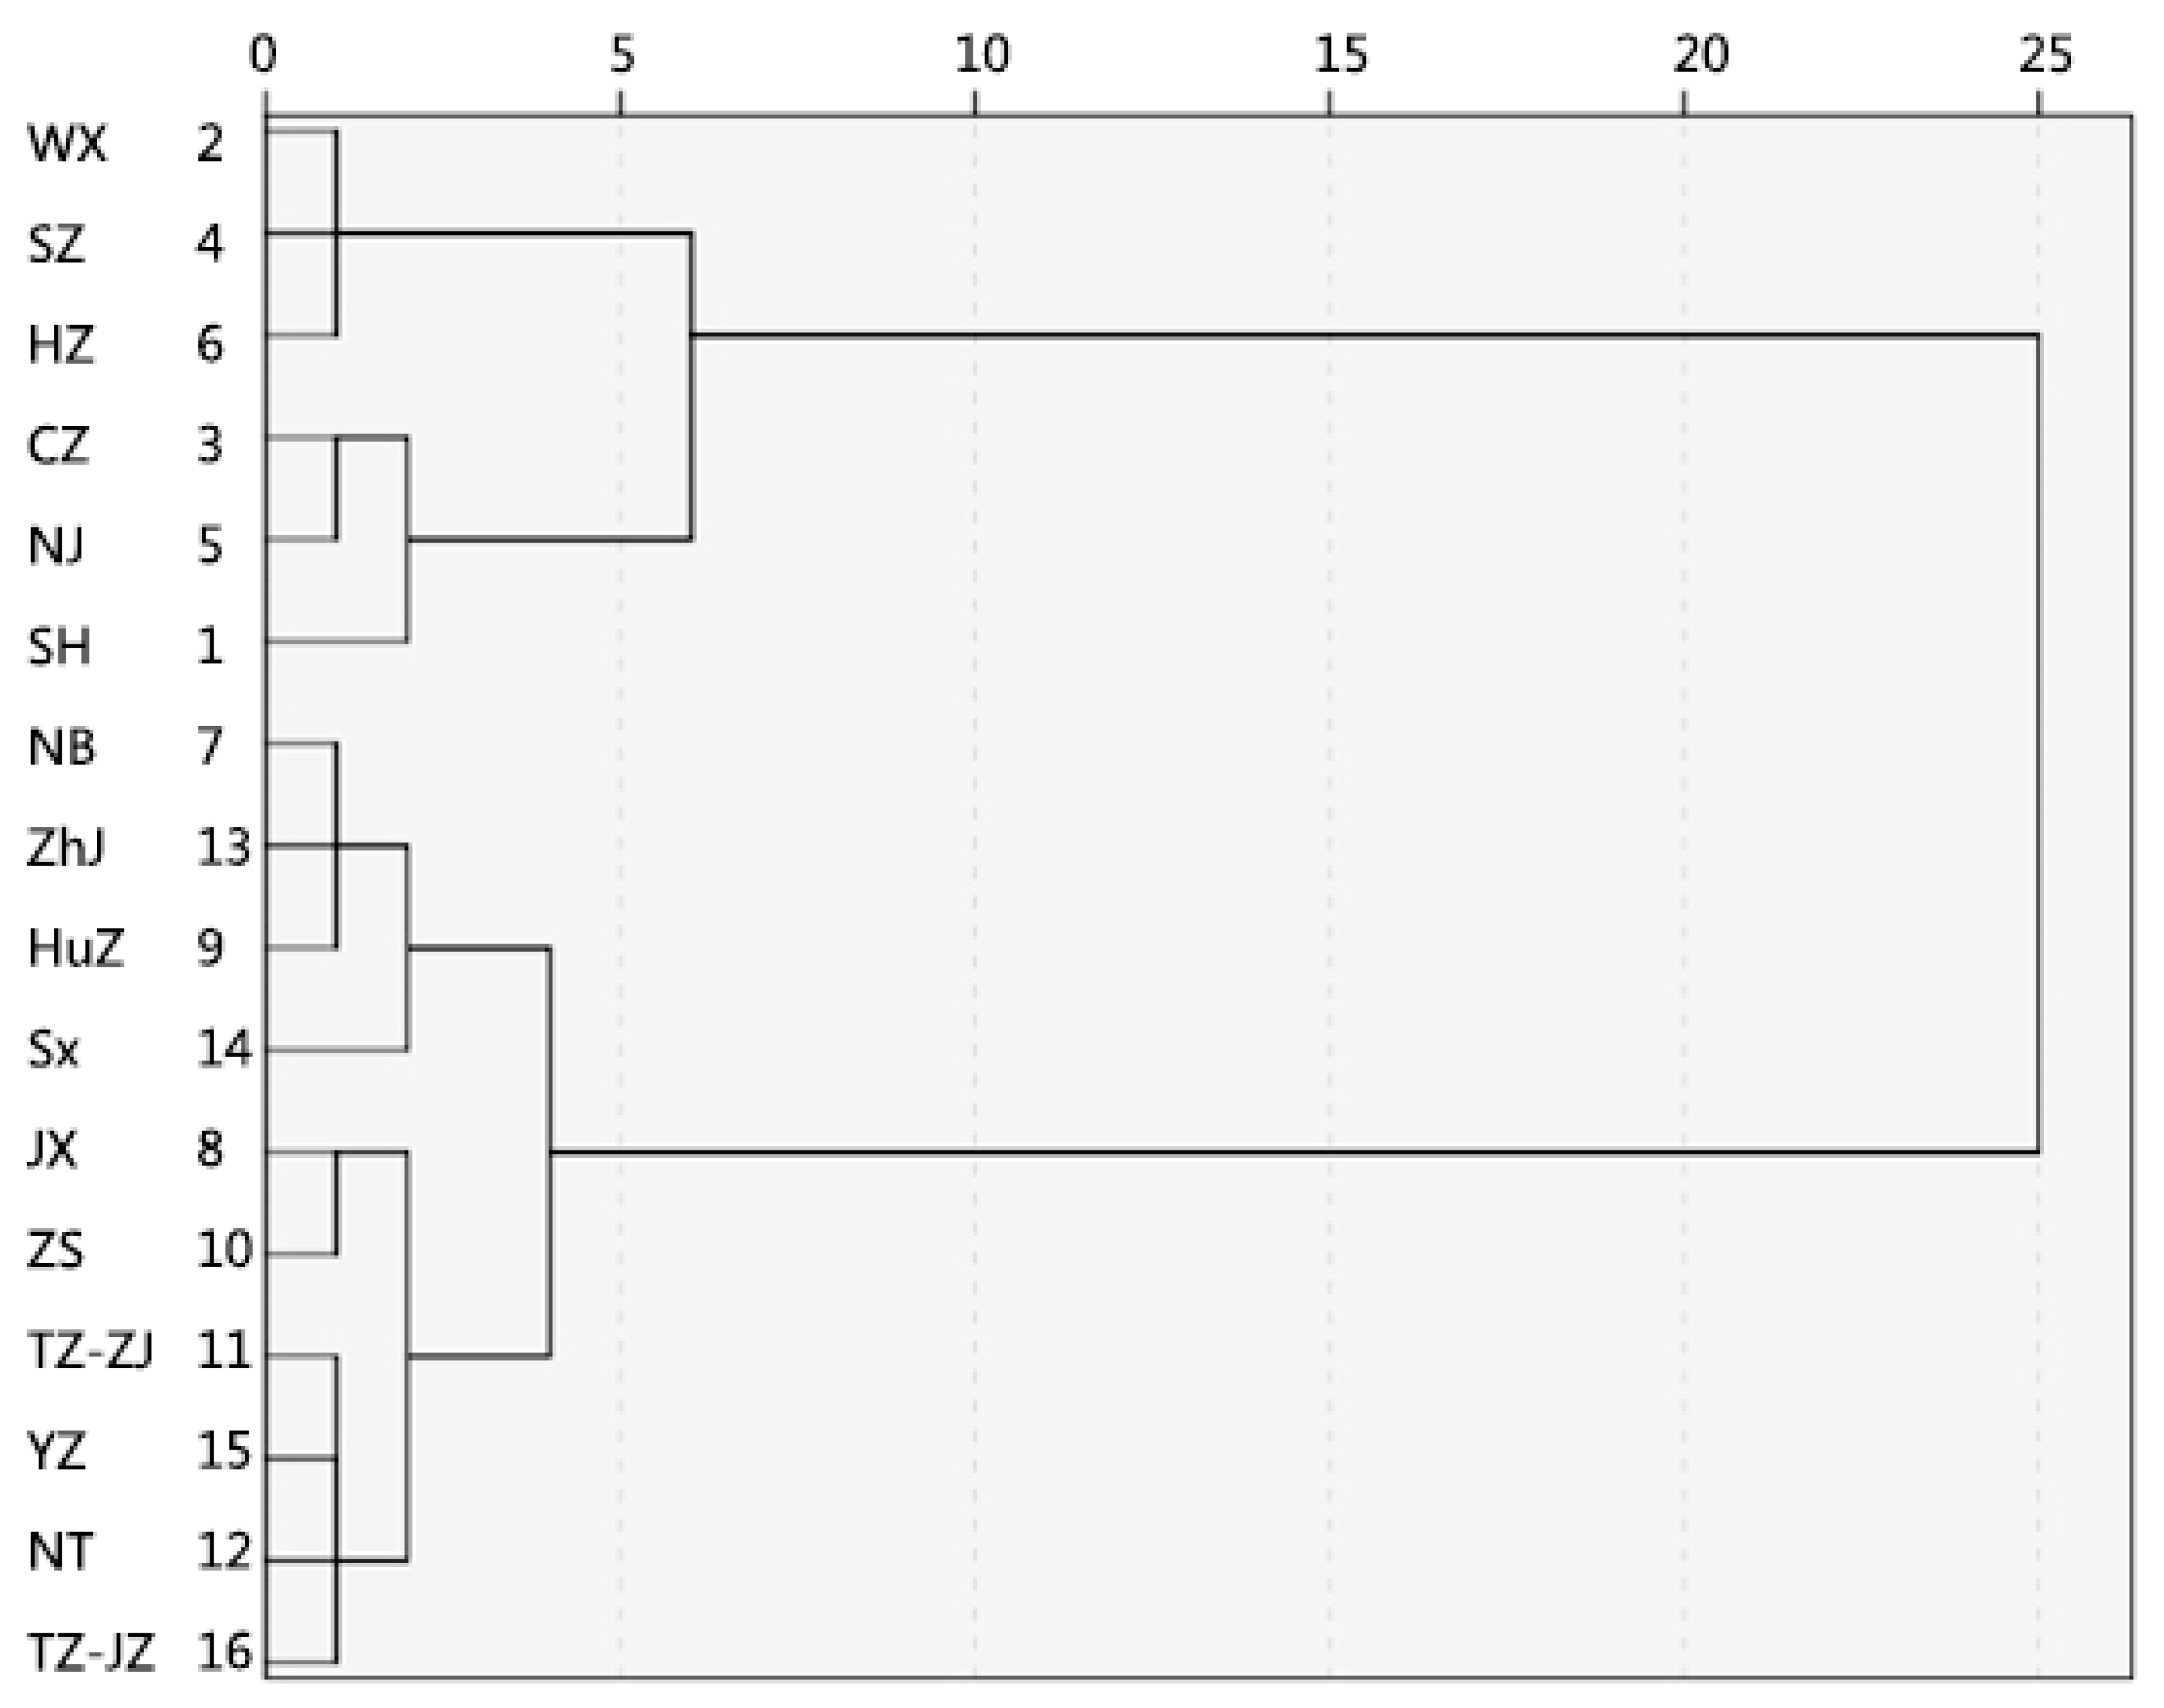
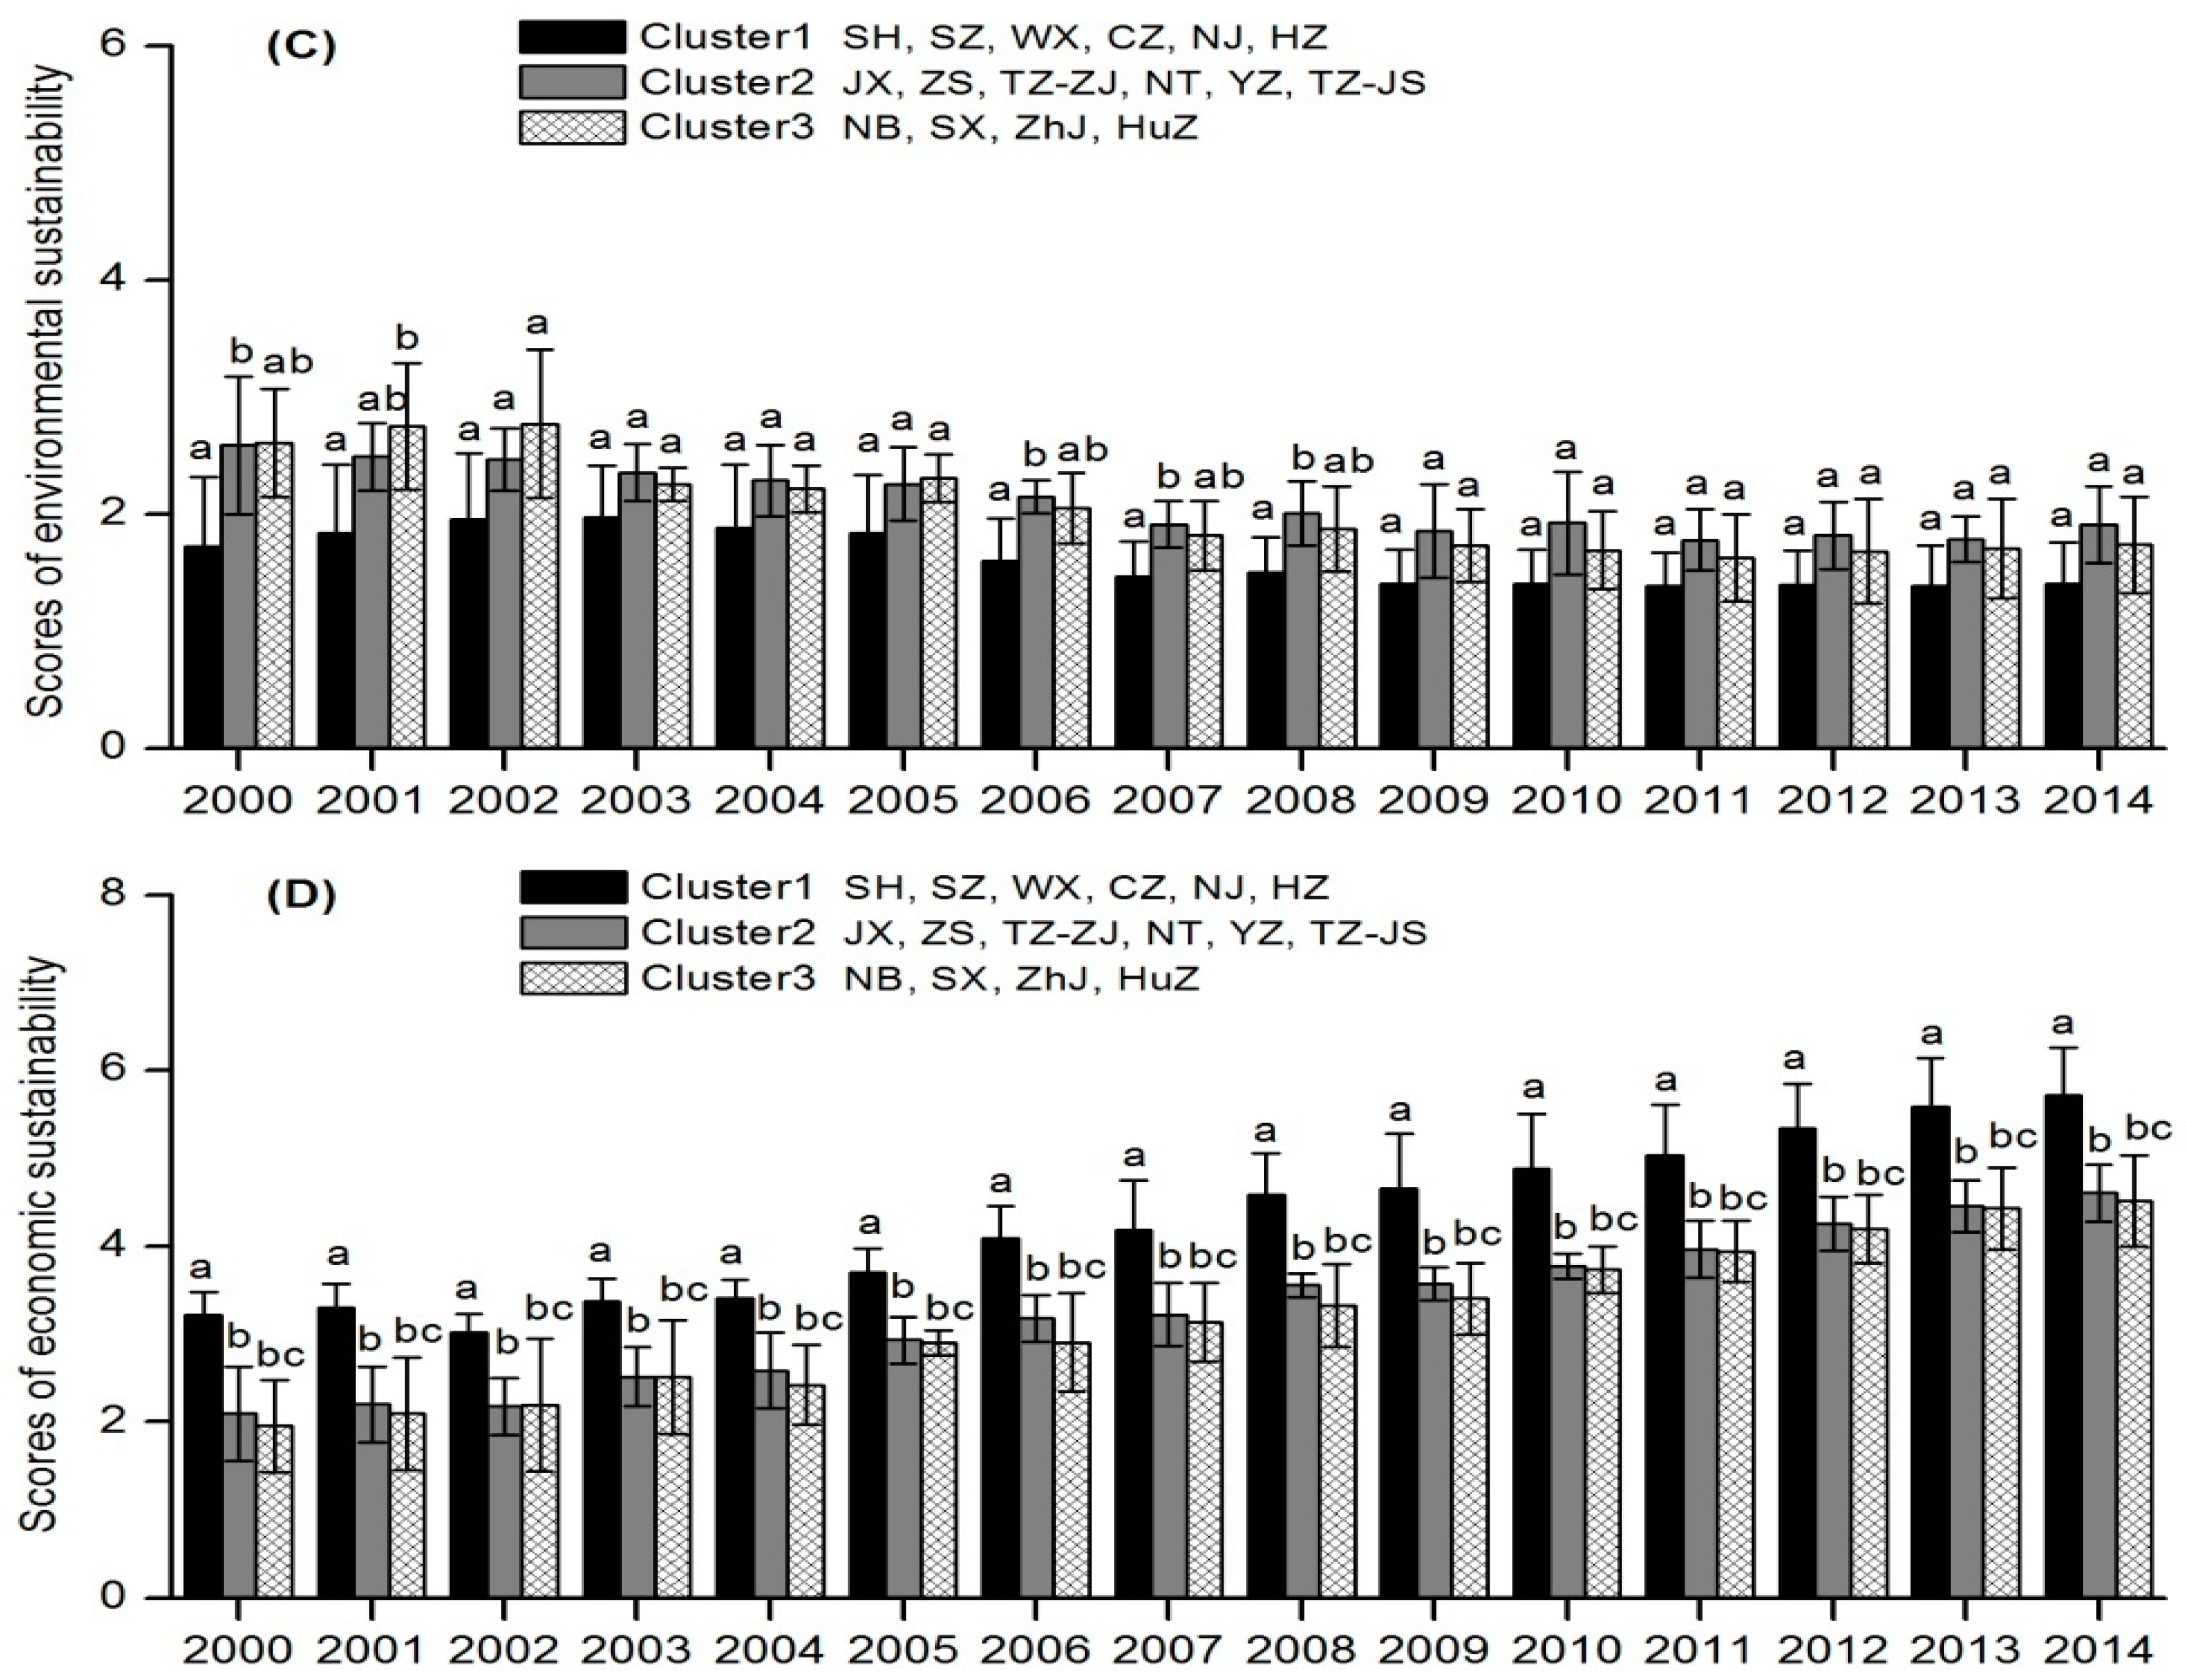
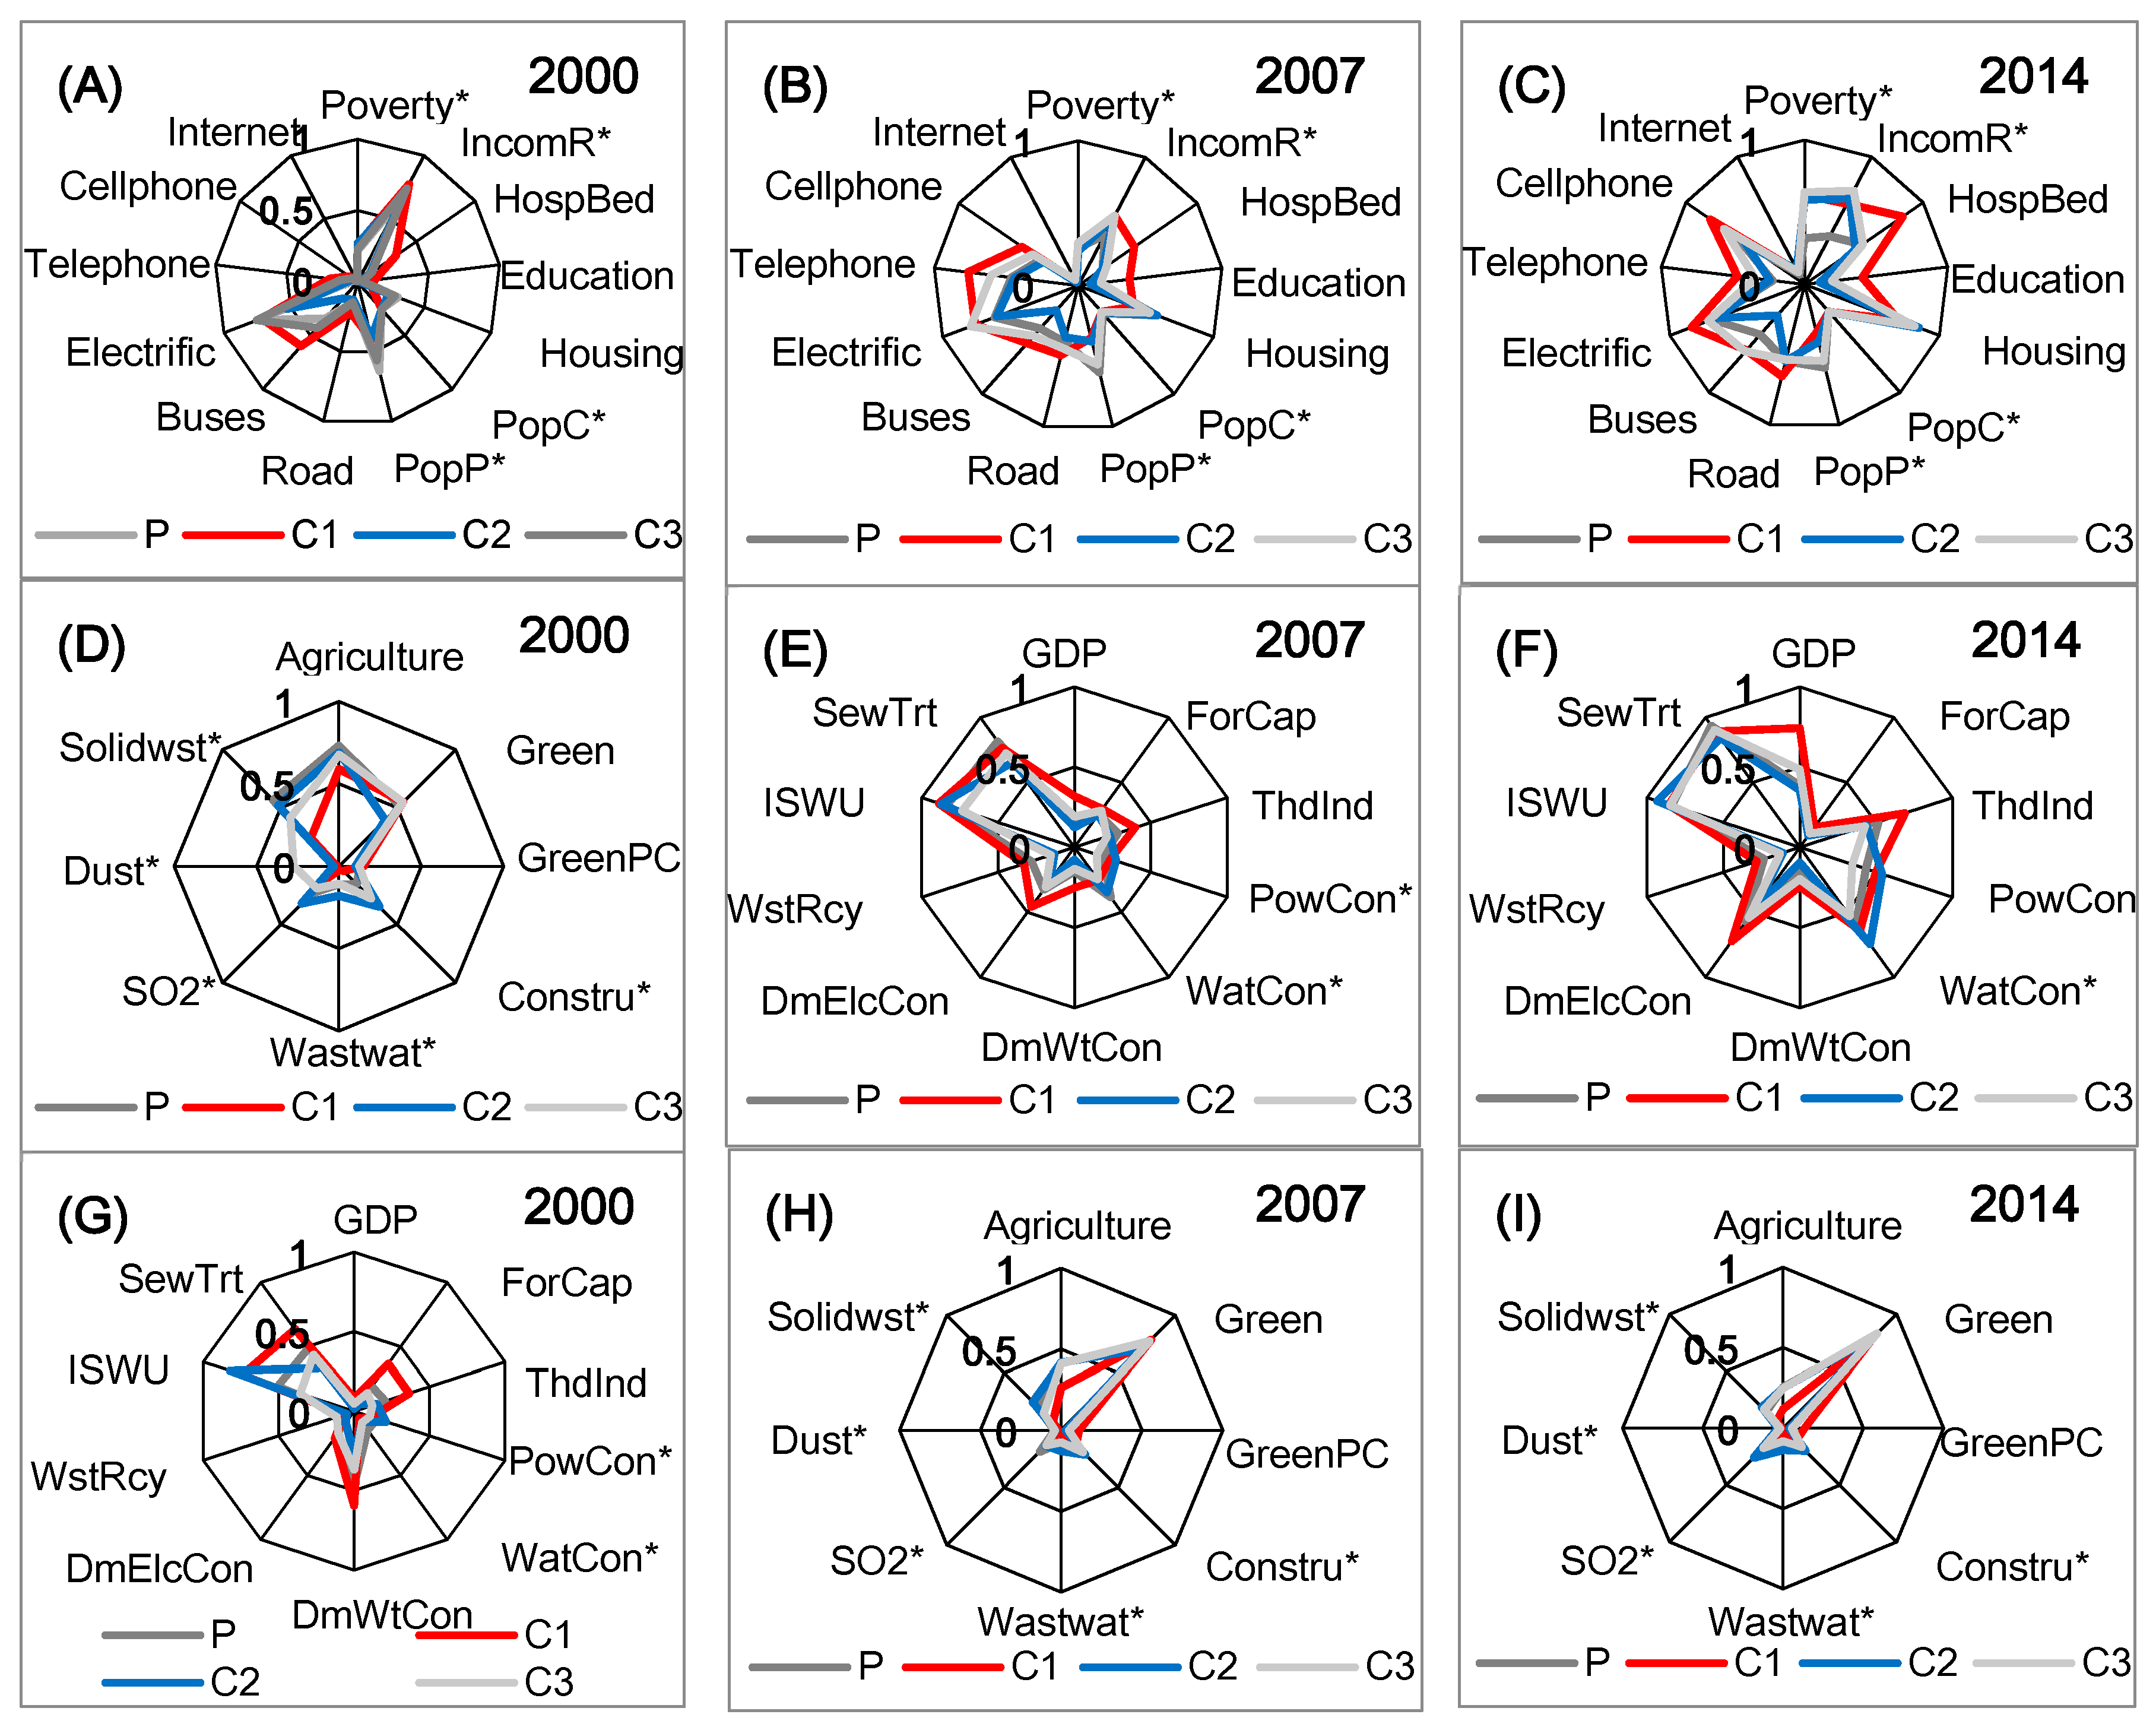
3.1. Urban Sustainability of Cities at the Prefectural Level

At the prefectural level, the sustainability performance varied among cities and three distinct city clusters were detected by the hierarchical cluster analysis (Figure 2). The mean scores of OS, SS and EcS of Cluster 1 were significantly higher than those of the other two clusters, while the differences of the mean scores of Cluster 2 and Cluster 3 were not significant during the majority of study period (p < 0.05; post-hoc test) (Figure 3). On the contrary, the ranking scores of environmental sustainability scores of three clusters was Cluster 1 < Cluster 3 < Cluster 2, but with no significant differences among clusters in the majority of the study years (p > 0.05; post-hoc test). The OS, SS and EcS scores of all the cities generally showed an upward trend through time, with the mutation year being during 2007–2009 (M-K statistics; Z values > 1.96; Figure 4). The EnS scores of all cities, except SH, WX and TZ-ZJ, showed a downward trend without a significant mutation year (Figure 4). The component indicators of different sustainability dimensions changed over time and were different among city clusters (Figure 5). Mean values of the majority of indicators of three city clusters in social and economic dimensions increased through time and the ranked order was: Cluster 1 > Cluster 3 > Cluster 2.
In the social dimension, all city clusters generally performed well in the income equity (IncomR *), living conditions (Housing) and infrastructure building (Buses and Electrification), while performed poorly in employment equity (Poverty *), higher education achievement (Education) and population pressure reduction (PopP *) (Figure 5). In the economic dimension, economic performance (GDP), industrial structure (ThdInd), material consumption efficiency (PowCon * and WatCon), energy use (DomElCn) and waste generation and management (ISWU, SewTrt) are all favorable factors, but the balance of trade in goods and services (ForCap) and waste recycling and reuse (WstRcy) are both low (Figure 5). On the contrary, the majority of the component indicators of the three city clusters in environmental dimension showed a decreased trend, and the ranked order was: Cluster 1 < Cluster 3 < Cluster 2. The major reasons for this problem were the low values of green area per capita in urban proper and large industrial “three waste” emissions (indicated by low scores of the reciprocal values of industrial wastewater discharge, SO2 emission, dust emission and solid waste discharge per km2) (Figure 5).

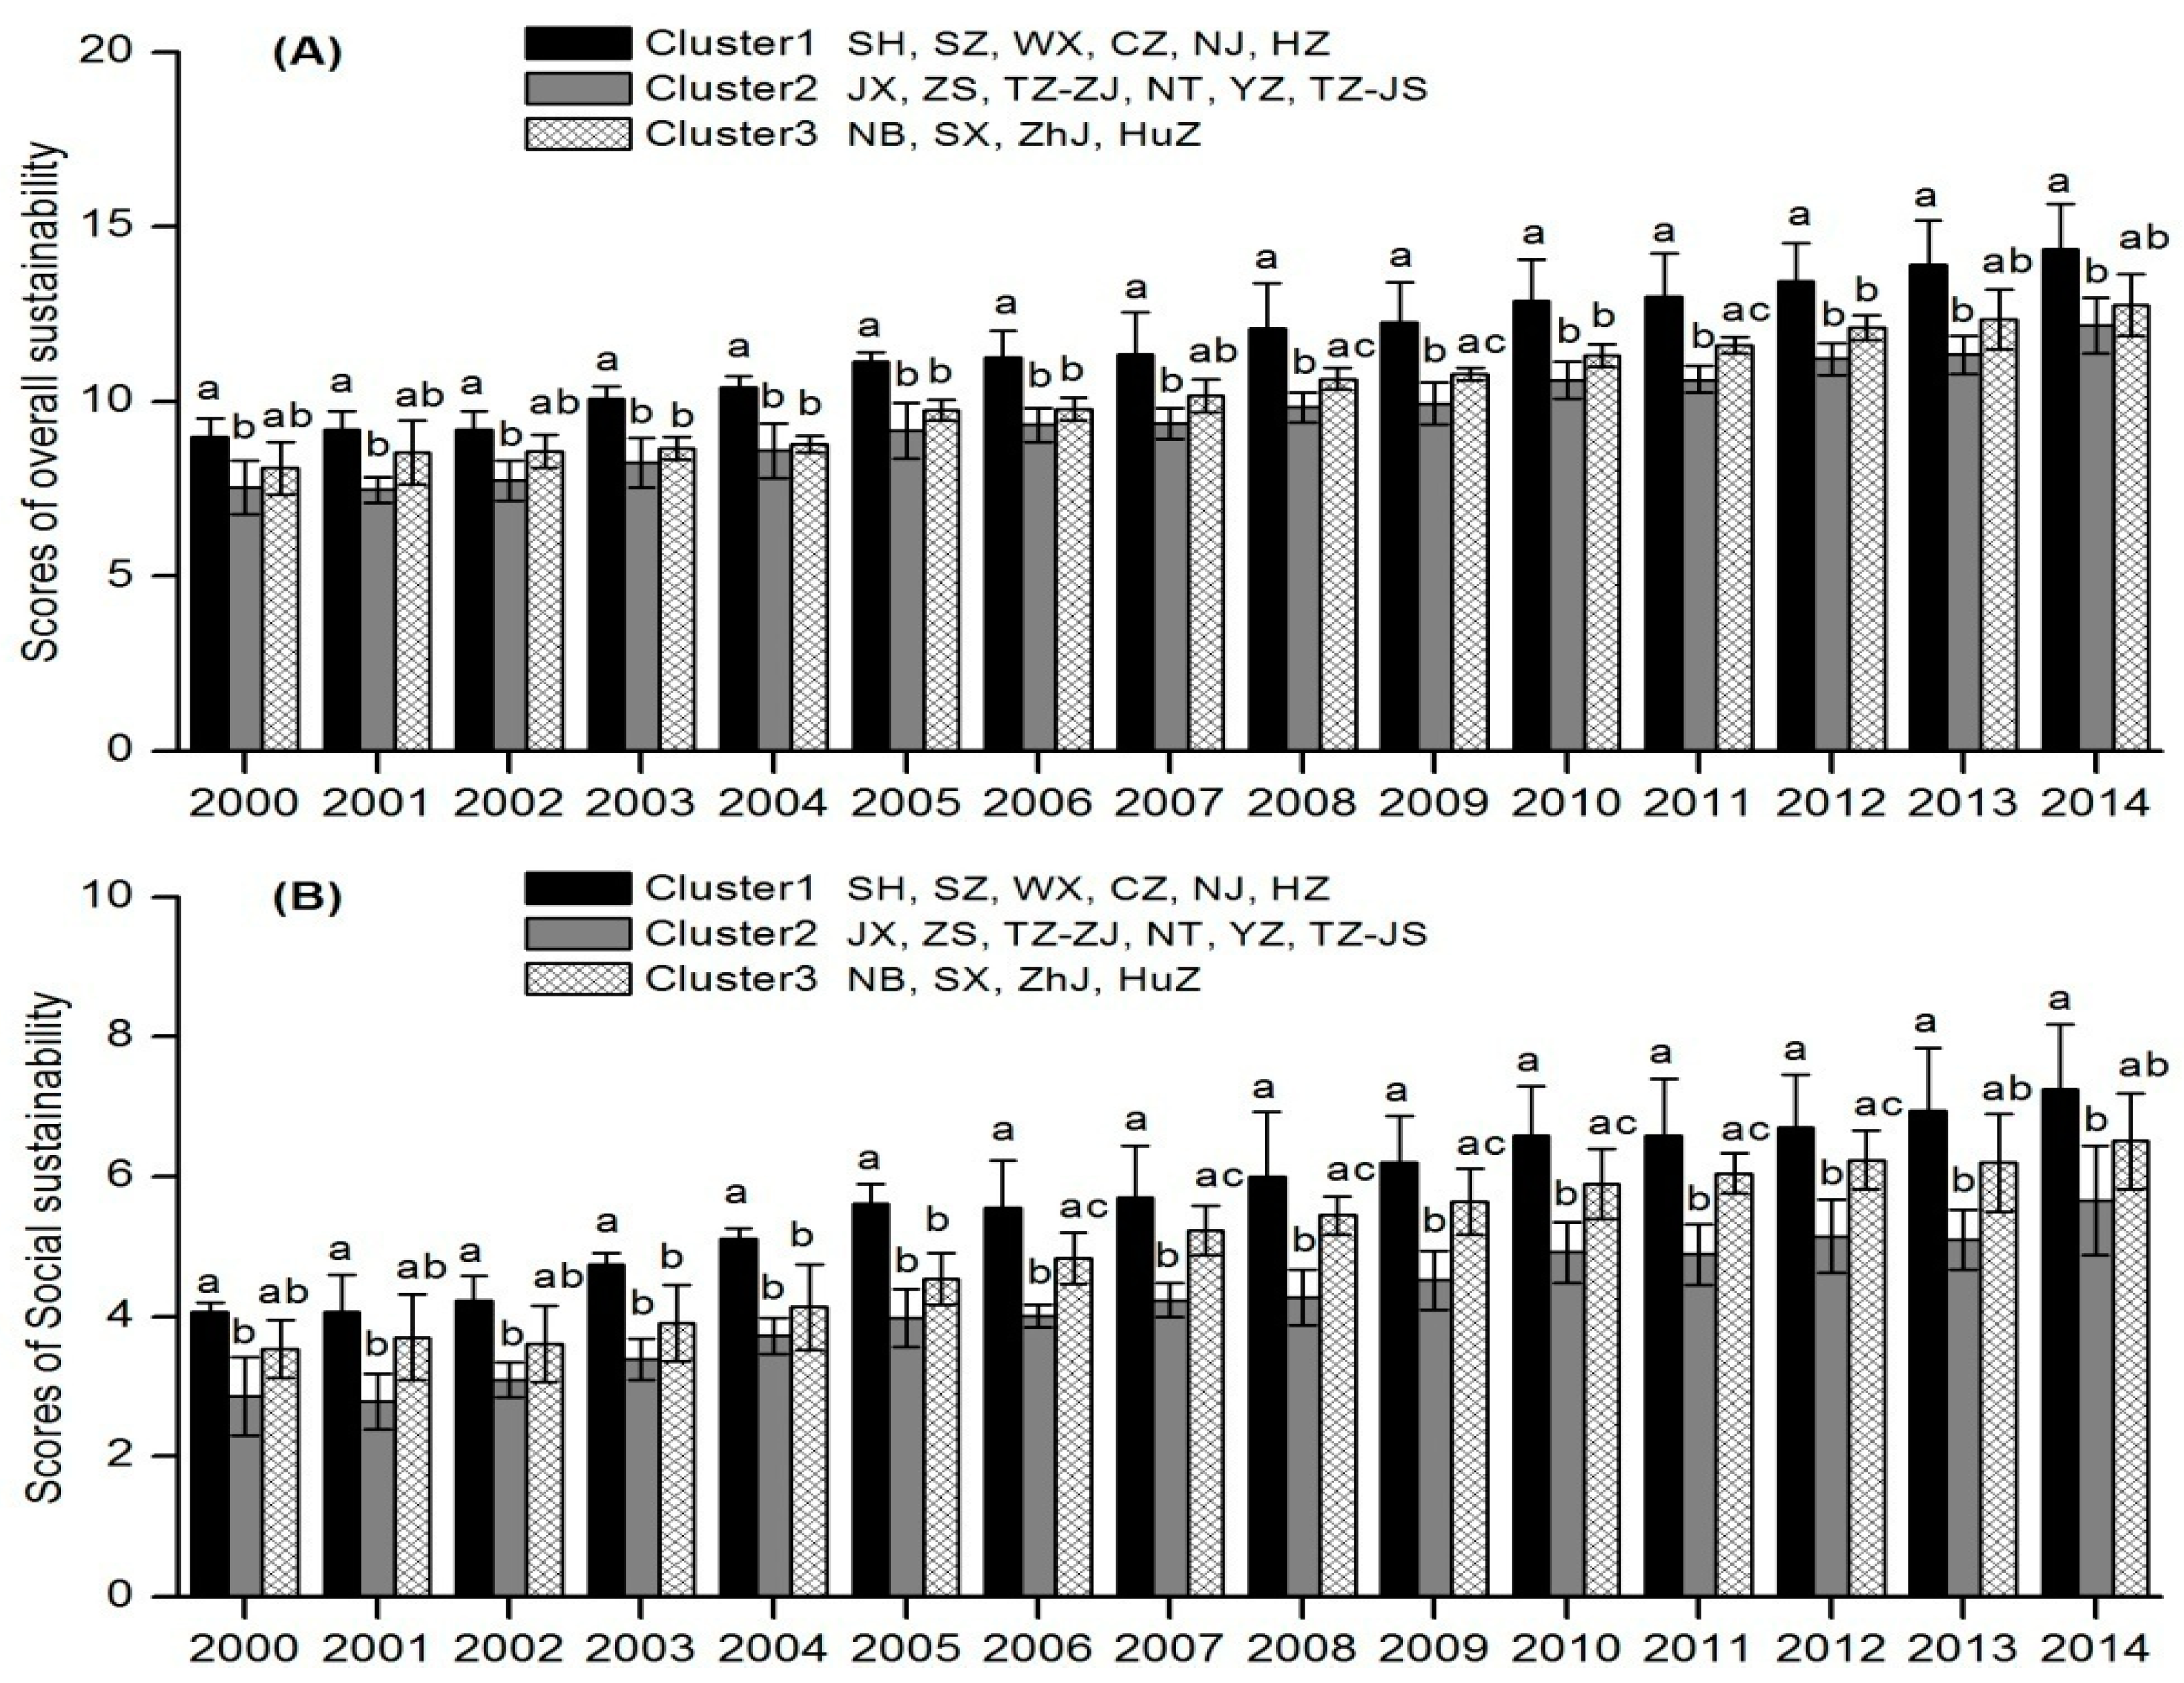
3.2. Urban Sustainability of Cities at the Provincial Scale

At the provincial level, the overall (OS), social (SS) and economic sustainability (EcS) scores of cities showed an upward trend from 2000 to 2014, the mutation year being 2007 (M-K statistics; Z values > 1.96; Figure 6). Conversely, the environmental sustainability (EnS) scores generally exhibited a downward trend, but without a significant mutation year (M-K statistics; Z values > 1.96; Figure 6). The majority of component indicators of SS, EnS and EcS showed the same trend with that of the three dimensions of sustainability through time. In the social dimension, the values of IncomR *, Housing and Electrification were higher than 0.5 during the majority study period, indicating their good performance in social equity, living conditions and electrification compared with the prefectural cities (Figure 5). Similarly, the two provinces generally performed well in the urban green spaces in the environmental dimension (Figure 5), as well as water consumption efficiency (WatCon *), the attainment rate of urban industrial waste water (SewTrt) and the comprehensively utilized industrial solid waste (ISWU) in the economic dimension during the majority of study period (Figure 5). However, the values of the majority of component indicators of SS (e.g., healthcare, education, part of infrastructure building and telecommunication) and nearly all the component indicators of EnS and EcS were less than 0.5, indicating their relative poor performances (Figure 5).

4. Discussion

4.1. How Did Different Sustainability Dimensions Change over Time?

Our results showed that the society and economy of all the cities in central YRD at both provincial and prefectural levels evolved toward sustainable during the study period. The increased scores of SS were probably attributed to the improvement of healthcare (Hospbed), living conditions (Housing), higher education achievement (Education) and telecommunication (Cellphone). The increased GDP per capita, material consumption efficiency (PowCon * and WatCon *), accessibility of energy use (DmElcCon) and waste generation and management (SewTrt and ISWU) made large contribution to the increase of scores of EcS. However, the social inequality and population pressure (indicated by the decrease of IncomR * and PopP *) also increased with social development, which was consistent with the sustainable urban development reality of Chinese cities in previous studies [16,47]. Meanwhile, although urban green spaces increased through time, most component indicators of EnS decreased through time, and thus the EnS scores also decreased, indicating weak sustainability. Chinese governments have strived to develop the public transportation network and urban green spaces to reduce traffic congestion and pollutant emissions [47]. Besides, the increased urban green spaces were partly a consequence of the development of “eco-cities” or “green cities” proposed by the Chinese governments [16]. However, the reality is that, the greenery of the city might enhance urban ecosystem services but not necessarily sustainability in the social, environmental and economic dimensions [3,9], which was also proven for the decreased EnS in our study.
The mutation year of the evolvement of SS and EcS was during 2007–2009. The main reason might be that the global financial crisis triggered by the U.S. subprime mortgage crisis since 2007 caused the decline of YRD’s economic growth and gradually spread into the non-financial sector (i.e., society) [48]. In our study, the economic and social growth of majority of prefectural cities slowed down after 2007 (Figure 4 and Figure 6).
Furthermore, our results showed that the development of three sustainability dimensions of cities in central YRD at both provincial and prefectural levels was not synchronized, i.e., an upward trend for social and economic dimensions but downward trend for environmental dimension. This implied that the cities in central YRD did not achieve “genuine sustainability”, as social and economic progress was at the expense of the environment, consistent with the findings in Chinese urban agglomerations or megacities by Liu and Liu [49] and Huang et al. [16]. The disharmonious development among SS, EnS and EcS was also observed in other Chinese cities [50]. The limited factors in EnS are mainly high industry pollution in our study. Due to data availability, we did not consider air pollution, soil pollution and water pollution, which also widely occur in YRD and should be added in further study for accurate reflection of EnS.

4.2. How Did Different Sustainability Dimensions Differ with Spatial Scales?

Although the component indicators of SS, EnS and EcS changed differently at different spatial scales (Figure 5), a clear ranking and classification of cities could be found at each scale and across scales. Firstly, at the prefectural city scale, three distinct city clusters were found according to their different sustainability dimension performance: Cluster 1 with high SS, EnC and low EnS (i.e., SH, SZ, WX, CZ, NJ, and HZ); Cluster 3 with moderate SS, EcS and EnS (JX, ZS, TZ-ZJ, NT, YZ, and TZ-JS); and Cluster 2 with low SS, EcS and high EnS (NB, ZhJ, SX, and HuZ). These findings largely concurred with the city’s development according to the China sustainable cities report in 2015 [51], of which 16 cities of central YRD fell into four categories: (I) less sustainable development cities with low ecological input (EI) and human development (HD), including SH, SZ, HZ and NJ; (II) sustainable development cities with low EI and High HD, including WX and CZ; (III) less sustainable development cities with high EI and high HD, including JX, TZ-ZJ, YZ, TZ-JS, NT, SX and ZhJ; and (IV) unsustainable development cities with high EI and low HD, including NB, HuZ and ZS. Specifically, Cluster 1 in our study corresponds to the Groups I and II, while Clusters 2 and 3 correspond to the Groups IV and III, respectively. Besides, the cities in Cluster 1 were either economically developed with high population density (SH), industrially developed (SZ, WX, CZ, and NJ) or agriculturally developed (HZ), partly consistent with Zhang and coworkers’ [52] finding that industrial activities, population trends and land use patterns affect urban sustainability performance. However, cities with stronger economic development are not necessarily those cities with faster improvement in sustainability, which was pointed out by Michael et al. [53] and proven by our study (e.g. Cluster 2 and Cluster 3). Secondly, the mean values of the component indicators of SS, EnS and EcS at the provincial level were relatively lower compared with prefectural cities, falling somewhere between Cluster 2 and Cluster 3, indicating less sustainable or unsustainable development.

4.3. Implications for Sustainable Development in the YRD Region

Based on the findings of our study, we make the following suggestions to promote urban sustainable development in the YRD region:
  • Firstly, the government should set short-term and long-term goals of sustainable development for cities. From strong sustainability perspective, the environmental development should be put in the first place in the long run, as a city cannot make genuine development without a healthy environment [8]. Meanwhile, realistic goals in the short run are also needed, based on the failures of sustainable development of YRD indicated by our study.
  • Secondly, the government should combine development of cities at multiple scales to obtain sustainable development of YRD. As Bell and Morse [25] pointed out, “…the spatial scale is clearly very important when one attempts to put sustainability into practice or when one judges the level of sustainability of an existing system”.
  • Thirdly, the GDP-based political performance of local government should be replaced. During the past decades, the blind pursuit of GDP caused excessive urban expansion in China [54] and, subsequently, many environmental problems. A new index, for example, natural resource consumption per GDP should be considered in the future.

5. Conclusions

We assessed urban sustainability of central YRD from 2000 to 2014 from two spatial scales as well as hierarchical administrative levels of province and prefecture, using a multi-scale perspective and well-established theme-based indicator framework. Our study showed that cities of central YRD at the two studied scales became less sustainable or unsustainable, as the social and economic development was at the expense of the environment. The three sustainability dimensions of society, environment and economy changed over time and differed among cities at different hierarchical levels. In addition, the level of urban sustainability at the provincial level was lower than that at the prefectural level, indicating the uncoordinated development of urban sustainability at the two administrative levels. In addition, the theme-based indicator framework used in this study revealed the evolution of the sustainability of YRD and can provide helpful information to decision-makers and different stakeholders when considering sustainability.

Acknowledgments

We would like to thank Jianguo Wu from Arizona State University for his constructive suggestions and revisions. This work was supported by the National Key R&D Program of China (No. 2017YFC0505701) and the National Natural Science Foundation of China (No. 31370482) to Junxiang Li; and was partially supported by the National Natural Science Foundation of China (No. 41501203); Science and Technology Project of Guangdong Province, China (2016A020223009); Project of Science and Technology Innovation Platform of Guangdong Province, China (2015B070701017); and SPICC Program (2016GDASPT-0105) to Cheng. Li.

Author Contributions

Cheng Li and Junxiang Li conceived and designed the study. Cheng Li collected and processed the data, performed analysis and wrote the manuscript. Junxiang Li improved the manuscript.

Conflicts of Interest

The authors declare no conflict of interest.

References

  1. Ding, X.H.; Zhong, W.Z.; Shearmur, R.G.; Zhang, X.L.; Huisingh, D. An inclusive model for assessing the sustainability of cities in developing countries—Trinity of Cities’ Sustainability from Spatial, Logical and Time Dimensions (TCS-SLTD). J. Clean. Prod. 2015, 109, 62–75. [Google Scholar] [CrossRef]
  2. United Nation. World Urbanization Prospects: The 2011 Revision. Available online: http://www.un.org/en/development/desa/publications/world-urbanization-prospects-the-2011-revision.html (accessed on 20 March 2016).
  3. Wu, J.G. Urban ecology and sustainability: The state-of-the-science and future directions. Landsc. Urban Plan. 2014, 125, 209–221. [Google Scholar] [CrossRef]
  4. Wu, J.G.; Xiang, W.N.; Zhao, J.Z. Urban ecology in China: Historical developments and future directions. Landsc. Urban Plan. 2014, 125, 222–233. [Google Scholar] [CrossRef]
  5. Cakir, G.; Un, C.; Baskent, E.Z.; Kose, S.; Sivrikaya, F.; Keles, S. Evaluating Urbanization, Fragmentation and Land Use/Land Cover Change Pattern in Istanbul City, Turkey from 1971 to 2002. Land Degrad. Dev. 2008, 19, 663–675. [Google Scholar] [CrossRef]
  6. Grimm, N.B.; Faeth, S.H.; Golubiewski, N.E.; Redman, C.L.; Wu, J.; Bai, X.; Briggs, J.M. Global Change and the Ecology of Cities. Science 2008, 319, 756–760. [Google Scholar] [CrossRef] [PubMed]
  7. Bugliarello, G. The future of urban sustainability. Sustainability 2010, 3, 351–359. [Google Scholar] [CrossRef]
  8. Huang, L.; Wu, J.G.; Yan, L.J. Defining and measuring urban sustainability: A review of indicators. Landsc. Ecol. 2015, 30, 1175–1193. [Google Scholar] [CrossRef]
  9. Wu, J.G. Landscape sustainability science: Ecosystem services and human well-being in changing landscapes. Landsc. Ecol. 2013, 28, 999–1023. [Google Scholar] [CrossRef]
  10. Alberti, M. Measuring urban sustainable. Environ. Impact. Assess. Rev. 1996, 16, 381–424. [Google Scholar] [CrossRef]
  11. World Commission on Environment and Development (WCED). Our Common Future; Oxford University Press: Oxford, UK, 1987. [Google Scholar]
  12. Dizdaroglu, D. Developing micro-level urban ecosystem indicators for sustainability assessment. Environ. Impact Assess. Rev. 2015, 54, 119–124. [Google Scholar] [CrossRef]
  13. Kates, R.W.; Clark, W.C.; Corell, R.; Hall, J.M.; Jaeger, C.C.; Lowe, I.; McCarthy, J.J.; Schellnhuber, H.J.; Bolin, B.; Dickson, N.M.; et al. Environment and development: Sustainability science. Science 2001, 292, 641–642. [Google Scholar] [CrossRef] [PubMed]
  14. Kates, R.W.; Parris, T.M. Long-term trends and a sustainability transition. Proc. Natl. Acad. Sci. USA 2003, 100, 8062–8067. [Google Scholar] [CrossRef] [PubMed]
  15. Wu, J.G. Landscape ecology, cross-disciplinarity, and sustainability science. Landsc. Ecol. 2006, 21, 1–4. [Google Scholar] [CrossRef]
  16. Huang, L.; Yan, L.J.; Wu, J.G. Assessing urban sustainability of Chinese megacities: 35 years after the economic reform and open-door policy. Landsc. Urban Plan. 2016, 145, 57–70. [Google Scholar] [CrossRef]
  17. Ness, B. Managing urban futures: Sustainability and urban growth in developing countries. Eur. Plan. Stud. 2007, 15, 167–168. [Google Scholar] [CrossRef]
  18. Wu, J.; Wu, T. Sustainability indicators and indices. In Handbook of Sustainable Management; Christian, N.M., Kuei, C., Eds.; Imperial College Press: London, UK, 2012; pp. 65–86. [Google Scholar]
  19. Parris, T.M.; Kates, R.W. Characterizing a sustainability transition: Goals, targets, trends, and driving forces. Proc. Natl. Acad. Sci. USA 2003, 100, 8068–8073. [Google Scholar] [CrossRef] [PubMed]
  20. Singh, R.K.; Murty, H.R.; Gupta, S.K.; Dikshit, A.K. An overview of sustainability assessment methodologies. Ecol. Indic. 2009, 9, 189–212. [Google Scholar] [CrossRef]
  21. UNCSD (The United Nations Commission on Sustainable Development). Indicators of Sustainable Development: Guidelines and Methodologies; United Nations: New York, NY, USA, 2001. [Google Scholar]
  22. Li, J.; Pu, L.; Zhu, M.; Liao, Q.; Wang, H.; Cai, F. Spatial pattern of heavy metal concentration in the soil of rapid urbanization area: A case of Ehu Town, Wuxi City, Eastern China. Environ. Earth Sci. 2014, 71, 3355–3362. [Google Scholar] [CrossRef]
  23. Morris, K.I.; Chan, A.; Morris, K.J.K.; Ooi, M.C.G.; Oozeer, M.Y.; Abakr, Y.A.; Nadzir, M.S.M.; Mohammed, I.Y.; Al-Qrimli, H.F. Impact of urbanization level on the interactions of urban area, the urban climate, and human thermal comfort. Appl. Geogr. 2017, 79, 50–72. [Google Scholar] [CrossRef]
  24. Zhao, Y.; Wang, S.; Zhou, C. Understanding the relation between urbanization and the eco-environment in China’s Yangtze River Delta using an improved EKC model and coupling analysis. Sci. Total Environ. 2016, 571, 862–875. [Google Scholar] [CrossRef] [PubMed]
  25. Bell, S.; Morse, S. Sustainability Indicators: Measuring the Immeasurable, 2nd ed.; Earthsan: London, UK, 2008. [Google Scholar]
  26. Jiangsu Statistical Bureau. Jiangsu Statistical Yearbook; China Statistics Press: Beijing, China, 2015; ISBN 978-7-5037-7507-9. (In Chinese)
  27. Shanghai Statistical Bureau. Jiangsu Statistical Yearbook; China Statistics Press: Beijing, China, 2015; ISBN 978-7-5037-7518-5. (In Chinese)
  28. Zhejiang Statistical Bureau. Zhejiang Statistical Yearbook; China Statistics Press: Beijing, China, 2015; ISBN 978-7-5037-7510-9. (In Chinese)
  29. National Bureau of Statistics. China City Statistical Yearbook; China Statistics Press: Beijing, China, 2001–2015; ISBN 978-7-5037-7706-6. (In Chinese)
  30. Li, L.; Wu, J.; Yue, C.Y. Studies on the Index System and Comprehensive Evaluation of Urban Sustainable Development (I). J. Wuhan Urban Constr. Inst. 2000, 17, 30–35. [Google Scholar]
  31. Li, L.; Wu, J.; Yue, C.Y. Studies on the Index System and Comprehensive Evaluation of Urban Sustainable Development (II). J. Wuhan Urban Constr. Inst. 2000, 17, 1–6. [Google Scholar]
  32. Song, F.H. A study of the comprehensive evaluation index system of urban sustainable development. J. Xinjiang Univ. (Philos. Humanit. Soc. Sci.) 2008, 36, 15–18. (In Chinese) [Google Scholar]
  33. State Environmental Protection Agency. Indicators for Eco-County, Eco-City and Eco-Province Construction (Revised Draft). Available online: http://www.gdep.gov.cn/zcfg/bmguizhang/201309/t20130903_154923.html (accessed on 19 June 2010). (In Chinese)
  34. Xu, X.Q.; Zhang, J.J. Comprehensive evaluation of Guangzhou urban sustainable development. Acta Geogr. Sin. 2001, 56, 54–63. [Google Scholar]
  35. Zhang, F.; Wang, Y.J.; Fang, C.L.; Jian, D.H. Urban sustainable development evaluation indices and basic models for cities in Jiangsu. J. Realism 2005, 7, 4–7. [Google Scholar]
  36. Alpopi, C.; Manole, C.; Colesca, S.E. Assessment of the sustainable urban development level through the use of indicators of sustainability. Theor. Empir. Res. 2011, 6, 78–87. [Google Scholar]
  37. Wilson, M.C.; Wu, J.G. The problems of weak sustainability and associated indicators. Int. J. Sustain. Dev. World Ecol. 2016. Available online: http://dx.doi.org/10.1080/13504509.2015.1136360 (accessed on 20 June 2017). [CrossRef]
  38. Song, Y.C.; Qi, R.H.; You, W.H.; Wang, X.R.; Zhu, L.B. A study on indices system and assessment criterion of Eco-city. Urban. Environ. Urban Ecol. 1999, 12, 16–19. (In Chinese) [Google Scholar]
  39. Gilbert, R.O. Statistical Methods for Environmental Pollution Monitoring; Wiley: Hoboken, NJ, USA, 1987; ISBN 978-0471288787. [Google Scholar]
  40. Kendall, M.G. Rank Correlation Methods, 4th ed.; Charles Griffin: London, UK, 1975. [Google Scholar]
  41. Mann, H.B. Non-parametric tests against trend. Econometrica 1945, 13, 163–171. [Google Scholar] [CrossRef]
  42. Liu, S.M.; Wang, H.; Yan, D.H.; Ren, Q.F.; Wang, D.; Gong, B.Y. Analysis of spatiotemporal evolution of isolated rainstorm events in Huai River Basin, China. Adv. Meterol. 2017, 2017, 3010295. [Google Scholar] [CrossRef]
  43. Hamed, K.H. Trend detection in hydrologic data: The Mann-Kendall trend test under the scaling hypothesis. J. Hydrol. 2008, 349, 350–363. [Google Scholar] [CrossRef]
  44. Bari, S.H.; Rahman, M.T.U.; Hoque, M.A.; Hussain, M.M. Analysis of seasonal and annual rainfall trends in the northern region of Bangladesh. Atmos. Res. 2016, 176–177, 148–158. [Google Scholar] [CrossRef]
  45. Gu, Z.J.; Duan, X.W.; Liu, B.; Hu, J.M.; He, J.N. The spatial distribution and temporal variation of rainfall erosivity in the Yunnan Plateau, Southwest China: 1960–2012. Catena 2016, 145, 291–300. [Google Scholar]
  46. Lutz, S.R.; Mallucci, S.; Diamantini, E.; Majone, B.; Bellin, A.; Merz, R. Hydroclimatic and water quality trends across three Mediterranean river basins. Sci. Total Environ. 2016, 571, 1392–1406. [Google Scholar] [CrossRef] [PubMed]
  47. Xiao, G.; Xue, L.; Woetzel, J. The Urban Sustainability Index: A New Tool for Measuring China’s Cities. Available online: http://www.urbanchinainitiative.org/en/resources/report_2.html (accessed on 20 March 2016).
  48. Blue book of Yangtze River Delta. The First Transition in the Yangtze River Delta; Social Sciences Academic Press: Beijing, China, 2010; ISBN 978-7-5097-1489-8. [Google Scholar]
  49. Liu, S.L.; Liu, X.J. Blue Book of Mega-City Regions: Report on China Mega-City Regions Development Index in 2013; Social Sciences Academic Press: Beijing, China, 2013; ISBN 978-7-5097-5094-0. [Google Scholar]
  50. Cai, C.M.; Shang, J.C. Comprehensive evaluation on urban sustainable development of Harbin city in Northeast China. J. Geogr. Sci. 2009, 19, 144–150. [Google Scholar] [CrossRef]
  51. UNDP (United Nations Development Programme). China Sustainable Cities Report: Measuring Ecological and Human Development; UNDP: Beijing, China, 2016. [Google Scholar]
  52. Zhang, H.Y.; Michinori, U.; Keishiro, H.; Helmut, Y. Land use change patterns and sustainable urban development in China. J. Asian Architect. Build. Eng. 2010, 138, 131–138. [Google Scholar] [CrossRef]
  53. Michael, F.L.; Noor, Z.Z.; Figueroa, M.J. Review of urban sustainability indicators assessment—Case study between Asian countries. Habitat. Int. 2014, 44, 491–500. [Google Scholar] [CrossRef]
  54. Ma, Q.; He, C.Y.; Wu, J.G. Behind the rapid expansion of urban impervious surfaces in China: Major influencing factors revealed by a hierarchical multiscale analysis. Land Use Policy 2016, 59, 434–445. [Google Scholar] [CrossRef]
Figure 1. Location of the central Yangtze River Delta (YRD) in China and the urban landscape hierarchy used for analysis.
Sustainability 09 02072 g001
Figure 2. Dendrogram of hierarchical cluster analysis (Ward Method) for overall (OS), social (SS), environmental (EnS) and economic (EcS) sustainability of sixteen prefectural cities from 2000 to 2014.
Sustainability 09 02072 g002
Figure 3. Mean and standard deviation of: overall (A); social (B); environmental (C); and economic (D) sustainability scores of the three city clusters from 2000 to 2014.
Sustainability 09 02072 g003aSustainability 09 02072 g003b
Figure 4. The MK statistics of overall (AC), social (DF), environmental (GI), and economic (JL) sustainability scores of representative city in city Cluster 1 (A,D,G,J), Cluster 2 (B,E,H,K) and Cluster 3 (C,F,I,L) at the prefectural level from 2000 to 2014. UF in the legend represents the statistical amount of positive sample sequences, while UB is the statistical amount of negative sample sequences; the following is the same.
Sustainability 09 02072 g004aSustainability 09 02072 g004b
Figure 5. Mean values of the sustainability indicators in social (AC), environmental (DF) and economic (GI) dimensions for three city clusters at the prefectural level (Cluster 1 (C1), Cluster 2 (C2), and Cluster 3 (C3)) and cities at the provincial level (P) from 2000 to 2014.
Sustainability 09 02072 g005
Figure 6. The M-K statistics of the overall (OS), social (SS), environmental (EnS) and economic sustainability (EcS) scores of cities at the provincial level from 2000 to 2014.
Sustainability 09 02072 g006
Table 1. List of selected indicators for urban sustainability assessment, covering the three dimensions of environment, economy, and society.
ThemeSub-ThemeIndicatorsUnitReferences or Data Source
SocietyEquityPovertyUnemployment rate(the registered urban unemployment rate) (Poverty *)%[21,29]
Social equityRatio of urban residents’ income to rural residents’ income (IncomR *)%[38]
HealthHealthcareNumber of hospital beds per 10,000 inhabitants (HospBed)/[38]
EducationHigher education achievement levelNumber of higher education enrolled students per 10,000 inhabitants (Education)/[33]
HousingLiving conditionsThe housing construction area per capita in urban proper (Housing)m2[21]
PopulationPopulation changeNatural population growth rate (PopC *)[21]
Population pressurePopulation density (PopP)Person/km2[21]
InfrastructureRoadRoad pavement area per person in urban proper (Road)m2/person[10]
Public transport serviceNumber of buses and trolleybuses per 10,000 population (Buses)/[30,31,32]
ElectrificationPercent of population using natural gas, coal gas, liquid gas, industrial gas and industrial gas (Electrific)%[33]
TelecommunicationInformation accessNumber of internet subscribers per 10,000 inhabitants (Internet)/[29]
Communication infrastructureNumber of cellphone subscribers per 10,000 inhabitants (Cellphone)/[29]
Main telephone lines per 10,000 inhabitants (Telephone)/[21]
EnvironmentLandAgricultureArable and permanent crop land area per capita (Agriculture)m2[21]
UrbanizationThe proportion of urban construction land in urban proper (Constru *)%[21]
BiodiversityEcosystemGreen area per capita in urban proper (GreenPC)m2/person[10]
Urban greening coverage in built up area (Green)%[29]
Industrial “three wastes” emissionsIndustrial wastewater dischargeIndustrial wastewater discharge per unit administrative area (Wastwat *)×104 t/km2[10]
Industrial waste gas emissionIndustrial SO2 emission per unit administrative area (SO2 *)t/km2[29]
Industrial dust emission per unit administrative area (Dust *)t/km2[29]
Industrial solid waste dischargeIndustrial solid waste discharge per unit administrative area (Soildwst *)t/km2[29]
EconomyEconomic structureEconomic performanceGDP per capita (GDP)yuan[21]
Balance of trade in goods and servicesThe actual use of foreign investment accounted for GDP (ForCap)%[35]
Industrial structureThe third industry accounted for the proportion of GDP (ThdInd)%[35]
Consumption and production patternsMaterial consumptionPower consumption per unit GDP (PowCon *)kwh/×104 yuan[33,34]
Water consumption per unit GDP (WatCon *)t/×104 yuan[33]
Energy useResidents’ domestic electricity consumption per capita in urban proper (DmWtCon)kwh/person[10]
Residents’ domestic water consumption per capita in urban proper (DmElcCon)t/person[29]
Waste recycling and reuseThe output value of products made from “three wastes” by comprehensive utilization accounted for GDP (WstRcy)%[29]
Waste generation and managementThe attainment rate of urban industrial waste water (SewTrt)%[29]
The rate of comprehensively utilized industrial solid waste (ISWU)%[29]
* The indicators were reciprocated before the normalization.

