Article

The Concept of Caloric Unequal Exchange and Its Relevance for Food System Analysis: The Ecuador Case Study

1
Grupo de Población y Ambiente, Universidad Regional Amazónica Ikiam, Vía Muyuna-Atacapi, Km.7, Tena 150102, Ecuador
2
Departamento de Desarrollo, Ambiente y Territorio, Facultad Latinoamericana de Ciencias Sociales (FLACSO), La Pradera E7-174 y Diego de Almagro, Quito 170518, Ecuador
*
Author to whom correspondence should be addressed.
Sustainability 2017, 9(11), 2068; https://doi.org/10.3390/su9112068
Submission received: 23 October 2017 / Revised: 6 November 2017 / Accepted: 8 November 2017 / Published: 10 November 2017

Abstract

:
The impact of food production patterns and food supply upon consumption patterns is usually explained by economies of scale and affordability. Less attention is given to food trade patterns and global insertion of economies affecting dietary changes. This paper contributes to the discussion using the concept of caloric unequal exchange that defines the deterioration of terms of trade in food in units of calories and complements studies on unequal exchange and ecologically unequal exchange. A new perspective to food systems’ analysis is achieved by using this concept. This paper uses the case study of Ecuador to exemplify its potentiality. Exports and imports to and from Ecuador are analyzed for the period 1988 through 2013 in volume, value, and calories, for different groups of products. The conclusion is that Ecuador is increasingly helping to feed the world, at a caloric cost that is decreasing over time. There is a deterioration of the terms of trade of traded food in terms of calories for Ecuador of more than 250% between 1986 and 2013.

1. Introduction

Changes in consumption patterns are usually referred to as being caused by changes in preferences in consumers [1] or certain constraints, such as those of a budgetary nature [2]. Acknowledging the relevance of demand-side determinants for consumption, we believe the role a country plays in international trade may also be a determinant. A country’s global positioning in trade, concentrated in certain products, may well induce changes in production patterns, which may have an effect, subsequently, on the domestic supply of food products. The traditional way we look at food systems, in terms of supply and demand, seems limited to us. Data in terms of volume and value may well be complemented with data on the relative cost to the calorie of both imports and exports, what we call caloric unequal exchange. In this way, we can have a different look to the concept of domestic availability which links to other concepts such as food sovereignty. The change in domestic availability (and very often affordability) may also induce changes in consumption patterns. With this consideration in mind, the aim of the paper is twofold: (1) to explore the existence of caloric unequal exchange for Ecuador as defined by a recent study [3]; and (2) to explore the links between changes in food consumption patterns, international trade and domestic production of food products.
In order to respond to the two objectives of the paper, we use the recently introduced concept of caloric unequal exchange, defined as the deterioration in the terms of trade of food traded when considering the cost of exported and imported calories [3], and explained with detail in Section 2. The study originally introducing the concept focused on Latin America and the Caribbean as a block, showing that, even if calories exported were more expensive than those imported, there was a deterioration of the terms of trade since 1961 and the region was increasingly feeding the rest of the world at ever cheaper costs to the calorie. This went along with an increased volume (and value) of exports, making explicit the recent turn, to intensify the international insertion of the region as a provider of commodities to the rest of the world. This international insertion is seen by some as positive from an economic point of view. However, the impacts upon the environment in terms of soil deterioration, export of nutrients, and increased energy consumption and CO2 emissions from those exports, are still not clear as there are only a few studies that analyze the loss of nutrients involved in food exports [4].
The concept of caloric unequal exchange is introduced and deeply discussed in an earlier study [3]. Therefore, we will only summarize here that discussion and its relevance as a new metrics. The analysis of the deterioration of the terms of trade owes much to the tradition of the structuralists in Latin America, with authors like Prebish, Singer, Furtado, and later Emmanuel or Amin [5,6,7,8,9,10,11]. Based on those seminal studies, the concept gave rise to an ecological interpretation, ecologically unequal exchange, according to which exports of natural resources were not accounting for environmental externalities produced in exporting countries [12,13,14,15,16,17,18,19,20,21,22,23]. This fact made exports from developing countries implying a de facto transfer of wealth from poor to rich countries, something Muradian and Martínez-Alier call “cost-shifting-successes” [24]. Following this debate, many studies appeared worldwide, but with a particular emphasis in Latin America, to document the phenomenon [4,16,17,20,25,26,27,28,29,30,31,32,33,34,35,36,37,38,39].
The new twist to the debate is considering the application of the new concept of caloric unequal exchange. It expresses the deterioration in the terms of trade of food traded when considering the cost of exported or imported calories [3]. We believe that by using this concept we can combine the analysis of (global) food systems and food trade with discussions of nutritional issues, dietary quality and diversity, malnutrition, food security and sovereignty, and environmental concerns attached to production. It is true, however, that nutrition is not only a question of calories, however, we believe that calories can be used to bridge different scales of analysis. For instance, in the words of Falconí et al.: “Volume allows us to link the monetary value of food exports with production and therefore with land use and environmental impacts, as in ecologically unequal exchange. Calories allow us to link the former with nutrition. We are aware, though, that we are subject to simplification by using just one indicator, but we believe caloric unequal exchange may be expanded in the future to account for macro- and micro-nutrients” [3].
Under this new angle, the analysis of food systems and consumption patterns may look different than we expected. According to the literature, many authors point at income and price as determinants for diet changes worldwide [2]. Some authors add urbanization, market liberalization and foreign direct investment to the list of determinants [40]. Food agricultural imports worldwide grew between 1980 and 1995 at 5.3% per year, with processed food growing at 8.3% per year [2]. According to these authors, expenditure on meat, beverages, and fruits grew faster than on food staples such as cereals and legumes with increasing per capita income. They also argue that another determinant may be the supply side. There is a tendency to concentrate resources (land and labor) on those activities generating more accumulation, usually food for exports. We follow this line of argument to defend the link between food trade and consumption.
A result of globalization is greater availability and diversity of food [40]. However, changes in food production, procurement and distribution systems, and trade all affect availability and access. In turn, the authors argue, this brings changes in food culture towards homogenization, changing dietary patterns. As they recognize, poorer populations shift consumption towards poor-quality, energy-dense but cheap and affordable food products. This dietary convergence is reflected, for instance, in an increased consumption of fats, particularly from vegetable oils, an outcome we will also see for Ecuador. Another impact of globalization is an increase in meat consumption.
Another global trend observed is that of the increasing role of supermarkets in developing countries. A recent study for Ecuador notes that supermarkets are displacing open street markets in cities [41], which has led to a decrease in the availability (in terms of diversity and price) of affordable fresh fruits and vegetables for local residents, compared with those living in more popular neighborhoods in the outskirts with less access to supermarkets, which according to the authors, may be a likely explanation for an increase in prevalence of diabetes.
In their analysis of the effects of trade liberalization for diet and health in Central America, a study [42] found that liberalization did indeed increase the availability of food through imports, but also affected food availability through the promotion of domestic meat production. This, in turn, reflected in rising consumption of meat and dairy products. This nutrition transition seems to be related to rising rates of obesity and cardiovascular diseases [42]. Diets based on local staples are giving way to rising consumption of fats, animal products, and sweeteners. Their analysis suggests that trade liberalization is one factor facilitating the nutrition transition, lowering the price of meat products and dairy, and having detrimental impacts on health. Trade in food is, therefore, one of the drivers of the nutrition transition in which diets in low-income countries are becoming high in fats, sugar, and salt [43].
Some other research explores the links between international trade of food and its impact on the use of resources. This is the case of the analysis of virtual water trade embodied in agricultural products [23,44,45,46], or the upstream requirements of cropland embodied in international trade using an environmentally extended multi-region input-output analysis (MRIO) [47].
Moving to our case study, Ecuador was one of the countries most affected by the 2006 increases in food prices [48]. According to these authors, energy intakes in Latin America were reduced by an average of 8% from pre-crisis levels across the region. In Ecuador, unlike other Latin American countries, such reduction occurred across all wealth quintiles, with urban households being more affected than rural ones. Variability in calorie intake also decreased, a result we will also show here.
The Ecuadorian economy is also very open. According to data from the Central Bank of Ecuador, the trade openness index (exports plus imports over gross domestic product (GDP)) for the year 2010 was 84% [49]. Ecuadorian participation in global markets relies on the export of commodities with little value added and with prices set by international markets and demand. It also has a high degree of concentration of suppliers. For instance, in 2010, the US represented 28% of total imports in Ecuador. The same concentration occurs with food products traded internationally, as fruits represented 50.7% of exports in 2013, vegetable oil (basically palm oil) 31.7% and stimulants (coffee beans) 12.2%, that is, 94.6% of exports just in three product categories; on the other hand, cereals represented 61.5% of imports and vegetable oil (soy oil) 28.6%, that is, 90.1% of imports just in two product categories.
The structure of the rest of the paper is the following: Section 2 presents the materials and methods employed in the paper; Section 3 presents the results obtained, focusing on differential results by trading partner; Section 4 discusses the results in the frame of changes in the diet, and Section 5 concludes with the finding of deteriorating terms of trade, homogenization of diets and some policy recommendations with regards to food trade.

2. Materials and Methods

This study analyses food trade to and from Ecuador with the rest of the world and selected trade partners. The time window considered was selected based on the availability of data. For data on consumption, self-sufficiency, the variety of consumption, and terms of trade we use the period of 1988–2013.
The main source of data is the UN Food and Agriculture Organization Statistical Office, FAOSTAT [50]. We have used both the data on food trade as well as food balances. We present data in terms of volume, monetary values (in constant US$ from 2005) and calories (kcal). The reader can find all data and sources as Supplementary Materials in Table S1: CUEE Data.xlsx.
Data of the detailed matrix on food trade is grouped into the 74 food product groups as defined in the food balance. We then use Food and Agriculture Organization’s (FAO) 14 major food groups: cereals (excluding beer); sugar crops; sugars and syrups; pulses; tree nuts; oil crops; vegetable oils; vegetables; fruit (excluding wine); roots and tubers; stimulants; spices; alcoholic beverages; miscellaneous. In this way, we focus our analysis on those groups that are the most relevant for Ecuador in terms of consumption. The study disaggregates the analysis for six major food product groups according to their relative importance in terms of consumption: cereals; fruits; sugar and sweeteners; starchy roots; vegetable oils, and; pulses. We then used FAO’s food composition tables [51] to calculate the energy content of traded goods.
In this way, trade indicators (volume, monetary values or calories) for Ecuador can be expressed as:
X M = i = 1 n p i j t
where X = t o t a l e x p o r t s   o f   E c u a d o r ,   M = t o t a l i m p o r t s   o f   E c u a d o r ,     p i j t = exports from Ecuador of the product i to country j in year t ( X ) ; or, imports of Ecuador of the product i from country j in year t ( M ) .
Using the coefficients described above, we converted trade data (exports and imports) in volume into calories. In order to analyze the Prebish-Singer hypothesis [5,7] of the deterioration of the terms of trade in terms of calories, the average calorie content per 100 grams reported in the food composition tables was used as proxy for expressing exports and imports in terms of calories, for product i in the year t.
USD prices were applied for 2005; that is, adjusted to FAO’s value added deflator by country for agriculture, silviculture and fishing. The value of exported and imported calories were used for calculating the unit cost of calories exported and imported, which allowed us to compute the terms of trade in this way
T o T t = X US $ 2005 t / X kcal t M US $ 2005 t / M kcal t
where T o T stands for terms of trade, X total exports of the Ecuador, M total imports, while US $ 2005 and kcal denote the indicators adjusted to constant prices of 2005 and calories, respectively; and t , the year.
The interpretation of the indicator is the following. A value of one means that calories exported have the same cost as calories imported. A value larger than one means positive terms of trade, that is, exported calories are more expensive than imported ones. Therefore, the country needs fewer exports to cover for its imports. A value lower than one means negative terms of trade; the country will be compelled to export larger quantities in order to cover for its imports.
An indicator for self-sufficiency in food products was also calculated as one minus the share of imported calories over domestic consumption in terms of calories:
Self sufficiency t = ( 1 M kcal t C kcal t ) × 100
where C denotes domestic consumption of calories.
Finally, we calculated the level of concentration of products in consumption, measured in kcal, by a cumulative distribution of the relative share in consumption of each of the 74 products reported in the food balances.

3. Results

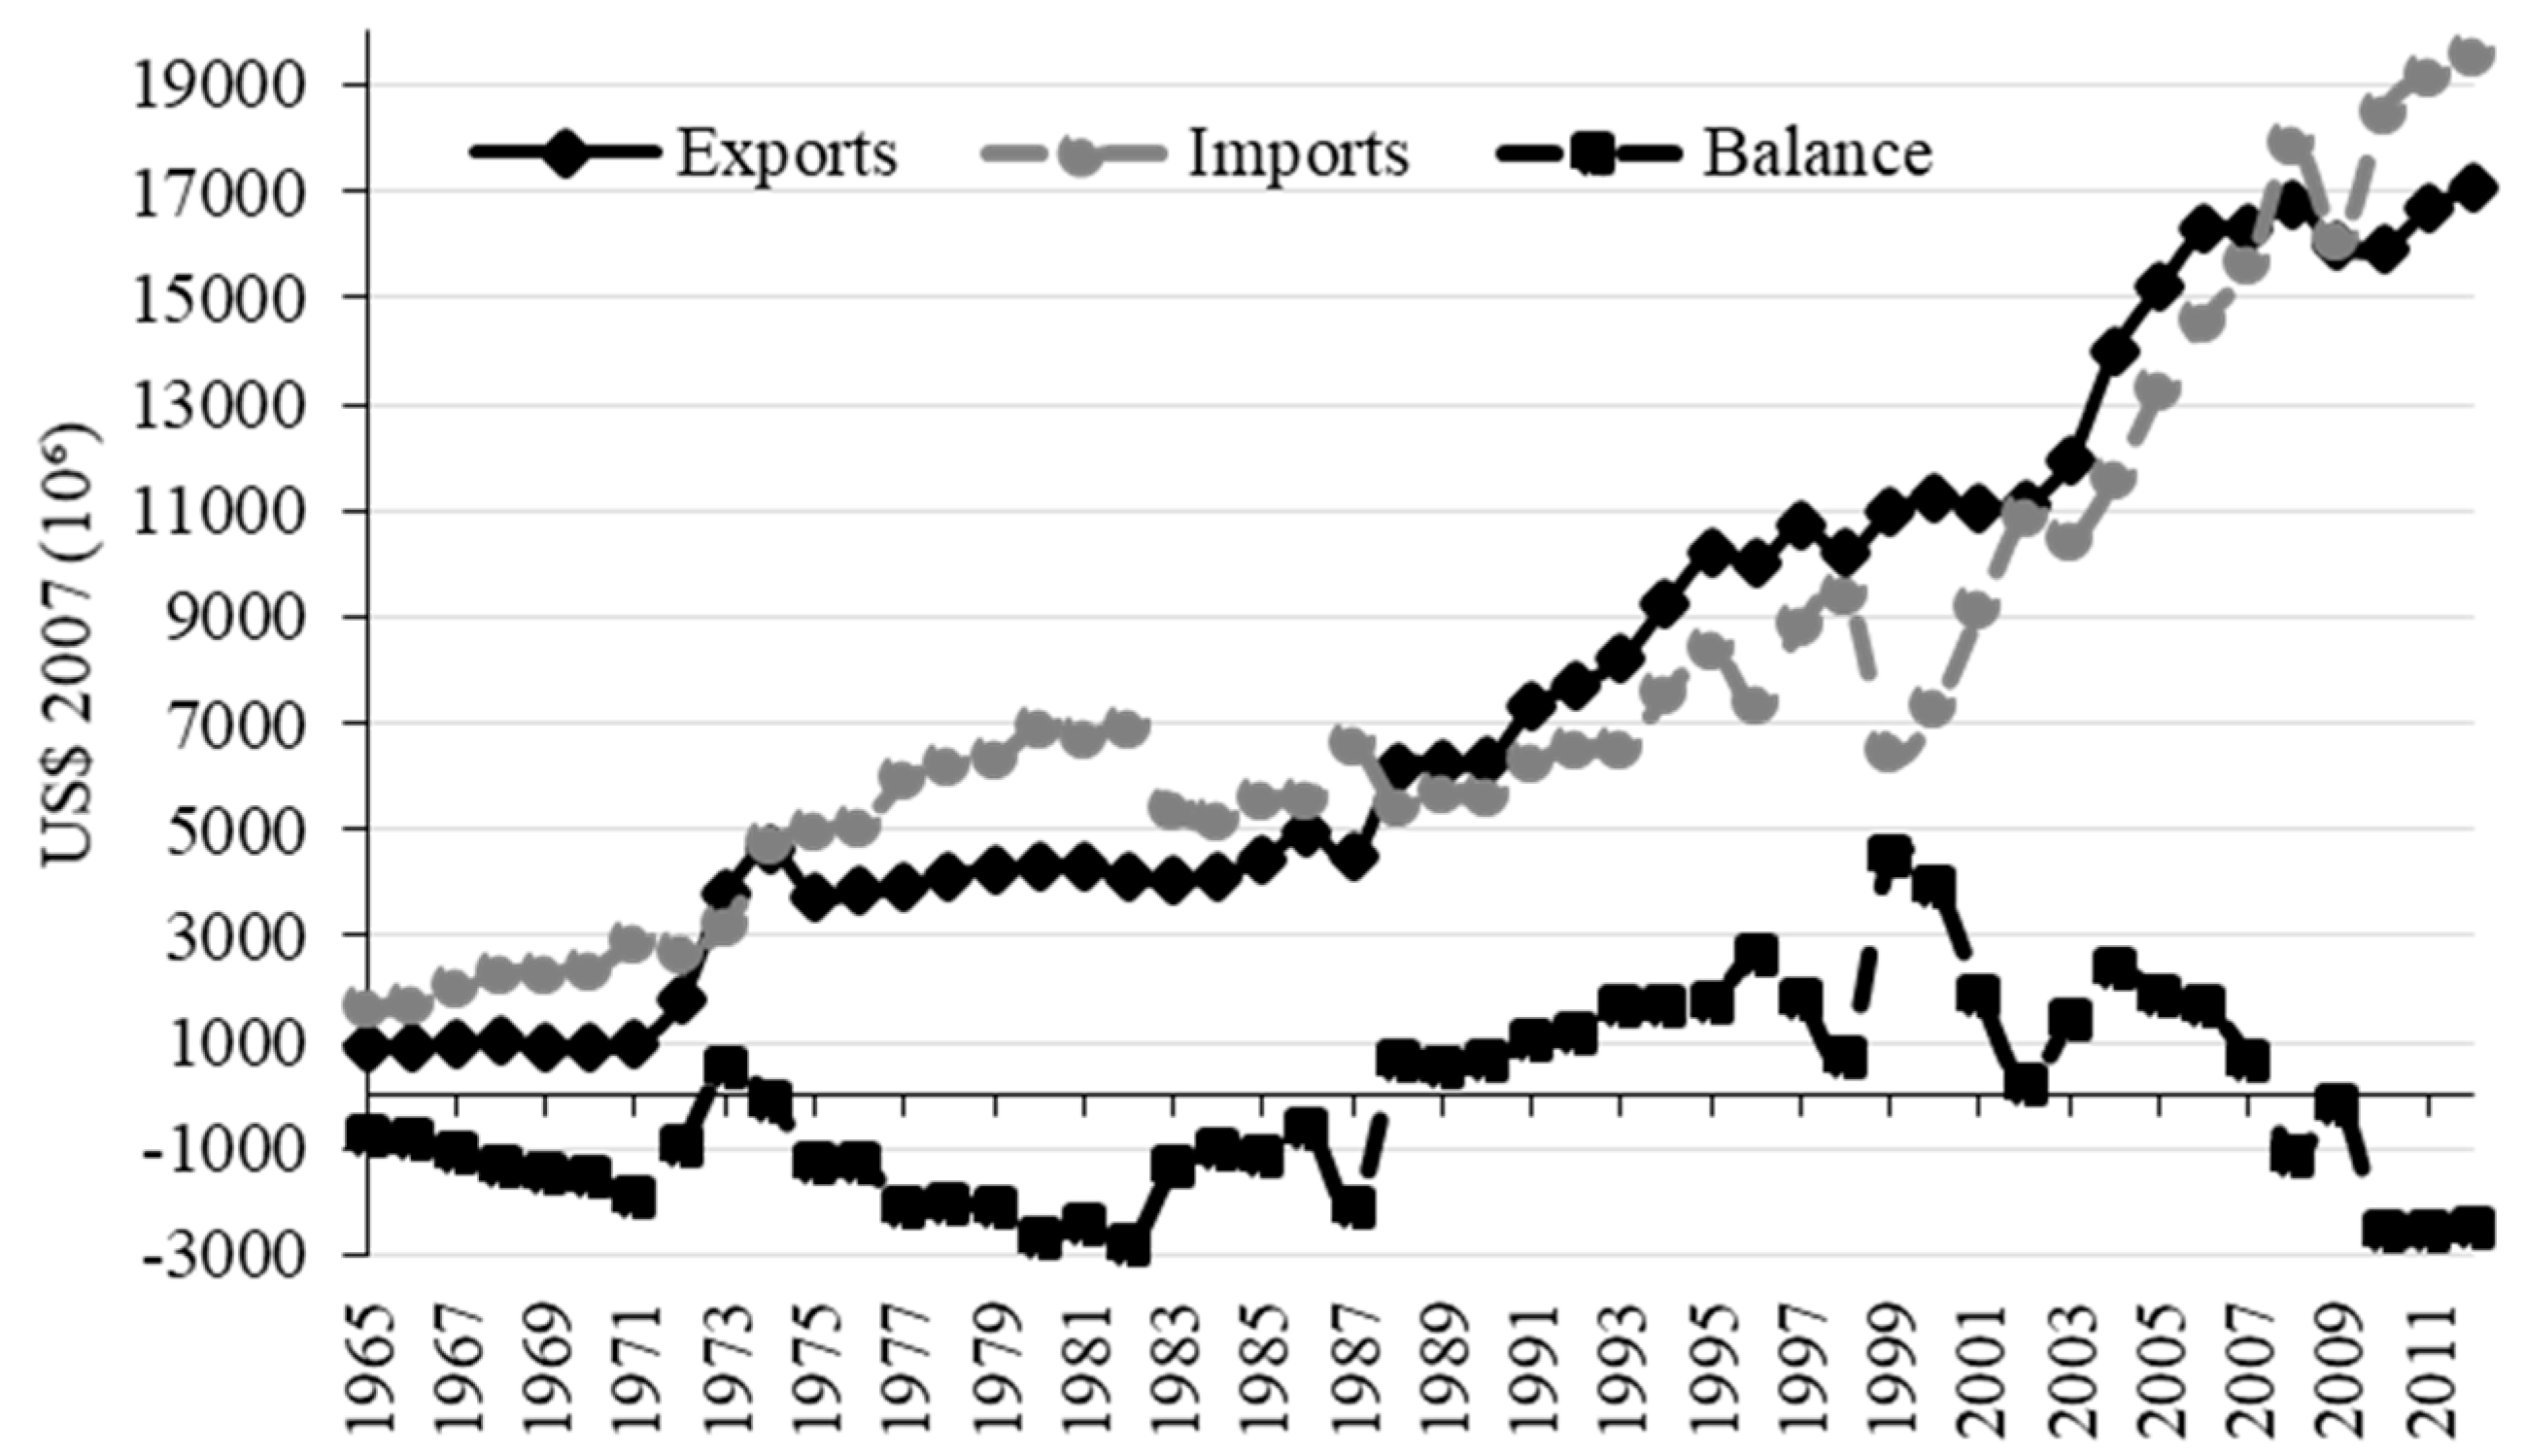
3.1. Ecuadorean International Trade Insertion

After years of political and economic instability, Ecuador eliminated the national currency in January 2000, adopting the dollar. This dollarization brought price stability to the country, although it was not enough to achieve political stability. The country reinforced its move towards neoliberal policies that resulted in a growing trade deficit over time, due to the lack of competitiveness of its economy upon lifting tariffs [49]. As seen in Figure 1, the dollarization induced an increase in imports, which initiated a phase of deterioration of the trade balance that is still present today due to the impossibility of using competitive devaluations to improve competitiveness.
The insertion of Ecuador in the world economy since then has suffered from two facts. On the one hand, the small scale of its economy prevents it from influencing world prices for commodities exported. On the other hand, the loss of monetary policy implied by dollarization prevented the country from using competitive devaluations for gaining market share. The outcome, for all products but particularly for food products, was an increase in volumes exported, as can be seen in Table 1 below.
Not only did Ecuador increase its exports, but its imports also rose after dollarization. The economy became very open to the global market. The openness index, a measure of the share of imports plus exports over GDP, went from 0.25 in 1965 to 0.57 in 2012, having reached a peak in the year 2008 with a value of 0.64. This vulnerability of the economy to the world markets, aggravated by the lack of industry in the country, implied an increase in food trade as well.
Table 1 presents the food trade balance (for the selected product groups) between Ecuador and the rest of the world for the period 1988 through 2013. Data is presented in volume, monetary value, and its conversion into calories. Exports in volume increased by 4.3 times their original size in the period, less than in terms of calories (5.3), whereas its monetary value increased by 7.9 times. In the case of imports, they increased by 2.1 times in terms of volume and calories, while they increased by 10.9 times in monetary terms.
During the 25-year period analyzed, Ecuador went from exporting double the amount of food that was imported in 1988 to exporting more than five times what was imported in 2013, in terms of volume. This is part of the re-primarization experienced by some of the Latin American economies [49].
As can be seen in Figure 2, Ecuador had a positive food trade balance for most of the period, with the notable exception of 1998. Between February 1997 and August 1998, Ecuador suffered the consequences of a severe El Niño Southern Oscillation (ENSO) phenomenon, which affected production and explains both the reduction of exports and increase in food imports. Another interesting observation is the role played by banana exports. As seen from the figure, banana exports accounted for almost half of food exports throughout the period and allowed the country to have a positive food trade balance.
Food consumption for the selected product groups in Ecuador is presented in Table 2, in absolute calories content, its share within total consumption and calories per capita. The main result observed here is the notable increase in the consumption of vegetable oil, which, in per capita terms, is almost three times higher at the end of the period, at the expenses of a reduction in pulses, fruits and roots and tubers, which decrease by four to five times. Cereals also increase over time, representing around 45% of the calorie intake. The increase in cereals, vegetable oils, and alcoholic beverages, along with the decrease in fruits, vegetables, pulses and starchy roots indicate a likely worsening of the diet that warrants further analysis.
The relative share of exports and imports in terms of calories is presented in Table 3. Ecuador has reduced its exports of fruits, which went from representing 62.5% in 1988 to 50.7% in 2013. Stimulants (i.e., coffee beans) also lost share, from 26.1% to 12.2%. On the other hand, exports of vegetable oils boomed, from 3.4% in 1988 to 31.7% of exports in 2013. Ecuador does not only consume more vegetable oil as we saw above, but it exports increasing quantities of it. With regard to imports, Ecuador is very dependent on cereals, representing more than 60% of total imports in 2013.
Trade patterns are very different depending on the trade partner analyzed. In the year 2013, the main trade partners for Ecuador were Europe, the Community of Andean Nations (CAN, Bolivia, Colombia, Ecuador, and Peru) and the USA. The corresponding market share for Ecuador exports was 38.1%, 16.3%, and 14.8%, respectively, that is, 69.2% between the three of them. Imports from Ecuador originated in the CAN (32.7%), Canada (29.2%), the USA (12.8%) and Europe (3.2%) [50]. Based on this, we decided to analyze these cases individually.
Thus, in Figure 3 we can see how Ecuador maintains a positive food balance with Europe, which more than quintupled in the period and corresponds, in a large part, to bananas. In 2013 wheat represented 57% of imports, barley 23% and olive oil 6.2%, while Ecuador exported to Europe mainly bananas (68.3%), palm oil (12.9%) and cocoa beans (6.2%).
When analyzing the trade relationship with the CAN, as seen in Figure 4, Ecuador’s earlier positive balance shifted to negative in 2010. This shift is due to the surge in imports from the region (soy oil) and exports being more or less stable in the last years. Most of the exports to CAN are palm oil (75.6%) and rice (9.1%), while imports from CAN consisted basically of soy oil (65.7%) and other seeds oil (10.5%).
In the case of the trade with the USA, Figure 5 shows how Ecuador has maintained a positive balance since 2011, mainly due to the decrease in imports of cereals from that country in absolute terms, although in relative terms this item is still dominant. Exports to the USA in the year 2013 were dominated by bananas (48.6%), cocoa beans (26%) and plantain (9.4%), while imports from the USA were dominated by wheat (95.6%). Clearly, these differences between exported and imported products will be important to understand the terms of trade expressed in calories that are discussed below.
Ecuador is a net importer of cereals, sugar and sweeteners and pulses, although after 2011 there seems to be a trend to reduce the imbalance for these products, particularly cereals. The country is, a net exporter of fruits (with bananas representing 86% of fruit exports according to FAO [50]) and became a net exporter of vegetable oils after 2005 (due to the expansion of oil palm plantations). Surprisingly, especially when considering potatoes are originally from the Andes, the country is reducing its positive balance for starchy roots and in the year 2013 it reached equilibrium, but with imports growing slowly and exports decreasing rapidly, so we can anticipate the country will become net importer soon. In terms of food self-sufficiency, the country is shifting from high-quality carbohydrates (potato and cassava) and vegetable protein (pulses) in favor of fats. This trade trend reflects in consumption patterns, as we will argue.

3.2. Caloric Unequal Exchange and the Relationship between Trade Patterns and Consumption

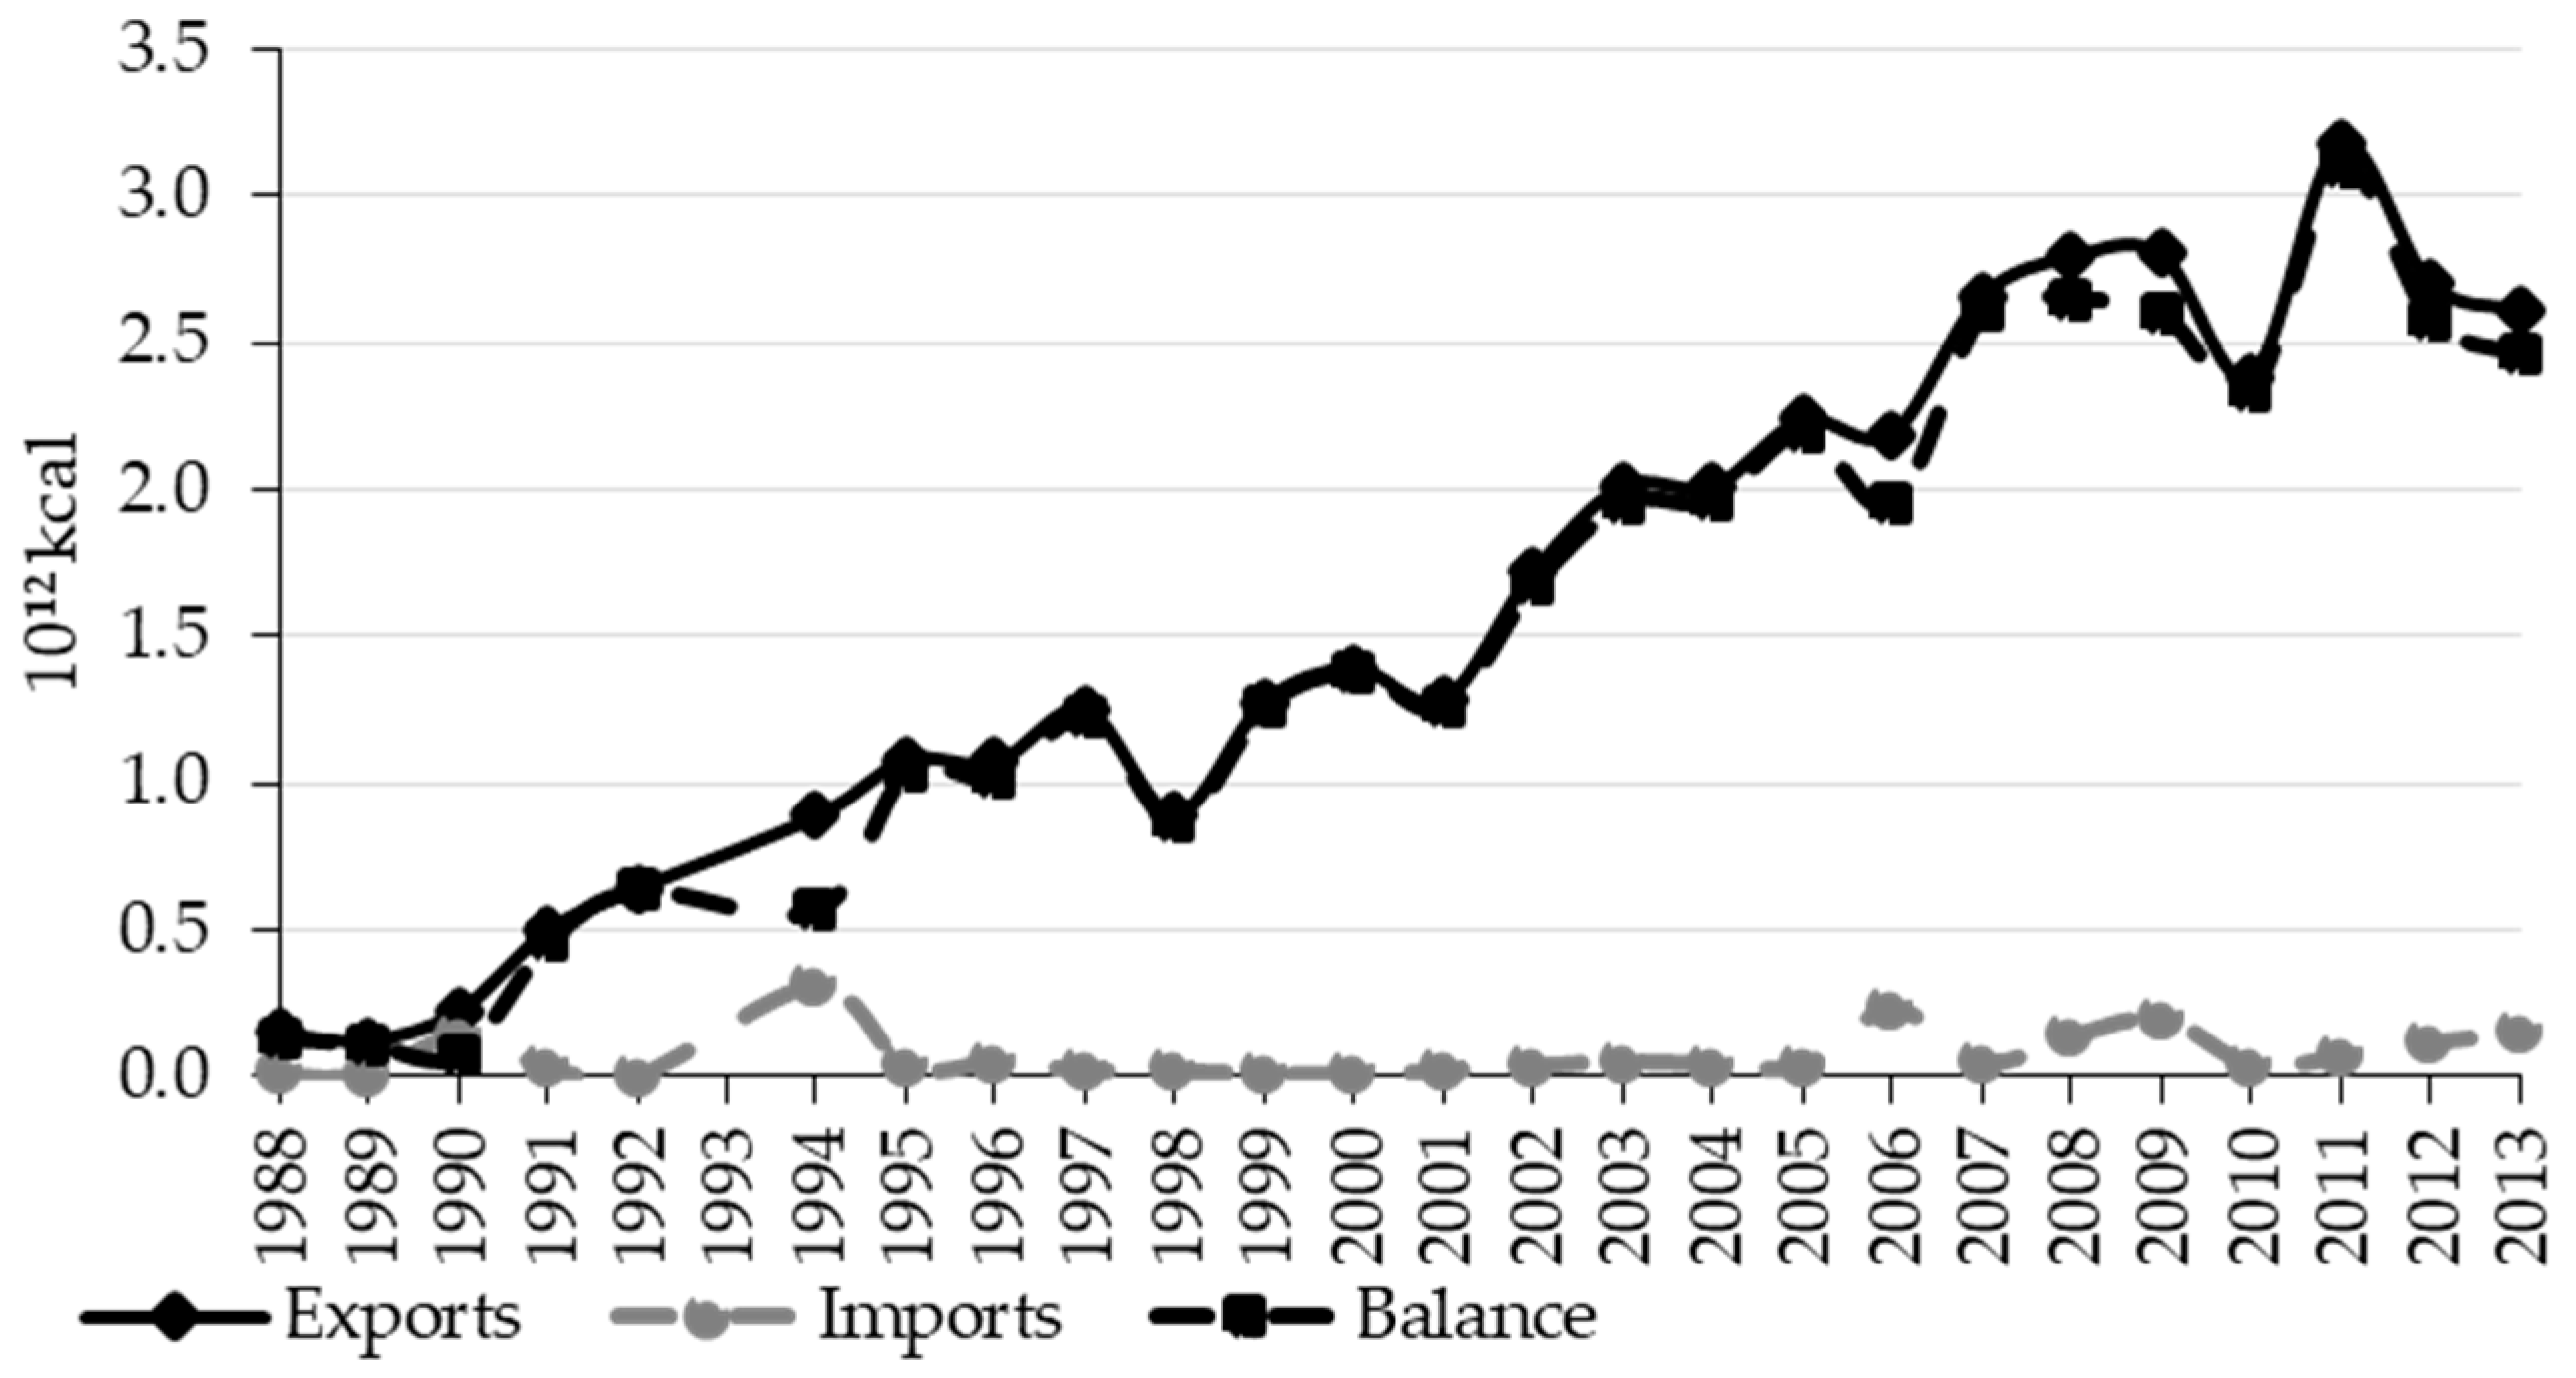
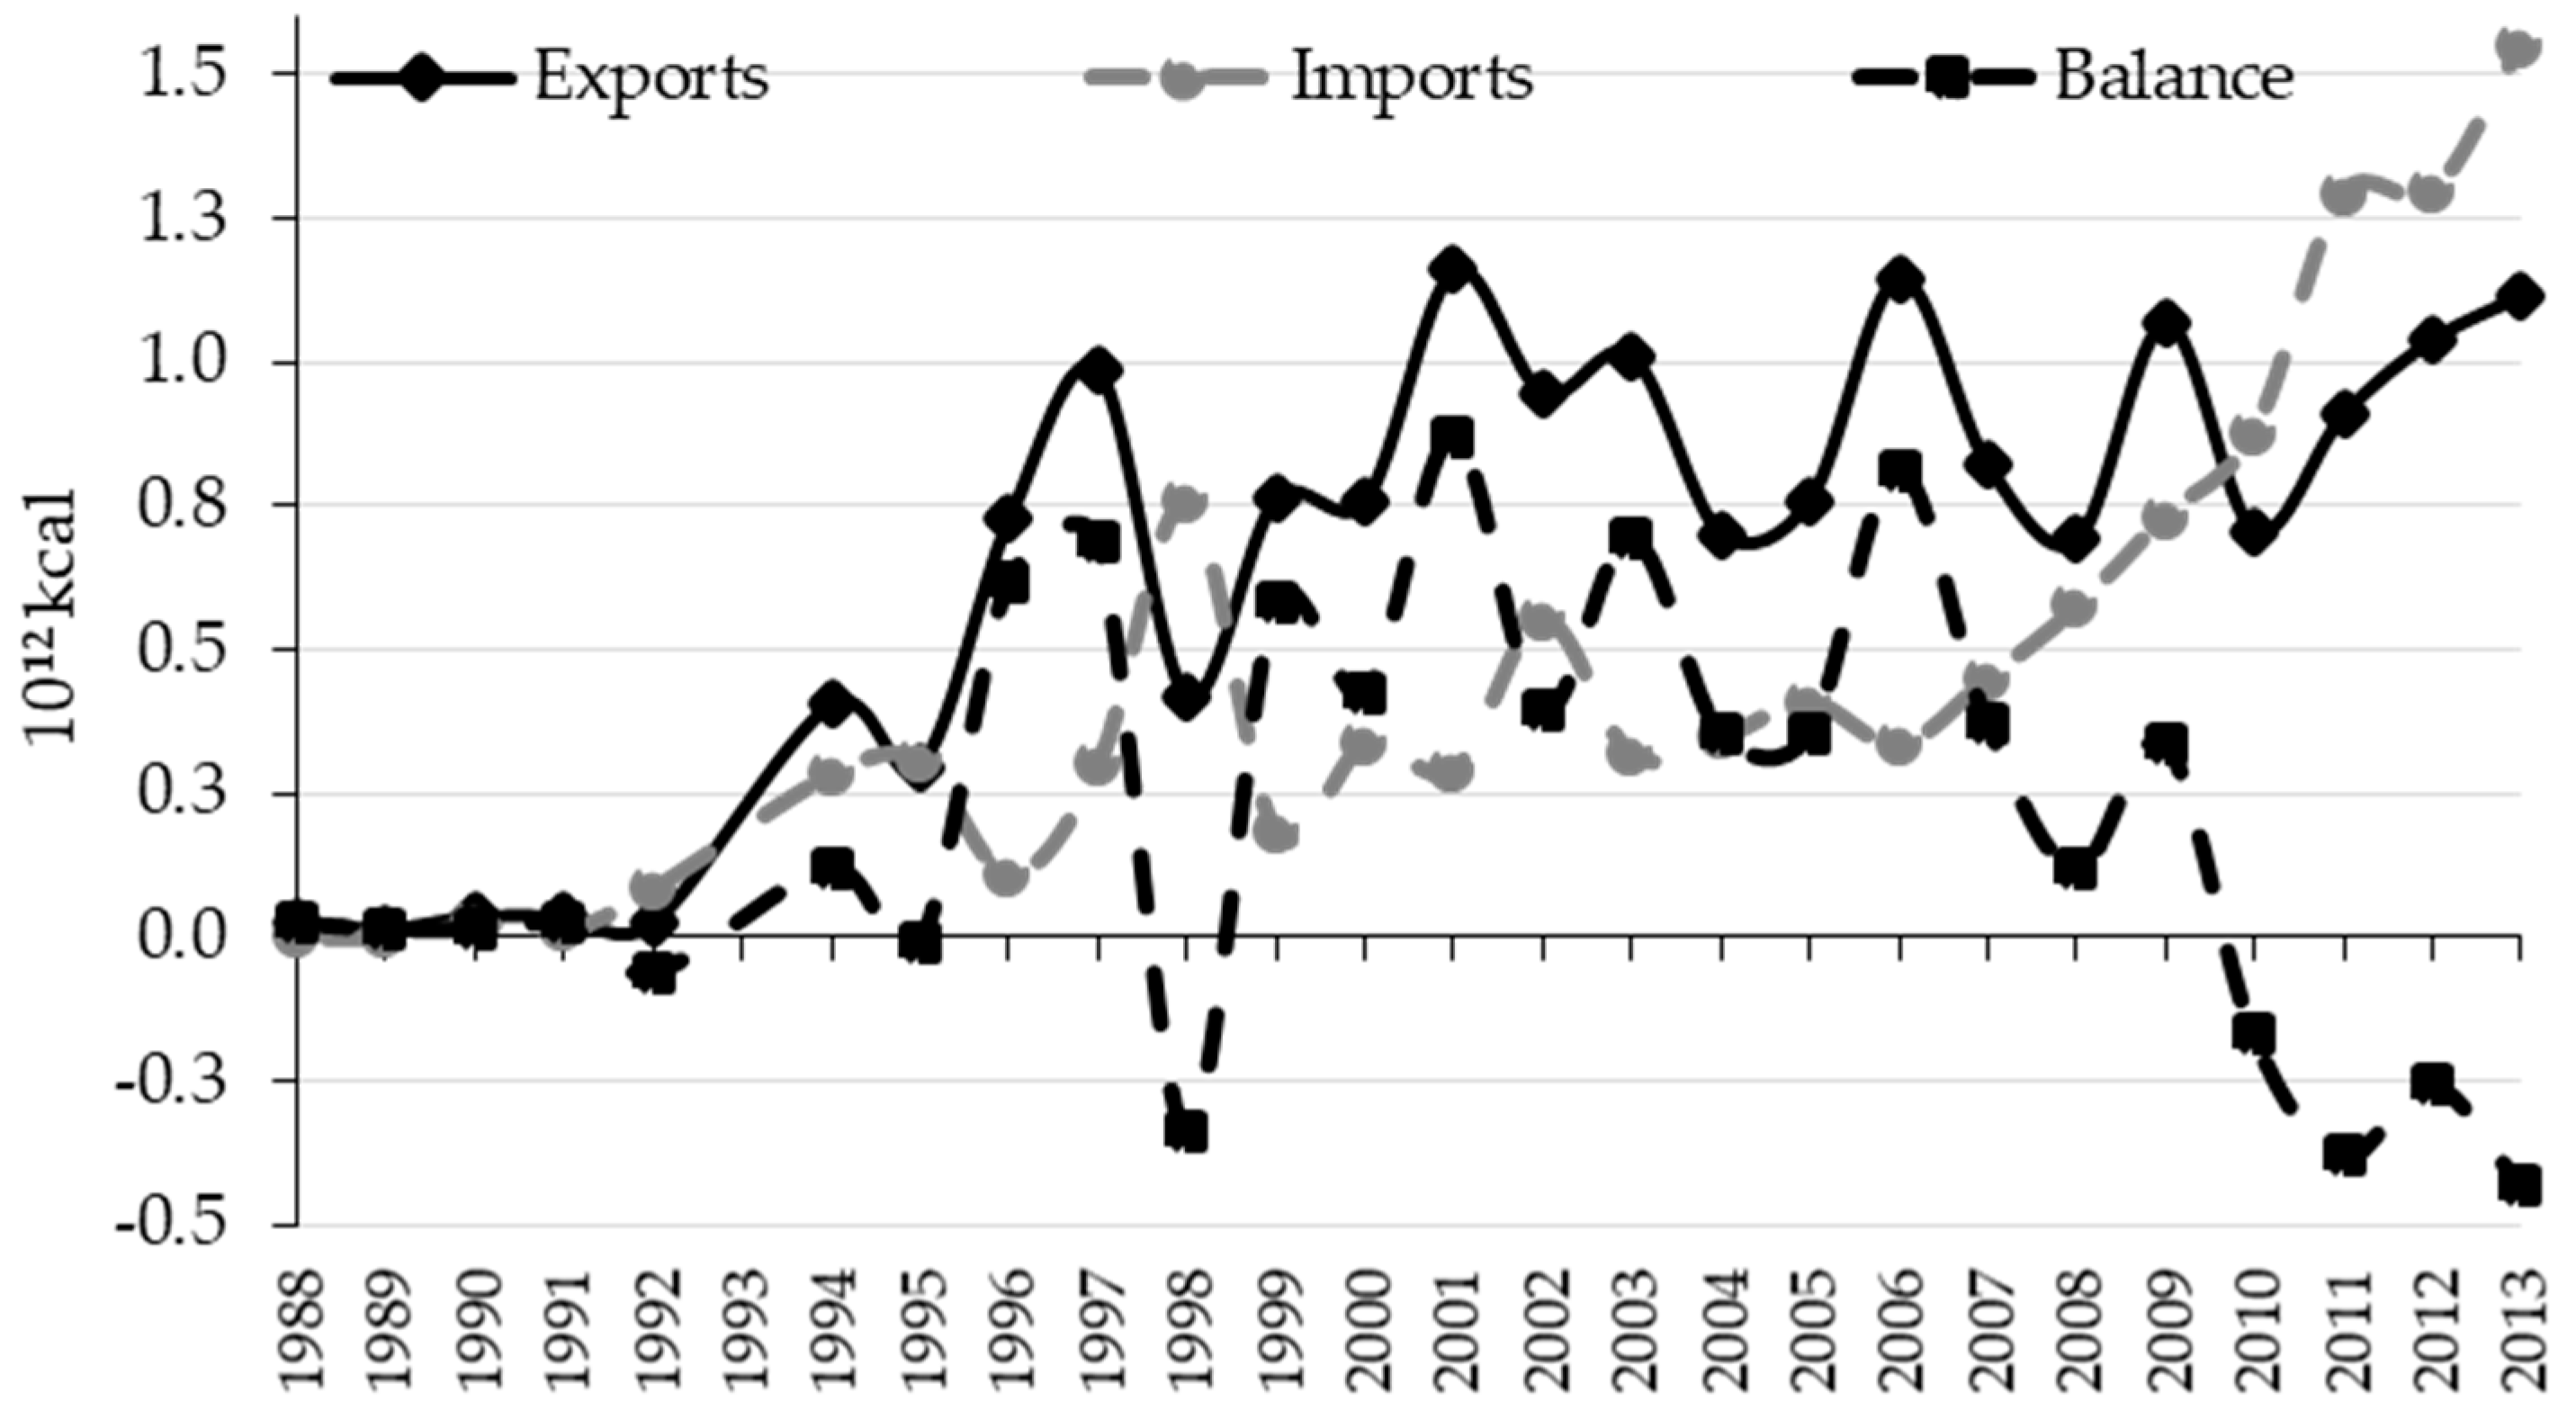
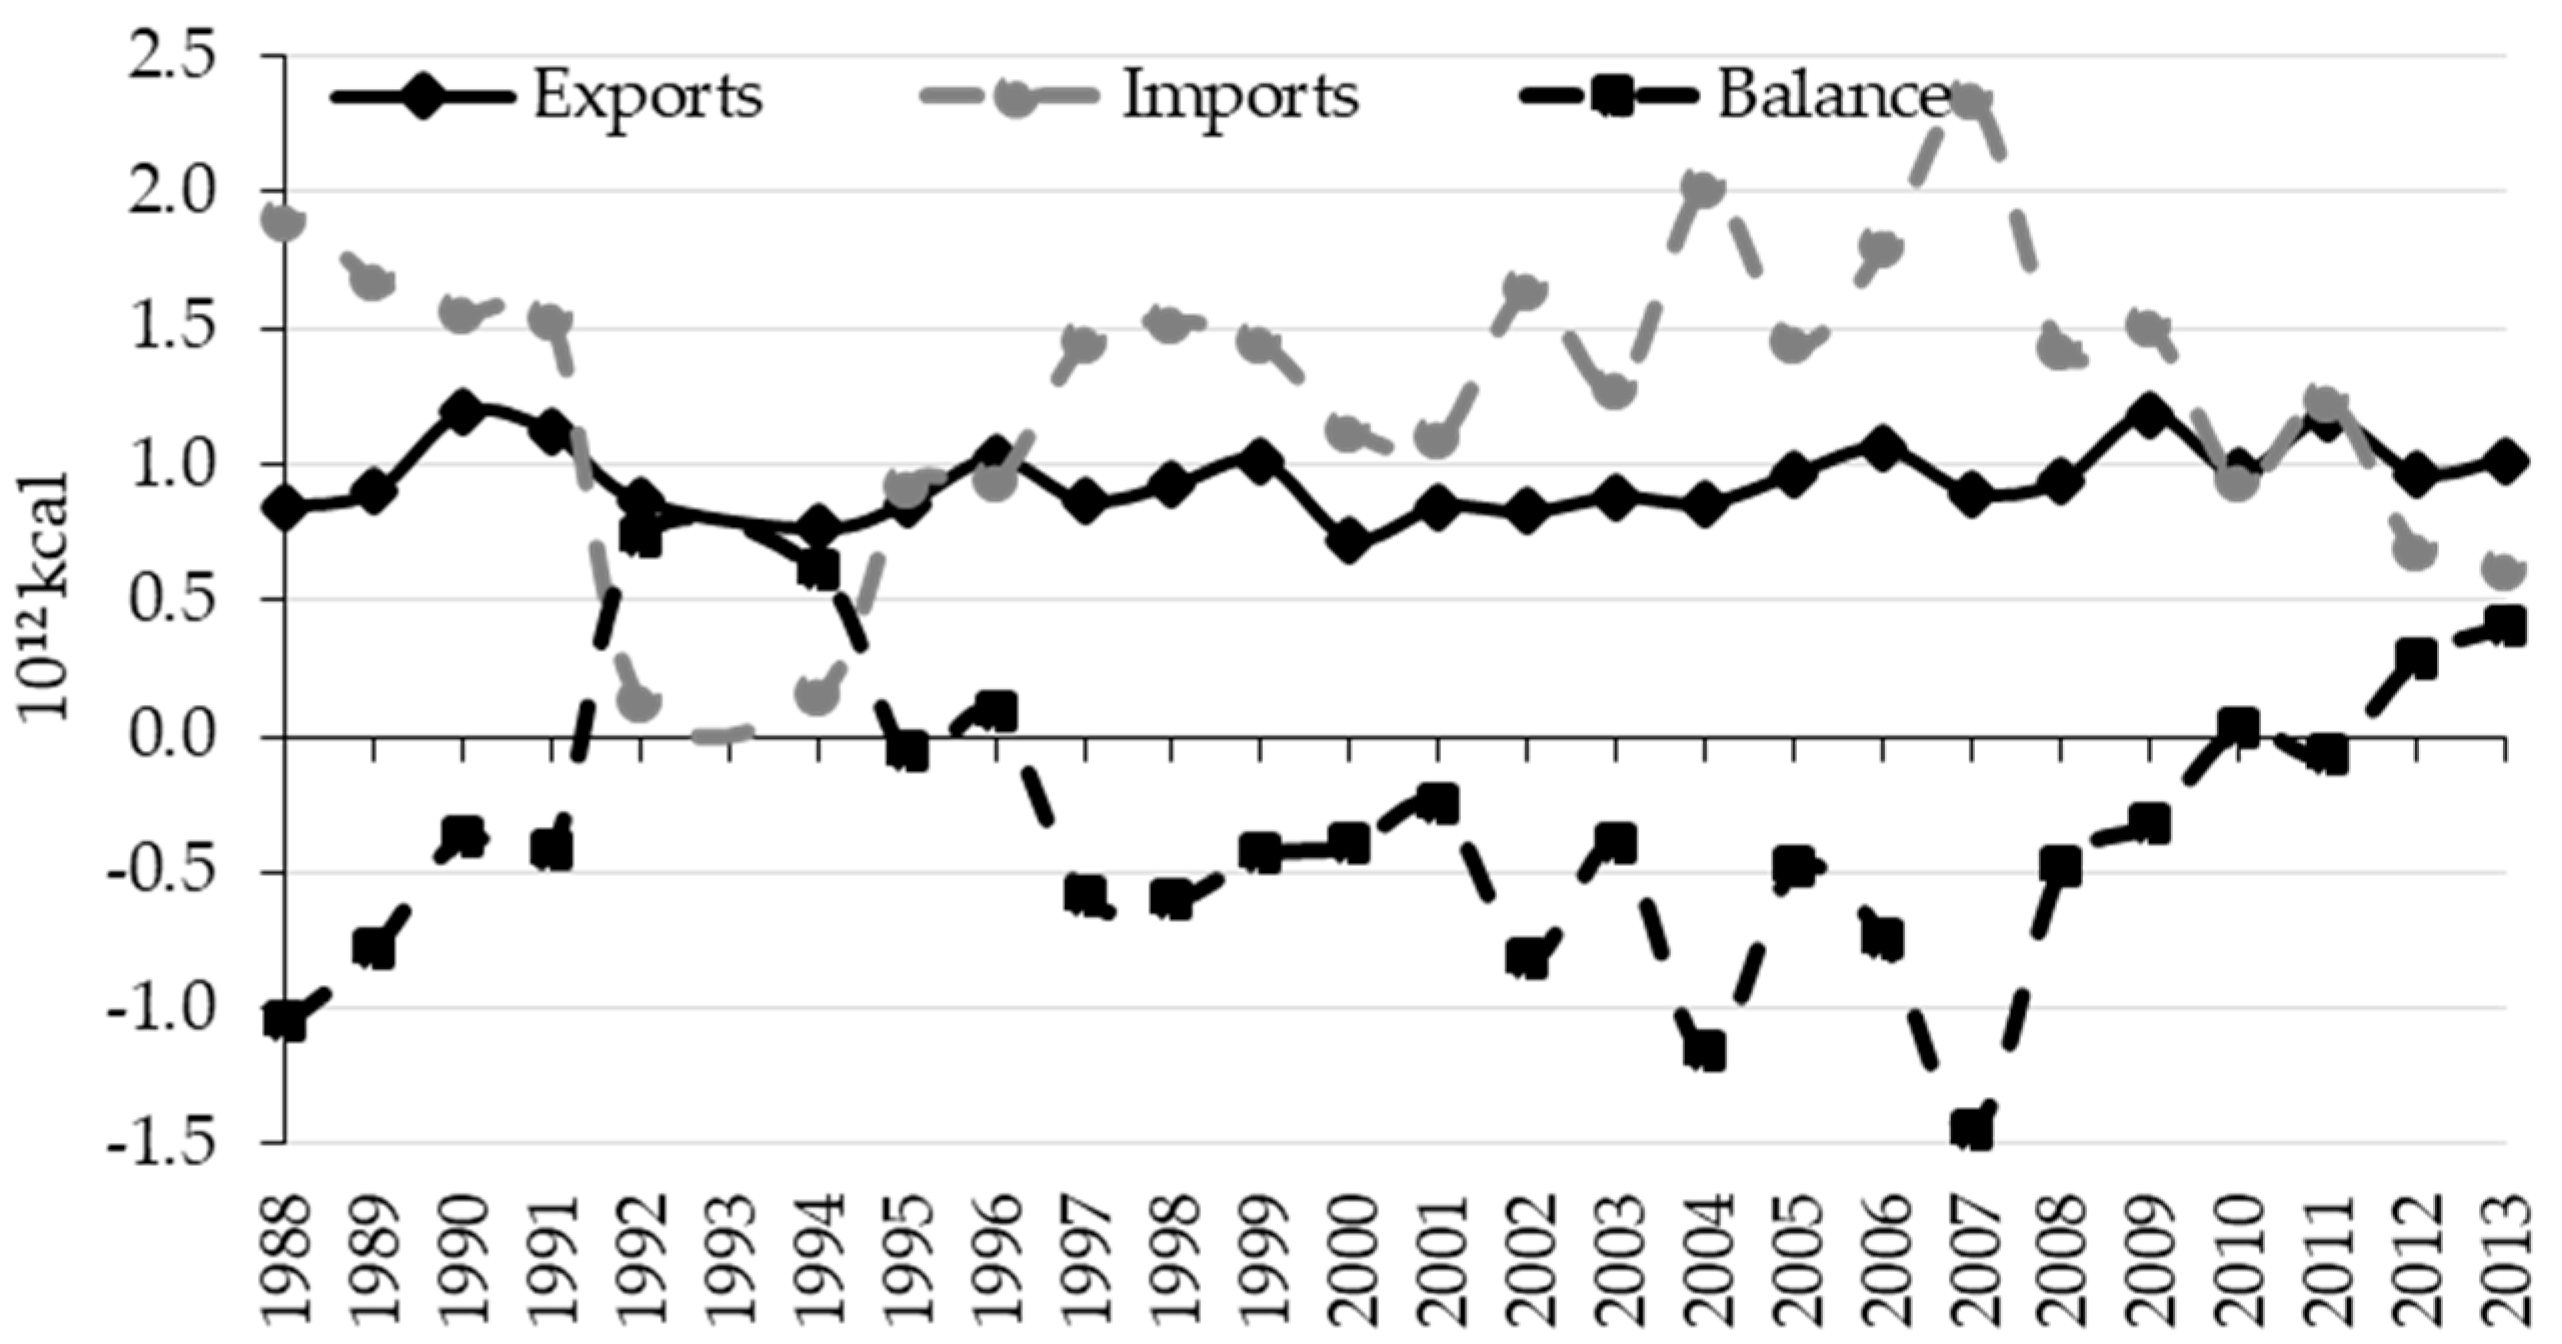
3.2.1. Existence of Caloric Unequal Exchange

Deepening the data analysis shown in Table 1, Figure 6 presents the cost in US dollars of one million kcal exported and imported in real terms (left axis) and the ratio between the cost of the exported calorie and the imported calorie (right axis), that is, an approximation to the terms of trade measured in calories. The same explanation of axes applies to Figure 7, Figure 8 and Figure 9. Ecuador still has positive terms of trade in caloric terms, although the value is decreasing over time. The trend observed in the figure is an increase in the cost of exported calories of 47% in the period, but a much higher increase in the cost of imported calories over time (more than 400%), which implied a deterioration of the terms of trade measured in calories, with a decrease of more than 250% in the period analyzed. Thus, Ecuador is feeding the rest of the world at a lower relative cost over time, despite the recent boom in commodity prices experienced worldwide.
Again, this result differs depending on the trading partner. Terms of trade are favorable to Ecuador with respect to Europe, as seen in Figure 7, exporting expensive calories (banana, palm oil, cocoa beans) and importing cheaper ones (wheat and barley). Nevertheless, there is a lot of volatility in this variable and, since the year 2000, the ratio has been moving its value around 1.
In the case of the CAN, Figure 8 shows how with the exception of years 1991 and 1992 Ecuador has negative terms of trade with the region. Imported calories (soy oil and other seeds oil) have been more expensive than exported ones (palm oil, rice) for almost all years in the period.
Finally, Figure 9 shows how the terms of trade experienced a shift with the USA in the year 1999 when it reached its peak. After that year the trend is for deteriorating terms of trade (130% between 1999 and 2013), despite the fact they are still very favorable to Ecuador, as it exports expensive calories (banana and cocoa beans) and imports cheap ones (wheat).

3.2.2. Concentration of Consumption

Our research also shows the degree of concentration of consumption in a few products, measured in kcal, comparing 1961 and 2011 (see Table 4). This high concentration in a few products did worsen in the period. Table 4 presents the cumulative calorie intake per product in year 1961 and 2011. The number represents the ranking of that product in both years, for instance, sugar was the second product in caloric terms in 1961 but the fourth in 2011. The table reads like this: in 1961 rice represented 12% of calorie intake, and rice plus sugar 23.9%, and so on. In the year 2011, rice represented 24%, while rice and wheat 41.4%, and so on. Five products (rice, sugar, maize, banana and wheat) represented 52.7% of calorie intake in 1961, while the share went up to 71.1% in 2011 (with a change in composition: rice, wheat, palm oil, sugar, soybean oil). When extending to 10 products, they represented 77.1% of consumption in 1961 and 88.4% in 2011. Therefore, apart from a change in the diet, with a noticeable increase in vegetable oils (soybean and palm) and a decrease in beans, cassava and potatoes, a large fraction of consumption is concentrated in a very small number of products and this concentration is increasing over time, reducing the variety of the diet in the country.

3.2.3. Loss of Self-Sufficiency

Despite being a net exporter country since 1991 (with the exception of 1998 and 2010), Ecuador also depends on imports from other countries. In aggregated terms, Ecuador shows an overall loss of self-sufficiency, notably due to cereals. The dependency on cereals is extremely high, with years in which imports are even higher than consumption. This heavy dependency on imports to cover for consumption is also found in pulses. Sugar and vegetable oils are rapidly increasing dependency as well, whereas starchy roots and fruits maintain values close to self-sufficiency.

4. Discussion

As shown by Figure 6, Figure 7, Figure 8 and Figure 9, Ecuador has experienced favorable terms of trade during the period analyzed, with the exported calorie being more expensive than the imported calorie. However, this result, apart from being different depending on the trading partner, is deteriorating over time, leading us to conclude that there is a worsening of the terms of trade in caloric terms.
If we put together the fact that trade balance is increasingly positive in volume terms with the deterioration of terms of trade, we can see how Ecuador is exporting ever-cheaper food products to the rest of the world, making diets elsewhere more affordable. This affordability is also explained by the fact that prices of those goods do not account for the environmental externalities they cause locally. First, the products that are most exported, fruits (bananas) and palm oil, accounted for 82.4% of the calories exported in 2013 (see Table 3). These products are basically monocultures, which have environmental impacts attached to them and use large amounts of inputs [54,55]. Second, loss of soil and nutrients that escape along with volumes exported are not accounted for, as reported by some authors [4] globally. These are two reasons for curbing optimism in Ecuador regarding food exports.
We have also observed that Ecuador faces a loss in food self-sufficiency. This is to say, that Ecuador is increasingly feeding the world at the same time it losses sufficiency in certain products (e.g., cereals, pulses, sugar and vegetable oil), which makes it more vulnerable. The loss in self-sufficiency particularly, for vegetable oil is worth mentioning, as Ecuador is simultaneously both a net exporter and importer of vegetable oil. The fact is the country exports palm oil whereas imports soy and sunflower oil.
In our view, the reduced terms of trade over time are inducing changes in trade patterns, with more calories being exported (Figure 1). These trade patterns have led to changes in productive patterns, with production focusing on products for exports and not for the domestic market. This would explain the apparent contradiction found according to which Ecuador is at the same time increasing its positive trade balance for food products, but reducing its self-sufficiency for certain products. Accordingly, as can be seen in Table 2 and Table 4, the changes in dietary patterns are worsening the quality of the diet. Richer food products such as cassava, potatoes and pulses are decreasing their share in consumption in favor of export-oriented, massively produced products such as palm oil.
If we add the high concentration of consumption in a few products, as seen in Table 4, with an astonishing 88.4% of calorie intake from only 10 products in 2011, we may interpret that the current food production system in place in Ecuador (exports-oriented) and the current trade insertion of the country, (giving incentives to monocultures), are not only negative in economic terms, as the country’s dependency is increasing, but are also negative in health terms through the shifting to a diet richer in fats and the decrease in its variety. It is our conjecture, subject to further research, that changes in consumption are driven by changes in production. That is, export-oriented production renders some products cheaper, therefore inducing their consumption. Production itself would be driven also by international trade, trade insertion of Ecuador and terms of trade, as the country is producing more food products for export, and this affects local availability of food products, reducing variety and increasing concentration in calorie intake in less products over time.

5. Conclusions

This research has contributed to the debate on caloric unequal exchange by analyzing the case of Ecuador. It also has contributed to understanding how changes in consumption patterns may be induced not only by demand-side factors such as preferences or income, but may also be induced by trade patterns and the international insertion of countries. This new approach helps to complement existing analysis of food systems, so that new public policies can be envisioned at national and international level.
Ecuador has increased its exports sevenfold in the 25-year period analyzed in terms of calories. Imports grew as well, but the overall balance has tripled in the period. The conclusion is that Ecuador is increasingly helping to feed the world at a cost to calories that are decreasing over time. There is an overall loss of self-sufficiency mainly due to cereals, with years in which imports are even higher than domestic consumption. Dependency is also increasing for sugar and vegetable oils. The unequal caloric exchange is deepening dependency, deteriorating the trade balance over time and shifting the diet towards a diet richer in fats.
We have found that there is a deterioration of the terms of trade of traded food in terms of calories for Ecuador of more than 250% between 1986 and 2013. This goes along with an increased volume (and value) of exports, which increased by a factor of 4.3 (and 7.9).
A side result found in this study, is that of the homogenization of diets; that is, a concentration of consumption in just a few products, which are, effectively, the most traded around the world. In fact, in the year 2011, only three products (rice, wheat and palm oil) accounted for 54% of calorie consumption, while 10 products accounted for 88.4%. From a nutritional point of view, this result also has implications, as we observed how consumption of oils and fats grew faster than that of other products at the expenses of cereals, pulses, and roots and tubers.
The differences found for caloric unequal exchange by partner, justify a change in Ecuador’s food trade policy towards a double objective: (1) to focus on those markets where there are better terms of trade (i.e., the USA) and (2) to promote changes in production patterns so that more land is allocated to products substituting imports at the expenses of export-oriented production, which would bring not only benefits from a balance of payments perspective, but also in terms of food sovereignty. As we have seen, this change in production patterns would have, eventually, effects on dietary composition.
As advanced in Section 4, future research could follow two different lines: (1) to explore the causality conjectured by us that states that traded food products would determine what is produced. Thus, production would render some food products cheaper, inducing changes in consumption patterns that imply less variety in the diet; and (2) to go beyond the use of calories and analyze trade, terms of trade, and dietary variety also in terms of macronutrients, so that caloric unequal exchange can be used as a bridge between food policies (production and trade) and health policies (nutrition).

Supplementary Materials

The following are available online at www.mdpi.com/2071-1050/9/11/2068/s1, Table S1: CUEE Data.xlsx which includes all the data and references for both figures and tables in the paper.

Acknowledgments

The authors would like to thank Kaysara Khatun for a review of an earlier version of the paper, which improved it considerably. We would also thank the special issue editor Tiziano Gomiero and three anonymous referees for providing relevant comments that improved the paper. This work was supported by the Spanish Ministerio de Economía, Industria y Competitividad (HAR2016-76814-C2-1-P AEI/FEDER, UE) and by the ACCD, the Catalan Cooperation Agency.

Author Contributions

Fander Falconí conceived the concept of caloric unequal exchange; Fander Falconí and Jesús Ramos-Martín conceived and designed experiment of the case study for Ecuador; Pedro Cango performed the experiment; Fander Falconí, Jesús Ramos-Martín and Pedro Cango analyzed the data; Jesús Ramos-Martín wrote the paper.

Conflicts of Interest

The authors declare no conflict of interest. The founding sponsors had no role in the design of the study; in the collection, analyses, or interpretation of data; in the writing of the manuscript, and in the decision to publish the results.

References

  1. Institute of Medicine (US) Committee on Dietary Guidelines Implementation. Improving America’s Diet and Health; Thomas, P.R., Ed.; National Academy Press: Washington, DC, USA, 1991; ISBN 0-309-57442-0. [Google Scholar]
  2. Coyle, W.; Gehlhar, M.; Hertel, T.W.; Wang, Z.; Yu, W. Understanding the Determinants of Structural Change in World Food Markets. Am. J. Agric. Econ. 1998, 80, 1051. [Google Scholar] [CrossRef]
  3. Falconí, F.; Ramos-Martin, J.; Cango, P. Caloric unequal exchange in Latin America and the Caribbean. Ecol. Econ. 2017, 134, 140–149. [Google Scholar] [CrossRef]
  4. Grote, U.; Craswell, E.; Vlek, P. Nutrient flows in international trade: Ecology and policy issues. Environ. Sci. Policy 2005, 8, 439–451. [Google Scholar] [CrossRef]
  5. Prebish, R. Commercial policy in the underdeveloped countries. Am. Econ. Rev. 1959, 49, 251–273. [Google Scholar]
  6. Prebish, R. The Economic Development of Latin America and Its Principal Problems; Economic Commission for Latin America (ECLA): New York, NY, USA, 1950. [Google Scholar]
  7. Singer, H.W. The distribution of gains between investing and borrowing countries. Am. Econ. Rev. 1950, 40, 473–485. [Google Scholar]
  8. Furtado, C. Obstacles to Development in Latin America; Anchor Books: Garden City, NY, USA, 1970. [Google Scholar]
  9. Furtado, C. Development and Underdevelopment; University of California Press: Berkeley, CA, USA, 1964; ISBN 978-0520004436. [Google Scholar]
  10. Emmanuel, A. Unequal Exchange: A Study of the Imperialism of Trade; New Left Books: New York, NY, USA, 1972; ISBN 978-0902308831. [Google Scholar]
  11. Amin, S. Unequal Development: An Essay on the Social Formations of Peripheral Capitalism; Monthly Review Press: New York, NY, USA, 1976; ISBN 978-0853454335. [Google Scholar]
  12. Bunker, S.G. Modes of extraction, unequal exchange, and the progressive underdevelopment of an extreme periphery: The Brazilian Amazon, 1600–1980. Am. J. Sociol. 1984, 89, 1017–1064. [Google Scholar] [CrossRef]
  13. Bunker, S.G. Underdeveloping the Amazon: Extraction, Unequal Exchange and the Failure of the Modern State; University of Chicago Press: Chicago, IL, USA, 1985; ISBN 9780226080321. [Google Scholar]
  14. Bunker, S.G. The poverty of resource extraction. In Rethinking Environmental History: World-System History and Global Environmental Change; Hornborg, A., McNeill, J.R., Martinez-Alier, J., Eds.; AltaMira Press: Lanham, MD, USA, 2007; pp. 239–258. [Google Scholar]
  15. Dorninger, C.; Hornborg, A. Can EEMRIO analyses establish the occurrence of ecologically unequal exchange? Ecol. Econ. 2015, 119, 414–418. [Google Scholar] [CrossRef]
  16. Hornborg, A. Towards an ecological theory of unequal exchange: Articulating world system theory and ecological economics. Ecol. Econ. 1998, 25, 127–136. [Google Scholar] [CrossRef]
  17. Hornborg, A. Zero-sum world: Challenges in conceptualizing environmental load displacement and ecologically unequal exchange in the world-system. Int. J. Comp. Sociol. 2009, 50, 237–262. [Google Scholar] [CrossRef]
  18. Hornborg, A. Ecological economics, marxism, and technological progress: Some explorations of the conceptual foundations of theories of ecologically unequal exchange. Ecol. Econ. 2014, 105, 11–18. [Google Scholar] [CrossRef]
  19. Jorgenson, A.K.; Rice, J. Uneven ecological exchange and consumption-based environmental impacts: A cross-national investigation. In Rethinking Environmental History: World-System History and Global Environmental Change; Hornborg, A., McNeill, J.R., Martinez-Alier, J., Eds.; AltaMira Press: Lanham, MD, USA, 2007; pp. 273–288. [Google Scholar]
  20. Muradian, R.; Giljum, S. Physical Trade Flows of Pollution-Intensive Products: Historical Trends in Europe and the World. In Rethinking Environmental History: World-System History and Global Environmental Change; Hornborg, A., McNeill, J.R., Martinez-Alier, J., Eds.; AltaMira Press: Lanham, MD, USA, 2007; pp. 307–325. [Google Scholar]
  21. Røpke, I. Ecological Unequal Exchange. J. Hum. Ecol. 2001, 10, 35–40. [Google Scholar]
  22. Jorgenson, A. Environment, development, and ecologically unequal exchange. Sustainability 2016, 8, 227. [Google Scholar] [CrossRef]
  23. Fitzgerald, J.; Auerbach, D. The political economy of the water footprint: A cross-national analysis of ecologically unequal exchange. Sustainability 2016, 8, 1263. [Google Scholar] [CrossRef]
  24. Muradian, R.; Martinez-Alier, J. Trade and the environment: From a “Southern” perspective. Ecol. Econ. 2001, 36, 281–297. [Google Scholar] [CrossRef]
  25. Machado, G.; Schaeffer, R.; Worrell, E. Energy and carbon embodied in the international trade of Brazil: An input–output approach. Ecol. Econ. 2001, 39, 409–424. [Google Scholar] [CrossRef]
  26. Muradian, R.; O’Connor, M.; Martinez-Alier, J. Embodied pollution in trade: Estimating the “environmental load displacement” of industrialised countries. Ecol. Econ. 2002, 41, 51–67. [Google Scholar] [CrossRef]
  27. Giljum, S. Trade, materials flows, and economic development in the South: The example of Chile. J. Ind. Ecol. 2004, 8, 241–261. [Google Scholar] [CrossRef]
  28. Pérez-Rincón, M.A. Comercio exterior y flujos hídricos en la agricultura colombiana: Análisis para el periodo 1961–2004. Rev. Iberoam. Econ. Ecol. 2006, 4, 3–16. [Google Scholar]
  29. Jorgenson, A.K. The sociology of ecologically unequal exchange and carbon dioxide emissions, 1960–2005. Soc. Sci. Res. 2012, 41, 242–252. [Google Scholar] [CrossRef] [PubMed]
  30. Jorgenson, A.K.; Dick, C.; Austin, K. The vertical flow of primary sector exports and deforestation in less-developed countries: A test of ecologically unequal exchange theory. Soc. Nat. Resour. 2010, 23, 888–897. [Google Scholar] [CrossRef]
  31. Jorgenson, A.K. The sociology of unequal exchange in ecological context: A panel study of lower-income countries, 1975–2000. Sociol. Forum 2009, 24, 22–46. [Google Scholar] [CrossRef]
  32. Eisenmenger, N.; Ramos-Martin, J.; Scheindl, H. Análisis del metabolismo energético y de materiales de Brasil, Chile y Venezuela. Rev. Iberoam. Econ. Ecol. 2007, 6, 17–39. [Google Scholar]
  33. Falconí, F.; Vallejo, M.C. Transiciones Socioecológicas en la Región Andina. Rev. Iberoam. Econ. Ecol. 2012, 18, 53–71. [Google Scholar]
  34. Hornborg, A.; Jorgenson, A.K. (Eds.) International Trade and Environmental Justice: Toward a Global Political Ecology; Nova Science Publishers, Inc.: Hauppauge, NY, USA, 2010; ISBN 978-1608764266. [Google Scholar]
  35. Pérez-Rincón, M.A. Colombian international trade from a physical perspective: Towards an ecological “Prebisch thesis”. Ecol. Econ. 2006, 59, 519–529. [Google Scholar] [CrossRef]
  36. Samaniego, P.; Vallejo, M.C.; Martínez-Alier, J. Déficit Comercial y Déficit Físico en Sudamérica; Documento de Trabajo, Proyectos CSO2010-21979 e ENGOV; Institut de Ciència i Tecnologia Ambientals (ICTA), Universidad Autónoma de Barcelona, FLACSO Sede Ecuador: Quito, Ecuador, 2014. [Google Scholar]
  37. Vallejo, M.C. Biophysical structure of the Ecuadorian economy, foreign trade, and policy implications. Ecol. Econ. 2010, 70, 159–169. [Google Scholar] [CrossRef]
  38. Pengue, W.A. Transgenic crops in Argentina: The ecological and social debt. Bull. Sci. Technol. Soc. 2005, 25, 314–322. [Google Scholar] [CrossRef]
  39. Pérez-Rincón, M.A. Comercio Internacional y Medio Ambiente en Colombia. Mirada Desde la Economía Ecológica; Universidad del Valle: Cali, Colombia, 2007; ISBN 9789584412171. [Google Scholar]
  40. Kennedy, G.; Nantel, G.; Shetty, P. Globalization of food systems in developing countries: A synthesis of country case studies. In Globalization of Food Systems in Developing Countries: Impact on Food Security and Nutrition; Food and Agriculture Organization of the United Nations: Rome, Italy, 2004; p. 97. [Google Scholar]
  41. Sherwood, S.; Arce, A.; Berti, P.; Borja, R.; Oyarzun, P.; Bekkering, E. Tackling the new materialities: Modern food and counter-movements in Ecuador. Food Policy 2013, 41, 1–10. [Google Scholar] [CrossRef]
  42. Thow, A.M.; Hawkes, C. The implications of trade liberalization for diet and health: A case study from Central America. Glob. Health 2009, 5, 5. [Google Scholar] [CrossRef] [PubMed]
  43. Thow, A.M.; Swinburn, B.; Colagiuri, S.; Diligolevu, M.; Quested, C.; Vivili, P.; Leeder, S. Trade and food policy: Case studies from three Pacific Island countries. Food Policy 2010, 35, 556–564. [Google Scholar] [CrossRef]
  44. Aldaya, M.M.; Allan, J.A.; Hoekstra, A.Y. Strategic importance of green water in international crop trade. Ecol. Econ. 2010, 69, 887–894. [Google Scholar] [CrossRef]
  45. Duarte, R.; Pinilla, V.; Serrano, A. The effect of globalisation on water consumption: A case study of the Spanish virtual water trade, 1849–1935. Ecol. Econ. 2014, 100, 96–105. [Google Scholar] [CrossRef]
  46. Hoekstra, A.Y.; Hung, P.Q. Globalisation of water resources: International virtual water flows in relation to crop trade. Glob. Environ. Chang. 2005, 15, 45–56. [Google Scholar] [CrossRef]
  47. Kastner, T.; Schaffartzik, A.; Eisenmenger, N.; Erb, K.H.; Haberl, H.; Krausmann, F. Cropland area embodied in international trade: Contradictory results from different approaches. Ecol. Econ. 2014, 104, 140–144. [Google Scholar] [CrossRef]
  48. Iannotti, L.; Robles, M. Negative impact on calorie intake associated with the 2006–08 food price crisis in Latin America. Food Nutr. Bull. 2011, 32, 112–123. [Google Scholar] [CrossRef] [PubMed]
  49. Falconi, F.; Oleas-Montalvo, J. Citizens revolution and international integration: Obstacles and opportunities in world trade. Lat. Am. Perspect. 2016, 43, 124–142. [Google Scholar] [CrossRef]
  50. Food and Agriculture Organization of the United Nations. FAOSTAT Database; FAO: Rome, Italy, 2016. [Google Scholar]
  51. Food and Agriculture Organization of the United Nations. Food Balance Sheets, A Handbook; FAO: Rome, Italy, 2001. [Google Scholar]
  52. Banco Central del Ecuador. Cuentas Nacionales Número 24; BCE: Quito, Ecuador, 2016. [Google Scholar]
  53. Banco Central del Ecuador. Cuentas Nacionales Número 25; BCE: Quito, Ecuador, 2016. [Google Scholar]
  54. Arizpe, N.; Giampietro, M.; Ramos-Martin, J. Food security and fossil energy dependence: An international comparison of the use of fossil energy in agriculture (1991–2003). CRC. Crit. Rev. Plant Sci. 2011, 30, 45–63. [Google Scholar] [CrossRef]
  55. Arizpe, N.; Ramos-Martín, J.; Giampietro, M. An assessment of the metabolic profile implied by agricultural change in two rural communities in the North of Argentina. Environ. Dev. Sustain. 2014, 16, 903–924. [Google Scholar] [CrossRef]
Figure 1. Ecuador trade balance, 106 2007 US$, 1965–2012; Source: Central Bank of Ecuador [52,53].
Sustainability 09 02068 g001
Figure 2. Ecuador exports, imports and balance of food products (1012 kcal), 1988–2013.
Sustainability 09 02068 g002
Figure 3. Ecuador exports, imports and trade balance for food products with Europe (1012 kcal), 1988–2013.
Sustainability 09 02068 g003
Figure 4. Ecuador exports, imports and trade balance for food products with Community of Andean Nations (CAN) (1012 kcal), 1988–2013.
Sustainability 09 02068 g004
Figure 5. Ecuador exports, imports and trade balance for food products with the USA (1012 kcal), 1988–2013.
Sustainability 09 02068 g005
Figure 6. Ecuador exports, imports (left axis) and terms of trade (right axis) for food products, 1988–2013.
Sustainability 09 02068 g006
Figure 7. Ecuador exports, imports (left axis) and terms of trade (right axis) with Europe for food products, 1988–2013.
Sustainability 09 02068 g007
Figure 8. Ecuador exports, imports (left axis); and terms of trade (right axis) with CAN for food products, 1988–2013.
Sustainability 09 02068 g008
Figure 9. Ecuador exports, imports (left axis) and terms of trade (right axis) with the USA for food products, 1988–2013.
Sustainability 09 02068 g009
Table 1. Food trade balance for Ecuador with the rest of the world, volume, value, and calories, 1988–2013.
YearExports (10³ Tn)Imports (10³ Tn)Exports (10⁶ US$ 2005) *Imports (10⁶ US$ 2005) *Exports (10¹² kcal)Imports (10¹² kcal)
19881526.5637.5282.357.71.32.2
19943492.5547.1610.981.62.81.9
20004610.5808.01259.0237.23.73.1
20055638.41367.41722.3510.45.24.7
20096649.81504.52253.7550.56.45.1
20136508.21358.42219.6629.56.84.7
Δ 1988–20134.32.17.910.95.32.1
* Adjusted to the value added deflator by country for Agriculture, silviculture and fishing (value US$, 2005 prices). Source: [50].
Table 2. Food consumption by product group for Ecuador, measured in kcal, 1961–2011.
Product Group10¹² kcal/Year% kcal by Products GroupConsumption kcal/Person/Day
196119711981199120012011196119711981199120012011196119711981199120012011
Cereals1.01.41.92.83.74.435.133.833.441.646.845.2588.3601.8642.3742791.3788.3
Fruits0.60.71.00.81.21.320.018.018.212.414.813.3336.0320.2350.9221.9251.1232
Sugar & Sweeteners0.40.81.21.00.81.015.218.820.315.110.510.6254.5335.0390.6269178.3185.2
Starchy Roots0.30.50.30.30.30.210.011.75.73.93.82.6167.1209.010968.9864.944.88
Vegetable Oils0.20.40.91.41.52.28.49.015.321.319.322.3140.8159.9294.3381326.1389.8
Pulses0.20.20.10.10.10.16.14.62.41.81.71.4102.682.046.3932.628.7124.23
Vegetables0.10.10.10.10.10.12.31.71.11.10.91.239.030.021.0420.0116.0320.99
Oil crops0.00.00.10.00.00.11.71.20.90.40.40.828.321.717.867.4626.88914.45
Alcoholic Beverages0.00.00.10.10.10.21.01.22.31.91.21.917.021.443.8933.7420.2433.82
Other *0.00.00.00.00.00.10.20.10.40.40.40.72.81.97.0097.7217.3311.39
* Include: Stimulants, tree nuts, sugar crops, spices and miscellaneous. Source: [50].
Table 3. Evolution of exports (X) and imports (M) measured in kcal by product group, 1988–2013.
Product Group198819942000200520092013
% X% M% X% M% X% M% X% M% X% M% X% M
Fruits—Excluding Wine62.50.067.70.767.90.658.20.955.31.150.71.7
Stimulants26.10.013.00.48.00.27.70.69.20.412.20.7
Sugar & Sweeteners6.38.42.415.73.23.24.84.71.33.10.53.1
Vegetable Oils3.46.76.014.07.222.821.617.630.522.731.728.6
Cereals—Excluding Beer1.684.210.063.89.469.34.671.51.968.42.661.5
Vegetables0.00.00.10.10.40.30.50.40.40.90.60.8
Alcoholic Beverages0.00.60.11.80.00.30.10.80.00.60.00.3
Pulses0.00.00.12.20.62.91.12.70.31.80.42.0
Spices0.00.00.00.20.00.10.00.10.00.10.00.2
Starchy Roots0.00.00.10.00.70.00.80.10.50.20.20.2
Other *0.00.00.41.22.60.30.80.50.60.61.01.0
* Include: Tree nuts, oil crops and miscellaneous. Source: [50].
Table 4. Share of accumulated calorie intake in total consumption, per product, 1961–2011.
Number of ProductProduct% Cumulated 1961% Cumulated 2011Product
1Rice (Milled Equivalent)12.024.0Rice (Milled Equivalent)
2Sugar (Raw Equivalent)23.941.4Wheat and products
3Maize and products34.053.9Palm Oil
4Bananas43.463.9Sugar (Raw Equivalent)
5Wheat and products52.771.1Soybean Oil
6Plantains59.378.3Bananas
7Potatoes and products64.882.1Plantains
8Palm Oil70.184.7Maize and products
9Cassava and products73.886.8Potatoes and products
10Sugar non-centrifugal77.188.4Fruits, Other
Source: [50].

