Environmental Innovation and Employment: Drivers and Synergies

Abstract
:1. Introduction
2. Literature Review: Looking Inside Drivers of Eco-Innovation and Employment Growth
2.1. Drivers of Eco-Innovation
2.2. Drivers of Employment Growth Considering Eco-Innovative Performance
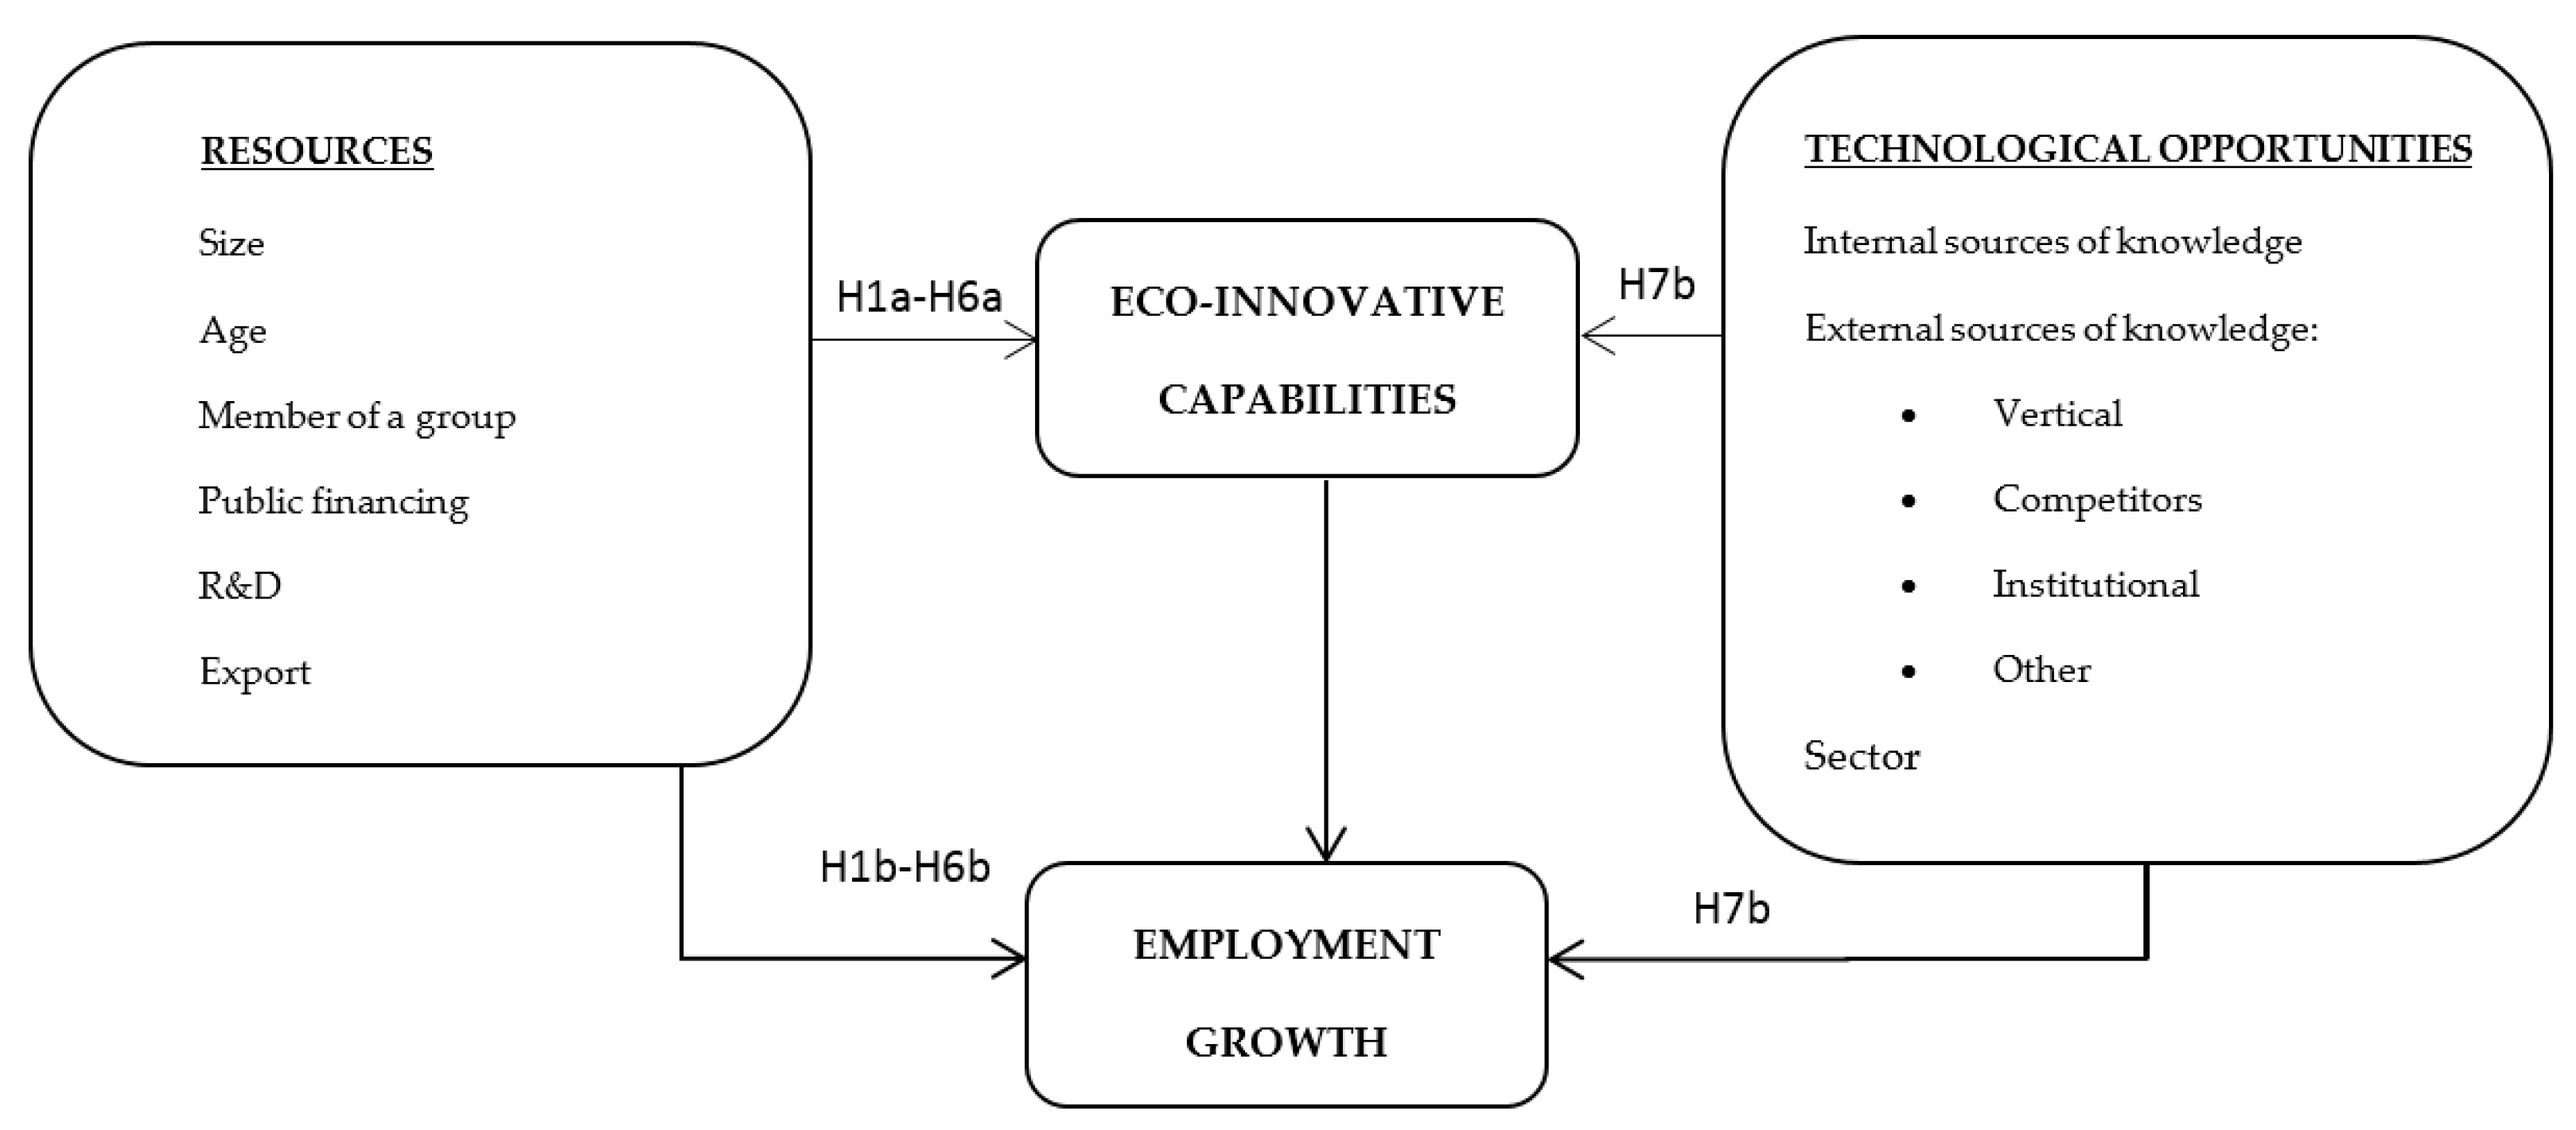
2.3. Theoretical Framework
3. Materials and Methods
4. Results
5. Discussion and Conclusions
Acknowledgments
Author Contributions
Conflicts of Interest
Appendix A

| Eco-Innovation | Size | Group | Age | RDint (t − 1) | Public Subsidies (t − 1) | Export (t − 1) | Internal Sources of Knowledge (t − 1) | Vertical External Knowledge Sources (t − 1) | Competitors Knowledge Sources (t − 1) | Other Sources of Knowledge (t − 1) | Institutional Knowledge Sources (t − 1) | |
|---|---|---|---|---|---|---|---|---|---|---|---|---|
| Eco-innovation | 1.000 | |||||||||||
| Size | 0.0463 *** | 1.000 | ||||||||||
| Group | 0.1048 *** | 0.3667 *** | 1.000 | |||||||||
| Age | 0.0863 *** | 0.1985 *** | 0.1074 *** | 1.000 | ||||||||
| RDint (t − 1) | 0.1599 *** | −0.0905 *** | −0.0083 | −0.0951 *** | 1.000 | |||||||
| Public subsidies (t − 1) | 0.3237 *** | −0.0254 *** | 0.0605 *** | −0.0066 | 0.3122 *** | 1.000 | ||||||
| Export (t − 1) | 0.2222 *** | −0.0394 *** | 0.1331 *** | 0.1139 *** | 0.0468 *** | 0.1970 *** | 1.000 | |||||
| Internal sources of knowledge (t − 1) | 0.1912 *** | 0.0643 *** | 0.0980 *** | 0.0213 *** | 0.1133 *** | 0.1413 *** | 0.0952 *** | 1.000 | ||||
| Vertical external knowledge sources (t − 1) | 0.1711 *** | 0.0216 *** | 0.0091 | 0.0114 | 0.0890 *** | 0.1298 *** | 0.0805 *** | 0.2135 *** | 1.000 | |||
| Competitors knowledge sources (t − 1) | 0.1030 *** | −0.0099 *** | 0.0055 | 0.041 | 0.0774 *** | 0.0916 *** | 0.0606 *** | 0.0955 *** | 0.3161 *** | 1.000 | ||
| Other sources of knowledge (t − 1) | 0.1206 *** | 0.0087 *** | 0.0170 | 0.0157 | 0.1055 *** | 0.1518 *** | 0.0226 *** | 0.0418 *** | 0.1447 *** | 0.1718 *** | 1.000 | |
| Institutional knowledge sources (t − 1) | 0.1615 *** | −0.0140 *** | 0.0157 | −0.0350 *** | 0.2004 *** | 0.2620 *** | 0.0516 *** | 0.0960 *** | 0.0767 *** | 0.0499 *** | 0.2377 *** | 1.000 |
| Process Innovation | Product Innovation | |||
|---|---|---|---|---|
| Eco-Innovation | Employment | Eco-Innovation | Employment | |
| Eco-innovation | 0.0209 ** | 0.00906 | ||
| (0.00939) | (0.00940) | |||
| Size | 0.0919 *** | 0.0983 *** | 0.1363 *** | 0.0753 *** |
| (0.0188) | (0.0188) | (0.0203) | (0.0164) | |
| Group | 0.0228 | −0.0344 ** | 0.0121 | −0.0375 *** |
| (0.0164) | (0.0146) | (0.0167) | (0.0128) | |
| Age | 0.0008 ** | −0.00172 ** | 0.0010 ** | −0.00118 ** |
| (0.0035) | (0.000674) | (0.0004) | (0.000497) | |
| RDint (t − 1) | 3.69 × 10⁻⁶ *** | 3.96 × 10⁻⁷ * | 2.47 × 10⁻⁶ *** | 4.07 × 10⁻⁷ ** |
| (5.45 × 10⁻⁷) | (2.08 × 10⁻⁷) | (4.67 × 10⁻⁷) | (1.76 × 10⁻⁷) | |
| Public subsidies (t − 1) | 0.0818 *** | 0.00593 | 0.0875 *** | 0.00782 |
| (0.1626) | (0.00975) | (0.0159) | (0.00939) | |
| Export (t − 1) | 0.0196 | 0.0487 *** | 0.0382 * | 0.0327 ** |
| (0.0189) | (0.0150) | (0.0199) | (0.0157) | |
| Internal sources of knowledge (t − 1) | 0.0801 *** | −0.00553 | 0.0585 *** | −0.00177 |
| (0.0157) | (0.0116) | (0.0163) | (0.0105) | |
| Vertical external knowledge sources (t − 1) | 0.0986 *** | 0.0178 | 0.0802 *** | 0.0184 * |
| (0.1584) | (0.0113) | (0.0160) | (0.0109) | |
| Competitors knowledge sources (t − 1) | 0.0317 | 0.00295 | 0.0465 ** | −0.0100 |
| (0.0234) | (0.0129) | (0.0227) | (0.0162) | |
| Other external sources of knowledge (t − 1) | 0.0803 *** | −0.00325 | 0.0769 *** | −0.00974 |
| (0.0246) | (0.0121) | (0.0247) | (0.0118) | |
| Institutional knowledge sources (t − 1) | 0.1049 *** | 0.000166 | 0.0679 *** | 0.00489 |
| (0.0251) | (0.0137) | (0.0239) | (0.0133) | |
| Low-tech manuf. 1 | 0.0920 *** | 0.0214 | 0.0936 *** | 0.0200 |
| (0.0353) | (0.0194) | (0.0342) | (0.0162) | |
| Medium-tech manuf. 1 | 0.1134 *** | 0.0200 | 0.1088 *** | 0.0194 |
| (0.0328) | (0.0192) | (0.0311) | (0.0158) | |
| KIS 1 | −0.2414 *** | 0.0246 | −0.2213 *** | −0.00143 |
| (0.03612) | (0.0219) | (0.0342) | (0.0199) | |
| Low-KIS 1 | −0.1039 *** | −0.0433 * | −0.0387 | −0.0378 * |
| (0.0349) | (0.0244) | (0.0339) | (0.0216) | |
| Observations | 3842 | 3842 | 3814 | 3814 |
| LR chi2 = 589.99 | F test = 2.88 | LR chi2 = 487.48 | F test = 2.33 | |
| Prob > chi2 = 0.000 | Prob > F = 0.000 | Prob > chi2 = 0.000 | Prob > F = 0.000 | |
| Log likelihood = −2368.3 | Log likelihood = −2394.3 | |||
References
- Frondel, M.; Horbach, J.; Rennings, K. End-of-pipe or cleaner production? An empirical comparison of environmental innovation decisions across OECD countries. Bus. Strategy Environ. 2007, 16, 571–584. [Google Scholar] [CrossRef]
- Green, K.; McMeekin, A.; Irwin, A. Technological trajectories and R&D for environmental innovation in UK firms. Futures 1994, 26, 1047–1059. [Google Scholar]
- Rennings, K. Redefining innovation—Eco-innovation research and the contribution from ecological economics. Ecol. Econ. 2000, 32, 319–332. [Google Scholar] [CrossRef]
- Horbach, J. Determinants of environmental innovation—New evidence from German panel data sources. Res. Policy 2008, 37, 163–173. [Google Scholar] [CrossRef]
- Triguero, A.; Moreno-Mondéjar, L.; Davia, M.A. Drivers of different types of eco-innovation in European SMEs. Ecol. Econ. 2013, 92, 25–33. [Google Scholar] [CrossRef]
- Sáez-Martínez, F.J.; Díaz-García, C.; González-Moreno, Á. Factors promoting environmental responsibility in European SMEs: The effect on performance. Sustainability 2016, 8, 898. [Google Scholar] [CrossRef]
- Harabi, N. Employment Effects of Ecological Innovations: An Empirical Analysis. Available online: https://mpra.ub.uni-muenchen.de/4395/1/MPRA_paper_4395.pdf (accessed on 6 November 2017).
- Getzner, M. The quantitative and qualitative impacts of clean technologies on employment. J. Clean. Prod. 2002, 10, 305–319. [Google Scholar] [CrossRef]
- Rennings, K.; Ziegler, A.; Zwick, T. The effect of environmental innovations on employment changes: An econometric analysis. Bus. Strategy Environ. 2004, 13, 374–387. [Google Scholar] [CrossRef]
- Horbach, J.; Rennings, K. Environmental innovation and employment dynamics in different technology fields—An analysis based on the German Community Innovation Survey 2009. J. Clean. Prod. 2013, 57, 158–165. [Google Scholar] [CrossRef]
- Gagliardi, L.; Marin, G.; Miriello, C. The greener the better? Job creation effects of environmentally-friendly technological change. Ind. Corp. Chang. 2016, 25, 779–807. [Google Scholar] [CrossRef]
- Kunapatarawong, R.; Martínez-Ros, E. Towards green growth: How does green innovation affect employment? Res. Policy 2016, 45, 1218–1232. [Google Scholar] [CrossRef]
- Christensen, J.L.; Hain, D.S. Knowing where to go: The knowledge foundation for investments in renewable energy. Energy Res. Soc. Sci. 2017, 25, 124–133. [Google Scholar] [CrossRef]
- Organisation for Economic Cooperation and Development. Sustainable Manufacturing and Eco-Innovation: Framework, Practices and Measurement; OECD: Paris, France, 2009. [Google Scholar]
- Cleff, T.; Rennings, K. Determinants of environmental product and process innovation. Eur. Environ. 1999, 9, 191–201. [Google Scholar] [CrossRef]
- Rehfeld, K.-M.; Rennings, K.; Ziegler, A. Integrated product policy and environmental product innovations: An empirical analysis. Ecol. Econ. 2007, 61, 91–100. [Google Scholar] [CrossRef]
- De Marchi, V. Environmental innovation and R&D cooperation: Empirical evidence from Spanish manufacturing firms. Res. Policy 2012, 41, 614–623. [Google Scholar]
- Poussing, N.; Le Bas, C. Firm voluntary measures for environmental changes, eco-innovations and CSR: Empirical analysis based on data surveys. Écon. Appl. 2013, Tome LXVI, 141–165. [Google Scholar]
- Wagner, M. Empirical influence of environmental management on innovation: Evidence from Europe. Ecol. Econ. 2008, 66, 392–402. [Google Scholar] [CrossRef]
- Bernauer, T.; Engel, S.; Kammerer, D.; Sejas Nogareda, J. Determinants of Green Innovation—Ten Years after Porter’s Win-Win Proposition: How to Study the Effects of Environmental Regulation on Corporate Environmental Innovation? Polit. Vierteljahr. 2007, 39, 323–341. [Google Scholar]
- Segarra-Blasco, A.; Arauzo-Carod, J.M. Sources of innovation and industry–university interaction: Evidence from Spanish firms. Res. Policy 2008, 37, 1283–1295. [Google Scholar] [CrossRef]
- Le Bas, C.; Poussing, N. Firm Voluntary Measures for Environmental Changes, Eco-Innovations and CSR: Empirical Analysis Based on Data Surveys; LISER Working Paper; Luxembourg Institute of Socio-Economic Research: Luxembourg, 2013; Available online: http://dx.doi.org/10.2139/ssrn.2616343 (accessed on 6 November 2017).
- Marzucchi, A.; Montresor, S. Forms of knowledge and eco-innovation modes: Evidence from Spanish manufacturing firms. Ecol. Econ. 2017, 131, 208–221. [Google Scholar] [CrossRef]
- Klepper, S. Entry, Exit, Growth, and Innovation over the Product Life Cycle. Am. Econ. Rev. 1996, 86, 562–583. [Google Scholar]
- Ziegler, A.; Rennings, K. Determinants of Environmental Innovations in Germany: Do Organizational Measures Matter? A Discrete Choice Analysis at the Firm Level; Discussion Paper No. 04-030; The Centre for European Economic Research: Mannheim, Germany, 2004; Available online: http://dx.doi.org/10.2139/ssrn.552082 (accessed on 6 November 2017).
- Peeters, C.; van Pottelsberghe de la Potterie, B. Innovation strategy and the patenting behavior of firms. In Innovation, Industrial Dynamics and Structural Transformation: Schumpeterian Legacies; Springer: Berlin/Heidelberg, Germany, 2007; pp. 345–371. [Google Scholar]
- Jaffe, A.B.; Palmer, K. Environmental regulation and innovation: A panel data study. Rev. Econ. Stat. 1997, 79, 610–619. [Google Scholar] [CrossRef]
- Frondel, M.; Horbach, J.; Rennings, K. What triggers environmental management and innovation? Empirical evidence for Germany. Ecol. Econ. 2008, 66, 153–160. [Google Scholar] [CrossRef]
- De Marchi, V.; Grandinetti, R. Who are the green innovators? An empirical analysis of firms level factors driving environmental innovation adoption. In Proceedings of the DRUID Conference, Cambridge, UK, 19–21 January 2012; pp. 19–21. [Google Scholar]
- Mazzanti, M.; Zoboli, R. What Drives Environmental Innovation? Empirical Evidence for a District-Based Manufacturing System. Available online: http://www.siepweb.it/siep/oldDoc/wp/451.pdf (accessed on 6 November 2017).
- Hemmelskamp, J. The Influence of Environmental Policy on Innovative Behaviour: An Econometric Study; Working Paper No. 18.99; Fondazione Eni Enrico Mattei: Milan, Italy, 1999; Available online: http://dx.doi.org/10.2139/ssrn.158819 (accessed on 6 November 2017).
- Borghesi, S.; Cainelli, G.; Mazzanti, M. Linking emission trading to environmental innovation: Evidence from the Italian manufacturing industry. Res. Policy 2015, 44, 669–683. [Google Scholar] [CrossRef]
- Cohen, W.M.; Levinthal, D.A. Absorptive Capacity: A New Perspective on Learning and Innovation. Adm. Sci. Q. 1990, 35, 128–152. [Google Scholar] [CrossRef]
- Klevorick, A.K.; Levin, R.C.; Nelson, R.R.; Winter, S.G. On the sources and significance of interindustry differences in technological opportunities. Res. Policy 1995, 27, 131–150. [Google Scholar] [CrossRef]
- Narula, R. Choosing Between Internal and Non-internal R&D Activities: Some Technological and Economic Factors. Technol. Anal. Strateg. Manag. 2001, 13, 365–387. [Google Scholar]
- Vega-Jurado, J.; Gutiérrez-Gracia, A.; Fernández-De-Lucio, I. Does external knowledge sourcing matter for innovation? Evidence from the Spanish manufacturing industry. Ind. Corp. Chang. 2009, 18, 637–670. [Google Scholar] [CrossRef]
- Horbach, J.; Oltra, V.; Belin, J. Determinants and Specificities of Eco-Innovations Compared to Other Innovations—An Econometric Analysis for the French and German Industry Based on the Community Innovation Survey. Ind. Innov. 2013, 20, 523–543. [Google Scholar] [CrossRef]
- Rennings, K.; Rammer, C. The impact of regulation-driven environmental innovation on innovation success and firm performance. Ind. Innov. 2011, 18, 255–283. [Google Scholar] [CrossRef]
- Chesbrough, H.W. Open Innovation: The New Imperative for Creating and Profiting from Technology; Harvard Business School Publishing: Boston, MA, USA, 2003. [Google Scholar]
- Laursen, K.; Salter, A. Open for innovation: The role of openness in explaining innovation performance among U.K. manufacturing firms. Strateg. Manag. J. 2006, 27, 131–150. [Google Scholar] [CrossRef]
- Cainelli, G.; Mazzanti, M.; Montresor, S. Environmental innovativeness, local networks and internationalization. Ind. Innov. 2012, 19, 697–734. [Google Scholar] [CrossRef]
- Ghisetti, C.; Marzucchi, A.; Montresor, S. The open eco-innovation mode. An empirical investigation of eleven European countries. Res. Policy 2015, 44, 1080–1093. [Google Scholar] [CrossRef]
- Cohen, W.M. Empirical studies of innovation activity. In Handbook of the Economics of Innovation and Technological Change; Blackwell: Oxford, UK, 1995; pp. 342–365. [Google Scholar]
- Van Reenen, J. Employment and technological innovation: Evidence from U.K. manufacturing firms. J. Labour Econ. 1997, 15, 255–284. [Google Scholar] [CrossRef]
- Piva, M.C.; Vivarelli, M. Technological change and employment: Some micro evidence from Italy. Appl. Econ. Lett. 2004, 11, 373–376. [Google Scholar] [CrossRef]
- Pianta, M. Innovation and Employment. In Handbook of Innovation; Fagerberg, J., Mowery, D., Nelson, R., Eds.; Oxford University Press: Oxford, UK, 2003; Chapter 22. [Google Scholar]
- Greenan, N.; Guellec, D. Technological innovation and employment reallocation. Labour 2000, 14, 547–590. [Google Scholar] [CrossRef]
- Vaona, A.; Pianta, M. Firm size and innovation in European manufacturing. Small Bus. Econ. 2008, 30, 283–299. [Google Scholar] [CrossRef]
- García, A.; Jaumandreu, J.; Rodríguez, C. Innovation and Jobs. Evidence from Manufacturing Firms. Available online: http://people.bu.edu/jordij/papers/innovationc.pdf (accessed on 6 November 2017).
- Licht, G.; Peters, B. The Impact of Green Innovation on Employment Growth in Europe. Available online: http://www.foreurope.eu/fileadmin/documents/pdf/Workingpapers/WWWforEurope_WPS_no050_MS53.pdf (accessed on 6 November 2017).
- Dachs, B.; Peters, B. Innovation, employment growth, and foreign ownership of firms: A European perspective. Res. Policy 2014, 43, 214–232. [Google Scholar] [CrossRef]
- Bogliacino, F.; Pianta, M. Innovation and employment: A reinvestigation using revised pavitt classes. Res. Policy 2010, 39, 799–809. [Google Scholar] [CrossRef]
- Criscuolo, C.; Gal, P.N.; Menon, C. The Dynamics of Employment Growth; OECD Science, Technology and Industry Policy Papers; OECD: Paris, France, 2014; Available online: http://dx.doi.org/10.1787/5jz417hj6hg6-en (accessed on 6 November 2017).
- Klette, T.J.; Møen, J. R&D investment responses to R&D subsidies: A theoretical analysis and a microeconometric study. World Rev. Sci. Technol. Sustain. Dev. 2012, 9, 169–203. [Google Scholar]
- Mairesse, J.; Monhen, P. Using innovation surveys for econometric analysis. In Handbook of the Economics of Innovation; North Holland: Amsterdam, The Netherlands, 2010; Volume 2, pp. 1129–1155. [Google Scholar]
- Lachenmaier, S.; Rottmann, H. Effects of Innovation on Employment: A Dynamic Panel Analysis. Int. J. Ind. Organ. 2011, 29, 210–220. [Google Scholar] [CrossRef]
- Entorf, H.; Pohlmeier, W. Employment, Innovation and Export Activity in Microeconometrics: Surveys and Applications; Basil-Blackwell: Oxford, UK, 1990. [Google Scholar]
- Bernard, A.B.; Jensen, J.B. Why Some Firms Export. Rev. Econ. Stat. 2004, 86, 561–569. [Google Scholar] [CrossRef]
- Peters, B. Employment Effects of Different Innovation Activities: Microeconometric Evidence. Available online: ftp://ftp.zew.de/pub/zew-docs/dp/dp0473.pdf (accessed on 6 November 2017).
- Harrison, R.; Jaumandreu, J.; Mairesse, J.; Peters, B. Does Innovation Stimulate Employment? A Firm Level Analysis using Comparable Micro—Data from Four European Countries. Int. J. Ind. Organ. 2014, 35, 29–43. [Google Scholar] [CrossRef]
- Benavente, J.M.; Lauterbach, R. Technological Innovation and Employment: Complements or substitutes? Eur. J. Dev. Res. 2008, 20, 319–330. [Google Scholar] [CrossRef]
- Eiadat, Y.; Kelly, A.; Roche, F.; Eyadat, H. Green and competitive? An empirical test of the mediating role of environmental innovation strategy. J. World Bus. 2008, 43, 131–145. [Google Scholar] [CrossRef]
- Barney, J. Firm Resources and Sustained Competitive Advantage. J. Manag. 1991, 17, 99–120. [Google Scholar] [CrossRef]
- Ndofor, H.A.; Sirmon, D.G.; He, X. Firm resources, competitive actions and performance: Investigating a mediated model with evidence from the in vitro diagnostics industry. Strateg. Manag. J. 2011, 32, 640–657. [Google Scholar] [CrossRef]
- Oltra, V. Environmental Innovation and Industrial Dynamics: The Contributions of Evolutionary Economics. Available online: http://cahiersdugretha.u-bordeaux4.fr/2008/2008-28.pdf (accessed on 6 November 2017).
- Coad, A.; Hölzl, W. Firm growth: Empirical analysis in Handbook on the economics and theory of the firm. In 324 Handbook on the Economics and Theory of the Firm; Dietrich, M., Krafft, J., Eds.; Edward Elgar: Cheltenham, UK, 2008. [Google Scholar]
- Heckman, J.J. Instrumental Variables: A Study of Implicit Behavioral Assumptions Used in Making Program Evaluations. J. Hum. Resour. 1997, 32, 441–462. [Google Scholar] [CrossRef]
- Wooldridge, J.M. Econometric Analysis of Cross Section and Panel Data; The MIT Press: Cambridge, MA, USA, 2007. [Google Scholar]
- Demirel, P.; Kesidou, E. Stimulating different types of eco-innovation in the UK: Government policies and firm motivations. Ecol. Econ. 2011, 70, 1546–1557. [Google Scholar] [CrossRef]
- Demirel, P.; Li, Q.C.; Rentocchini, F.; Tamwada, J.P. Born to be green: New insights into the economics and management of green entrepreneurship. Small Bus. Econ. 2017. Available online: https://doi.org/10.1007/s11187-017-9933-z (accessed on 6 November 2017).
- Leoncini, R.; Marzucchi, A.; Montresor, S.; Rentocchini, F.; Rizzo, U. Better late than never: The interplay between green technology and age for firm growth. Small Bus. Econ. 2017. forthcoming. Available online: http://www.sustainability-seeds.org/papers/RePec/srt/wpaper/0616.pdf (accessed on 6 November 2017).
- Hockerts, K.; Wüstenhagen, R. Greening Goliaths versus emerging Davids—Theorizing about the role of incumbents and new entrants in sustainable entrepreneurship. J. Bus. Ventur. 2010, 25, 481–492. [Google Scholar] [CrossRef]
- Cuerva, M.C.; Triguero, A.; Córcoles, D. Drivers of green and non-green innovation: Empirical evidence in Low-Tech SMEs. J. Clean. Prod. 2014, 68, 104–113. [Google Scholar] [CrossRef]
- Christensen, J.L.; Hain, D.S.; Nogueira, L.A. Joining forces: Collaboration patterns and performance of renewable energy innovators. Small Bus. Econ. 2017. Available online: https://doi.org/10.1007/s11187-017-9932-0 (accessed on 6 November 2017).
- Porter, M.E.; van der Linde, C. Toward a new conception of the environment competitiveness relationship. J. Econ. Perspect. 1995, 9, 97–118. [Google Scholar] [CrossRef]
- Dechezleprêtre, A.; Sato, M. The Impacts of Environmental Regulations on Competitiveness; Policy Brief; Grantham Research Institute on Climate Change and the Environment & Global Green Growth Institute: London, UK, 2014. [Google Scholar]

| Total Innovators | Total Innovative SMEs | Total Innovative Large Firms | |
|---|---|---|---|
| Eco-innovators | 2892 (47.19%) | 2101 (45.88%) | 791 (51.03%) |
| Non-eco-innovators | 3237 (52.81%) | 2478 (54.12%) | 759 (48.97%) |
| Total innovators | 6129 | 4579 | 1550 |
| Dependent Variables | |
| Eco-innovation | 1 if the innovative firm reports high or medium importance in “reducing environmental impact” as an objective of technological innovation during 2009–2011 0 if not |
| Employment growth | Log of the number of employees in the year 2011 less the log of the number of employees in the year 2010 |
| Explanatory Variables | |
| Resources | |
| Size | 1 if firm has 200 or more employees 0 if firm has less than 200 employees |
| Membership of a group | 1 if firm is membership of a group of firms 0 if not |
| Age | Years since the firm was established |
| Public financing (t − 1) | 1 if firm receives public financing for its internal R&D activity from local, national or regional administration and European Union in the previous period 0 if not |
| R&D intensity (t − 1) | Total expenditure in R&D activities over the total employees in the previous period |
| Export (t − 1) | 1 if firm is exporter in the previous period 0 if not |
| Technological Opportunities | |
| Sources of Knowledge | |
| Internal sources of knowledge (t − 1) | 1 if firm considers that information within the firm has been very relevant for its innovative activity in the previous period 0 otherwise |
| Vertical external knowledge sources (t − 1) | 1 if firm considers that information from providers and clients have been very relevant for its innovative activity in the previous period 0 otherwise |
| Competitors knowledge sources (t − 1) | 1 if firm considers that information from competitors have been very relevant for its innovative activity in the previous period 0 otherwise |
| Institutional knowledge sources (t − 1) | 1 if firm considers that information from laboratories, private institutes, universities, research public organizations or technological center have been very relevant for its innovative activity in the previous period 0 otherwise |
| Other external knowledge sources (t − 1) | 1 if firm considers that information from fairs, conferences, scientific publications or industrial associations have been very relevant for its innovative activity in the previous period 0 otherwise |
| Sector dummies | One dummy for each of the 37 sectors considered (manufacturing and services) |
| High-tech manuf. | 1 if firm belongs to a sector classified as High-tech manufacturing sector 0 otherwise |
| Low-tech manuf. | 1 if firm belongs to a sector classified as Low-tech manufacturing sector 0 otherwise |
| Medium-tech manuf. | 1 if firm belongs to a sector classified as Medium-tech manufacturing sector 0 otherwise |
| KIS | 1 if firm belongs to a sector classified as Knowledge-Intensive Services sector 0 otherwise |
| Low-KIS | 1 if firm belongs to a sector classified as Low-Knowledge-Intensive Services 0 otherwise |
| Instrumental Variables | |
| Eco-regulation | 1 if the innovative firm reports high or medium importance in “compliance with environmental, health or security requirements” as an objective of technological innovation during 2009–2011 0 if not |
| Energy savings | 1 if the innovative firm reports high or medium importance in “reducing energy used per produced unit” as an objective of technological innovation during 2009–2011 0 if not |
| Total Innovators | Eco-Innovators | Non-Eco Innovators | Mean Difference Test | ||||||||||
|---|---|---|---|---|---|---|---|---|---|---|---|---|---|
| (6129 Firms) | (2892 Firms) | (3237 Firms) | |||||||||||
| Mean | Std. Dev. | Min | Max | Mean | Std. Dev. | Min | Max | Mean | Std. Dev. | Min | Max | ||
| Employment growth | −0.0317 | 0.3411 | −7.002 | 2.197 | −0.0159 | 0.2590 | −5.46 | 2.076 | −0.0459 | 0.4001 | −7.002 | 2.197 | −5.14 *** |
| Size | 0.2528 | 0.4347 | 0 | 1 | 0.2735 | 0.4458 | 0 | 1 | 0.2345 | 0.4237 | 0 | 1 | −4.45 *** |
| Group | 0.4553 | 0.4980 | 0 | 1 | 0.4882 | 0.4999 | 0 | 1 | 0.4260 | 0.4945 | 0 | 1 | −10.12 *** |
| Age | 28.47 | 20.97 | 0 | 342 | 30.09 | 21.88 | 0 | 342 | 27.01 | 20.01 | 0 | 305 | −8.32 *** |
| RDint (t − 1) | 8168.7 | 22,703.5 | 0 | 637,484.1 | 10,518.8 | 28,600.0 | 0 | 637,484.1 | 6062.6 | 15,333.9 | 0 | 209,967.1 | −15.58 *** |
| Export (t − 1) | 0.7079 | 0.4547 | 0 | 1 | 0.7874 | 0.4092 | 0 | 1 | 0.6367 | 0.4810 | 0 | 1 | −22.47 *** |
| Public subsidies (t − 1) | 0.3909 | 0.4880 | 0 | 1 | 0.4920 | 0.5000 | 0 | 1 | 0.3003 | 0.4584 | 0 | 1 | −34.19 *** |
| Internal sources of knowledge (t − 1) | 0.6110 | 0.4875 | 0 | 1 | 0.6745 | 0.4686 | 0 | 1 | 0.5482 | 0.4977 | 0 | 1 | −14.21 *** |
| Vertical external knowledge sources (t − 1) | 0.4168 | 0.4931 | 0 | 1 | 0.4803 | 0.4997 | 0 | 1 | 0.3540 | 0.4783 | 0 | 1 | −15.12 *** |
| Competitors knowledge sources (t − 1) | 0.1327 | 0.3393 | 0 | 1 | 0.1583 | 0.3651 | 0 | 1 | 0.1074 | 0.3097 | 0 | 1 | −8.94 *** |
| Other sources of knowledge (t − 1) | 0.1137 | 0.3174 | 0 | 1 | 0.1455 | 0.3527 | 0 | 1 | 0.0822 | 0.2747 | 0 | 1 | −9.48 *** |
| Institutional knowledge sources (t − 1) | 0.1091 | 0.3119 | 0 | 1 | 0.1451 | 0.3523 | 0 | 1 | 0.0770 | 0.2666 | 0 | 1 | −19.63 *** |
| High-tech manuf. | 0.0571 | 0.2320 | 0 | 1 | 0.0681 | 0.2520 | 0 | 1 | 0.0473 | 0.2121 | 0 | 1 | −7.46 *** |
| Low-tech manuf. | 0.1644 | 0.3707 | 0 | 1 | 0.1888 | 0.3914 | 0 | 1 | 0.1427 | 0.3498 | 0 | 1 | −3.89 *** |
| Medium-tech manuf. | 0.3607 | 0.4803 | 0 | 1 | 0.4426 | 0.4968 | 0 | 1 | 0.2876 | 0.4527 | 0 | 1 | −15.53 *** |
| KIS | 0.1573 | 0.3641 | 0 | 1 | 0.1083 | 0.3107 | 0 | 1 | 0.2011 | 0.4008 | 0 | 1 | −5.74 *** |
| Low-KIS | 0.2604 | 0.4389 | 0 | 1 | 0.1923 | 0.3941 | 0 | 1 | 0.3213 | 0.4670 | 0 | 1 | 19.94 *** |
| Eco-regulation | 0.5146 | 0.4998 | 0 | 1 | 0.8571 | 0.3499 | 0 | 1 | 0.1661 | 0.3722 | 0 | 1 | −83.92 *** |
| Energy savings | 0.4110 | 0.4920 | 0 | 1 | 0.6569 | 0.1718 | 0 | 1 | 0.1601 | 0.3674 | 0 | 1 | −47.25 *** |
| (1) | (2) | |
|---|---|---|
| Size | 0.1063 *** | 0.1000 *** |
| (0.0152) | (0.0147) | |
| Group | 0.0212 * | 0.0263 ** |
| (0.1210) | (0.1208) | |
| Age | 0.0008 *** | 0.0008 *** |
| (0.0003) | (0.0002) | |
| RDint (t − 1) | 1.41 × 10−0.6 *** | 2.51 × 10−0.6 *** |
| (3.76 × 10⁻⁷) | (3.49 × 10⁻⁷) | |
| Public subsidies (t − 1) | 0.1443 *** | 0.1497 *** |
| (0.0117) | (0.0117) | |
| Export (t − 1) | 0.0369 *** | 0.0437 *** |
| (0.0136) | (0.0134) | |
| Internal sources of knowledge (t − 1) | 0.1177 *** | 0.1167 *** |
| (0.0111) | (0.0112) | |
| Vertical external knowledge sources (t − 1) | 0.0865 *** | 0.0874 *** |
| (0.0117) | (0.0118) | |
| Competitors knowledge sources (t − 1) | 0.0516 *** | 0.0487 *** |
| (0.0176) | (0.0177) | |
| Other external sources of knowledge (t − 1) | 0.0843 *** | 0.0874 *** |
| (0.0185) | (0.0186) | |
| Institutional knowledge sources (t − 1) | 0.0537 *** | 0.0710 *** |
| (0.0183) | (0.0183) | |
| Sector dummies | Yes | - |
| Low-tech manuf. 1 | 0.0468 * | |
| (0.0264) | ||
| Medium-tech manuf. 1 | 0.0687 *** | |
| (0.0245) | ||
| KIS 1 | −0.1983 *** | |
| (0.0271) | ||
| Low-KIS 1 | −0.0874 *** | |
| (0.0258) | ||
| Observations | 6866 | 6866 |
| LR chi2 | 1274.3 | 1142.85 |
| Prob > chi2 | 0.000 | 0.000 |
| Log likelihood | −4010.8 | −4076.6 |
| (1) | (2) | (3) | (4) | |
|---|---|---|---|---|
| OLS | OLS with Eco-Innovation | OLS with Interactions | Instrumental Variables 2SLS | |
| Eco-innovation | 0.0231 *** | 0.0448 | 0.0332 ** | |
| (0.00794) | (0.0296) | (0.0139) | ||
| Size | 0.112 *** | 0.110 *** | 0.159 *** | 0.112 *** |
| (0.0156) | (0.0154) | (0.0280) | (0.0123) | |
| Group | −0.029 *** | −0.0300 *** | −0.0649 *** | −0.0394 *** |
| (0.0111) | (0.0112) | (0.0206) | (0.0101) | |
| Age | −0.00196 *** | −0.00198 *** | −0.00316 *** | −0.00221 *** |
| (0.00057) | (0.000578) | (0.00115) | (0.000228) | |
| RDint (t − 1) | 5.75 × 10⁻⁷ *** | 5.35 × 10⁻⁷ *** | 8.56 × 10⁻⁷ *** | 4.74 × 10⁻⁷ ** |
| (1.78 × 10⁻⁷) | (1.76 × 10⁻⁷) | (2.63 × 10⁻⁷) | (2.11 × 10⁻⁷) | |
| Public subsidies (t − 1) | 0.00706 | 0.00325 | −0.00701 | 3.89 × 10⁻⁶ |
| (0.00838) | (0.00842) | (0.0144) | (0.00994) | |
| Export (t − 1) | 0.0363 *** | 0.0353 *** | 0.0543 *** | 0.0420 *** |
| (0.0119) | (0.0120) | (0.0196) | (0.0114) | |
| Internal sources of knowledge (t − 1) | 0.00098 | −0.00181 | 0.0400 *** | −0.000741 |
| (0.00848) | (0.00865) | (0.0148) | (0.00972) | |
| Vertical external knowledge sources (t − 1) | 0.0163 * | 0.0142 | 0.0612 *** | 0.0166 * |
| (0.00915) | (0.00938) | (0.0122) | (0.0100) | |
| Competitors knowledge sources (t − 1) | −0.000150 | −0.00130 | −0.0313 | −0.00679 |
| (0.0136) | (0.0133) | (0.0261) | (0.0145) | |
| Other external sources of knowledge (t − 1) | −0.00661 | −0.00866 | 0.0211 | −0.0107 |
| (0.0122) | (0.0123) | (0.0167) | (0.0151) | |
| Institutional knowledge sources (t − 1) | 0.00369 | 0.00196 | 0.0280 | 0.00279 |
| (0.0122) | (0.0122) | (0.0174) | (0.0150) | |
| Low-tech manuf. 1 | 0.0226 | 0.0218 | 0.0267 * | 0.0206 |
| (0.0138) | (0.0138) | (0.0144) | (0.0219) | |
| Medium-tech manuf. 1 | 0.0270 ** | 0.0255 * | 0.0338 ** | 0.0266 |
| (0.0132) | (0.0132) | (0.0140) | (0.0202) | |
| KIS 1 | −0.00205 | 0.00239 | 0.00429 | 0.00976 |
| (0.0158) | (0.0159) | (0.0170) | (0.0223) | |
| Low-KIS 1 | −0.0614 *** | −0.0591 *** | −0.0591 *** | −0.0616 *** |
| (0.0188) | (0.0186) | (0.0195) | (0.0213) | |
| Eco-innovation*size | −0.0908 *** | |||
| (0.0305) | ||||
| Eco-innovation*group | 0.0461 * | |||
| (0.0240) | ||||
| Eco-innovation*age | 0.00180 | |||
| (0.00123) | ||||
| Eco-innovation*RD | −6.44 × 10⁻⁷ *** | |||
| (2.43 × 10⁻⁷) | ||||
| Eco-innovation*public subsidies | 0.00554 | |||
| (0.0176) | ||||
| Eco-innovation*export | −0.0458 | |||
| (0.0281) | ||||
| Eco-innovation*internal sources | −0.0354 * | |||
| (0.0184) | ||||
| Eco-innovation*vertical sources | −0.0401 ** | |||
| (0.0169) | ||||
| Eco-innovation*competitor sources | −0.00689 | |||
| (0.0343) | ||||
| Eco-innovation*other sources | −0.0288 | |||
| (0.0220) | ||||
| Eco-innovation*institutional sources | −0.0255 | |||
| (0.0218) | ||||
| Observations | 6866 | 6866 | 6084 | 5914 |
| F-test | 6.24 | 5.93 | 3.08 | Wald chi = 238.48 |
| Prob > F | 0.000 | 0.000 | 0.000 | 0.000 |
| <200 Employees | ≥200 Employees | |||
|---|---|---|---|---|
| Eco-Innovation | Employment Growth | Eco-Innovation | Employment Growth | |
| Eco-innovation | 0.029 8 *** | 0.0146 | ||
| (0.00957) | (0.0143) | |||
| Group | 0.0290 ** | −0.0292 ** | 0.0023 | −0.00271 |
| (0.0133) | (0.0127) | (0.0291) | (0.0133) | |
| Age | 0.0011 *** | −0.00356 *** | 0.0006 | −0.000323 ** |
| (0.0004) | (0.00104) | (0.0004) | (0.000164) | |
| RDint (t − 1) | 2.39 × 10⁻⁶ *** | 5.07 × 10⁻⁷ *** | 2.97 × 10⁻⁶ ** | 4.33 × 10⁻⁷ |
| (3.72 × 10⁻⁷) | (1.95 × 10⁻⁷) | (1.17 × 10⁻⁶) | (2.99 × 10⁻⁷) | |
| Public subsidies (t − 1) | 0.1426 *** | 0.0142 | 0.1530 *** | −0.0121 |
| (0.0134) | (0.0103) | (0.0243) | (0.0114) | |
| Export (t − 1) | 0.0390 ** | 0.0535 *** | 0.0474 | −0.00650 |
| (0.0152) | (0.0153) | (0.0291) | (0.0139) | |
| Internal sources of knowledge (t − 1) | 0.1170 *** | −0.000666 | 0.1087 *** | −0.00731 |
| (0.0127) | (0.0105) | (0.0236) | (0.0116) | |
| Vertical external knowledge sources (t − 1) | 0.0904 *** | 0.0105 | 0.0879 *** | 0.0129 |
| (0.0135) | (0.0117) | (0.0242) | (0.0124) | |
| Competitors knowledge sources (t − 1) | 0.0502 ** | 0.00370 | 0.0380 | −0.0189 |
| (0.0199) | (0.0166) | (0.0386) | (0.0133) | |
| Other external sources of knowledge (t − 1) | 0.0852 *** | −0.00651 | 0.1078 *** | −0.0195 * |
| (0.0212) | (0.0155) | (0.0389) | (0.0110) | |
| Institutional knowledge sources (t − 1) | 0.0598 *** | 0.00639 | 0.0896 ** | 0.000396 |
| (0.0273) | (0.0154) | (0.3917) | (0.0131) | |
| Low-tech manuf. 1 | 0.0766 ** | 0.0301 ** | −0.0497 | 0.00882 |
| (0.0304) | (0.0151) | (0.0551) | (0.0346) | |
| Medium-tech manuf. 1 | 0.0852 *** | 0.0286 ** | 0.0361 | 0.0163 |
| (0.0283) | (0.0137) | (0.0516) | (0.0347) | |
| KIS 1 | −0.1549 *** | −0.0235 | −0.3091 *** | 0.0382 |
| (0.0317) | (0.0179) | (0.0546) | (0.0381) | |
| Low-KIS 1 | −0.0439 | −0.0903 *** | −0.1927 *** | −0.000803 |
| (0.0302) | (0.0230) | (0.0520) | (0.0343) | |
| Observations | 5319 | 5319 | 1547 | 1547 |
| LR chi2 = 729.02 | F test = 3.63 | LR chi2 = 380.14 | F test = 1.09 | |
| Prob > chi2 = 0.000 | Prob > F = 0.000 | Prob > chi2 = 0.000 | Prob > F = 0.363 | |
| Log likelihood = −3183.3 | Log likelihood = −882.1 | |||
© 2017 by the authors. Licensee MDPI, Basel, Switzerland. This article is an open access article distributed under the terms and conditions of the Creative Commons Attribution (CC BY) license (http://creativecommons.org/licenses/by/4.0/).
Share and Cite
Triguero, Á.; Cuerva, M.C.; Álvarez-Aledo, C. Environmental Innovation and Employment: Drivers and Synergies. Sustainability 2017, 9, 2057. https://doi.org/10.3390/su9112057
Triguero Á, Cuerva MC, Álvarez-Aledo C. Environmental Innovation and Employment: Drivers and Synergies. Sustainability. 2017; 9(11):2057. https://doi.org/10.3390/su9112057
Chicago/Turabian StyleTriguero, Ángela, María C. Cuerva, and Carlos Álvarez-Aledo. 2017. "Environmental Innovation and Employment: Drivers and Synergies" Sustainability 9, no. 11: 2057. https://doi.org/10.3390/su9112057
APA StyleTriguero, Á., Cuerva, M. C., & Álvarez-Aledo, C. (2017). Environmental Innovation and Employment: Drivers and Synergies. Sustainability, 9(11), 2057. https://doi.org/10.3390/su9112057