Article

Spatiotemporal Effects of Main Impact Factors on Residential Land Price in Major Cities of China

1
Department of Land Resources Management, China University of Geosciences (CUG), Wuhan 430074, China
2
Department of Geography, Center for Environmental Sciences and Engineering, University of Connecticut, 215 Glenbrook Rd, Unit 4148, Storrs, CT 06269, USA
3
Institute of Geographic Sciences and Natural Resources Research, Chinese Academy of Sciences, Beijing 100101, China
4
Department of Geography and Environmental Studies, Central Michigan University, 1200 S. Franklin St., Mt Pleasant, MI 48859, USA
*
Author to whom correspondence should be addressed.
Sustainability 2017, 9(11), 2050; https://doi.org/10.3390/su9112050
Submission received: 22 August 2017 / Revised: 28 October 2017 / Accepted: 5 November 2017 / Published: 8 November 2017
(This article belongs to the Section Economic and Business Aspects of Sustainability)

Abstract

:
With the rapid development of land marketization in China, the spatial patterns of residential land prices in different regions have become increasingly complicated. The very high and continuously rising residential land prices in many cities are causing significant challenges to economic development and social stability. Yet, there has only been a limited amount of attempts made to model and analyze the regional dynamic changes of residential land price systematically, especially in term of the spatially varying effects of key demographic and economic factors. In this study we provided a perspective analysis of the changes of residential land prices in 2008, 2011 and 2014 based on the land price monitoring records of 105 cities and then conducted a geographically weighted regression (GWR) analysis on the relationships between residential land price and three major impact factors (i.e., immigrant population, gross domestic product (GDP) and investment in residential buildings). Results show that the areas in which GDP had relatively strong positive impacts on residential land price expanded with time. The negative effects of immigrant population on residential land price were mainly concentrated in the cities around the Bohai Rim and the area with negative effects gradually shrank in the three studied years. Conversely, the areas with negative correlation between investment in residential buildings and residential land price gradually expanded in size over time. A geographical detector was used to examine the relative importance of factors to residential land price. It was found that the GDP had more significant influence on residential land price than other factors and the influence of the three factors to overall variation in residential land price increased over the three studied years. These results underscore the importance of taking spatially varying effects of major driving factors into account in policy-making on regional land market.

1. Introduction

In the past three decades, unprecedented urbanization occurred in China and this phenomenon has attracted the attention of many researchers [1,2,3,4]. China’s urban population changed from 17.9% of the total population in 1978 to 54.8% in 2014. This notable global event may be the greatest human-resettlement experiment in human history [5]. Meanwhile, according to the National New-type Urbanization Plan 2014–2020, the percentage of China’s urban portion of the total population was expected to rise by 1% per year to reach 60% by 2020. Under the current situation with massive population flows into cities, anticipated increases in the demand for housing catalyzed the rapid rise of house prices [6,7,8,9]. With the purpose of preserving wealth, ordinary citizens would rather invest in real estate due to its low-risk under the huge impact of money devaluation. Also, mortgage policies for first-time buyers, such as minimum mortgage down payments decreasing from 25% of the total price to 20%, have been relaxed in all cities in 2016. Further, the Chinese government has kept tightening land supply on primary land markets. Because of these aforementioned reasons, exceptional purchasing booms, especially in big cities, have appeared in China’s real estate market. The housing prices rose by over 10 percent per year in real terms in the last decade [10] and this tendency has been going up continually. In Shenzhen, one of the most overheated housing markets in China, the house prices increased by as much as 53% in 2015 [11]. Accordingly, Chinese urban dwellers currently live under heavy pressure due to the high house prices and the forthcoming unpredictability of changes in the real estate market [12,13].
Similar to other developing countries, China has placed value on the house-purchasing capability of domestic citizens in the fast urbanization period. As an increasingly important component of house prices, urban residential land prices have become a focus of buyers, developers and government managers because of their close interaction with house prices [8,14,15]. To effectively understand the situation of the land market in China, it is necessary to know two institutional settings—the land use rights (LURs) system and the household registration system. Two levels of land markets are defined by the LURs. In the first level of land markets, local governments leased the public-owned lands in cities to users. After that, those lands can be sold, rented, mortgaged or subleased to third parties, which defines the second level of land markets [16]. According to the Interim Regulations of the People’s Republic of China Concerning the Assignment and Transfer of the Right to the Use of the State-owned Land in the Urban Areas promulgated in 1990, the land properties of urban residents are owned by the Chinese government and legal residential land properties can be owned for only 70 years by individuals or organizations. In 1992, with the implementation of promoting the construction of a market economy system by the central government of China, the land marketization of China had been enhanced. In 2002, the Ministry of Land and Resources of China issued its Tender Auction Listing Transferring State-owned Land Use Rights Provision, which clearly pointed out that the general operation of land use rights must be done through tender, auction, or listing. In 2007, these transformation methods were strengthened intensively. Although the first level land market was intervened by governments, the market-oriented mechanisms on land market had been strengthened with the development of the market economy [17]. The gap between land supply and demand narrowed with the developing of regional economies [18].
The other institutional framework is the household registration system (i.e., hukou in Chinese pronunciation) in China. A hukou is a personal record in the household registration system required by law. Each Chinese citizen was assigned either a rural or an urban hukou bounded with a local administration and one’s hukou status is normally inherited at birth time from the hukou status of his/her parents. Furthermore, one’s hukou status would remain unchanged no matter where the individual physically moved, unless he or she went through a formal procedure of hukou conversion [19]. With the limitation of the hukou system, many migrant workers have to move back and forth between rural and urban areas. Because railway tickets have become relatively cheap, a large number of migrant workers can enter cities by train easily. According to the report from the China Railway Corporation of 2014, the railway passenger traffic volume was 2.32 billion throughout the year, which increased by over 10% for two consecutive years [20]. In the unprecedented transformation process, increasing demand for house construction from immigrants may bring spatial spillover effects on land price [21,22]. In addition, In spite of the strict limitations on settlement in urban areas, a handful of people still can get the urban hukou and settle down in cities because of their excellent performance or of enough accumulation of wealth. The increasing demand from migrants for construction land is unavoidable and one way to cope with the unavoidable increases in the demand for land is to let the land price operate as a lever. For example, high housing prices can hinder the migration of population, resulting in a relative balance of population and land price.
As a manager, the Chinese government attempted to adjust and optimize the land market in many ways. One of important methods is the use of the China Urban Land Price Dynamic Monitoring System [23], which covered 46 cities in 2000 and 105 cities since 2008. Even though the posted land price indices and price trends have the potential to guide policy makers in construction land supply planning, figuring out ways to effectively manage urban residential land prices is still a difficult task. The reasons that justify residential land price changes tend to be difficult to pinpoint. For example, what are the factors commonly associated with increasing urban residential land prices? In particular, what are the local varying effects? Knowledge of this spatial variation could provide important insights into understanding the urban housing and land management problems.
Since land price plays an important role in social and economic development, it has attracted much attention from academia and the topic has produced many studies. According to a complete residential market analysis model, Potepan [14] found that urban land price is influenced by endogenous and exogenous factors. He also pointed out that the two most important impact factors, household income and construction costs, caused land prices to vary between metropolitan areas. Recently, combining Potepan’s (1996) real estate model with Roback’s [24] spatial equilibrium approach, Bischoff [25] proved the interdependency of housing prices, rental prices, building land prices and income through one simultaneous equilibrium analysis. Results showed significantly positive interaction effects between income and real estate prices. In particular, the expectation of population growth seems to be one of the most important determinants to inter-regional prices. Due to the externality of market, it is difficult to optimize the market efficiency simply through the market mechanism. In order to improve the efficiency of land resource allocation, governments may use economic, legal and administrative means to intervene in the land market, such as land use regulation, urban planning and taxes. Katz and Rosen [26] found that land use regulations appeared to have a substantial effect on house prices in the San Francisco Bay Area, because house prices were 17% to 38% higher in those communities where growth moratoria and/or growth control plans were present. In the case of cities in Florida, Ihlanfeldt [27] found that the more heavily regulated the cities are, the lower the land prices would be. But there is also an argument that land use regulations may not be able to raise the land price and their impact on land price is controlled by the market environment [28]. Similar to land use regulations, urban planning may cause the rise of urban land prices but sometimes it also may cause a decline in land prices [29]. Many studies showed that taxes could lead to a rise in land price [30]. Local land taxes were also utilized to adjust land price. In general, taxes can affect urban land price and the effect is mostly positive [31].
There is no doubt that policy factors have a significant influence on land price changes. In addition, two important factors were discussed in this topic as well. The first one is the demographic factor. It is not hard to find that demographic factors have received wide attention for indicating the change of land demand. The study of Rose [32] revealed strong positive correlations between land price and the level of population or population growth rate. Rye [33] indicated that migration decisions of youths in a remote rural region in Norway resulted from individual and free choices but were still structured by their rural class habitus. Saiz [34] also indicated that rents and housing values in US destination cities are pushed up by immigration. When the inflow of immigrants is equivalent to 1% of the urban population, the average rent and housing value will rise by about 1%. The changing immigrant population was neglected in the previous studies of land price spatial distribution, though it should be one of the key factors that counteract the effect of the Chinese household registration system.
The second one is the economic factor. For example, local per capita GDP [17], average income [14], income-tax deductions for mortgage interest [21] and real interest rate [15] were discussed in literature. China’s domestic gross product (GDP) has increased significantly in recent decades. Plenty of research has proved that GDP has a very close relationship with the housing and land prices [17,35]. Thus the impact of GDP on China’s land market cannot be neglected. Moreover, regional inequalities may be attributed to the regional unequal distribution of public investment [36]. As a part of real estate investment, construction cost is a main dynamic factor impacting land price. A panel data analysis of 46 prefectures in the period of 1980 to 2002 in Japan showed that the more volatile the change in real construction cost was, the lower the mean reversion would be [37]. Under the background of macroeconomic fluctuations, Liu et al. [38] found that positive co-movement between land price and business investment is a driving force behind the broad impact of land price dynamics on the macro economy. Increasing inflow of foreign capital into China’s land market every year and heterogeneous investment behaviors in different cities increased the complexity and uncontrollability of the land market [39,40]. Therefore, more attention should be paid to the investment market factors.
With the rapid development of land marketization in China, the spatial patterns of residential land prices in different regions have become increasingly complicated [8,16,18,40]. The very high and continuously rising residential land prices in many cities are posing significant challenges to economic development and social stability. Yet, there has been little attempt to model and analyze the regional dynamic changes of residential land price systematically, especially in term of spatially varying effects of key demographic and economic factors. The variation of urban land price is a result of interactions among multiple factors, which is the reason why a reliable, market-based analysis must be conducted on a timely basis. Therefore, our study focuses on a reliable analysis of the underlying demographic and economic factors that affect the essential spatial and temporal change of land price in 2008, 2011 and 2014 with the GWR model, as well as the relative importance of factors on residential land price when using the geographical detector method.

2. Variables and Methodology

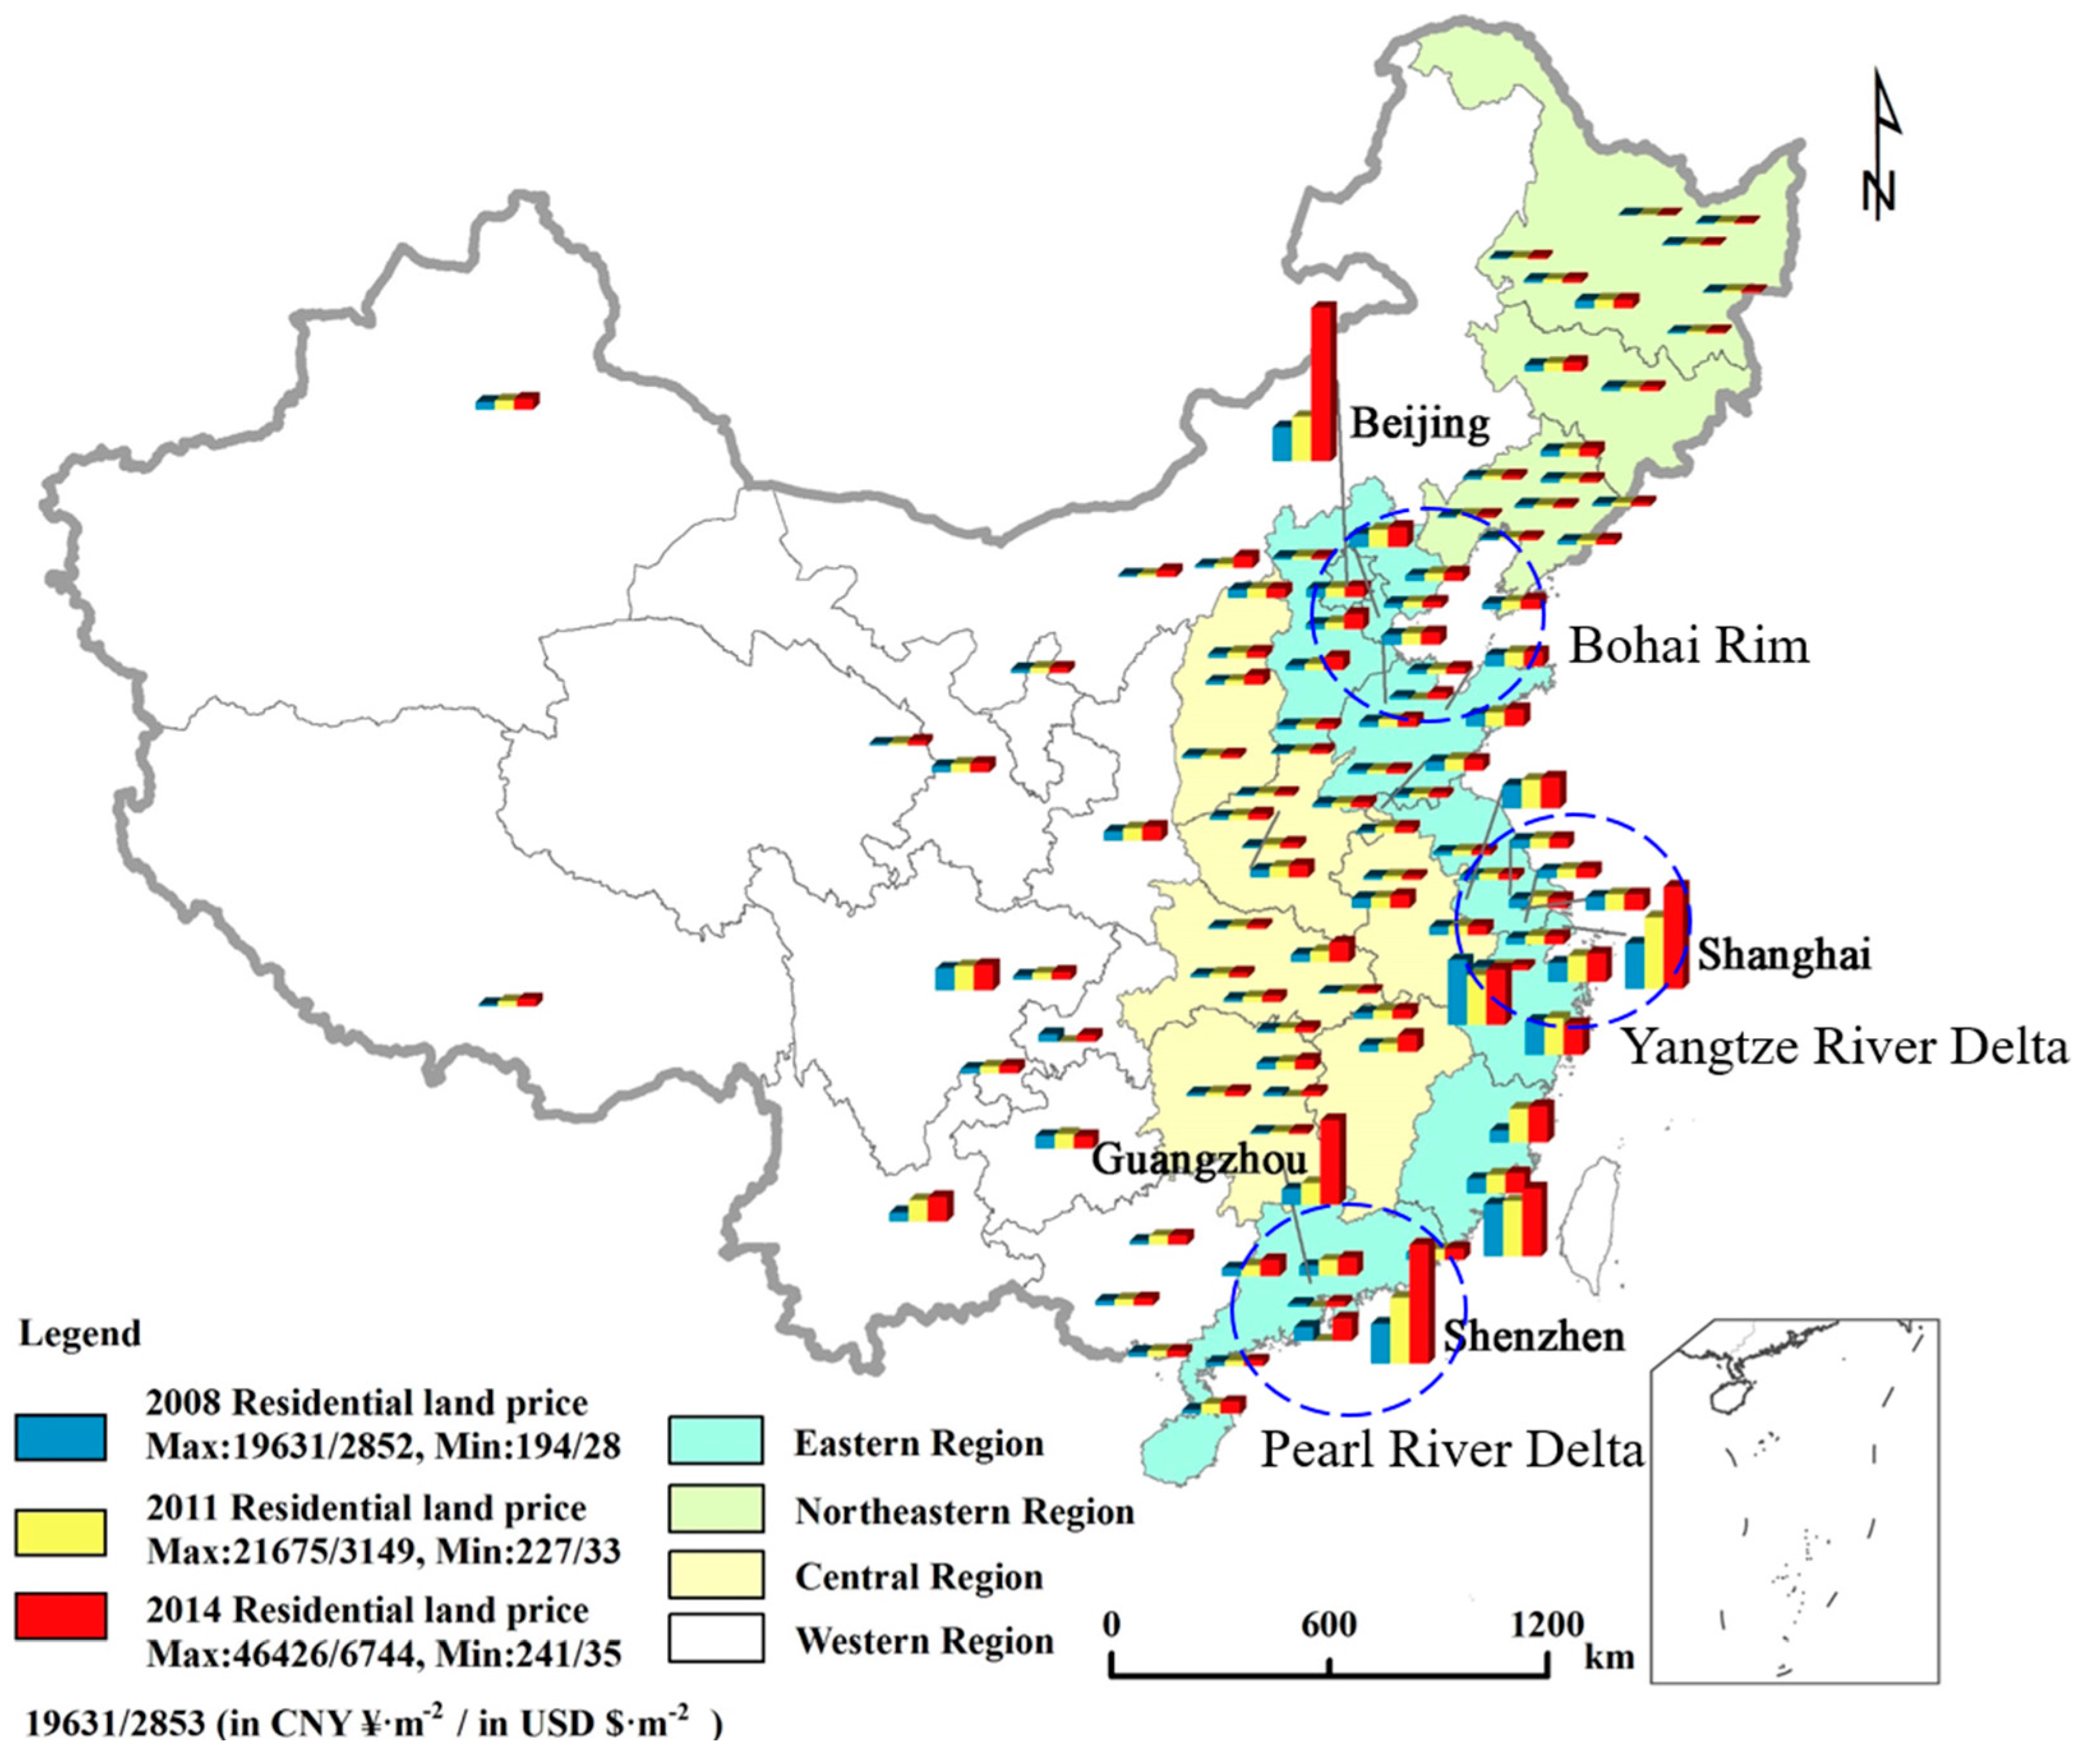
2.1. Urban Residential Land Price

As a land price information provider, the China Urban Land Price Dynamic Monitoring System was gradually established during the 2000s. This system is able to collect data through the land price monitoring points, process data and generate a series of land price indices, thus ultimately achieving the purposes of observing, describing and evaluating urban land prices. The types of land being monitored include commercial land, residential land and industrial land. The monitoring results are reported annually and quarterly at national level, provincial level and special economic zones. For example, monitoring was particularly set up in key economic areas (e.g., the Yangtze River Delta Region, the Pearl River Delta Region and the Bohai Rim), 105 key cities and some other geographic areas (including East Region, Central Region and West Region). Moreover, the fiducial dates for annual and quarterly reports are December 31st each year and the last day of each quarter, respectively. The dynamic monitoring indicators include land price, price change, premium growth rate and price index.
In order to understand the change process of land price further, we selected 105 monitored cities as our study examples and built a database, which includes residential land prices and geographical coordinates in different monitoring periods. All the data were obtained from the China Urban Land Price Dynamic Monitor [23], who collected them during 2008 to 2014. We herein report the difference of land price among 2008, 2011 and 2014 (Figure 1). In order to eliminate abnormal data points, the frequency distribution curve (quantile-quantile plot) was constructed for samples’ normality test. The majority of land price data from the 105 samples follow a lognormal distribution in 2008, 2011 and 2014 (Figure 2).

2.2. Impact Factors

In previous studies, it was found that the complexity of spatial variation of land price results from the combined effects of many driving factors. Based on location theory and supply-demand theory, considering the complicated land market in China and the available databases, representative elements were chosen to analyze the spatially varying effects on residential land price after a series of statistical analyses, including immigrant population [22,32,33,34], gross domestic product (GDP) [17,35] and investment in residential buildings [36,37,38,39,40]. The economic data are from the China City Statistical Yearbook directly [41]. The data of population, which were handled by statistical methods, are from the Population Census of the People’s Republic of China. Because the monitored residential land prices were calculated at the district-level in each city in this study, for consistency, all the data of factors were collected by districts as well. Table 1 provides a statistical description of the variables, as well as the Pearson’s correlation coefficients (r) between land price and factors. All the related factors exhibit significant correlation with land price. In addition, the results of VIF tests (i.e., VIF < 10) show that the multicollinearity problem is not a concern. All the above analyses suggest the variables are suitable for regression analysis.

2.3. Methods

Hedonic models have been used to study the relationships between real estate prices and impact factors [15,42]. Clapp [43] estimated local house prices with a semiparametric method and indicated that a local regression model may add significant information to the hedonic model. However, hedonic estimates of implicit market prices could be biased, if correctly specified variables for optional price were absent [44]. Based on a comparison of different methods, this study uses the geographically weighted regression (GWR) approach [45] for a relationship analysis between urban residential land price and its impact factors. GWR is a local spatial statistical method for evaluating how the relationships between a dependent variable and one or more explanatory variables change spatially. As one of the useful tools to explore the spatial local heterogeneity, GWR has been widely used in many fields in recent years, For example, the geographic variation and impact factors of urban public green space availability [46], peri-urban agriculture [47], noise pollution [48], population [49] and resident recreation demand [50] have been investigated with GWR. The GWR method was usually compared with global spatial statistical methods, such as the ordinary least squares (OLS) regression, regression kriging, or co-kriging and the comparisons showed the advantages of GWR in improving mapping quality and exploring spatially varying local relationships [47,48,49,50,51]. In addition, the relative importance of various factors underlying residential land price is helpful to policy establishment. Geographical detector, as a spatial method, has been used to detect the contribution of explanatory variables to response variables in recent years [52,53]. For example, Wang [52] first used it to explore the relationship between risk factors and certain diseases. Subsequently, it was applied to measure the effects of potential factors on geographical phenomena, such as the relationship between human activity and urban forest landscape connectivity [54], the spatial correlations among socio-economic factors and the distribution of rural settlements [55] and the effects of potential factors on housing prices [56]. In this study, we attempt to use the geographical detector method to investigate the relative importance of external factors on residential land prices.

2.3.1. Geographically Weighted Regression

Traditional regression methods such as the ordinary least squares (OLS) regression method are global statistics, which assume that the relationships under study are constant over space. In contrast to a global model, GWR permits the relationships between the dependent variable and independent variables to vary spatially [45]. The basic GWR expression is:
y j = β 0 ( u j , v j ) + i = 1 p β i ( u j , v j ) x i j + ε j
where ( u j , v j ) represents the coordinates at location j , β 0 ( u j , v j ) is the intercept coefficient at location j , β i ( u j , v j ) is the local regression coefficient for the independent variable x i at location j . The estimator of the local parameters is obtained by
β ^ ( u j , v j ) = [ X T W ( u j , v j ) X ] 1 X T W ( u j , v j ) Y
where β ^ ( u j , v j ) represents the estimates of the location-specific parameters; X is a data matrix of the independent variables; Y is a data vector of the dependent variable; and W ( u j , v j ) is the local weight matrix which acts to ensure that observations closer to the evaluation point have bigger weights. Empirical findings suggest that the adaptive bi-square function should be used for weight estimation when the sample density is not uniform across the study area. In the study, the Akaike Information Criteria (AIC) was adopted to determine the adaptive bandwidth.

2.3.2. Geographical Detector

Wang et al. [52,53] proposed a geographical detector, which can quantitatively indicate the relative importance of a set of independent variables to a dependent variable. In this study, the geographical detector was used to investigate the relative influences of external factors quantitatively on the residential land price. After the spatial matching analysis, a fundamental assumption can be drawn that if residential land price was affected by a particular factor, the distribution of this factor would have significant consistency with that of residential land price in the geographical space [56]. P D , H is defined to express the power of determinant D to the residential land price H.
P D , H = 1 1 n σ H 2 i = 1 m n D , i σ H D , i 2
where P D , H is the power of determinant of factor D on the residential land price, m denotes the number of the sub-regions, n denotes the number of cities in the entire region, n D , i is the number of cities in sub-regions, σ H 2 and σ H D , i 2 are the global variance of residential land price in the entire region and the variance of residential land price in the sub-regions, respectively. Within a range of values from 0 to 1, the larger the value of P D , U is, the greater the effect of D on the residential land price will be.

3. Results

3.1. Estimation of GWR Models

Moran’s I of GWR residuals, AICc, R2 and adjusted R2 generated by the GWR models for the data of 2008, 2011 and 2014 were presented in Table 2. The Moran’s I values of GWR residuals for 2008, 2011 and 2014 data are −0.01, 0.01 and −0.01, respectively. The small autocorrelation of residuals indicates that there is no obvious excessive prediction or insufficient prediction. The model fitting of GWR produces an averaged R2 value of 0.65 for 2008, 0.74 for 2011 and 0.79 for 2014, respectively. This means that more than half variability in residential land price data of monitored cities can be explained by the three major explanatory variables. The adjusted R2 values obtained using GWR are 0.54 for 2008, 0.66 for 2011 and 0.71 for 2014, respectively. Table 3 provides the parameter estimates of the GWR models, including a measure of the spatial variation in the relationships between residential land price and explanatory variables—the Inter-Quartile Range of the parameter estimates. The results of “DIFF of Criterion” tests (i.e., DIIF < 2) [57] suggest that the three factors are better assumed to be local.

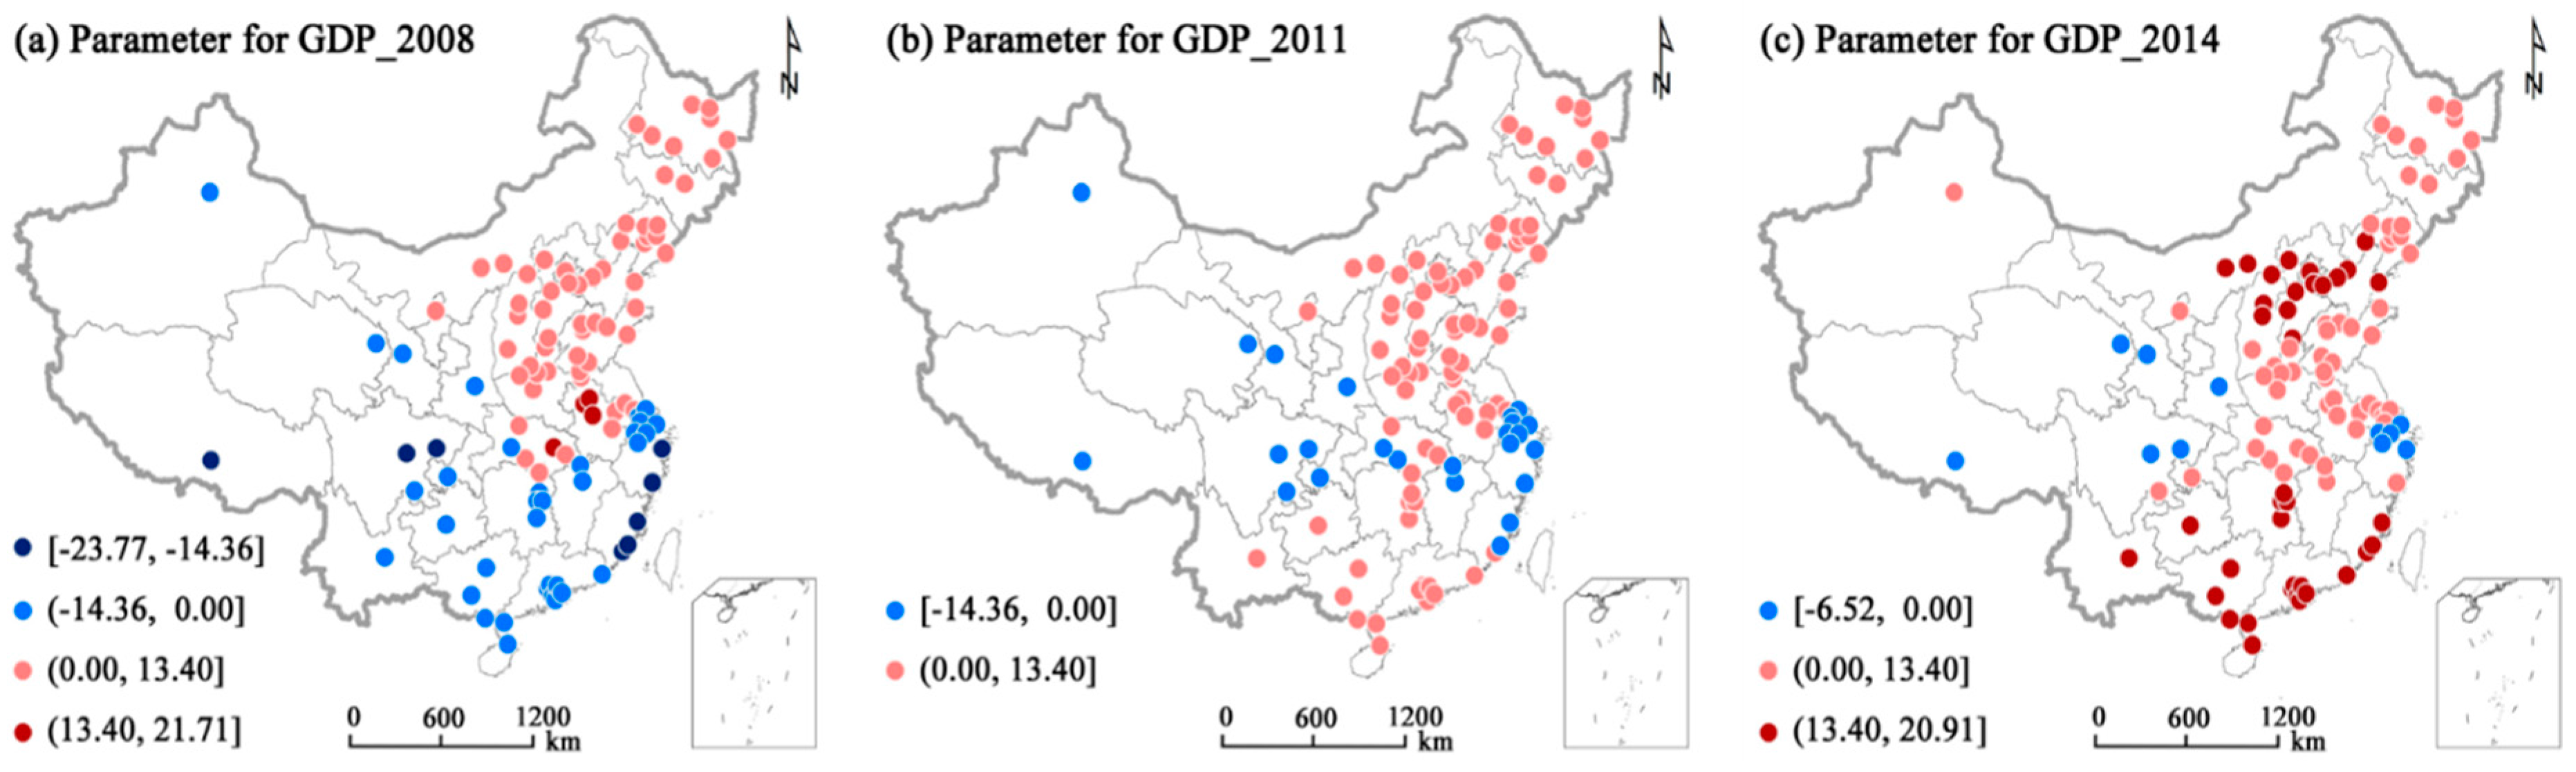
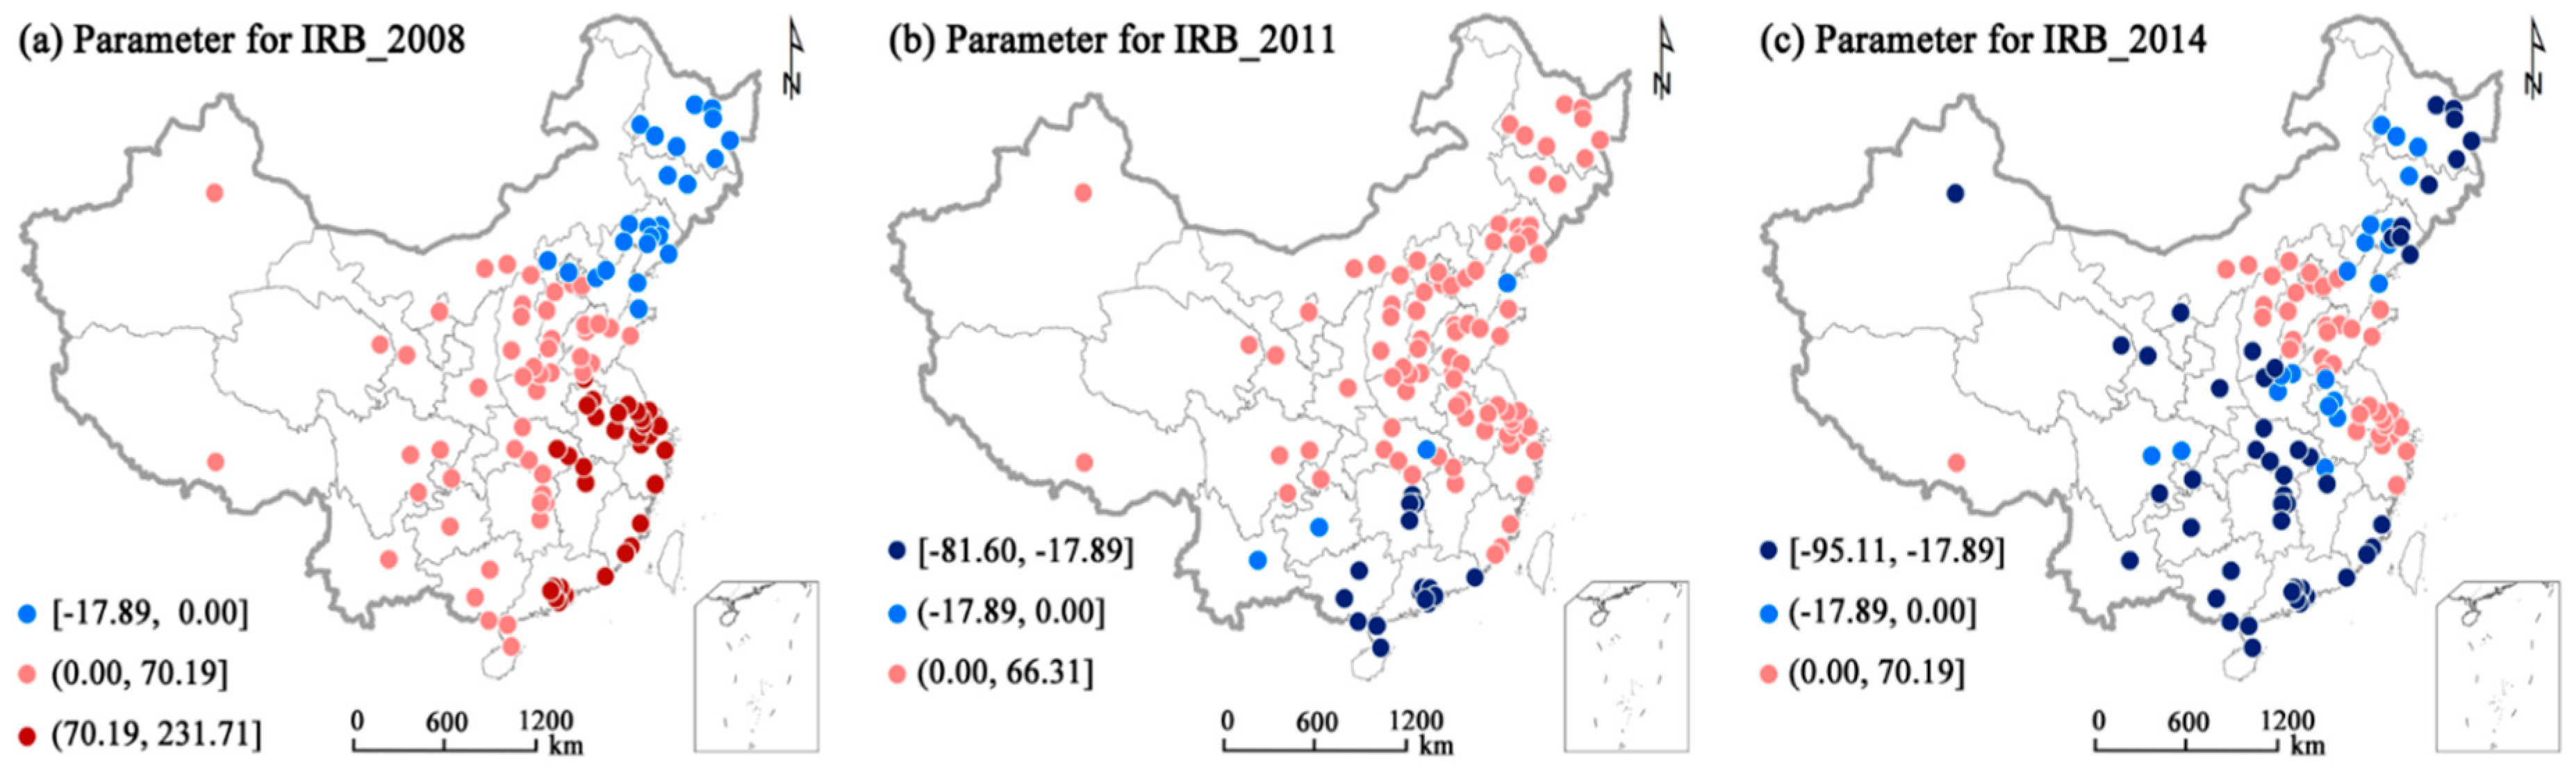
3.2. Spatially Varying Effects of Impact Factors

The maps in Figure 3, Figure 4 and Figure 5 show the local coefficients of the GWR models, which represent the local relationships between residential land price and the three explanatory variables. All the coefficients present significant spatial heterogeneity, indicating that the relationships between land price and impact factors are locality-specific.
Figure 3 displays the spatial variation of the estimated GWR local coefficients of gross domestic product in 105 cities for 2008, 2011 and 2014. Positive effect values occur in northern China and negative effect values appear in southern and western China in 2008. In 2011, the positive effect expands from northern China to southern China. A further expansion of the positive effect took place in 2014—in almost all cities the GDP shows positive effect on residential land price except for in some cities in the Yangtze River Delta region and in a few cities in western China. In general, the area where the GDP has strong positive impacts on residential land price became larger with time, which means that GDP had a positive effect on residential land prices in more cities over time.
The spatial changes for regression coefficients of the immigrant population variable for different years are shown in Figure 4 The local coefficients range from −21.40 to 36.72 for 2008, from −8.15 to 31.37 for 2011 and from −8.36 to 30.15 for 2014, showing obvious spatial variations in the relationship between residential land price and immigration population. The cities in which immigrant population numbers had a negative effect on land prices are located mainly around the Bohai Rim. A similar distribution of regression coefficients appeared in 2011, with the main difference being that the area with negative effects of immigrant populations became smaller than that in 2008. By 2014, negative effects of immigrant populations only existed in Beijing and 14 nearby cities, while there were positive effects in all other cities and strong positive effects in cities in northeastern and western China. In general, the negative effects of immigrant population on the residential land price mainly appeared in the cities around the Bohai Rim and the area with negative effects gradually shrank in size in the three studied years, presenting an obvious clustering distribution.
In 2008, investment in residential buildings was strongly and positively associated with land price in most cities, particularly in southeast China, except that weak negative associations occurred in the cities in the northeast region (Figure 5). In 2011, the positive effect increased and the negative effect decreased. However, the local GWR coefficient results reveal that negative relationships existed in 68 cities (65%) in 2014 and such relationships were strong in northeastern and southern China. The positive relationships mainly appeared in some cities in the Yangtze River Delta region and the Bohai Rim. Contrary to GDP and immigration population, the area with negative effect of investment in residential buildings on residential land price gradually increased.

3.3. Factors Detection

The results from the geographical detector highlight the relative importance of the impact factors listed in Table 1. The influences of immigrant population, gross domestic product and investment in residential buildings on residential land price all increase over time (Figure 6). In 2008, it can be ranked by the power of determinant (PD) values as follows: IP (0.45) > GDP (0.37) > IRB (0.12). This result shows that immigrant population can predominantly explain the spatial variability of residential land prices, followed by the gross domestic product and investment in residential buildings. This is explained by the fact that the immigrant population is a manifestation of the attractiveness of a city. In 2011, immigrant population (0.46) ranked in second place behind gross domestic product (0.50). Investment in residential buildings (0.23) was of least importance among the three driving forces. Gross domestic product (0.81) had the greatest impact on residential land price in 2014, when immigrant population (0.59) had the second-strongest effect and investment in residential buildings (0.41) had the smallest effect. In addition, we can find the three factors all have increasing PD values, which indicate the increasing importance of these factors on overall variation in residential land price.

4. Discussion

4.1. Relationship between Land Price and GDP

The differences in land marketization level between well-developed coastal regions and underdeveloped interior regions did not emerge until recently [40]. The number of cities that have high absolute values in coefficients (>13.4 or <−14.36) for GDP decreased in 2011 (0%) and increased in 2014 (25%) compared with that in 2008 (11%) in Figure 3 This phenomenon may be caused by reasons such as the 2008 economic crisis which might disturb the spatial distribution of the correlations. With a gradual recovery in 2014, the correlation between residential land prices and GDP also recovered to some extent but the differences between south China and north China still exist. The influence of GDP in explaining variation amongst the three variables was strong, as it was found to have higher PD values (0.37 in 2008, 0.50 in 2011 and 0.81 in 2014). One reason for the positive correlations may come from land finance, which weakened the power of land price restriction imposed by local governments. Local governments heavily used land acquisition policies to fuel urban development and finance infrastructure provision [16]. Some research found that the strict regulation restrictiveness increased house prices and decreased land prices [27]. Moreover, land sale income accounted for 59.8% of local fiscal revenue in 2013, according to the data published by the Ministry of Finance of China. Land supply strategies adopted by municipal governments were motivated by their interests to maximize long-term profits in economic growth.

4.2. Relationship between Land Price and Immigrant Population

China has been traditionally an agricultural country for a long time and until recently the majority of China’s population was rural. There will continue to be large numbers of people migrating from rural areas to urban areas as long as the income from agricultural operations is much less than that from labor works in city. Urbanization gathers people, industries and money into cities, causing an urgent demand of land [1,2,4]. With scarce land resources in the city, some real estate developers scramble for resources by bidding the highest prices based on optimistic growth forecasts in land prices or on their reputation in the real estate industry. At the same time, due to the restriction of the Chinese household registration system, settling down in an urban area is considered desirable and worthy of pursuing for modern amenities or better education for children [19,58]. Consequently, these actions will drive the land prices up. With the rapid development of the economy and gradual increase of the population, the positive relationship between immigration and land price (Figure 4) will be further boosted by the increasing immigrant population. This strong correlation importance between immigration and land price generated high PD values of 0.45 in 2008, 0.46 in 2011 and 0.59 in 2014 (Figure 6). However, the “urban disease” of social issues such as traffic congestion, pollution, as well as healthcare access and cost, still bothers those cities with relatively strong levels of competitiveness. To solve this problem, the National New-type Urbanization Plan 2014–2020 emphasized that cities with a population of more than 5 million should be subject to strict population controls. In order to bring population growth under control, there was a decline in residential land supply after the Chinese government strengthened the intervention in land market [59]. It was also found that land price is positively and significantly correlated with the behavior of hoarding land by local governments [60]. Thus, it is a feasible choice for governments to deal with population pressure with the help of high land prices, especially in first-tier (i.e., very well-developed) megacities in China such as Beijing. This may be a possible explanation for the result that the cities with a negative correlation were reduced to Beijing and surrounding 14 cities in 2014 (Figure 4c).

4.3. Relationship between Land Price and Investment in Residential Buildings

Although investment in residential buildings was of least importance among the three factors for all the studied years (Figure 6), it positively correlates with residential land price, via a high PD value of 0.41 in 2014. Due to continuous appreciation of RMB exchange rate, increasing property prices and relaxed housing purchase restriction in recent years, there is no doubt that real estate has become a safe asset in the investment market [61]. A fake land demand will be created when a large amount of money is unjustifiably poured into the real estate industry. Then, the overheated real estate market will push up the land price. Areas with strong positive impacts shrank during the last three years, which may suggest that investment in residential buildings contributed to the increase of land price during the down economy and the decrease of land price during the economic recovery (Figure 5). This means that investment needs to be balanced with the market economic environment; otherwise additional investments can lead to excess supplies and eventually result in a surplus real estate inventory. This should be why the severe pressure on stock caused the emergence of many empty real estates in some lower-tier (i.e., less well-developed) cities in China (ghost towns) [62]. In addition, the spatial effect of investment in residential buildings on residential land price is different (Figure 5), which show that individual Chinese real estate investment may be affected by institutional and demographic factors [63].

4.4. Potential Strategies on Residential Land Price Management

The results of this study show that land price has a close relationship with immigrants, investment in residential buildings and GDP. The recent urban-rural land use situation shows that the increasing trend in land prices has not been stopped in China. Therefore, appropriate policies may be taken to keep stability of the land market.
As we all know, there will be a bubble forming in land market when the land price growth is much higher than what is reasonable. In order to control the potential harm from the bubble in potential real estate, we recommend strengthening the monitoring of land price changes as a fundamental step to control the coordinated development between residential land price and GDP reasonably. Besides, it is particularly necessary for including more lower-tier cities into the monitoring system, because of the impact of a policy in some areas may spill over into the housing markets of neighboring areas [64]. We may also need to rethink how to reformulate the monitoring system and what new information can be used to direct the development of the land market, such as monitoring changes in the stock of available land and real estate inventory in each city.
In China, the rural population plays an important role during the rapid urbanization. The trend of immigration from rural areas to urban areas has significantly been influenced by the implementation of the household registration system (hukou). Although some studies have discussed the reforms of China’s “hukou” system from the perspectives of social inequality [58], labor market discrimination [19] and so on, more attention should be given to short- and medium-term prospects of reform in hukou, which could help to ease the pressures associated with the problems of migrant workers from rural areas and the real estate inventory. The proposed in-situ urbanization strategy highlights the development of until now undeveloped countryside. So the problem is not how to deal with the migrants from rural areas to urban areas but how to make the rural immigrants live like urban residents. In-situ urbanization is useful for decreasing the land demands of big cities and promoting the economic development of small cities [65].
In addition, different from central and western China, the eastern coastal regions of China have experienced rapid residentialization and urbanization [3]. The responsiveness of investment to demand shocks may be decreased by the geographic constraints [66]. As a result, there is an obvious difference in execution and efficiency of land use policy between different cities [10]. For example, in order to avoid real estate speculators, different cities have imposed different house-purchase restrictions since 2010. The new policy of relaxing home-purchase restrictions may work well in some small cities. However, in some big cities such as Shenzhen, this policy has brought a new round of land price increase. This will create the possibility of having more expensive lands (land kings) due to the rush of buying houses. Therefore, considering the different phenomena in the Chinese urban land market, continuous high land prices in large cities and a large surplus of residential buildings in lower-tier cities, locality-specific policies should be considered by local governments.

4.5. Limitations of This Study

Several limitations of this study should be mentioned here: (1) Some factors of land market, such as urban land supply [59,67], were not considered in this study. In addition, the magnitudes of the effects of some factors are different between large cities and small cities. For this reason, separate analyses may be helpful to get more accurate results. (2) Long time series analysis may be necessary to achieve a clearer expression of the dynamic change of urban land price. Our estimates seem limited in some areas because of the complexity of land use and economic development. (3) In order to reduce the potential limitation of sampling density in GWR model [68,69], more available samples should be used to detect the relationship between residential land price and factors with advances in the China urban land price dynamic monitoring system. (4) Social-economic factors have a lagging effect on the residential land prices of about three years [67]. Similar issues may exist in the factors analyzed in this study (e.g., investment in residential buildings). Future studies are expected to deal with these limitations.

5. Conclusions

Land price change attracts close attention from government officials and researchers, because land price directly impacts the livelihood of the people especially in developing countries. This study intends to obtain a better understanding of the spatial variation of urban residential land prices caused by long-term marketization and major impact factors in China, using a local spatial statistical method–GWR and a geographical detector. It is important to make full use of the existing land price monitoring data to analyze the trend of land price change.
The spatial distribution maps of estimated coefficients for the three explanatory variables (immigrant population, GDP and investment in residential buildings) in 2008, 2011 and 2014, obtained from GWR analysis, indicate that the relationships of these impact factors with land price are spatially non-stationary. The area where GDP has strong positive impact on residential land price increased in size in the studied years, which means that GDP had positive effect on residential land price in more cities over time. The negative effects of immigrant population on the residential land price mainly appeared in the cities around the Bohai Rim and the area with negative effects gradually shrank in size in the three studied years, presenting an obvious clustering distribution. Conversely, different from GDP and immigration population, the areas of negative correlation between investment in residential buildings and residential land price gradually increased over time.
For the selected explanatory variables, immigrant population had the greatest impact on residential land price in 2008. Its influence declined subsequently and it ranked second in terms of the importance to residential land price in 2011 and 2014, while GDP became the strongest impact factor. Investment in residential buildings was of least importance among the three forces for all the studied years. Moreover, the three factors all have increasing PD values with time, indicating their increasing explanation ability on the overall variation in residential land price.
In addition, the relationships between residential land price and the three factors were discussed separately. These results underscored that it is very important to take the spatially varying effects of major driving factors into account during the process of policy-making in the regional land market. In the future, it is necessary for the Chinese government to consider how to prevent the soaring growth of land prices through developing in-situ urbanization, implementing locality-specific land management policies and optimizing the China Urban Land Price Dynamic Monitoring system.

Acknowledgments

This study is supported by Chinese National Science Foundation (No. 41671518) and Special Fund for Public Welfare Research of Ministry of Land and Resources in China (No. 201511004-2). The authors would like to thank the anonymous reviewers and handling editors for their constructive comments that greatly improved this article from its original form; as well as Sheng Cheng from China University of Geosciences, Wuhan, for his kindly suggestions in the revision.

Author Contributions

All authors have contributed to the intellectual content of this paper. Shougeng Hu designed the research. Shengfu Yang conducted the research and wrote the manuscript. Weidong Li and Chuanrong Zhang helped revise the manuscript. José A. Torres also provided many suggestions and revised this paper. All authors have read and approved the final manuscript.

Conflicts of Interest

The authors declare no conflict of interest.

References

  1. Siciliano, G. Urbanization strategies, rural development and land use changes in China: A multiple-level integrated assessment. Land Use Policy 2012, 29, 165–178. [Google Scholar] [CrossRef]
  2. Yang, X.J. China’s rapid urbanization. Science 2013, 342, 310. [Google Scholar] [CrossRef] [PubMed]
  3. Long, H. Land use policy in China: introduction. Land Use Policy 2014, 40, 1–5. [Google Scholar] [CrossRef]
  4. Chen, M.; Liu, W.; Lu, D. Challenges and the way forward in China’s new-type urbanization. Land Use Policy 2016, 55, 334–339. [Google Scholar] [CrossRef]
  5. Bai, X.; Shi, P.; Liu, Y. Realizing China’s urban dream. Nature 2014, 509, 158–160. [Google Scholar] [CrossRef] [PubMed]
  6. Ottensmann, J.R. Urban sprawl, land values and the density of development. Land Econ. 1977, 53, 389–400. [Google Scholar] [CrossRef]
  7. Gillen, M.; Fisher, P. Residential developer behaviour in land price determination. J. Prop. Res. 2002, 19, 39–59. [Google Scholar] [CrossRef]
  8. Wen, H.; Goodman, A.C. Relationship between urban land price and housing price: Evidence from 21 provincial capitals in China. Habitat Int. 2013, 40, 9–17. [Google Scholar] [CrossRef]
  9. Zou, G.L.; Chau, K.W. Determinants and sustainability of house prices: The case of Shanghai, China. Sustainability 2015, 7, 4524–4548. [Google Scholar] [CrossRef] [Green Version]
  10. Glaeser, E.; Huang, W.; Ma, Y.; Shleifer, A. A real estate boom with Chinese Characteristics. J. Econ. Perspect. 2017, 31, 93–116. [Google Scholar] [CrossRef]
  11. The Economist. For Whom the Bubble Blows: House Prices are Soaring in Big Cities, but Oversupply Plagues Much of the Country. Available online: http://www.economist.com/news/finance-and-economics/21694530-house-prices-are-soaring-big-cities-oversupply-plagues-much (accessed on 25 September 2016).
  12. Hui, C.M.; Wang, X.R.; Jia, S.H. Fertility rate, inter-generation wealth transfer and housing price in China: A theoretical and empirical study based on the overlapping generation model. Habitat Int. 2016, 53, 369–378. [Google Scholar] [CrossRef]
  13. Wu, J.; Gyourko, J.; Deng, Y. Evaluating the risk of Chinese housing markets: What we know and what we need to know. China Econ. Rev. 2016, 39, 91–114. [Google Scholar] [CrossRef]
  14. Potepan, M.J. Explaining intermetropolitan variation in housing prices, rents and land prices. Real Estate Econ. 1996, 24, 219–245. [Google Scholar] [CrossRef]
  15. Bourassa, S.C.; Hoesli, M.; Scognamiglio, D.; Zhang, S. Land leverage and house prices. Reg. Sci. Urban Econ. 2011, 41, 134–144. [Google Scholar] [CrossRef]
  16. Ding, C. Policy and praxis of land acquisition in China. Land Use Policy 2007, 24, 1–13. [Google Scholar] [CrossRef]
  17. Wang, R. The structure of Chinese urban land prices: Estimates from benchmark land price data. J. Real Estate Financ. Econ. 2009, 39, 24–38. [Google Scholar] [CrossRef]
  18. Burnett, P. Land use regulations and regional economic development. Land Econ. 2016, 92, 237–255. [Google Scholar] [CrossRef]
  19. Song, Y. Hukou-based labour market discrimination and ownership structure in urban China. Urban Stud. 2015, 53, 1657–1673. [Google Scholar] [CrossRef]
  20. China Railway. Interpretation of 2014 Railway and Outlook of 2015 Railway. 2015. Available online: http://www.chnrailway.com/html/20150213/804453.shtml (accessed on 15 September 2016).
  21. Voith, R. How responsive is the demand for residential land to changes in its price? Bus. Rev. 2001, Q3, 33–39. [Google Scholar]
  22. Van der Vlist, A.J.; Czamanski, D.; Folmer, H. Immigration and urban housing market dynamics: The case of Haifa. Ann. Reg. Sci. 2011, 47, 585–598. [Google Scholar] [CrossRef]
  23. China Urban Land Price Dynamic Monitor. Available online: http://www.landvalue.com.cn (accessed on 10 February 2016).
  24. Roback, J. Wages, rents, and the quality of life. J. Political Econ. 1982, 90, 1257–1278. [Google Scholar] [CrossRef]
  25. Bischoff, O. Explaining regional variation in equilibrium real estate prices and income. J. Hous. Econ. 2012, 21, 1–15. [Google Scholar] [CrossRef]
  26. Katz, L.; Rosen, K.T. The interjurisdictional effects of growth controls on housing prices. J. Law Econ. 1987, 30, 149. [Google Scholar] [CrossRef] [Green Version]
  27. Ihlanfeldt, K.R. The effect of land use regulation on housing and land prices. J. Urban Econ. 2007, 61, 420–435. [Google Scholar] [CrossRef]
  28. Pollakowski, H.O.; Wachter, S.M. The effects of land-use constraints on housing prices. Land Econ. 1990, 66, 315–324. [Google Scholar] [CrossRef]
  29. Chattopadhyay, S. Estimating the demand for air quality: New evidence based on the Chicago housing market. Land Econ. 1999, 75, 22–38. [Google Scholar] [CrossRef]
  30. Bramley, G. The impact of land use planning and tax subsidies on the supply and price of housing in Britain. Urban Stud. 1996, 30, 5–30. [Google Scholar] [CrossRef]
  31. Fehribach, F.A.; Rutherford, R.C.; Akin, M.E. An analysis of the determinants of residential property valuation. J. Real Estate Res. 1993, 8, 365–376. [Google Scholar]
  32. Rose, L.A. Urban land supply: Natural and contrived restrictions. J. Urban Econ. 1989, 25, 325–345. [Google Scholar] [CrossRef]
  33. Rye, J.F. Youth migration, rurality and class: A Bourdieusian approach. Eur. Urban Reg. Stud. 2011, 18, 170–183. [Google Scholar] [CrossRef] [Green Version]
  34. Saiz, A. Immigration and housing rents in American cities. J. Urban Econ. 2007, 61, 345–371. [Google Scholar] [CrossRef]
  35. Quan, D.C.; Titman, S. Do real estate prices and stock prices move together? An international analysis. Real Estate Econ. 1999, 27, 183–207. [Google Scholar] [CrossRef]
  36. Costa-I-Font, J.; Rodriguez-oreggia, E. Is the impact of public investment neutral across the regional income distribution? Evidence from Mexico. Econ. Geogr. 2005, 81, 305–322. [Google Scholar] [CrossRef]
  37. Seko, M. Determinants of Prefectural House Price Dynamics in Japan 1980–2002; Discussion Paper, DP2003-18; Keio University: Tokyo, Japan, 2003. [Google Scholar]
  38. Liu, Z.; Wang, P.; Zha, T. Land-price dynamics and macroeconomic fluctuations. Econometrica 2013, 81, 1147–1184. [Google Scholar]
  39. Wang, R.; Hou, J.; He, X. Real estate price and heterogeneous investment behavior in china. Econ. Model. 2017, 60, 271–280. [Google Scholar] [CrossRef]
  40. Liu, F.; Matsuno, S.; Malekian, R.; Yu, J.; Li, Z. A vector auto regression model applied to real estate development investment: A statistic analysis. Sustainability 2016, 8, 1082. [Google Scholar] [CrossRef]
  41. National Bureau of Statistics of China. China City Statistical Yearbook; China Statistics Press: Beijing, China, 2009/2012/2015. (In Chinese)
  42. Shimizu, C. Estimation of Hedonic single-family house price function considering neighborhood effect variables. Sustainability 2014, 6, 2946–2960. [Google Scholar] [CrossRef]
  43. Clapp, J.M. A semiparametric method for estimating local house price indices. Real Estate Econ. 2004, 32, 127–160. [Google Scholar] [CrossRef]
  44. Clapp, J.M.; Salavei, K. Hedonic pricing with redevelopment options: A new approach to estimating depreciation effects. J. Urban Econ. 2010, 67, 362–377. [Google Scholar] [CrossRef]
  45. Brunsdont, C.; Fotheringham, A.S.; Chariton, M. Geographically weighted regression-modelling spatial non-stationarity. J. R. Stat. Soc. 1998, 47, 431–443. [Google Scholar] [CrossRef]
  46. Li, H.; Liu, Y. Neighborhood socioeconomic disadvantage and urban public green spaces availability: A localized modeling approach to inform land use policy. Land Use Policy 2016, 57, 470–478. [Google Scholar] [CrossRef]
  47. Pribadi, D.O.; Pauleit, S. Peri-urban agriculture in Jabodetabek Metropolitan Area and its relationship with the urban socioeconomic system. Land Use Policy 2016, 55, 265–274. [Google Scholar] [CrossRef]
  48. Margaritis, E.; Kang, J. Relationship between green space-related morphology and noise pollution. Ecol. Indic. 2017, 72, 921–933. [Google Scholar] [CrossRef]
  49. Cockx, K.; Canters, F. Incorporating spatial non-stationarity to improve dasymetric mapping of population. Appl. Geogr. 2015, 63, 220–230. [Google Scholar] [CrossRef]
  50. Lee, K.H.; Schuett, M.A. Exploring spatial variations in the relationships between residents’ recreation demand and associated factors: A case study in Texas. Appl. Geogr. 2014, 53, 213–222. [Google Scholar] [CrossRef]
  51. Hu, S.G.; Yang, S.F.; Li, W.D.; Zhang, C.R.; Xu, F. Spatially non-stationary relationships between urban residential land price and impact factors in Wuhan city, China. Appl. Geogr. 2016, 68, 48–56. [Google Scholar] [CrossRef]
  52. Wang, J.F.; Li, X.H.; Christakos, G.; Liao, Y.L.; Zhang, T.; Gu, X.; Zheng, X.Y. Geographical detectors-based health risk assessment and its application in the neural tube defects study of the Heshun Region, China. Int. J. Geogr. Inf. Sci. 2010, 24, 107–127. [Google Scholar] [CrossRef]
  53. Wang, J.F.; Zhang, T.L.; Fu, B.J. A measure of spatial stratified heterogeneity. Ecol. Indic. 2016, 67, 250–256. [Google Scholar] [CrossRef]
  54. Ren, Y.; Deng, L.; Zuo, S.; Luo, Y.; Shao, G.; Wei, X.; Yang, Y. Geographical modeling of spatial interaction between human activity and forest connectivity in an urban landscape of southeast China. Landsc. Ecol. 2014, 29, 1741–1758. [Google Scholar] [CrossRef]
  55. Yang, R.; Xu, Q.; Long, H. Spatial distribution characteristics and optimized reconstruction analysis of China’s rural settlements during the process of rapid urbanization. J. Rural Stud. 2016, 47, 413–424. [Google Scholar] [CrossRef]
  56. Wang, Y.; Wang, S.; Li, G.; Zhang, H.; Jin, L.; Su, Y.; Wu, K. Identifying the determinants of housing prices in China using spatial regression and the geographical detector technique. Appl. Geogr. 2017, 79, 26–36. [Google Scholar] [CrossRef]
  57. Nakaya, T.; Fotheringham, A.S.; Charlton, M.; Brundsdon, C. Semiparametric Geographically Weighted Generalised Linear Modelling in GWR 4.0. Presented at the GeoComputation 10th International Conference on GeoComputation, Sydney, Australia, 30 November–2 December 2009. [Google Scholar]
  58. Afridi, F.; Xin, S.; Ren, Y. Social identity and inequality: The impact of China’s hukou system. J. Public Econ. 2015, 123, 17–29. [Google Scholar] [CrossRef]
  59. Yan, S.; Janet, X.; Wu, Q. Government intervention in land market and its impacts on land supply and new housing supply: Evidence from major Chinese markets. Habitat Int. 2014, 44, 517–527. [Google Scholar] [CrossRef]
  60. Du, J.; Peiser, R.B. Land supply, pricing and local governments’ land hoarding in China. Reg. Sci. Urban Econ. 2014, 48, 180–189. [Google Scholar] [CrossRef]
  61. Guo, F.; Huang, Y.S. Does “hot money” drive China’s real estate and stock markets? Int. Rev. Econ. Financ. 2010, 19, 452–466. [Google Scholar] [CrossRef]
  62. Miller, T. China’s urban billion: The story behind the biggest migration in human history. In Asian Arguments; Zed Books: London, UK; New York, NY, USA, 2012. [Google Scholar]
  63. Coulson, N.E.; Tang, M. Regional science and urban economics institutional and demographic in fluencies on the presence, scale and geographic scope of individual Chinese real estate investment. Reg. Sci. Urban Econ. 2013, 43, 187–196. [Google Scholar] [CrossRef]
  64. Cohen, J.P.; Ioannides, Y.M.; Wirathip, W. Spatial effects and house price dynamics in the USA. J. Hous. Econ. 2016, 31, 1–13. [Google Scholar] [CrossRef]
  65. Zhu, Y.; Qi, X.; Shao, H.; He, K. The evolution of China’s in situ urbanization and its planning and environmental implications: Case studies from Quanzhou municipality. In Urban Population–Environment Dynamics in the Developing World: Case Studies and Lessons Learned; Sherbinin, A.D., Rahman, A., Barbieri, A.F., Eds.; Committee for International Co-Operation in National Research in Demography (CICRED): Paris, France, 2009; pp. 213–246. [Google Scholar]
  66. Paciorek, A. Supply constraints and housing market dynamics. J. Urban Econ. 2013, 77, 11–26. [Google Scholar] [CrossRef]
  67. Zhang, H. Effects of urban land supply policy on real estate in China: An econometric analysis. J. R. Estate Lit. 2008, 16, 55–72. [Google Scholar]
  68. Chen, G.; Zhao, K.; McDermid, G.J.; Hay, G.J. The influence of sampling density on geographically weighted regression: A case study using forest canopy height and optical data. Int. J. Remote Sens. 2012, 33, 2909–2924. [Google Scholar] [CrossRef]
  69. Páez, A.; Farber, S.; Wheeler, D. A simulation-based study of geographically weighted regression as a method for investigating spatially varying relationships. Environ. Plan. A 2011, 43, 2992–3010. [Google Scholar] [CrossRef]
Figure 1. The distribution of residential land price in 105 cities of China in 2008, 2011 and 2014.
Sustainability 09 02050 g001
Figure 2. The Q-Q plot of urban residential land price of 105 cities in 2008, 2011 and 2014.
Sustainability 09 02050 g002
Figure 3. The spatial distributions of local estimates for the regression coefficients of GDP in (a) 2008, (b) 2011 and (c) 2014.
Sustainability 09 02050 g003
Figure 4. The spatial distributions of local estimates for the regression coefficients of immigrant population (IP) in (a) 2008, (b) 2011 and (c) 2014.
Sustainability 09 02050 g004
Figure 5. The spatial distributions of local estimates for the regression coefficients of investment in residential buildings (IRB) in (a) 2008, (b) 2011 and (c) 2014.
Sustainability 09 02050 g005
Figure 6. The power of determinant for the investment in residential buildings (IRB), immigrant population (IP), gross domestic product (GDP) in 2008, 2011 and 2014.
Sustainability 09 02050 g006
Table 1. Statistical summary of the impact factors of urban residential land price.
GDPIPIRB
VariableGross domestic productImmigrant populationInvestment in residential buildings
DescriptionPer capita gross domestic product in a city.Migrated from other cities or regions and became local residents after getting hukou. It is one of the important indices to weigh a city’s attractiveness.The total investment in urban residential buildings in a city. It represents the investment enthusiasm for the real estate market in a city.
UnitBillion yuan10 thousand personsBillion yuan
Minimum20082.521.950.30
20114.282.130.75
201413.022.320.17
Maximum20081356.04872.7892.45
20111897.161210.10173.53
20142329.201677.79215.60
Mean2008141.6788.8912.86
2011219.52119.0623.59
2014296.93161.2634.15
Std. Dev2008205.22155.2217.35
2011309.83205.6230.58
2014412.04277.1641.71
r20080.64 **0.29 **0.58 **
20110.71 **0.32 **0.55 **
20140.82 **0.43 **0.59 **
VIF20083.801.763.74
20113.792.033.73
20143.372.133.37
Note: r is the Pearson’s correlation coefficient; VIF is the Variance Inflation Factor; ** Correlation is significant at the 0.01 level (2-tailed).
Table 2. The results of GWR analyses for 2008, 2011 and 2014 data.
YearnResiduals Moran’s IAICR2Adjusted R2
2008105−0.011939.500.650.54
20111050.011930.300.740.66
2014105−0.012031.820.790.73
Note: AIC: Akaike Information Criteria. R2: the coefficient of determination.
Table 3. Descriptive statistics of the parameter estimates in GWR analyses for 2008, 2011 and 2014.
VariableMinLwr QuartileMedianUpr QuartileMaxDIFF of Criterion
β1_GDP_2008−23.77−5.186.188.3621.71−7.14
β2_IP_2008−21.40−2.711.7611.7236.72−3.15
β3_IRB_2008−17.8911.7741.9390.81231.71−8.35
β1_GDP_2011−14.360.283.895.9513.40−1.22
β2_IP_2011−8.15−0.895.9512.4031.370.48
β3_IRB_2011−81.604.0112.0629.7666.31−4.76
β1_GDP_2014−6.524.679.7817.3220.91−4.00
β2_IP_2014−8.64−0.346.6713.3630.161.54
β3_IRB_2014−95.11−38.45−16.7418.0770.191.74
Note: GDP is gross domestic product, IP is immigrant population and IRB is investment in residential buildings.

