Article

Assessing the User Resistance to Recommender Systems in Exhibition

College of Hotel & Tourism Management, Kyung Hee University, 26 Kyunghee-daero, Dongdaemun-gu, Seoul 02447, Korea
*
Author to whom correspondence should be addressed.
Sustainability 2017, 9(11), 2041; https://doi.org/10.3390/su9112041
Submission received: 3 October 2017 / Revised: 1 November 2017 / Accepted: 5 November 2017 / Published: 7 November 2017
(This article belongs to the Section Economic and Business Aspects of Sustainability)

Abstract

:
Under the paradigm shift toward smart tourism, the exhibition industry is making efforts to introduce innovative technologies that can provide more diverse and valuable experiences to attendees. However, various new information technologies have failed in a market in practice due to the user’s resistance against it. Since innovative technology, such as booth recommender systems (BRS), is changing, creating uncertainty among consumers, consumer’s resistance to innovative technology can be considered a normal reaction. Therefore, it is important for a company to understand the psychological aspect of the consumer’s resistance and make measures to overcome the resistance. Accordingly, based on the model of Kim and Kankanhalli (2009), by applying the perceived value, the technology acceptance model, and the status quo bias theory, this study focused on the importance of self-efficacy and technical support in the context of using BRS. To do this purpose, a total of 455 survey data that was collected from “Korea franchise exhibition” attendees were used to analyze the proposed model. Structural equation modeling was applied for data analysis. The result shows that perceived value was affected by relative advantage and switching cost, also switching cost reduced the perceived value. However, self-efficacy reduced the switching cost, thereby decreasing the resistance of exhibition attendees. In addition, technical support increased the relative advantage switching cost and the perceived value. Exhibition attendee’s resistance was significantly negatively affected by perceived value, and positively affected by switching cost. The results will provide balanced viewpoints between the relative advantage and switching cost for exhibition marketers, helping to strengthen the competitiveness in terms of sustainable tourism of exhibition.

1. Introduction

The paradigm of tourism is changing to smart tourism [1]. Smart tourism refers to tourism that supports real time and rich experience of tourists and provides improved value of tourism by applying information technology in pre-, during-, and post-travel periods [2]. Recently in Korea, much attention has been paid to MICE (Meeting, Incentive travel, Convention, Exhibition) industries, increasing the interest in exhibition industry. With the development of smart tourism, event tourism, including exhibitions in particular, is drawing attention recently [3]. An exhibition is a temporary and time-sensitive market that is hosted by an individual or a company that has gathered to interact with buyers and sellers for the purpose of selling the displayed goods or services at a certain point in time or in the future [4]. In particular, in the case of large-scale exhibitions, the application of innovative technologies in order to more efficiently visit booths and provide the necessary information to various exhibition attendees is becoming more important than ever. As a result, the exhibition industry is making efforts to provide more diverse and valuable experiences to exhibition attendees through the adoption of innovative technology-applied systems. A representative example of such systems is the booth recommender systems (BRS). This is a system that recommends booths according to attendees’ preference and provides relevant information, which can support an effective and efficient experience for exhibition attendees. Accordingly, various studies have been performed to maximize the effect of exhibition performance by combining new technology with the domestic exhibition industry. Among them, a study is currently under way to analyze the attendance pattern of attendees who visited exhibition to understand attendees and to identify the association between participating companies, as well as to increase exhibition performance [5,6]. These studies have been based on a technical aspect of the innovative technology. However, the review of the existing studies indicated that the adoption of new information technology or highly innovative product did not guarantee the successful acceptance and diffusion in practice [7]. In many cases, more technologically innovative products became obsolete before it was diffused, due to the consumer’s resistance. The same can be said of BRS, and the exhibition attendees may or may not accept the BRS. This phenomenon can be seen the valuation result about the new technology perceived by each attendee. Since new information technology usually brings a behavioral change of consumers, they will evaluate the uncertainty of entailing tradeoffs between the relative advantages and disadvantages regarding alternatives. Thus, “status quo bias”, that remains strongly as it is, then, the consumer’s resistance to technology can be considered a normal reaction [7,8]. Therefore, in this situation, if the new technology is not judged to provide enough benefits, consumers’ resistance will appear. Gourville [9] explained the different reference points between consumers and developers who perceive gaining versus losing, which means that losses loom larger than gains. In addition, the most important thing Gourville [9] found is that consumers must change the way of using products or process works when it comes to alternative products or IT systems or devices. Therefore, to understand the behavior of attendees, it is necessary to keep in mind that an attendee, as a consumer, will resist the adoption and diffusion of the technology. If no measure is provided to assess the ways in which consumers psychological resistance to a new information technology introduced to exhibition is understood enough and overcome the resistance, exhibition industry might result in a great amount of loss and weakness of market effect. Nonetheless, a technology acceptance model (TAM), which is one of the typical adoption models [10,11,12], explains the adoption and diffusion of information technology only, but fails to explain the consumer’s resistance aspect. Therefore, this study combined the resistance perspective and a value-based model. Specifically, in the use of BRS, the user will decide whether to use BRS through its perceived relative advantages and switching costs when considering the perceived benefits and losses aspects. In particular, when considering the perceived risks that are associated with the BRS, switching costs can affect the decision of exhibition attendees to use BRS. If the exhibition attendees do not utilize the BRS at the exhibition place, the attendees will spend more time and efforts due to visiting booths, which are not relevant to or meet their intended purposes. Therefore, it may be regarded as switching costs arising from the selection of unrelated booths [13]. In addition, the possibility of imposing extra mobile Internet fees in terms of switching costs may be one of the risks of using BRS in the exhibition. Thus, for these reasons, the exhibition attendees’ resistance can be generated. Therefore, it is necessary to consider both the relative advantages and the switching costs to the value recognition of BRS.
More specifically, the conditions of the user may influence the user’s attitude formation of accepting the technology. Therefore, in this study, two parts are considered as the conditions that can affect the user’s new technology resistance: attitude and facilitating condition. In addition, facilitating conditions that can influence the attitude toward BRS acceptance in the exhibition environment are divided into self-efficacy and technical support [14]. Because self-efficacy and technical support has been believed as the main facilitators to accept a new technology [12,15]. Furthermore, previous studies on user resistance have been presupposed ongoing use of the newly accepted technologies. In other words, research has been focused on the adoption of new technologies in situations where the current status of the user must be maintained in an unwanted state, such as adopting a new business system in a company or adopting a new learning system in an educational institution. However, in the case of exhibition, the situation of acceptance of new system is limited to the period during which the exhibition is held, and the user is not forced to use the system after the exhibition period is over. Nonetheless, there is a lack of research as to what factors will be affected to the resistance of exhibition attendees to the use of BRS. Therefore, this paper seeks answers to following research questions:
(1)
How do the exhibition attendees’ relative advantage and switching cost relate to their resistance to accept the BRS through perceived value? and,
(2)
How do the self-efficacy and technical support interact each other in affecting exhibition attendees’ relative advantage, switching cost, and perceived value?
This main contribution of the present study for exhibition attendees’ resistance to BRS is that it developed a framework for conceptualizing innovation resistance and explained exhibition attendees’ resistance. In addition, this study extends knowledge of existing theories by looking at how users’ resistance to a new system will appear in situations where the continuous use of the system is not required. Furthermore, this study can provide various practical implications and guidelines to exhibition organizers.

2. Theoretical Background

2.1. Technology Acceptance

When a new information system is introduced, a user may adopt or resist the possible changes that the new system can bring [7]. Therefore, a theoretical review of technology acceptance shall be done beforehand to understand the resistance to a new information system. Regarding the technology acceptance research, a TAM has provided a wide range of numerous theoretical foundations since 1989, and a unified theory of acceptance and use of technology (UTAUT) has been reported recently. Davis [11] found that perceived ease of use primarily affects to intentions to use through perceived usefulness. According to TAM, the user’s perception of an information system consists of four major components: beliefs, attitude, intention, and usage. Belief is the subjective probability that the user has on the results of using the information system. Attitude means a set of positive or negative feelings about the information system that the user uses. Intention refers to willingness of the user to use the information system. Usage means that the user utilizes the information system. The relationships between these constructs were studied by Adams, Nelson, and Todd [10]. In addition, a modified TAM that includes subjective norms and perceived behavioral controls was found to be appropriate for predicting the use of both experienced and inexperienced users [16]. Igbaria et al. [17] applied an extended TAM to analyze the internal and external data on the use of personal computers in small businesses and found the support for TAM. Moreover, Agarwal and Karahanna [18] suggested a minor revised TAM, although there are slight differences between this model and the original TAM, and then they found empirical supports for their suggestions. Recently, an integrated model between trust and TAM was introduced by Gefen, Karahanna, and Straub [19], and the unified theory of acceptance and use of technology (UTAUT) was proposed by Venkatesh, Morris, Davis, and Davis [20]. The UTAUT was developed by integrating common concepts based on a review of the eight models and theories that previous studies used to describe the use of information systems, including, theory of reasoned action (TRA), TAM, motivational model, theory of planned behavior (TPB), a combined TPB/TAM, model of PC utilization, innovation diffusion theory, and social cognitive theory). These studies have greatly shed a light on influential factors that a user might accept an information system, although there has been no explanation about why a user may resist.

2.2. Resistance and Status Quo Bias Theory

Innovation resistance originated in a study that focused on an individual consumer’s purchases of an innovative product. Sheth [21] has claimed that attention should be paid to not only adoption-resistance, but also to innovation resistance. Ram [8] has proposed an innovation resistance model following the proposal by Sheth [21]. Ram [8] mentioned the following discussion regarding innovation resistance:
“Resistance to change may be defined as any conduct that serves to maintain status quo in the face of pressure to alter the status quo [22] and is associated with the degree to which individuals feel themselves threatened by change. Innovation Resistance is the resistance offered by consumers to changes imposed by innovations. To the extent that consumers can suffer changes in the way they acquire information about, purchase, use or dispose of new products, innovation resistance is but a special version of resistance to change”.
[8] (p. 208)
From this point of view, innovation resistance is a consumer’s resistance to change. It can be considered as an attitude variable, which explains people’s preference for maintaining their status or situation. The innovation resistance has been studied in various areas, such as resistance in organization [23,24,25] and resistance to the acceptance of online shopping [26,27]. Recently, this study has been applied to the resistance to the introduction of new information system [7,28]. Innovation resistance in the information system sector was studied first by Hirschheim and Newman [29] and Markus [30]. This resistance was conceptualized as an opposition to change due to new information system (IS) implementation or an adverse reaction to information systems [7]. The reason for the resistance towards a new IS was due to the inconvenience of learning a new operation or anxiety from job or position loss [31]. As mentioned in the study of Ram [8] earlier, a status quo bias theory helps us to understand why people have a tendency to maintain status or situation [7]. Samuelson and Zeckhauser [32] divided the status quo bias into three categories: rational decision-making, cognitive misperceptions, and psychological commitment. Rational decision-making involves the evaluation of relative benefit and cost, and if cost is larger than benefit, it creates status quo bias. Due to cognitive misperceptions of loss aversion, people have status quo bias. According to Kahneman and Tversky [33], people tend to be more sensitive to loss than to gain, so that a little loss can be felt by people larger than as it is, which causes people to choose status quo bias. Finally, psychological commitment includes sunk cost, social norm, and efforts to feel in control. People tend to not use other systems because of efforts that are given to existing systems, opinions of other colleagues, and the loss of control over a new system [7]. When considering other studies previously done, it needs to be considered whether resistance of exhibition attendees with regard to the BRS actually occurred. Sheth [21] presented four types of innovation resistance, according to user’s habit and a risk level of newly introduced product (technology). At the introduction time, existing habit was not strongly influential despite the resistance of risk, which was named ‘risk resistance innovation’. Disconnected innovation, in which existing habits were not formed because of a completely new concept, can be perceived as risky, since no experience was made to use the product or technology. Accordingly, a consumer caused innovation resistance. Sheth [21] observed this kind of resistance mainly from technological inventions. In this sense, exhibition attendees have many reasons to resist the BRS because attending exhibition involves risk or cost, such as additional mental efforts, even if it is difficult to form a habit of attending exhibition due to infrequent visiting. Typically, exhibition or event organizers have a high interest in engaging attendees even more at your next conference, tradeshow, or event tradeoffs for providing real time information and contents interacting during the exhibition, on the contrary, attendees have to change the way of browsing or looking at goods. Attendees must change how they search information, select exhibition sites, and check the valuable things out there. In addition, looking into small size screen and battery reduction of smartphone devices would not be merit at all. So those reasons cause the resistance of adopting BRS.
In addition, it can be considered in terms of switching costs. Switching costs can be defined as “the onetime costs that customers associate with the process of switching from one provider to another” [13] (p. 110). Switching costs are usually related to the switching process; however, the outcomes of the switching might not appear immediately. Furthermore, the costs associated with the switching process are not limited to economic costs alone. According to Burnham et al. [13], switching costs can be divided into three types: procedural switching costs, financial switching costs, and relational switching costs. Procedural switching costs generally include losses of time and efforts. Financial switching costs are related to the loss of financial resources. Relational switching costs are associated with psychological or emotional discomfort. Therefore, if the exhibition attendees do not utilize the BRS at the exhibition place, the participants will spend more time and efforts due to the visiting booths which are not relevant to or meet their intended purposes. Therefore, it may be regarded as procedural or opportunity costs arising from the selection of unrelated booths. Especially for large-scale exhibitions, costs of such switching or opportunity, which is caused by not using BRS in the presence of hundreds of booths, may have impacts can be considered as risks in achieving the attendee’s purposes. In addition, the possibility of imposing extra mobile Internet fees in terms of financial switching costs may be one of the risks of using BRS in the exhibition. Thus, for these reasons, the exhibition attendees’ resistance can be considered as “Risk Resistance Innovation”.

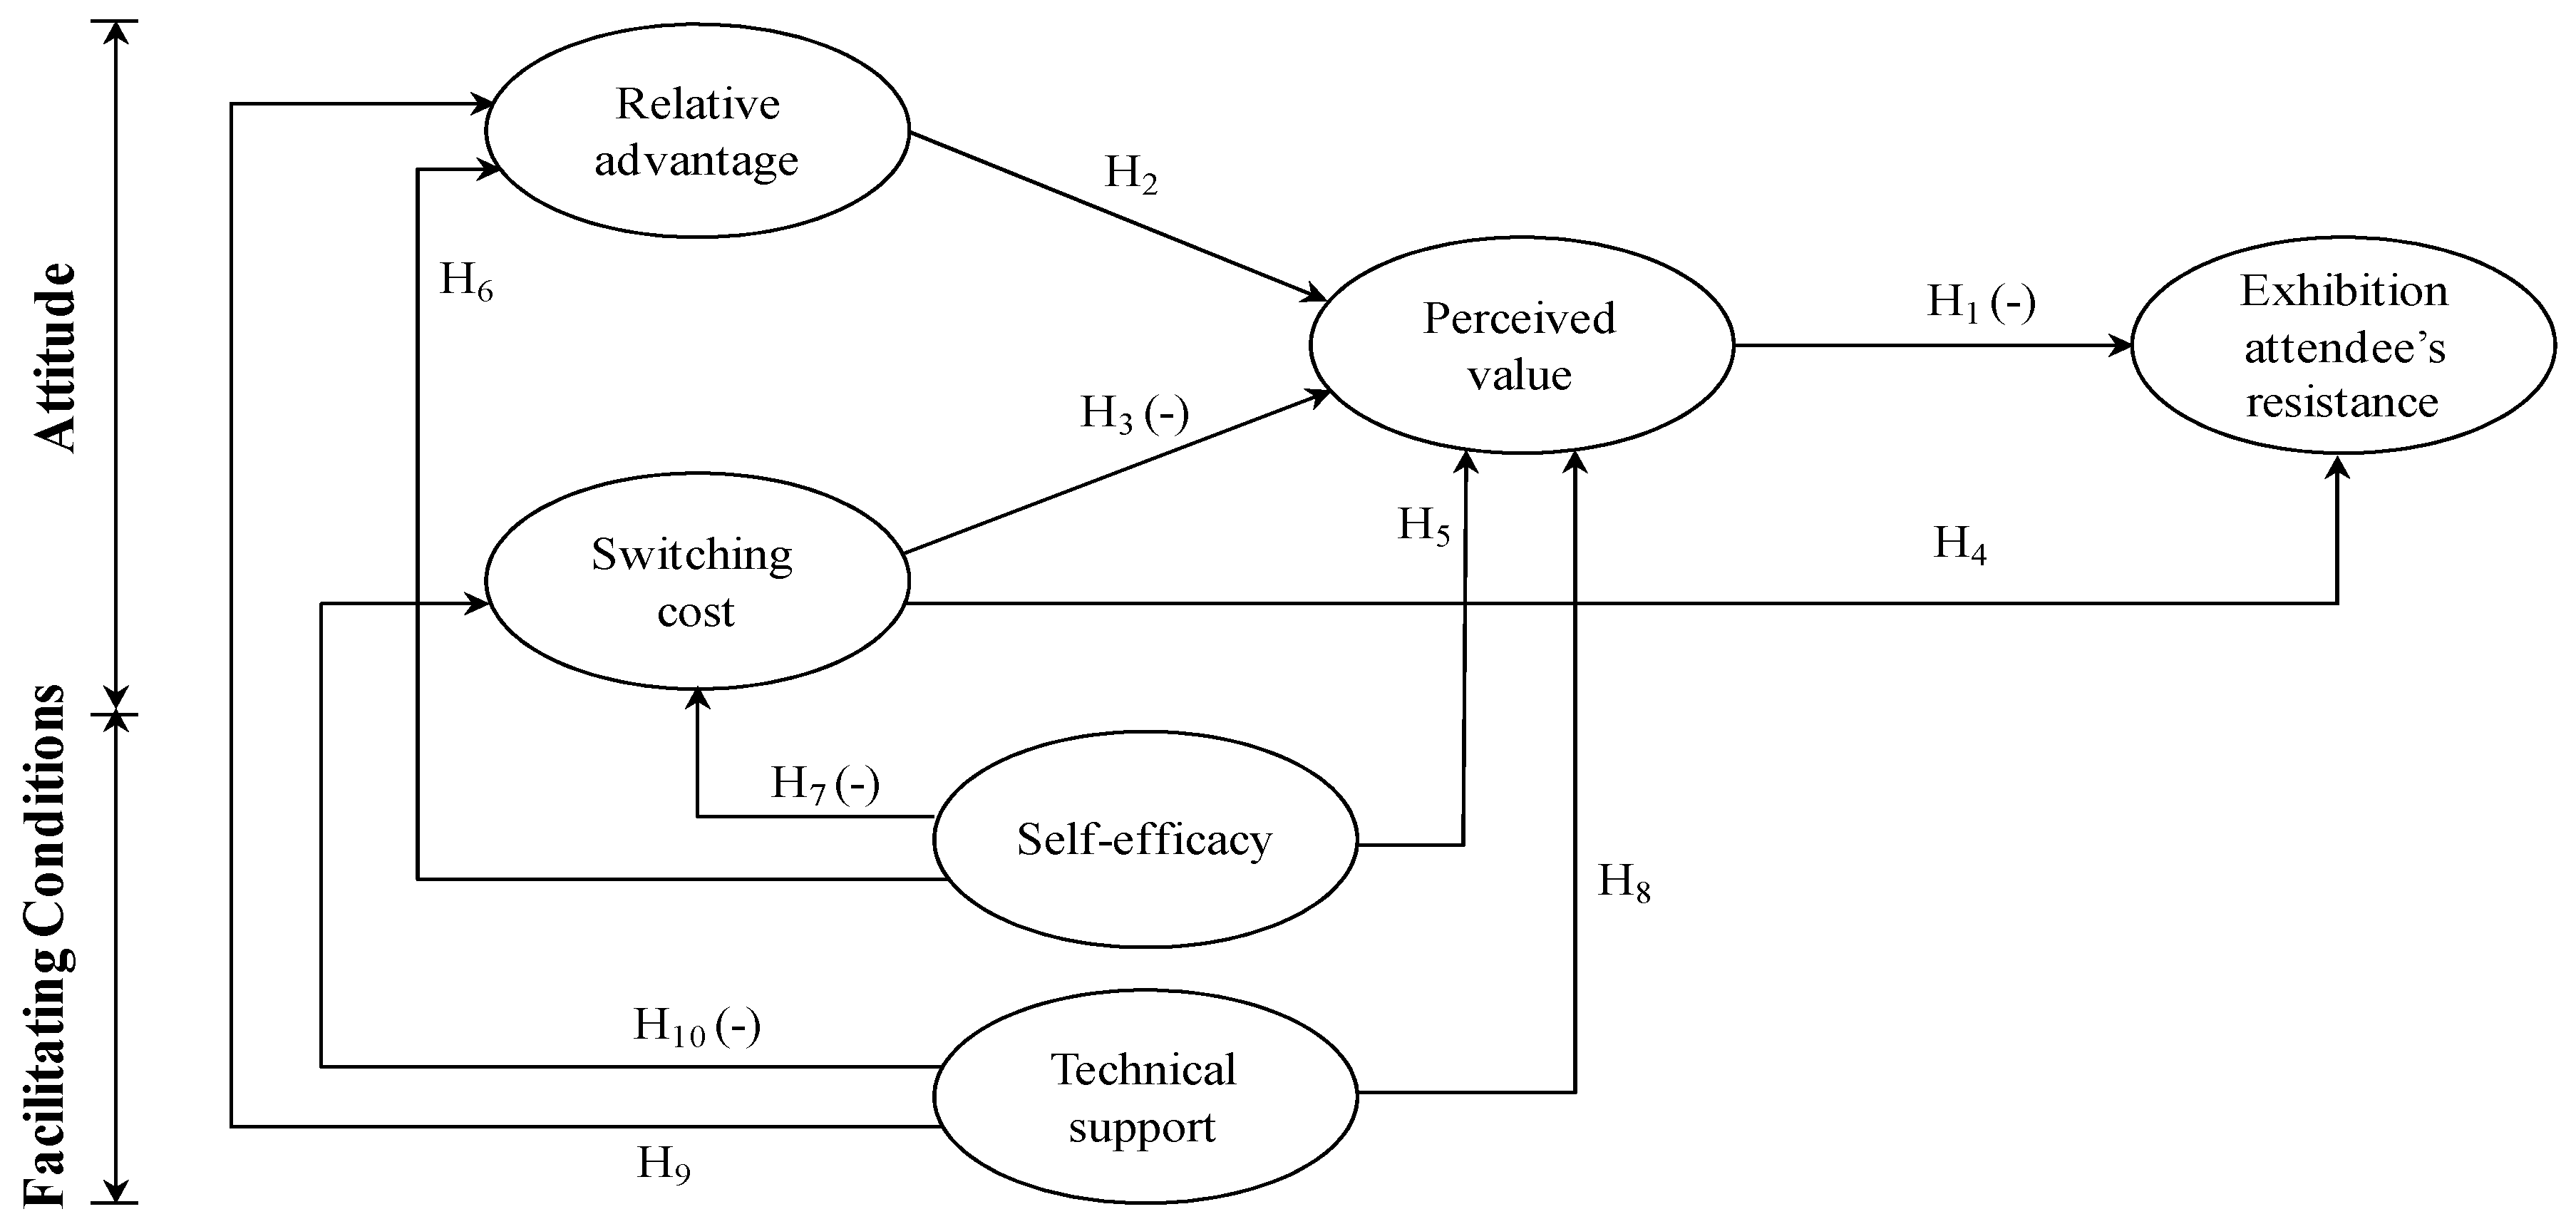
3. Research Model and Hypotheses Developments

Based on the theoretical background in the previous section, we developed the research model and hypotheses to relate the constructs in our model (see Figure 1). The acceptance of a new system is usually determined through the evaluation of the value of the system. At this time, the current conditions of the user may influence the user’s attitude formation for the system. Therefore, in this study, two parts are considered as the conditions that can affect the user’s new system resistance: attitude and facilitating condition. In addition, facilitating conditions that can influence the attitude toward BRS acceptance in the exhibition environment are divided into self-efficacy and technical support [14].

3.1. Perceived Value

The perceived value is considering two factors: the costs and benefits. Zeithaml [34] and Dodds et al. [35] attempted to understand perceived quality as the benefits and perceived monetary price as the costs. In the e-commerce context, Chen and Dubinsky [36] divided perceived value into perceived product quality, perceived risks, and perceived prices. Moreover, Kim, Chan, and Gupta [37] and Kim, Xu, and Gupta [38] described the role of perceived value when the users adopt a technology. They found that mobile Internet users are adopting the technology when considering together the two factors, perceived cost and usage. Although IS users perceive value from new IS, Kim and Kankanhalli [7] observed that a new IS could meet user resistance at the time of implementation. In case of BRS, exhibition attendees must install a BRS service app before they use it. Therefore, it requires exhibition attendees’ time and mental efforts. If the BRS service does not meet the exhibition attendees’ criteria, they will not use the BRS. However, if the BRS service is suitable for the cost and time that they have invested, they will be willing to accept the BRS. In other words, if the perceived value of the change is high, then users are less likely to resist change. Hence, this work proposes the following hypothesis:
Hypothesis 1 (H1).
Perceived value has a negative effect on exhibition attendees’ resistance.

3.2. Relative Advantage and Switching Cost

Moore and Benbasat [39] defined relative advantage as the degree to which a person believes that a particular information technology would enhance his or her job performance. This construct is similar to the perceived usefulness in the TAM, but includes the ease of use aspect of information technology. However, switching cost is defined as the perceived disutility that a user would incur by switching from the status quo to the new IS [7]. If introducing a new information system can improve work performance of a user, a user will recognize the value that the change can bring. In case of BRS, if users recognize the benefits of the BRS, they should consider the value of the BRS. Hence, this work proposes the following hypothesis:
Hypothesis 2 (H2).
Exhibition attendees’ perceived relative advantage of BRS has a positive effect on exhibition attendee’s perceived value.
On the other hand, if an exhibition attendee requires additional time or mental effort due to a new information system (that is, recognizing high switching cost), then a user will recognize the value as low that the change can bring. In other words, if the BRS raises the extra cost due to the complexity, exhibition attendees would be determined that there is no value. As a result, if a user values a switching cost highly due to introduction of a new information system, a user will not meditate the perceived value; instead, he/she will resist the change directly. Hence, this work proposes the following hypothesis:
Hypothesis 3 (H3).
Exhibition attendees’ switching cost has a negative effect on exhibition attendees’ perceived value.
Hypothesis 4 (H4).
Exhibition attendees’ switching cost has a positive effect on exhibition attendees’ resistance.

3.3. Self-Efficacy

Self-efficacy is an assessment of the ability of an individual to perform a certain behavior successfully [40,41]. In other words, it can be explained as an individual’s self-confidence to perform a behavior successfully [42]. Therefore, in order to examine the self-efficacy more deeply, a model of customer self-efficacy combining the customers’ acceptance of the new technology and their intention to use the technology has been developed. In addition, social cognitive theory, as claimed by Bandura [43], showed that an individual’s behavior, his or her environment, and cognitive factors are highly interrelated. The self-efficacy judgment of an individual’s task also determines how much effort that the individual will make on the task and how long they will last and persist with it. An individual who has strong self-efficacy makes greater efforts to overcome a challenge. However, an individual who has weak self-efficacy are likely to reduce their efforts to overcome a challenge, or even quit the challenge. Therefore, if a user has high self-efficacy, he/she will accept a new information system gladly without feeling anxiety. Instead, a user will be more interested in relative benefit and a high value of the information system. That is, he/she will not be too concerned about the switching cost of a new system. It can also be applied to the use of BRS. Hence, the following hypothesis is proposed:
Hypothesis 5 (H5).
Exhibition attendee’s self-efficacy has a positive effect on exhibition attendee’s perceived value.
Hypothesis 6 (H6).
Exhibition attendee’s self-efficacy has a positive effect on exhibition attendee’s perceived relative advantage of BRS.
Hypothesis 7 (H7).
Exhibition attendee’s self-efficacy has a negative effect on exhibition attendee’s switching cost.

3.4. Technical Support

Technical support means the easy access to technological resources or infrastructure in a certain situation to do a task [44]. Davis, Bagozzi, and Warshaw [45] proposed that technical support is an important factor that is likely to affect an individual’s perceived usefulness or perceived ease of use in the context of using a product or service. Goh [46] argued that as technological infrastructures become more convenient and easier, applications, such as banking services, will become more feasible. Additionally, Paré and Elam [47] found a positive relationship between technical support and usage. Paré and Elam [47] described the positive relationship between technical support and ease of use in the context of personal computer usage in more detail. Without adequate technical support, the user may endeavor to resolve the technical difficulties on their own. This will likely slow down the user’s task performance and reduce their productivity. Without proper technical support, technology use may have a deleterious effect on the intention to use BRS [48]. Therefore, if technical support is established well, a user will recognize the value of change due to a new information system because individual work performance would increase. Moreover, a user will value the relative advantage of a new information system more highly than that of an existing information system. Hence, the hypothesis is proposed as follows:
Hypothesis 8 (H8).
Technical support to the BRS has a positive effect on exhibition attendee’s perceived value.
Hypothesis 9 (H9).
Technical support to the BRS has a positive effect on exhibition attendee’s perceived relative advantage of BRS.
Users do not like change because they fear the new systems. Exhibition attendees who also use new system, such as BRS, may be subject to fear (for example, fear of the privacy concern, fear of the extra mobile Internet fee, etc.). Therefore, the appropriate technical support to the BRS reduces the fear of the changes. In other words, a user will feel that the switching cost that is generated by a new system as additional loss is small. Hence, the hypothesis is proposed as follows:
Hypothesis 10 (H10).
Technical support to the BRS has a negative effect on exhibition attendee’s switching cost.

4. Research Methodology

To evaluate the proposed study model and hypothesis empirically, a survey study has been conducted with attendees who have experienced the BRS in exhibitions in the past. The officials of franchise exhibition have been deeply concerned about the resistance of a user since the BRS, which was already developed as a part of Intelligent Exhibition Marketer development project in Korea, was applied for the first time.

4.1. Target Exhibition and System

The target exhibition of this study was the “Korea franchise exhibition”, which was held in Korea. This exhibition is the oldest exhibition in Korea, and it is known for the largest numbers of attendees. This event provides an opportunity for local and overseas franchise suppliers to advertise, as well as attract, franchisees. It also provides information about famous brand entrepreneurship to new business seekers or starters. It also aims to secure distribution line of the equipment suppliers that are associated with franchise business. About 200 brands from 140 companies in various sectors, such as the dining industry, wholesaler/retailer, service, e-biz, and manufacturing industries, participated in the Korea franchise exhibition, and 345 booths were prepared. The exhibition attendees visited whatever booth they wanted but had problem visiting all booths within a limited time, as well as lacked information about the attendees.
The Ministry of Knowledge Economy in Korea planned a personalization marketer for an intelligent exhibit-marketing project for the advancement of the MICE industry. The BRS, one of the deliverables of the project, was applied to the Korean franchise exhibition as a pilot application. The BRS, which is one of the mid-term deliverables of the project that started in 2010 and lasted for four years, is a system that recommends preferable booths in real time to exhibition attendees by collecting preferred franchise information and demographic information of a user. As an algorithm that is used for recommendation, algorithms based on collaborative filtering were used and QR (quick response) code and RFID (radio frequency identification) technology were applied to find the individual positioning. The exhibition attendees installed the App for BRS in their smartphones at the guide center that was installed at the exhibition entrance, and then their personal information was entered briefly. Subsequently, when the attendee took the photo of QR code installed at the front of the visited booth using the camera in the smartphone, then BRS started recommending the preferable booths for the user. Since the BRS has never been used before in exhibitions as an innovative technology, it was considered to be resistant to use. Nonetheless, the system development was considered to strengthen the exhibition competiveness of Korea and sustainable tourism.

4.2. Instrument Development

The measurements for the six constructs (i.e., self-efficacy, technical support, relative advantage, switching cost, perceived value, and exhibition attendee’s resistance) used in this study were derived from previous literature (see Table 2). Three items to measure self-efficacy were adopted from the existing literature [42]. To measure technical support, four items were developed that were based on previous research [44,48]. For measurement of relative advantage, three items were derived [39,49]. Four switching cost items were drawn from previous research [39,50]. Additionally, to measure the perceived value, three items were extracted based on previous studies [36,37]. Finally, three items were developed to measure exhibition attendee’s resistance [7]. In this study, multiple measurements for each construct were used to overcome the limitations that were related to high measurement error of a single item [51]. A single item usually has a problem because it is too specific to capture all of the attributes of a construct. The developed items in this study were measured on a 7-point Likert scale. The scale was ranged from strongly disagree (1) to strongly agree (7).

4.3. Data Collection

For this study, a system to test the BRS of the “Korea franchise exhibition” was developed. Then, this BRS test was promoted to exhibition attendees through “Interesting Booth QR Click Event”. Participants who visited any booths with a specific QR code among 300 booths at this event received gifts. At this time, participants who scanned the QR code by using their smartphones were considered as visitors. There were two purposes of this event. The first one was to identify the actual locations of exhibition attendees who scanned QR codes. The second one is to understand attendees’ preference for booth recommender. Among a large number of attendees in this exhibition, 520 attendees utilized the BRS. At the end of the exhibition, participants were asked to fill out a questionnaire on a face-to-face basis at a separate booth for the survey. In other words, after using the BRS, the participants responded directly to the questionnaire at the booth that was installed for the survey. Overall, 455 valid responses (87.5% of response rate) were collected from the survey and were used for the analysis. The characteristics of the respondents are summarized in Table 1. Overall, 291 (64.0%) participants were male and 164 (36.0%) were female. Furthermore, 47.0% (214) of participants were in the 20–29 age group, followed by those under 30–39 years (108, 23.7%) and those 40–49 years (83, 18.2%). Most respondents were students (172, 37.8%) and office workers (87, 19.1%). The typical respondent’s (245, 53.8%) yearly income was less than 30 million won (1092 Korean won equals US$1), followed by 30 million to 40 million Korean won (80, 17.6%).

5. Data Analysis and Results

The structural equation modeling (SEM) approach was applied to test the proposed hypotheses shown in Figure 1. The SEM often used to assess how well the structure of the proposed model or construction of hypothesis is explained by the collected data [51]. A two-step approach is used in SEM. First, a measurement model is specified by performing the confirmatory factor analysis (CFA). Then, a latent structural model is tested. For this, skewness and kurtosis tests, which can evaluate the normality of the data used in analysis were performed. The absolute values of skewness ranged from −0.798 to 0.221. For the values for kurtosis ranged from −0.726 to 0.854. Both results showed that they are in an acceptable range as the conventional criteria of normality [52].

5.1. Confirmatory Factor Analysis

Convergent validity and the discriminant validity for each construct were assessed via CFA using AMOS 18. In the results of CFA, items sharing a high level of residual variance with other items were founded. Therefore, these items were dropped in the revised measurement model. A total of five items sharing a high level of residual variance were dropped. The value of χ2 fit statistic showed 104.143 with 75 degrees of freedom (χ2/d.f = 1.389) (p = 0.015). The results showed that as follows: goodness-of-fit index (GFI) was 0.971, the adjusted goodness-of-fit index (AGFI) was 0.954, the normed fit index (NFI) was 0.981, the comparative fit index (CFI) was 0.994, and the root mean square error of approximation (RMSEA) was 0.029. Given the number of indicators, the overall quality of measurements was supported by the statistics [53].
Three criteria were used to assess the convergent validity. First, the value of standardized path loading of each item should be greater than 0.7 and statistically significant [54]. Second, as the indicator for the reliability for each construct, the value of composite reliability (CR) and the Cronbach’s α should be greater than 0.7, respectively. Third, the statistics of average variance extracted (AVE) for each construct should to exceed 0.5 [55]. As shown in Table 2, all statistics for the standardized path loadings were shown to be greater than 0.7 and were statistically significant. Moreover, the results of CR and the Cronbach’s α for all of the constructs exceeded 0.7. The value of AVE for each construct was shown to be greater than 0.5. Therefore, the convergent validity for each construct was supported [56] (p. 815).
The discriminant validity of the measurement model was examined based on the following method. That is, the values of the square root of the AVE for each of the constructs have to be compared with the correlations between that construct and other constructs. Therefore, in order to the measurement model to have the discriminant validity, the value of the square root of the AVE should be greater than the correlations between that construct and other constructs [55]. As shown in Table 3, the results of the analysis showed that the values were met the criteria. Therefore, discriminant validity was confirmed.

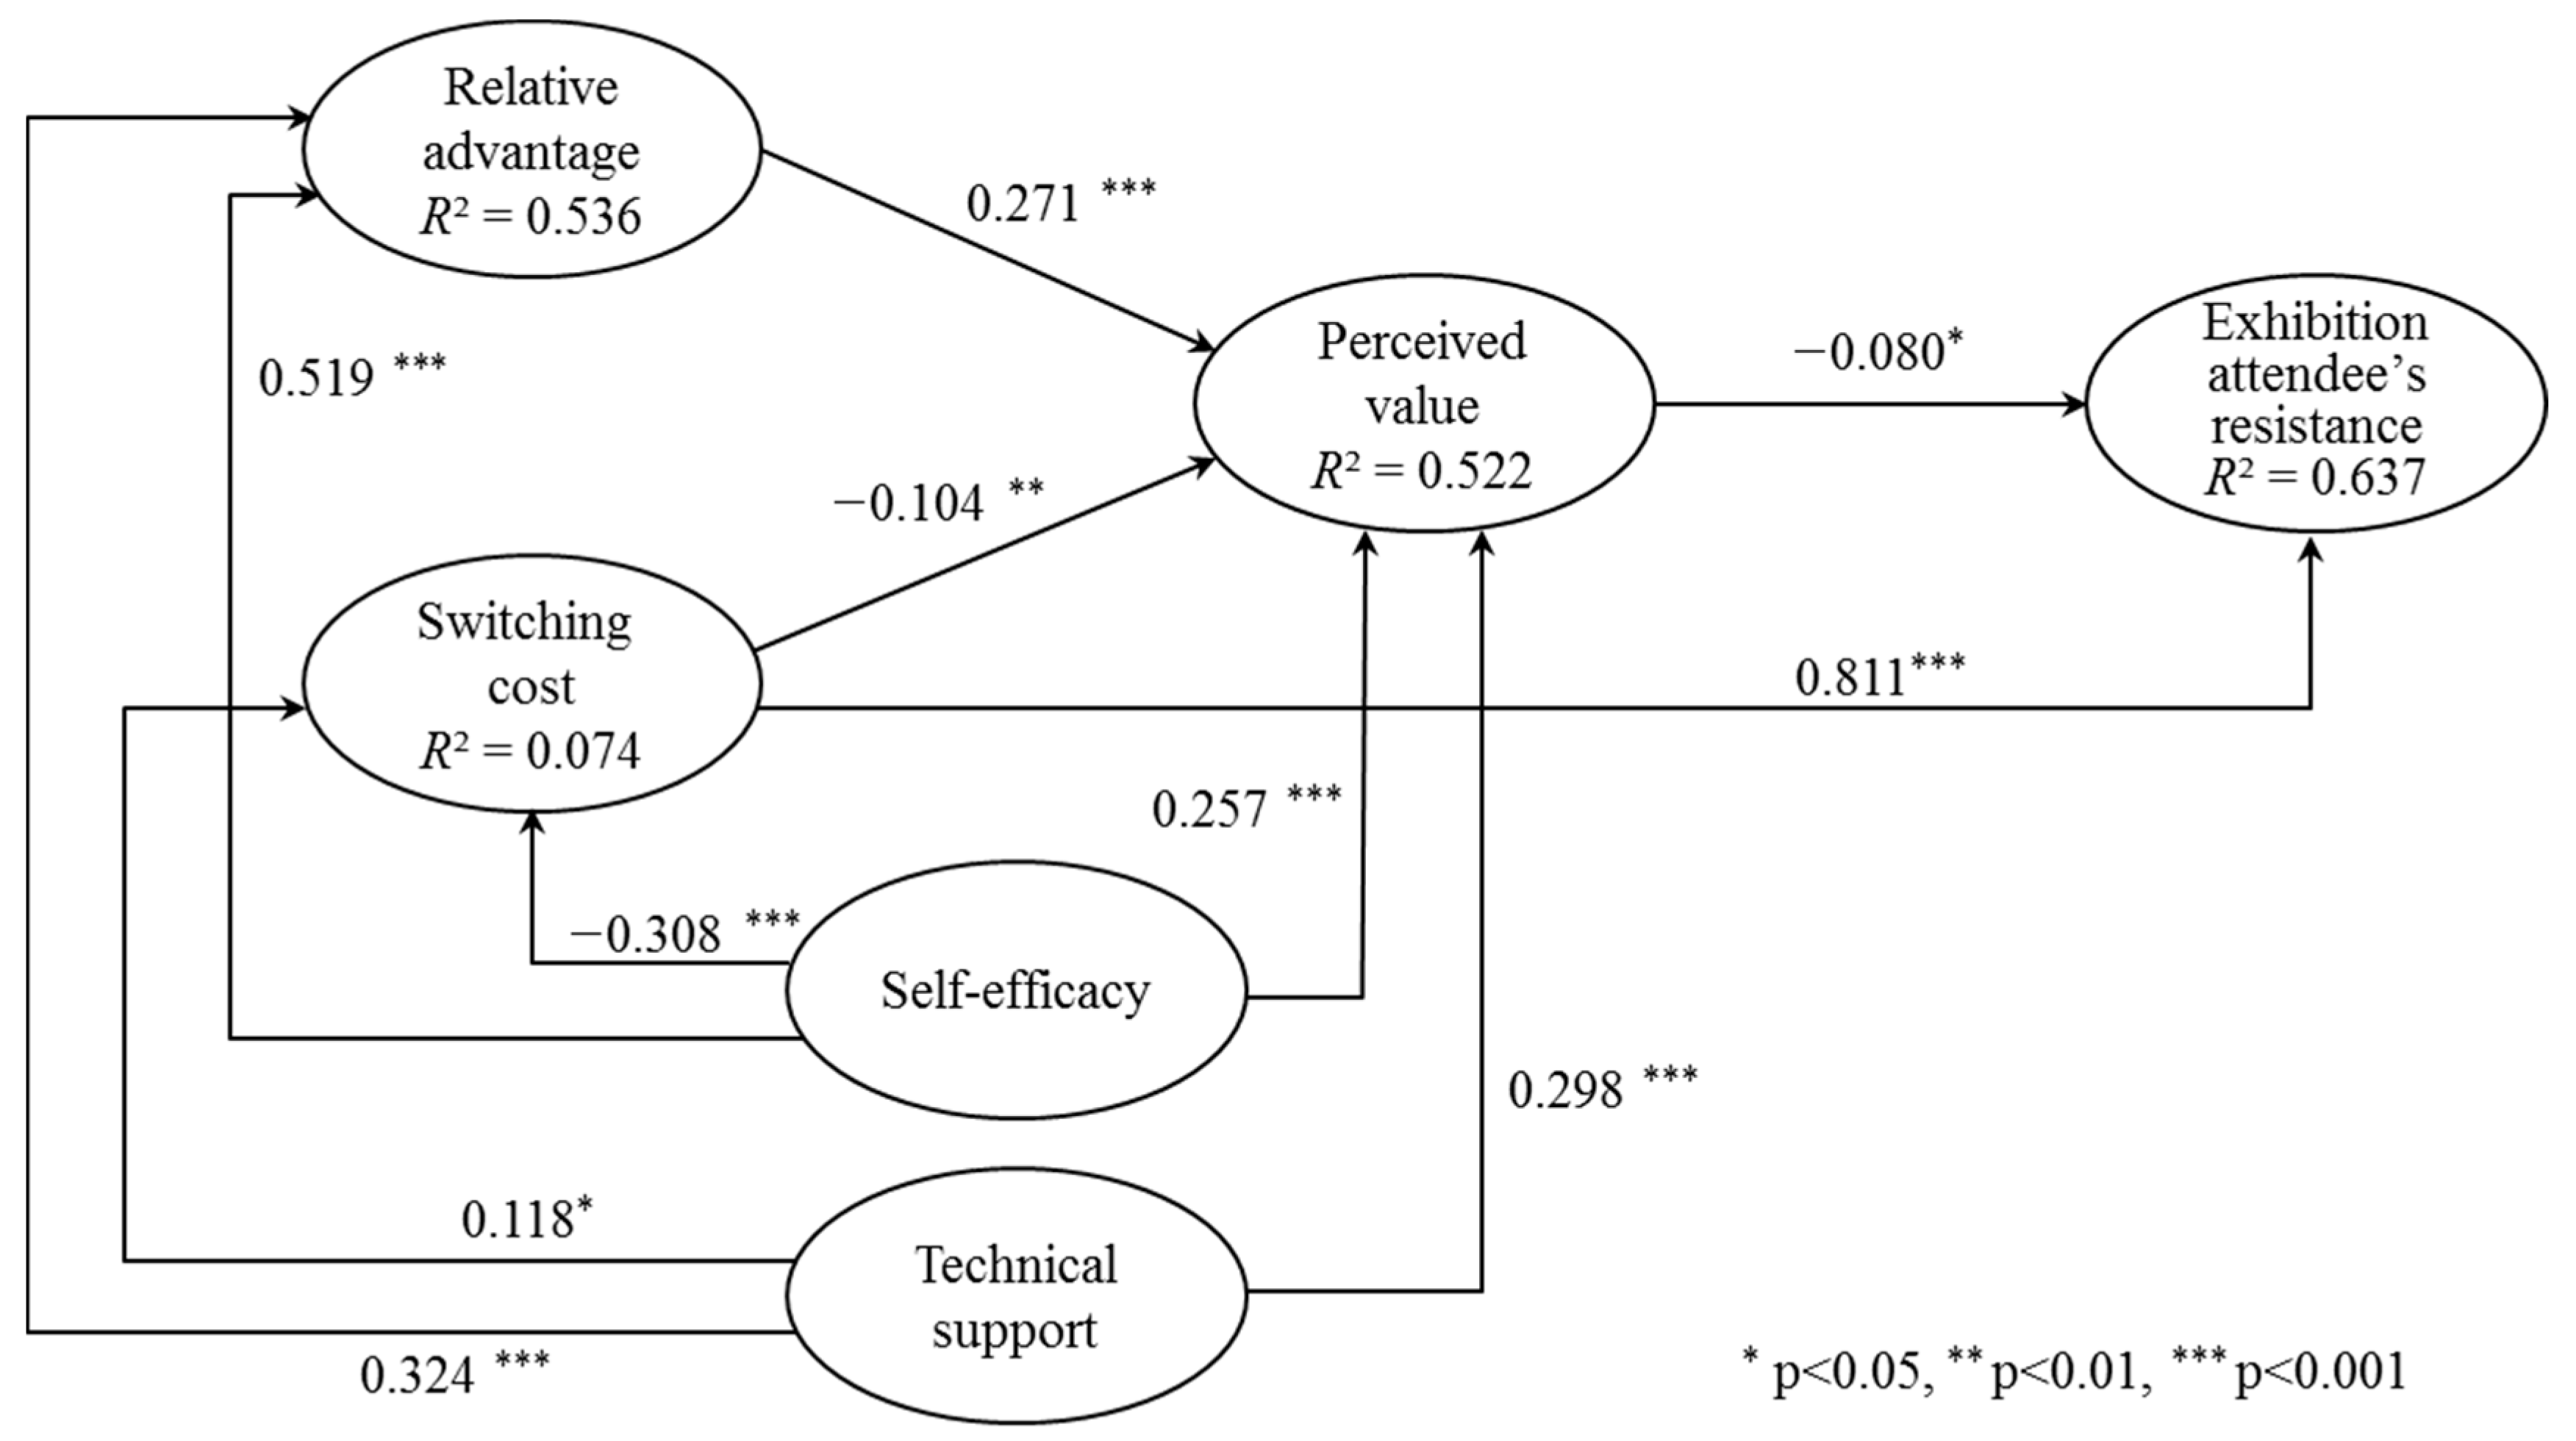
5.2. Hypothesis Testing

The maximum-likelihood estimates for overall fit parameters are presented in Table 42 = 113.654, d.f = 79; p = 0.006, GFI = 0.968, AGFI = 0.952, NFI = 0.979, CFI = 0.993, and RMSEA = 0.031). These indicators suggest that this model has a good fit overall, and represent that it is suitable for further interpretation.
The squared multiple correlations (SMCs; R2) for the structural equations for relative advantage, switching cost, perceived value, and exhibition attendee’s resistance are shown in Figure 2. The direct effects of self-efficacy and technical support explained 53.6% of the variance in relative advantage. The direct effects of self-efficacy and technical support explained 7.4% of the variance in switching cost. The direct effects of relative advantage, switching cost, self-efficacy, and technical support explained 52.2% of the variance in the perceived value. Additionally, the direct effects of perceived value and switching cost explained 63.7% of the variance in exhibition attendee’s resistance. Table 4 and Figure 2 present the standardized parameter estimates.
Hypotheses H1–H4 proposed the structural relationships among relative advantage, switching cost, perceived value, and exhibition of attendee’s resistance. Perceived value had a negative effect on exhibition attendee’s resistance (β = −0.080, t-value = 2.243), supporting H1. Relative advantage had a positive effect on perceived value (β = 0.271, t-value = 4.458), and it was statistically significant at the p < 0.001 level, supporting H2. H3 was supported by the significant negative effect of switching cost on perceived value (β = −0.104, t-value = −2.675, p < 0.01). Additionally, H4 was supported by the significantly positive effect of switching cost on exhibition attendee’s resistance (β = 0.811, t-value = 17.834, p < 0.001). H5–H7 proposed the structural relationships among self-efficacy, relative advantage, switching cost, and perceived value. Self-efficacy positively influenced perceived value (β = 0.257, t-value = 4.379, p < 0.001), supporting H5. Self-efficacy had a positive effect on relative advantage (β = 0.519, t-value = 10.580) at the p < 0.001 level; thus, this result supports H6. In addition, the significant negative effect of self-efficacy on switching cost supported H7 (β = −0.308, t-value = −5.146, p < 0.001). The hypotheses H8–H10 proposed the structural relationships among technical support, relative advantage, switching cost, and perceived value. H8 was supported by the significant positive effect of technical support on perceived value (β = 0.298, t-value = 5.933, p < 0.001). Moreover, technical support had a positive effect on relative advantage (β = 0.324, t-value = 6.992) at the p < 0.001 level, supporting H9. Finally, technical support had a positive effect on switching cost (β = 0.118, t-value = 2.017). Even though the coefficient was statistically significant at the p < 0.05, the positive effect did not support H10.

6. Discussions, Implications, and Conclusions

As the results of this study indicated, switching cost had direct as well as indirect effects on resistance of exhibition attendees. Additionally, self-efficacy reduced the switching cost, thereby decreasing the resistance of exhibition attendees [12]. In addition, the findings indicated that relative advantage and technical support increased perceived value. That is, innovations vary in their “degree of innovativeness” (Gourville [9]) by creating value for consumers by changing the way of browsing on the exhibition site. However, technical support did not reduce switching cost, in contrast with the hypothesis we made. This means that the technical support level proposed in this study was felt by a user that system connection support regardless of time and place was not high-level technical support. On the other hand, this result can be interpreted as an attempt to access the Internet to use BRS is considered as a procedural switching cost, such as time consuming and efforts. In addition, if Internet accessibility for BRS usage is not continuously supported, it would be interpreted as an increase in financial switching costs by increasing concerns about additional mobile Internet usage fees for BRS use.
The theoretical contribution of this study was that it extends knowledge of existing theories of the perceived value, status quo bias, and TAM by looking at how users’ resistance to a new system will appear in situations where continuous use of the system is not required. First, in the perspective of perceived value, this study contributes to extend knowledge by reviewing the resistance and status quo bias theory from the viewpoints of benefit and sacrifice based on value. Simultaneously, the results show that the degree of behavior change is driven by the level of innovation. If highly innovative products, such as BRS, could provide very well organized, useful information through the easy to use App in smartphone, consumers may see more value than the traditional way of looking around. Second, in the perspective of the status quo bias theory, this study also contributes to extend existing knowledge by considering self-efficacy (i.e., individual characteristic) and technical support (i.e., technical characteristic) simultaneously to comprehensively understand the factors influencing innovative technology resistance. Third, from the viewpoint of TAM, this study can theoretically contribute by finding the following results. When major changing behavior is demanded, consumers would not take into consideration to adopt any innovative product, such as short moment. Thus, organizers should suggest that the level of BRS innovation go beyond the sacrifice of changing behavior. Or very little behavioral change is demanded. In sum, if technological improvements can transform the way of doing adoption, there must be significant benefits or convenience.
The results had the following practical implications with regard to exhibition marketers and BRS developers. First, the results imply the need to recognize a role of switching cost clearly. If exhibition attendees do not recognize the newly developed BRS as highly valuable, then they will resist this system. Therefore, while switching cost must be reduced, relative advantage shall be increased. Second, self-efficacy shall be increased by providing an opportunity to run the BRS with users. To reduce the user’s resistance against new systems or technologies, previous studies suggest various approaches, such as directive, participative, supportive, and coercive approach [57]. Among them, considering the exhibition situation, supportive approaches can be the most appropriate approaches to reduce the attendees’ resistance. Therefore, if users feel that BRS is easy to operate and is conducive to visiting exhibition, resistance will be lower. For this, orientation sessions and guidance of exhibition staffs for BRS can useful in minimizing the user’s resistance. Third, a technical support level that connections can be made regardless of time and place is not sufficient to increase perceived value of users. Therefore, the BRS are easily integrated into current exhibition systems and to reduce minimal tradeoffs between the new and old method with strongly supportive technicality. In the end, attendees will change how they look around exhibition sites.
However, there are some limitations in this study. First, data collected for the analysis of this study showed a particularly large distribution of younger age groups. The reason is that SETEC, the place where the exhibition was held, is located in a popular place for Korean young people. Therefore, it is required a caution for interpreting, generalizing, and applying the results of this study. Second, in this study, data were collected for attendees who have experienced the BRS in exhibitions in the past. Although there may be a self-selection bias, however, this is because this study tried to find improvement points of the BRS by clarifying which parts are the main factors affecting user resistance even though they have experienced similar systems in the past. Therefore, in future research, it is necessary to study the difference between the user resistance before and after the use of the BRS (i.e., pre- and post-adoption of BRS).
The purpose of this study was to overcome the resistance of BRS, which was developed to increase the performance of exhibition and to increase exhibition performance. To this end, theoretical model development and empirical analysis have been done with regard to resistance to innovative technology. Now, it is time for IT to not only increase the productivity or cost reduction, but to also create new value. Sustainable tourism can be achieved by applying innovative technology, such as BRS, to increase nation’s competiveness.

Acknowledgments

This work was supported by the Ministry of Education of the Republic of Korea and the National Research Foundation of Korea (NRF-2016S1A3A2925146).

Author Contributions

Namho Chung conceived and designed the experiments; Namho Chung performed the experiments and analyzed the data; Chulmo Koo, Namho Chung and Juyeon Ham wrote and revised the paper. All of authors contributed to read and approved the final manuscript.

Conflicts of Interest

The authors declare no conflict of interest. The founding sponsors had no role in the design of the study; in the collection, analyses, or interpretation of data; in the writing of the manuscript, and in the decision to publish the results.

References

  1. Koo, C.; Park, J.; Lee, J.N. Smart tourism: Traveler, business, and organizational perspectives. Inf. Manag. 2017, 54, 683–686. [Google Scholar] [CrossRef]
  2. Gretzel, U.; Sigala, M.; Xiang, Z.; Koo, C. Smart tourism: Foundations and developments. Electron. Mark. 2015, 25, 179–188. [Google Scholar] [CrossRef]
  3. Getz, D. Event tourism: Definition, evolution, and research. Tour. Manag. 2008, 29, 403–428. [Google Scholar] [CrossRef]
  4. Morrow, S. The Art of the Show: An Introduction to the Study of Exhibition Management; International Association for Exhibition Management: Dallas, TX, USA, 1997. [Google Scholar]
  5. Ha, K.M.; Choi, I.Y.; Kim, H.Y.; Kim, J.K. A Bayesian Approach for Personalized Booth Recommendation. Int. Conf. Soc. Sci. Humanit. 2011, 5, 280–284. [Google Scholar]
  6. Tsai, C.Y.; Chung, S.H. A personalized route recommendation service for theme parks using RFID information and tourist behavior. Decis. Support Syst. 2012, 52, 514–527. [Google Scholar] [CrossRef]
  7. Kim, H.W.; Kankanhalli, A. Investigating User Resistance to Information Systems Implementation: A Status Quo Bias Perspective. MIS Q. 2009, 33, 567–582. [Google Scholar]
  8. Ram, S. A Model of Innovation Resistance. Adv. Consum. Res. 1987, 14, 208–212. [Google Scholar]
  9. Gourville, J.T. The Curse of Innovation: A Theory of Why Innovative New Products Fail in the Marketplace, Harvard Business School Marketing Research Papers, No. 5-6. Available online: https://papers.ssrn.com/sol3/papers.cfm?abstract_id=777644 (accessed on 5 November 2017).
  10. Adams, D.A.; Nelson, R.R.; Todd, P.A. Perceived usefulness, ease of use, and usage of information technology: A replication. MIS Q. 1992, 16, 227–247. [Google Scholar] [CrossRef]
  11. Davis, F.D. Perceived usefulness, perceived ease of use, and user acceptance of information technology. MIS Q. 1989, 13, 319–339. [Google Scholar] [CrossRef]
  12. Venkatesh, V. Determinants of Perceived Ease of Use: Integrating Control, Intrinsic Motivation, and Emotion into the Technology Acceptance Model. Inf. Syst. Res. 2000, 11, 342–365. [Google Scholar] [CrossRef]
  13. Burnham, T.A.; Frels, J.K.; Mahajan, V. Consumer switching costs: A typology, antecedents, and consequences. J. Acad. Mark. Sci. 2003, 31, 109–126. [Google Scholar] [CrossRef]
  14. Sánchez, R.A.; Hueros, A.D. Motivational factors that influence the acceptance of Moodle using TAM. Comput. Hum. Behav. 2010, 26, 1632–1640. [Google Scholar] [CrossRef]
  15. Alshammari, S.H.; Ali, M.B.; Rosli, M.S. The Influences of Technical Support, Self-Efficacy and Instructional Design on the Usage and Acceptance of LMS: A Comprehensive Review. Turk. Online J. Educ. Technol. 2016, 15, 116–125. [Google Scholar]
  16. Taylor, S.; Todd, P.A. Assessing IT usage: The role of prior experiences. MIS Q. 1995, 19, 561–570. [Google Scholar] [CrossRef]
  17. Igbaria, M.; Zinatelli, N.; Cragg, P.; Cavaye, A. Personal computing acceptance factors in small firms: A structural equation model. MIS Q. 1997, 21, 279–305. [Google Scholar] [CrossRef]
  18. Agarwal, R.; Karahanna, E. Time flies when you’re having fun: Cognitive absorption and beliefs about information technology usage. MIS Q. 2000, 24, 665–694. [Google Scholar] [CrossRef]
  19. Gefen, D.; Karahanna, E.; Straub, D.W. Trust and TAM in online shopping: An integrated model. MIS Q. 2003, 27, 51–90. [Google Scholar]
  20. Venkatesh, V.; Morris, M.G.; Davis, G.B.; Davis, F.D. User acceptance of information technology: Toward a unified view. MIS Q. 2003, 27, 425–478. [Google Scholar]
  21. Sheth, J.N. Psychology of innovation Resistance: The Less Developed Concept (LDC) in Diffusion Research. Res. Mark. 1981, 4, 273–282. [Google Scholar]
  22. Zaltman, G.; Wallendorf, M. Consumer Behavior: Basic Findings and Management Implications; John Wiley & Sons: New York, NY, USA, 1983. [Google Scholar]
  23. Bao, Y. Organizational resistance to performance-enhancing technological innovations: A motivation-threat-ability framework. J. Bus. Ind. Mark. 2009, 24, 119–130. [Google Scholar] [CrossRef]
  24. Cho, S.D.; Chang, D.R. Salesperson’s innovation resistance and job satisfaction in intra-organizational diffusion of sales force automation technologies: The case of South Korea. Ind. Mark. Manag. 2008, 37, 841–847. [Google Scholar] [CrossRef]
  25. Ram, S.; Jung, H.S. “Forced” adoption of innovations in organizations: Consequences and implications. J. Prod. Innov. Manag. 1991, 8, 117–126. [Google Scholar] [CrossRef]
  26. Card, J.A.; Chen, C.Y.; Cole, S.T. Online Travel Products Shopping: Differences between Shoppers and Nonshoppers. J. Travel Res. 2003, 42, 133–139. [Google Scholar] [CrossRef]
  27. Lian, J.W.; Yen, D.C. To buy or not to buy experience goods online: Perspective of innovation adoption barriers. Comput. Hum. Behav. 2013, 29, 665–672. [Google Scholar] [CrossRef]
  28. Kang, Y.; Kim, S. Understanding User Resistance to Participation in Multihop Communications. J. Comput. Med. Commun. 2009, 14, 328–351. [Google Scholar] [CrossRef]
  29. Hirschheim, R.; Newman, M. Information Systems and User Resistance: Theory and Practice. Comput. J. 1988, 31, 398–408. [Google Scholar] [CrossRef]
  30. Markus, M.L. Power, Politics, and MIS Implementation. Commun. ACM 1983, 26, 430–444. [Google Scholar] [CrossRef]
  31. Lapointe, L.; Rivard, S. A Multiple Model of Resistance to Information Technology Implementation. MIS Q. 2005, 29, 461–491. [Google Scholar]
  32. Samuelson, W.; Zeckhauser, R. Status quo bias in decision making. J. Risk Uncertain. 1988, 1, 7–59. [Google Scholar] [CrossRef]
  33. Kahneman, D.; Tversky, A. Prospect Theory: An Analysis of Decision under Risk. Econometrica 1979, 47, 263–292. [Google Scholar] [CrossRef]
  34. Zeithaml, V.A. Consumer perceptions of price, quality, and value: A means-end model and synthesis of evidence. J. Mark. 1988, 2–22. [Google Scholar] [CrossRef]
  35. Dodds, W.B.; Monroe, K.B.; Grewal, D. Effects of price, brand, and store information on buyers’ product evaluations. J. Mark. Res. 1991, 307–319. [Google Scholar] [CrossRef]
  36. Chen, Z.; Dubinsky, A.J. A conceptual model of perceived customer value in e-commerce: A preliminary investigation. Psychol. Mark. 2003, 20, 323–347. [Google Scholar] [CrossRef]
  37. Kim, H.W.; Chan, H.C.; Gupta, S. Value-based Adoption of Mobile Internet: An empirical investigation. Decis. Support Syst. 2007, 43, 111–126. [Google Scholar] [CrossRef]
  38. Kim, H.W.; Xu, Y.; Gupta, S. Which is more important in internet shopping, perceived price or trust? Electron. Commer. Res. Appl. 2012, 11, 241–252. [Google Scholar] [CrossRef]
  39. Moore, G.C.; Benbasat, I. Development of an Instrument to Measure the Perceptions of Adopting an Information Technology Innovation. Inf. Syst. Res. 1991, 2, 192–222. [Google Scholar] [CrossRef]
  40. Bandura, A. Self-Efficacy: Toward a Unifying Theory of Behavioral Change. Psychol. Rev. 1977, 84, 191–215. [Google Scholar] [CrossRef] [PubMed]
  41. Torkzadeh, G.; Chang, C.J.; Demirhan, D. A contingency model of computer and Internet self-efficacy. Inf. Manag. 2006, 43, 541–550. [Google Scholar] [CrossRef]
  42. Compeau, D.R.; Higgins, C.A. Computer Self-Efficacy: Development of a Measure and Initial Test. MIS Q. 1995, 19, 189–211. [Google Scholar] [CrossRef]
  43. Bandura, A. Self-efficacy mechanism in human agency. Am. Psychol. 1982, 37, 122. [Google Scholar] [CrossRef]
  44. Chung, N.; Kwon, S.J. The Effects of Customers’ Mobile Experience and Technical Support on the Intention to Use Mobile Banking. Cyberpsychol. Behav. 2009, 12, 539–543. [Google Scholar] [CrossRef] [PubMed]
  45. Davis, F.D.; Bagozzi, R.P.; Warshaw, P.R. User acceptance of computer technology: A comparison of two theoretical models. Manag. Sci. 1989, 35, 982–1003. [Google Scholar] [CrossRef]
  46. Goh, H.P. The Diffusion of Internet in Singapore: A Content Analytic Approach; Faculty of Business Administration, National University of Singapore: Singapore, 1995; Volume 96. [Google Scholar]
  47. Paré, G.; Elam, J. Discretionary use of personal computers by knowledge workers: Testing of a social psychology theoretical model. Behav. Inf. Technol. 1995, 14, 215–228. [Google Scholar] [CrossRef]
  48. Ahearne, M.; Jelinek, R.; Rapp, A. Moving beyond the direct effect of SFA adoption on salesperson performance: Training and support as key moderating factors. Ind. Mark. Manag. 2005, 34, 379–388. [Google Scholar] [CrossRef]
  49. Lee, K.C.; Chung, N. Exploring Antecedents of Behavior Intention to Use Internet Banking in Korea: Adoption Perspective. Int. J. E-Adopt. 2009, 1, 30–47. [Google Scholar] [CrossRef]
  50. Lee, K.C.; Chung, N.; Lee, S. Exploring the influence of personal schema on trust transfer and switching costs in brick-and-click bookstores. Inf. Manag. 2001, 48, 364–370. [Google Scholar] [CrossRef]
  51. Hair, J.F., Jr.; Black, W.C.; Babin, B.J.; Anderson, R.E.; Tatham, R.L. Multivariate Data Analysis, 6th ed.; Pearson Prentice Hall: Upper Saddle River, NJ, USA, 2006. [Google Scholar]
  52. Kline, R.B. Principles and Practice of Structural Equation Modeling; Guilford Press: New York, NY, USA, 2011. [Google Scholar]
  53. Anderson, J.C.; Gerbing, D.W. Assumptions and comparative strengths of the two-step approach. Sociol. Methods Res. 1992, 20, 321–333. [Google Scholar] [CrossRef]
  54. Gefen, D.; Straub, D.W.; Boudreau, M. Structural Equation Modeling and Regression: Guidelines for Research Practice. Commun. AIS 2000, 4, 2–76. [Google Scholar]
  55. Fornell, C.; Larcker, D.F. Evaluating structural equation models with unobservable variables and measurement error. J. Mark. Res. 1981, 18, 39–50. [Google Scholar] [CrossRef]
  56. Bhattacherjee, A.; Sanford, C. Influence processes for information technology acceptance: An elaboration likelihood model. MIS Q. 2006, 30, 805–825. [Google Scholar]
  57. Ali, M.; Zhou, L.; Miller, L.; Ieromonachou, P. User resistance in IT: A literature review. Int. J. Inf. Manag. 2016, 36, 35–43. [Google Scholar] [CrossRef]
Figure 1. Research model.
Sustainability 09 02041 g001
Figure 2. Results of structural equation modeling (SEM) analysis.
Sustainability 09 02041 g002
Table 1. Demographic characteristics of respondents.
CharacteristicsFrequency%
GenderMale29164.0
Female16436.0
AgeUnder 20204.4
20~2921447.0
30~3910823.7
40~498318.2
Over 50306.6
OccupationStudent17237.8
Office worker8719.1
Services367.9
Technician184.0
Professional316.8
Self-employed7516.5
Civil servant40.9
Homemaker204.4
Other51.1
none71.5
Yearly incomeLess than 30 million won *24553.8
30–40 million won8017.6
40–50 million won5512.1
50–60 million won296.4
60–80 million won235.1
More than 80 million won153.3
none81.8
Total455100
* 1 $ (USD) = 1092 Won.
Table 2. Results of convergent validity testing a.
Constructs and VariablesLoadingsCR bAVE cαReferences
Self-efficacy1. I am confident of using BRS even if there is no one around to show me how to do it. d-0.8900.8020.890[42]
2. I am confident of using BRS even if I have never used such a system before.0.901
3. I am confident of using BRS if I have just seen someone using it before trying it myself.0.890
Technical support1. Whenever I want the BRS service, I can have the service by connecting to the Internet.0.8060.8980.7460.897[44,48]
2. Wherever I go, I can have the BRS service via the Internet.0.906
3. BRS can provide its service and information acquisition immediately regardless of place and time.0.876
4. BRS can provide its service immediately at a time when information and service is needed regardless of time and place.-
Relative advantage1. Using BRS enables me to find a desired booth more quickly.0.9300.9090.8340.909[39,49]
2. Using BRS enables me to find a desired booth more easily.0.896
3. Using BRS is helpful for the show experience. d-
Switching cost1. If it requires extra effort, it will be better not to use the BRS.0.8540.9240.7530.924[39,50]
2. Other ways are more convenient than the BRS.0.882
3. Not using the BRS will save time.0.871
4. I used more time and effort on the BRS.0.864
Perceived value 1. Considering the time I install the app, the BRS is quite variable. 0.8330.8950.8110.889[36,37]
2. Considering the effort I install the app, the BRS is of value.0.963
3. Overall, the BRS is of value to me. d-
Exhibition attendee’s resistance1. Using the BRS limits me touring (or seeing) the exhibition. d-0.9160.8460.916[7]
2. Using the BRS is inconvenient in touring (or seeing) the exhibition. 0.909
3. Using the BRS bothers me in touring (or seeing) the exhibition. 0.930
a χ2 = 104.143, d.f = 75 (χ2/d.f = 1.389), p = 0.015, GFI = 0.971, AGFI = 0.954, NFI = 0.981, CFI = 0.994, RMSEA = 0.029; b Composite Reliability; c Average Variance Extracted; d The item was deleted after confirmatory factor analysis.
Table 3. Correlation and descriptive statistics.
ConstructCorrelation of ConstructsMeanS.D.SkewnessKurtosis
123456
1. Self-efficacy0.896 5.2791.153−0.569 0.584
2. Technical support0.429 **0.864 4.6141.024−0.248 0.854
3. Relative advantage0.603 **0.517 **0.913 5.1011.240−0.798 0.820
4. Switching cost−0.217 **−0.026−0.182 **0.868 3.4631.4470.097 −0.686
5. Perceived value0.542 **0.503 **0.582 **−0.206 **0.900 4.9821.160−0.379 0.681
6. Exhibition attendee’s resistance−0.167 **0.069−0.096 *0.731 **−0.093 *0.9203.4301.4970.221 −0.726
The diagonal elements in bold in the “correlation of constructs” matrix are the square root of the average variance extracted (AVE). For adequate discri minant validity, the diagonal elements should be greater than the corresponding off-diagonal elements. ** p < 0.01, * p < 0.05.
Table 4. Structural estimates and tests of the main hypotheses.
HypothesisPathEstimates (t-Value)Results
H1Perceived value→Exhibition attendee’s resistance−0.080 (2.243)Supported
H2Relative advantage→Perceived value0.271 (4.458)Supported
H3Switching cost→Perceived value−0.104 (−2.675)Supported
H4Switching cost→Exhibition attendee’s resistance0.811 (17.834)Supported
H5Self-efficacy→Perceived value0.257 (4.379)Supported
H6Self-efficacy→Relative advantage0.519 (10.580)Supported
H7Self-efficacy→Switching cost−0.308 (−5.146)Supported
H8Technical support→Perceived value0.298 (5.933)Supported
H9Technical support→Relative advantage0.324 (6.992)Supported
H10Technical support→Switching cost0.118 (2.017)Not Supported
χ2 = 113.654, d.f = 79 (χ2/d.f = 1.439), p = 0.006, GFI = 0.968, AGFI = 0.952, NFI = 0.979, CFI = 0.993, RMSEA = 0.031.

