Emergy Perspectives on the Environmental Performance and Sustainability of Small-Scale Gold Production Systems in Ghana


Abstract
1. Introduction
2. Materials and Methods
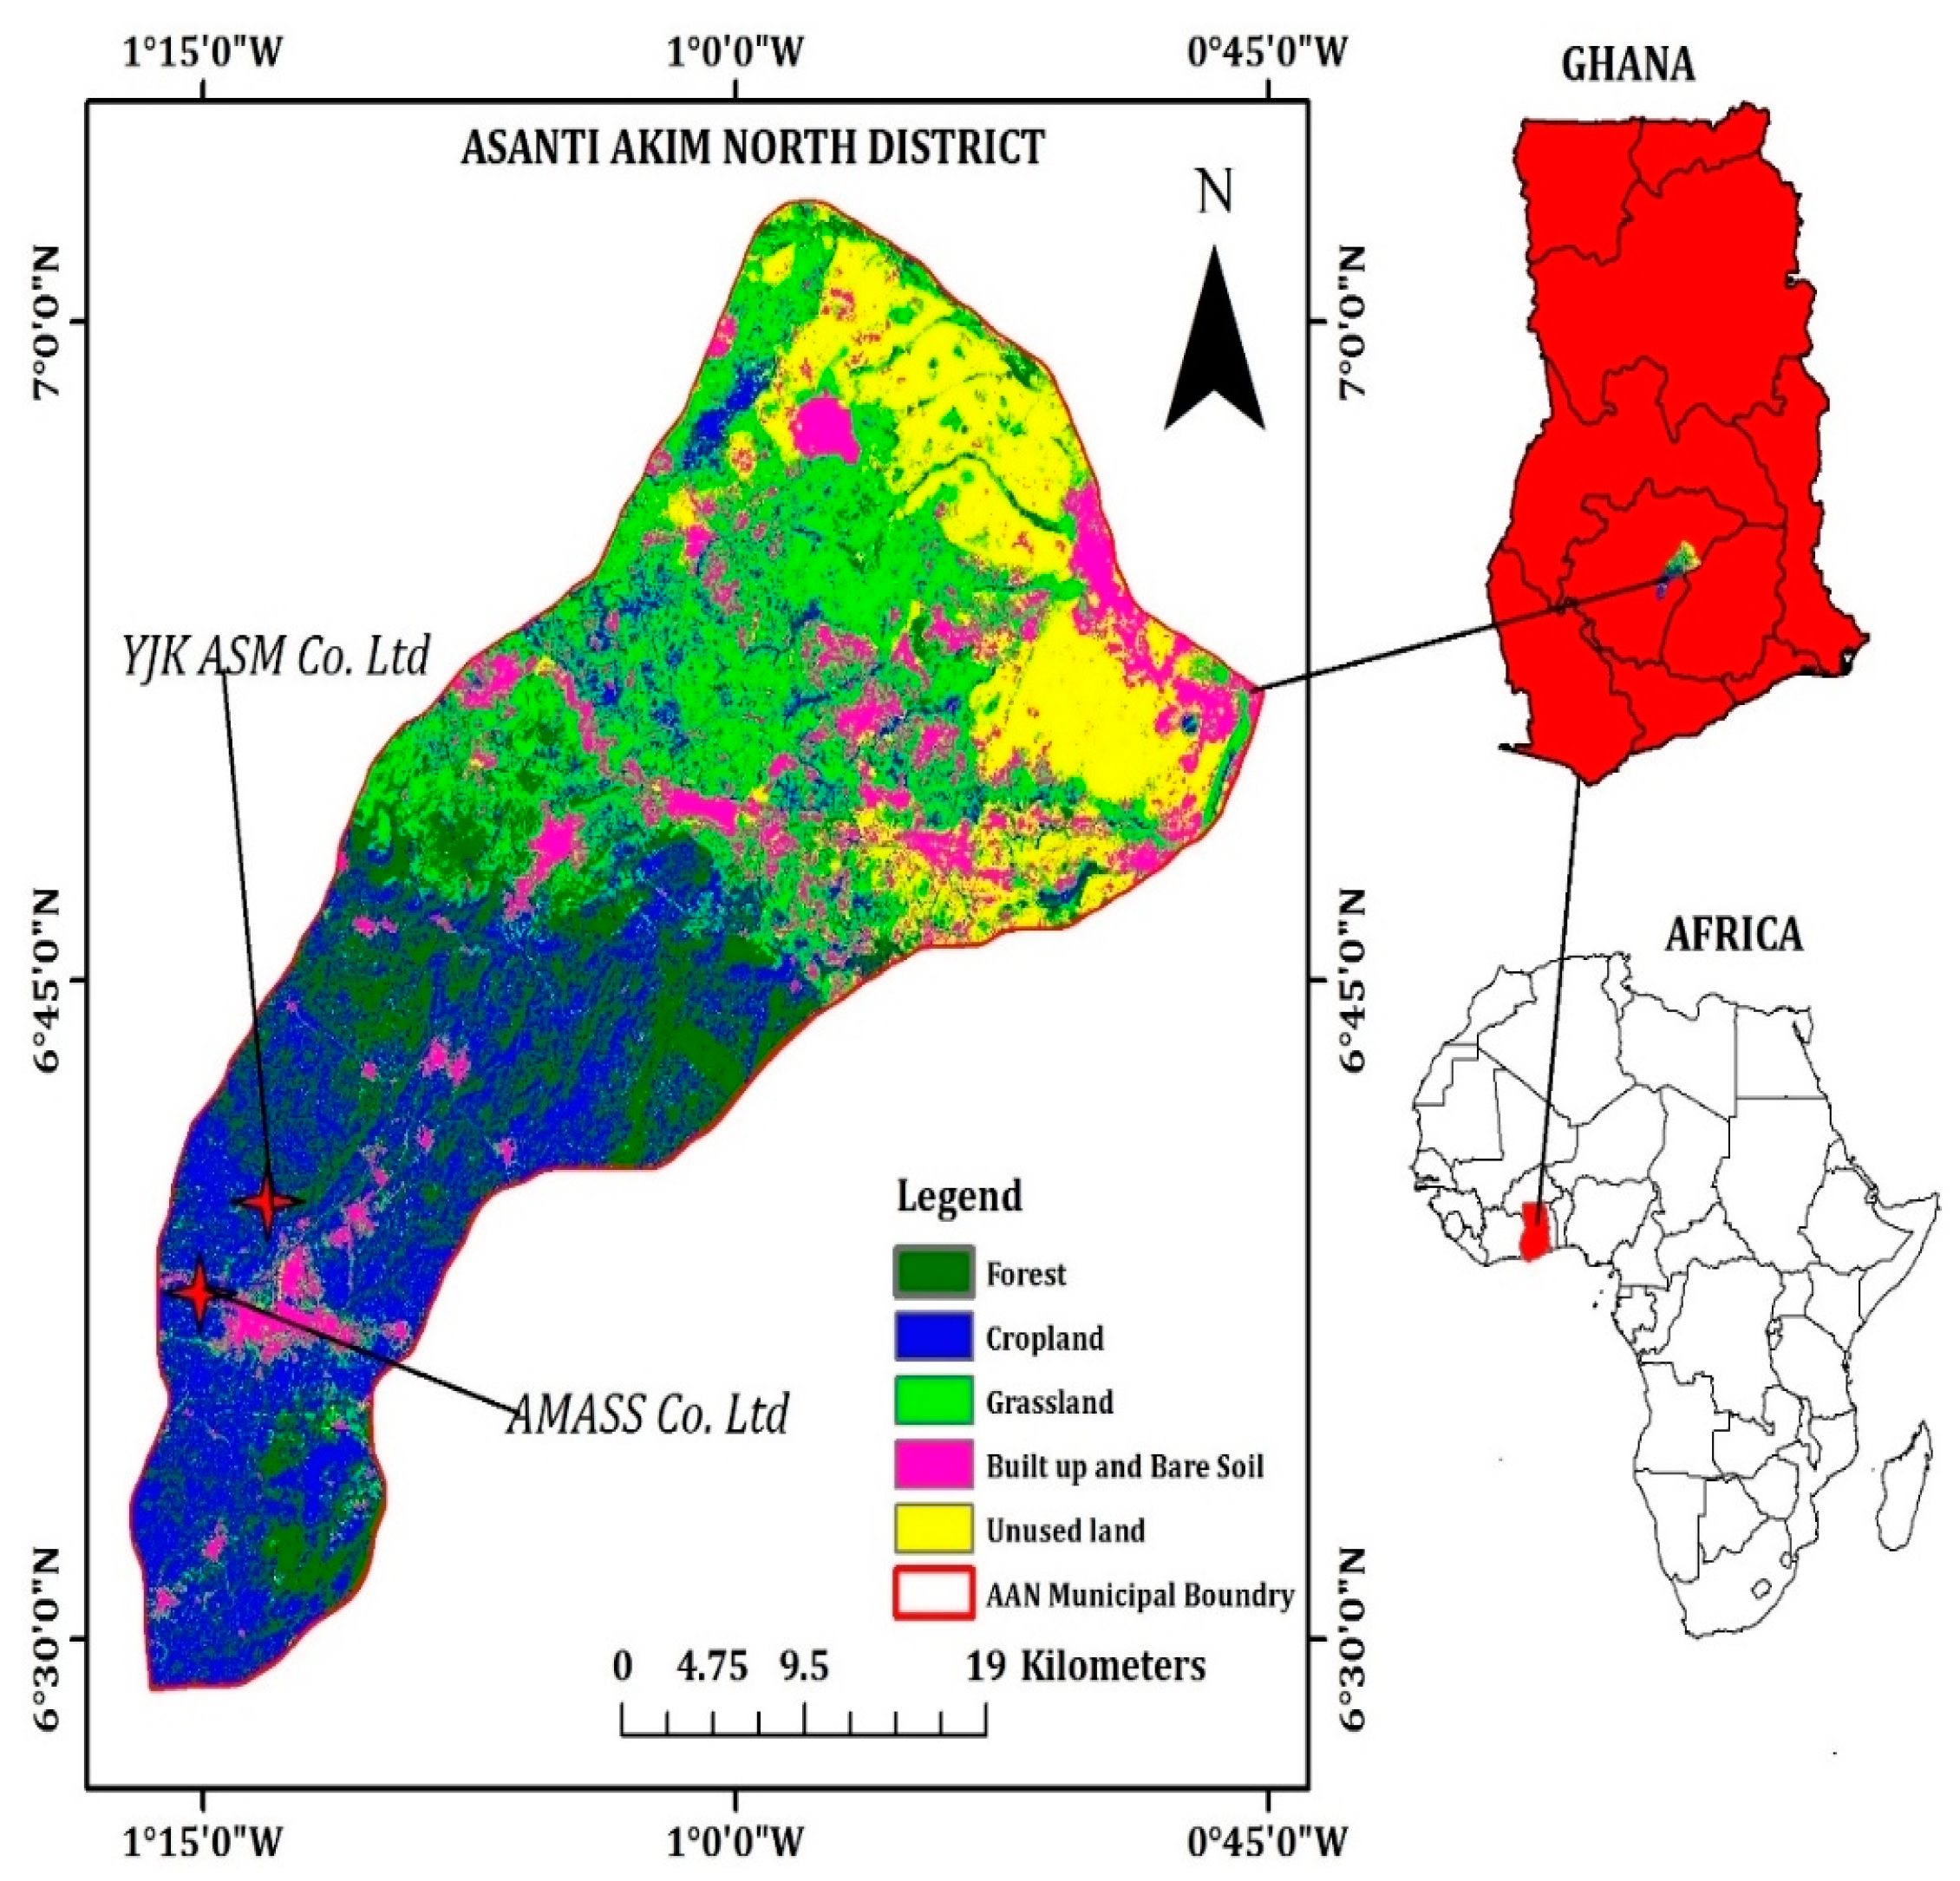
2.1. ASGM Case Systems
2.2. Emergy Analysis
3. Results and Discussion
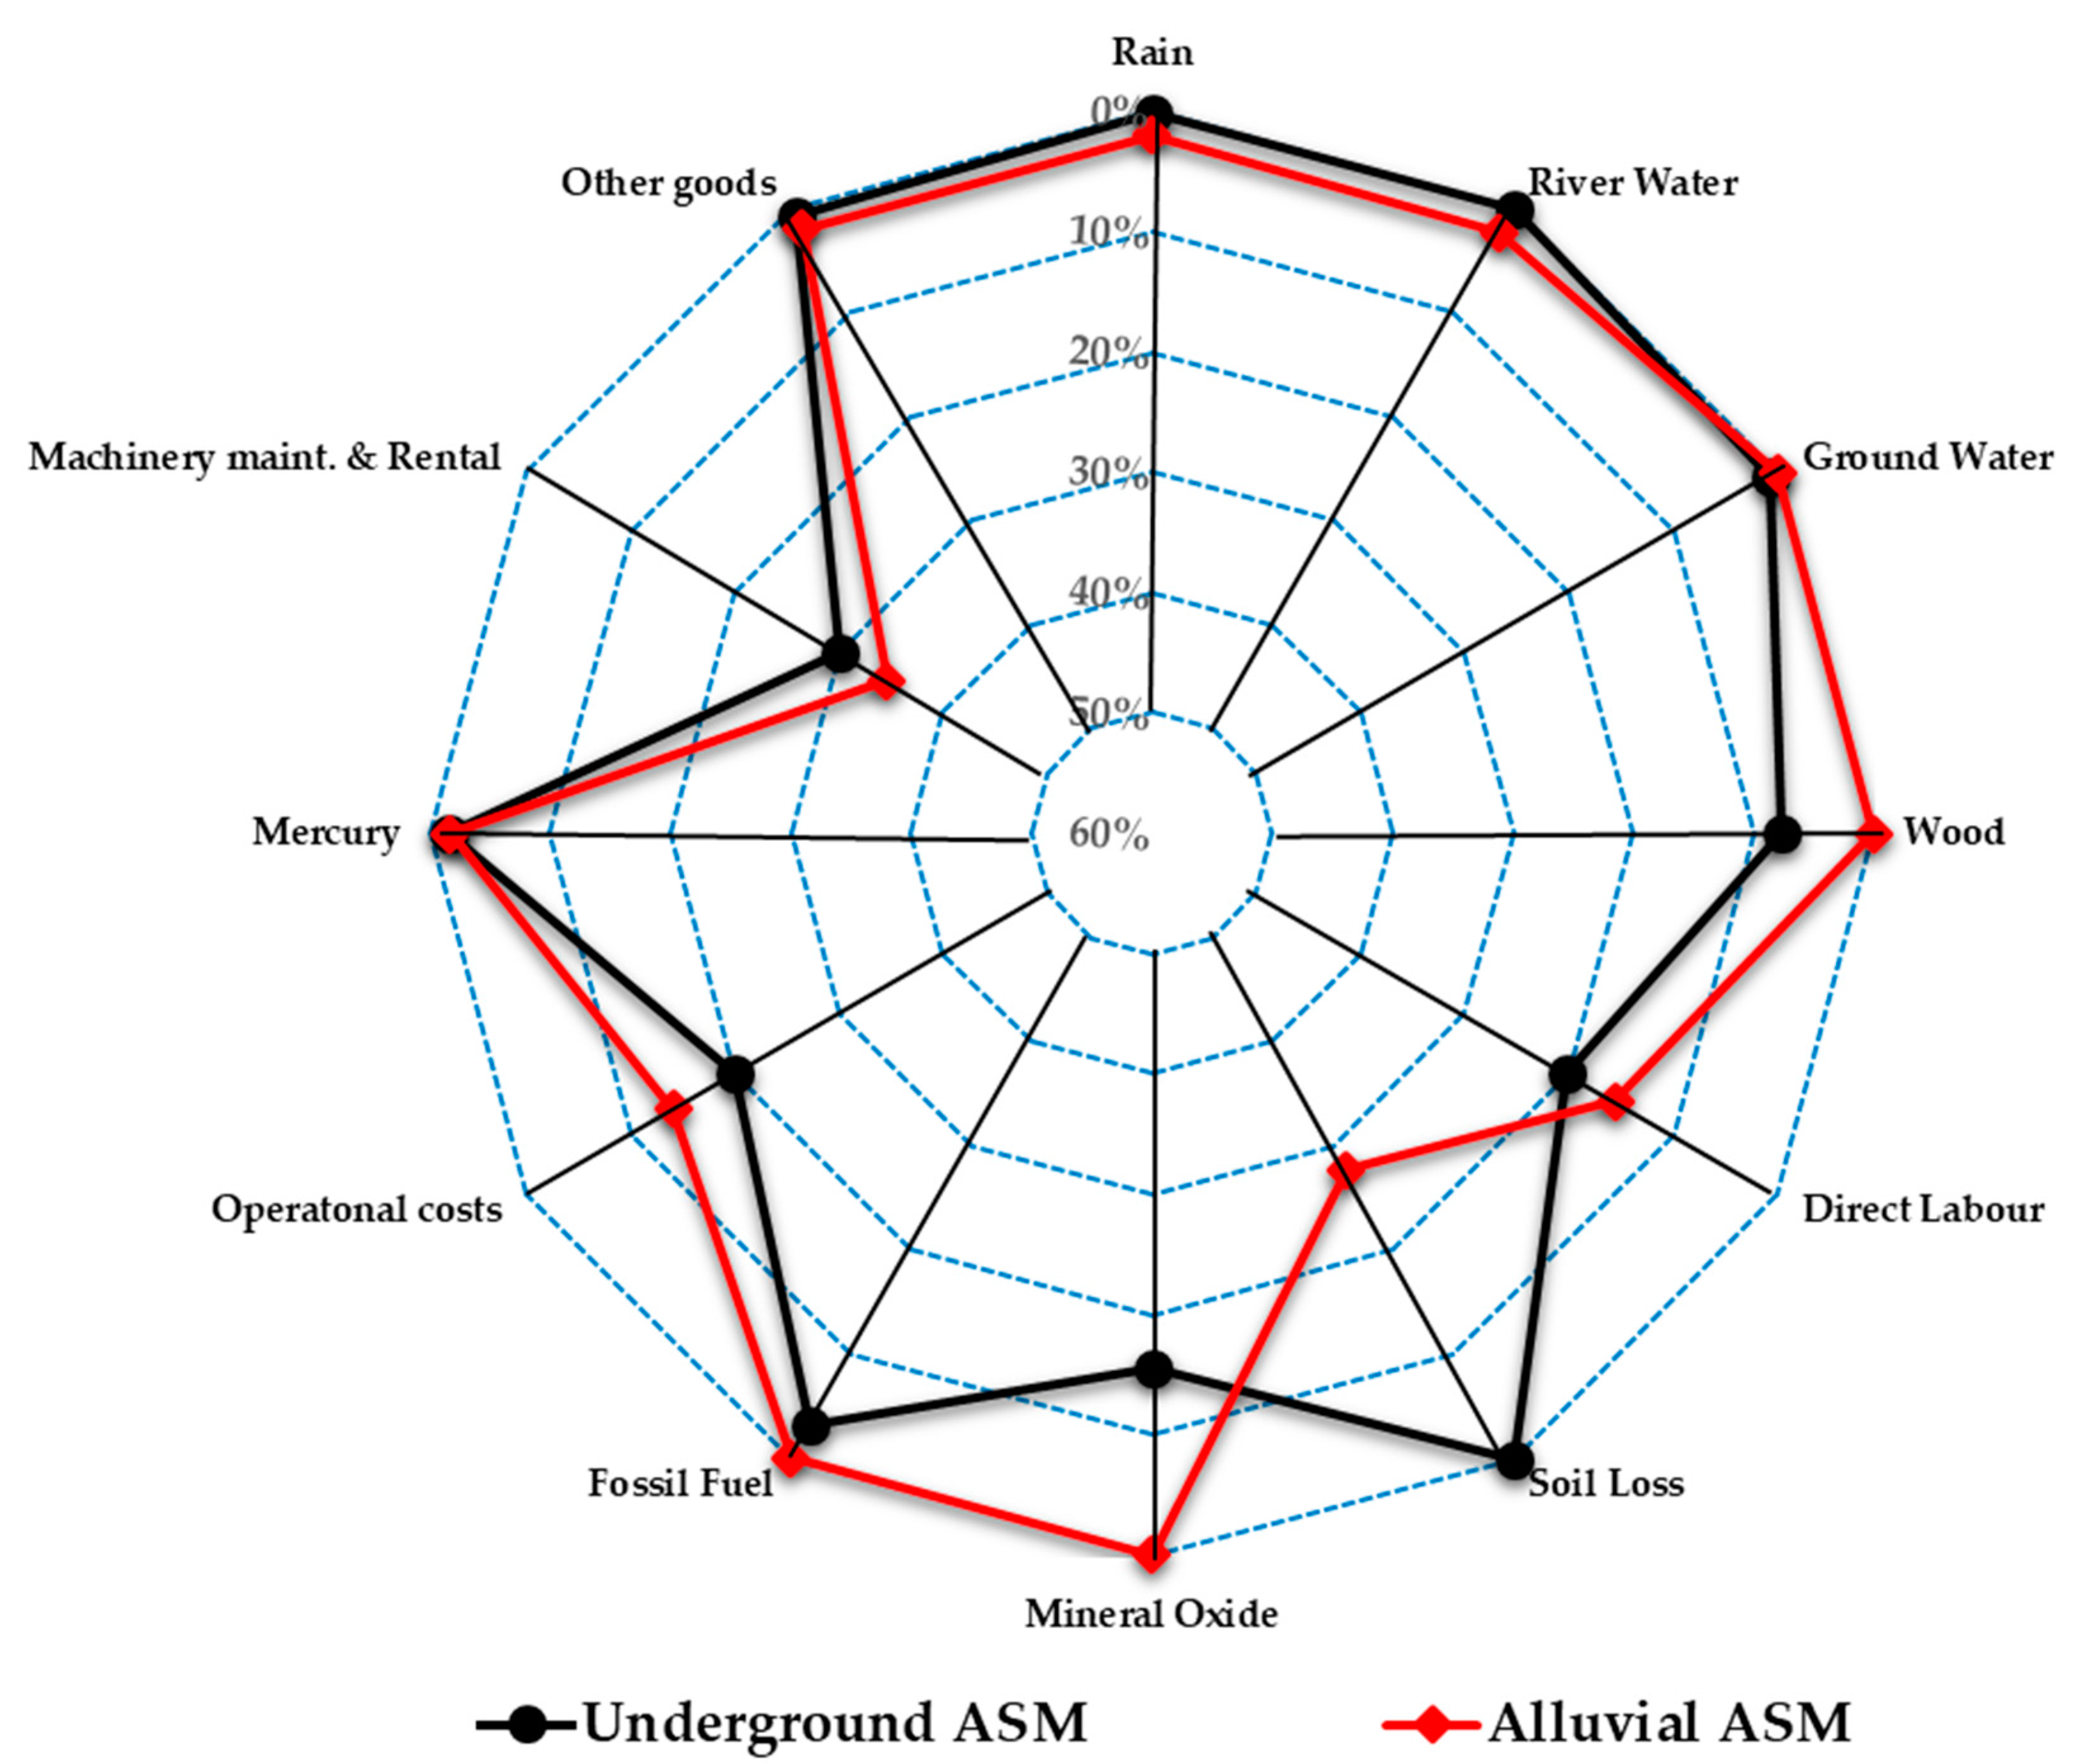
3.1. Emergy Accounting
3.2. Emergy-Based Indices
4. Conclusions
Acknowledgments
Author Contributions
Conflicts of Interest
Appendix A

| Description | Value | Unit | Source | |
|---|---|---|---|---|
| 1 | SUN | |||
| Sunlight Flow for Ghana | 1.20 × 10²¹ | J | [30] | |
| Total Land Area | 2.30 × 10⁷ | ha | ||
| Production Area | 20.334 | ha | ||
| Sun Energy for Production Area | ||||
| 1.06 × 10¹⁵ | J | |||
| UEV of Sun | 1.00 | sej/J | [30] | |
| Sun Emergy | 1.06 × 10¹⁵ | sej | ||
| Per Cent of Emergy Budget | 0.04% | |||
| 2 | RAIN | |||
| Rain Energy for Ghana | 1.80 × 10¹⁸ | [37] | ||
| Total Land Area | 2.30 × 10⁷ | ha | ||
| Production Area | 20.334 | ha | ||
| Rain Energy for Production Area | × 20.334 | |||
| 1.59 × 10¹² | J | |||
| UEV of Rain | 3.10 × 10⁴ | sej/J | [30] | |
| Rain Emergy | 4.93 × 10¹⁶ | sej | ||
| Per Cent of Emergy Budget | 2.00% | |||
| 3 | RIVER WATER | |||
| Time of Pump Use | 300 | min/day | ||
| Rate of Pump Flow | 0.416 | m3/min | ||
| Water Use (Volume/year) | [(Time use) × (Rate of flow) × 365] ÷ 20.3 ha | |||
| 4.55 × 10⁵ | m3 | |||
| UEV of River Water | 1.26 × 10¹¹ | sej/m3 | [32] | |
| River Water Emergy | 5.73 × 10¹⁶ | sej | ||
| Per Cent of Emergy Budget | 2.32% | |||
| 4 | SOIL LOSS | |||
| Annual Soil Loss | 2.40 × 10⁵ | g/year | ||
| Organic Matter Fraction | 0.56 | dimensionless | HWSD, v1.2 (accessed June 2016) | |
| Energy Content | kcal/g | |||
| Total Soil Loss Energy | [(Annual soil loss) × (Organic matter fraction) × (Energy content) × (1000 g/kg) × (4186 J/kcal)] ÷ 20.3 ha | |||
| 5.62 × 10¹² | J/year | |||
| UEV of Soil Loss | 1.24 × 10⁵ | sej/J | [30] | |
| Soil Loss Emergy | 6.97 × 10¹⁷ | sej | ||
| Per Cent of Emergy Budget | 28.27% | |||
| 5 | FOSSILS | |||
| Diesel Oil | 1080 | L/year | ||
| Patrol Fuel | 216 | L/year | ||
| Total Fossils | 1299 | L/year | ||
| Fossil Energy | [(L/year × 3.14 × 10⁷ J/L)] ÷ 20.3 ha = J/year/ha | |||
| 4.06 × 10¹⁰ | J | |||
| UEV of Fossils | 3.85 × 10⁴ | sej/J | [33] | |
| Fossil Emergy | 1.56 × 10¹⁵ | sej | ||
| Per Cent of Emergy Budget | 0.06% | |||
| 6 | MACHINERY | Assumed lifespan | ||
| Pump Machine | 1.50 × 10³ | g/y | 5 years | |
| Leach Machine | 5.00 × 10⁴ | g/y | 3 years | |
| Total Machinery Mass | 5.15 × 10⁴ | g/year | ||
| UEV of Machinery | 1.79 × 10¹⁰ | sej/g | [30] | |
| Machinery Emergy | 9.23 × 10¹⁴ | sej | ||
| Per Cent of Emergy Budget | 0.04% | |||
| 7 | BLANKETS (WOOLEN) | |||
| Quantity | 3 | bundles | ||
| Mass/Bundle | 7.50 × 10⁴ | g | ||
| Total Mass of Blanket | 2.25 × 10⁵ | g/year | ||
| UEV of Blanket | 1.34 × 10¹¹ | sej/g | [17] | |
| Emergy of Blanket | 3.02 × 10¹⁶ | sej | ||
| Per Cent of Emergy Budget | 1.22% | |||
| 8 | MERCURY | |||
| Mass | 1.00 × 10³ | g/year | ||
| UEV of Mercury | 4.20 × 10¹³ | sej/g | [34] | |
| Mercury Emergy | 4.02 × 10¹⁶ | sej | ||
| Per Cent of Emergy Budget | 1.70% | |||
| 9 | LABOUR | 4.80 × 10⁴ | GH¢/year | |
| 1.26 × 10⁴ | $/year | |||
| UEV | 3.10 C | sej/$ | [37] | |
| Labour Emergy | 3.91 × 10¹⁷ | sej | ||
| Per Cent of Emergy Budget | 15.82% | |||
| 10 | WOOD | 1.98 × 10³ | GH¢/year | |
| 5.21 × 10² | $/year | |||
| UEV | 3.10 × 10¹³ | sej/$ | [37] | |
| Wood Emergy | 1.61 × 10¹⁶ | sej | ||
| Per Cent of Emergy Budget | 0.65% | |||
| 11 | MACHINE RENTAL AND MAINTENANCE | 2.81 × 10⁴ | GH¢/year | |
| 1.07 × 10⁵ | $/year | |||
| UEV | 3.10 × 10¹³ | sej/$ | [37] | |
| Machinery Emergy | 8.72 × 10¹⁷ | sej | ||
| Per Cent of Emergy Budget | 35.29% | |||
| 12 | REFINERY COST | 1.20 × 10² | GH¢/year | |
| 3.13 × 101 | $/year | |||
| UEV | 3.10 × 10¹³ | sej/$ | [37] | |
| Refinery Emergy | 9.70 × 10¹⁴ | sej | ||
| Per Cent of Emergy Budget | 0.04% | |||
| 13 | OPERATIONAL COST | 4.40 × 10⁴ | GH¢/year | |
| 1.15 × 10⁴ | $/year | |||
| UEV | 3.10 × 10¹³ | sej/$ | [37] | |
| Operation Cost Emergy | 3.56 × 10¹⁷ | sej | ||
| Per Cent of Emergy Budget | 14.1% | |||
| Description | Value | Unit | Source | |
|---|---|---|---|---|
| 1 | SUN | |||
| Sunlight Flow for Ghana | 1.20 × 10²¹ | J | [30] | |
| Total Land Area | 2.30 × 10⁷ | ha | ||
| Sun Energy for Production Area | ||||
| 7.00 × 10¹⁴ | J/year | |||
| UEV of Sun | 1.00 | sej /J | [30] | |
| Sun Emergy | 7.00 × 10¹⁴ | sej | ||
| Per Cent of Emergy Budget | 0.00% | |||
| 2 | WIND | |||
| Wind Energy for Ghana | 7.50 × 10¹⁶ | J | [37] | |
| Total Land Area | 2.30 × 10⁷ | ha | ||
| Wind Energy for Production Area | ||||
| 4.38 × 10¹⁰ | J/year | |||
| UEV of Wind | 2.45 × 10³ | sej/J | [30] | |
| Wind Emergy | 1.07 × 10¹⁴ | sej | ||
| Per Cent of Emergy Budget | 0.00% | |||
| 3 | RAIN | |||
| Rain Energy for Ghana | 1.80 × 10¹⁸ | [37] | ||
| Total Land Area | 2.30 × 10⁷ | ha | ||
| Rain Energy for Production Area | ||||
| 1.05 × 10¹² | J/year | |||
| UEV of Rain | 3.10 × 10⁴ | sej/J | [30] | |
| Rain Emergy | 3.26 × 10¹⁶ | sej | ||
| Per Cent of Emergy Budget | 0.20% | |||
| 4 | WOOD | |||
| Quantity | 3.60 × 10⁸ | g/year | ||
| UEV | 3.50 × 10⁹ | sej/g | [17] | |
| Wood Emergy | 1.26 × 10¹⁸ | |||
| Per Cent of Emergy Budget | 7.76% | |||
| 5 | CHARCOAL | |||
| Quantity | 1.16 × 10⁴ | Kg/year | ||
| Energy in Charcoal | 3.30 × 10⁷ | J/kg | See Endnotes | |
| Total Energy | 3.60 × 10¹¹ | J/year | ||
| UEV of Charcoal | 1.78 × 10⁵ | sej/J | [17] | |
| Charcoal Emergy | 1.26 × 10¹⁷ | sej | ||
| Per Cent of Emergy Budget | 0.04% | |||
| 6 | GROUND WATER | |||
| Time of Pump Use | 120 | min/day | ||
| Rate of Flow of Pump | 0.416 | m3/minute | ||
| Water Use (Vol./year) | [(Time use) × (Rate of flow) × 365] ÷ 10.2 ha | |||
| 1.80 × 10⁵ | m3/year | |||
| UEV of Ground Water | 6.23 × 10¹¹ | sej/m3 | [32] | |
| Groundwater Emergy | 1.12 × 10¹⁷ | sej | ||
| Per Cent of Emergy Budget | 0.69% | |||
| 7 | ROCK OXIDE | |||
| Quantity | 3.65 × 10⁵ | Bags | ||
| Unit Mass | 40 | kg/bag | ||
| Total Rock Mass | 1.46 × 10¹² | g/year | ||
| UEV of Rock | 1.73 × 10⁶ | sej/g | [32] | |
| Rock Oxide Emergy | 2.53 × 10¹⁸ | sej | ||
| Per Cent of Emergy Budget | 15.55% | |||
| 8 | FOSSILS | |||
| Diesel Oil | 2.92 × 10⁴ | L/year | ||
| Patrol Fuel | 1.54 × 10⁴ | L/year | ||
| Total Fossils | 4.46 × 10⁴ | L/year | ||
| Fossil Energy | (L/year × 3.14 × 10⁷ J/L) | |||
| 1.40 × 10¹³ | J/year | |||
| UEV of Fossils | 3.85 × 10⁴ | sej/J | [33] | |
| Fossil Emergy | 5.39 × 10¹⁷ | sej | ||
| Per Cent of Emergy Budget | 3.32% | |||
| 9 | ELECTRICITY | |||
| Total Paid | 9.13 × 10⁴ | GH¢/year | ||
| Price of Electricity per kWh is 0.158 GH¢ http://www.costtotravel.com/cost/electricity-in-ghana | ||||
| Total Power | 5.78 × 10⁵ | KWh | ||
| Contact Time | 3120 | h/year | ||
| Energy | Power × Time | J | ||
| 1.80 × 10⁹ | J/year | |||
| UEV of Electricity | 2.92 × 10⁵ | sej/J | [17] | |
| Emergy of Electricity | 5.24 × 10¹⁴ | sej | ||
| Per Cent of Emergy Budget | 0.00% | |||
| 10 | MACHINERY | |||
| Pump Machine | 3.00 × 10³ | g/year | Assuming 5-year lifespan | |
| Ball Mill Machine | 1.27 × 10⁵ | g/year | Assuming 3-year lifespan | |
| Total Machinery Mass | 1.30 × 10⁶ | g/year | ||
| UEV of Machinery | 1.79 × 10¹⁰ | sej/g | [30] | |
| Machinery Emergy | 2.32 × 10¹⁶ | sej | ||
| Per Cent of Emergy Budget | 0.14% | |||
| 11 | EXPLOSIVES | |||
| Mass of Explosives | 1.00 × 10⁴ | g/year | ||
| UEV of Explosives | 4.19 × 10⁹ | sej/g | [35] | |
| Explosives Emergy | 4.19E × 1013 | sej | ||
| Per Cent of Emergy Budget | 0.00% | |||
| 12 | BLANKETS | |||
| Quantity | 5 | bundles | ||
| Mass per Bundle | 3.00 × 10⁴ | g | ||
| Mass of Blanket | 1.50 × 10⁵ | g/year | ||
| UEV of Blanket | 1.34 × 10¹¹ | sej/g | [17] | |
| Emergy of Blanket | 2.01 × 10¹⁶ | sej | ||
| Per Cent of Emergy Budget | 0.12% | |||
| 13 | MERCURY | |||
| Mass | 6.09 × 10³ | g/year | ||
| UEV of Mercury | 4.20 × 10¹³ | sej/g | [34] | |
| Mercury Emergy | 2.51 × 10¹⁶ | sej | ||
| Per Cent of Emergy Budget | 1.57% | |||
| 14 | LABOUR COST | 4.03 × 10⁵ | GH¢/year | |
| 1.06 × 10⁵ | $/year | |||
| UEV | 3.10 × 10¹³ | sej/$ | [37] | |
| Labour Emergy | 3.29 × 10¹⁸ | sej | ||
| Per Cent of Emergy Budget | 20.23% | |||
| 15 | WOOD | 7.00 × 10³ | GH¢/year | |
| 1.83 × 10³ | $/year | |||
| UEV | 3.10 × 10¹³ | sej/$ | [37] | |
| Wood Emergy | 5.67 × 10¹⁶ | sej | ||
| Per Cent of Emergy Budget | 0.35% | |||
| 16 | MACHINE RENTALS AND MAINTENANCE | 6.00 × 10⁵ | GH¢/year | |
| 1.58 × 10⁵ | $/year | |||
| UEV | 3.10 × 10¹³ | sej/$ | [37] | |
| Machinery Emergy | 4.90 × 10¹⁸ | sej | ||
| Per Cent of Emergy Budget | 30.28% | |||
| 17 | REFINERY COST | 1.62 × 10² | GH¢/year | |
| 4.26 × 101 | $/year | |||
| UEV | 3.10 × 10¹³ | sej/$ | [37] | |
| Refinery Emergy | 1.32 × 10¹⁵ | sej | ||
| Per Cent of Emergy Budget | 0.01% | |||
| 18 | OPERATIONAL COST | 4.00 × 10⁵ | GH¢/year | |
| 1.05 × 10⁵ | $/year | |||
| UEV | 3.10 × 10¹³ | sej/$ | [37] | |
| Operation Cost Emergy | 3.26 × 10¹⁸ | sej | ||
| Per Cent of Emergy Budget | 20.14% | |||
References
- Artisanal Gold Council (AGC). The World Artisanal Productions. 2011. Available online: http://artisanalgold.blogspot.co.uk/2011/06/world-artisanal-gold-production.html (accessed on 31 December 2016).
- PwC Analysis. The Direct Economic Impact of Gold. 2013. Available online: https://www.pwc.com/gx/en/mining/publications/assets/pwc-the-direct-economic-impact-of-gold.pdf (accessed on 19 February 2017).
- Hilson, G. The environmental impact of small-scale mining in Ghana: Identifying problems and possible solutions. Geogr. J. 2002, 168, 57–72. [Google Scholar] [CrossRef]
- Hentschel, T.; Hruschka, F.; Priester, M. Global Report on Artisanal and Small-Scale Mining: Challenges and Opportunities; International Institute for Environment and Development (IIED) and WBCSD Publishing: London, UK, 2003. [Google Scholar]
- Hilson, G. Small-scale mining, poverty and economic development in sub-Saharan Africa: An overview. Resour. Policy 2009, 34, 1–5. [Google Scholar] [CrossRef]
- Hilson, G. Small-scale mining and its socio-economic impact in developing countries. Nat. Resour. Forum 2002, 26, 3–13. [Google Scholar] [CrossRef]
- Bansah, K.J.; Yalley, A.B.; Dumakor-Dupey, N. The Hazardous Nature of Small-Scale Underground Mining in Ghana. J. Sustain. Min. 2016. [Google Scholar] [CrossRef]
- World Health Organization (WHO). Recommended Health-Based Limits in Occupational Exposure to Heavy Metals; World Health Organization: Geneva, Switzerland, 1980. [Google Scholar]
- Adimado, A.A.; Baah, D.A. Mercury in human blood, urine, hair, nail, and fish from the Ankobra and Tano River Basins in Southwestern Ghana. Bull. Environ. Contam. Toxicol. 2002, 68, 339–346. [Google Scholar] [CrossRef] [PubMed]
- Kinanya, C.A. Small Scale Mining in West Africa and Environment Security: The Case Study of Tarkwa in Ghana. Master’s Thesis, the University of Ghana, Legon, Ghana, December 2013. Available online: www.ugspace.eg.edu.gh/bitstream/123456789/21264/4/ (accessed on 24 September 2017).
- Nyanor, G. Pollution of Water Bodies: Experts Predict Severe Water Crisis in Ghana by 2025. 2013. Available online: http://edition.myjoyonline.com/pages/news/201303/103466.php (accessed on 15 September 2016).
- Hilson, G. Harvesting mineral riches: 1000 years of gold mining in Ghana. Resour. Policy 2002, 28, 13–26. [Google Scholar] [CrossRef]
- Pyatt, F.B.; Gilmore, G.; Grattan, J.P.; Hunt, C.O.; McLaren, S. An Imperial Legacy? An Exploration of the Environmental Impact of Ancient Metal Mining and Smelting in Southern Jordan. J. Archaeol. Sci. 2000, 27, 771–778. [Google Scholar] [CrossRef]
- Rajaee, M.; Obiri, S.; Green, A.; Long, R.; Cobbina, S.J.; Nartey, V.; Buck, D.; Antwi, E.; Basu, N. Integrated Assessment of Artisanal and Small-Scale Gold Mining in Ghana—Part 2: Natural Sciences Review. Int. J. Environ. Res. Public Health 2015, 12, 8971–9011. [Google Scholar] [CrossRef] [PubMed]
- Al-Hassan, S.; Amoako, R. Environmental and security aspects of contemporary small-scale mining in Ghana. In Proceedings of the 2014 3rd UMaT Biennial International Mining and Mineral Conference, Tarkwa, Ghana, 30 July–2 August 2014; pp. 146–151. [Google Scholar]
- Murphy, A. What Are Environmental Costs?—Part 1. 2010. Available online: http://www.microempowering.org/external-blog/what-are-environmental-costs-part-1 (accessed on 19 August 2017).
- Odum, H.T. Environmental Accounting, Emergy and Decision Making; John Wiley: New York, NY, USA, 1996. [Google Scholar]
- Zhang, J.; Xiao, B.; Du, H.X.; Wang, L.; Ge, B.Z.; Shi, H. Emergy Evaluation of Pollutants Emission in Coal Mine: A Case Study of DaLiuTa Mine in Northern Shaanxi Province, China. Adv. Mater. Res. 2012, 599, 428–433. [Google Scholar] [CrossRef]
- Handy, J.B. Measuring the Sustainability of a Proposed Copper Mine in Arizona: A Temporal Comparison. Master’s Thesis, Oregon State University, Corvallis, OR, USA, June 2015. Available online: http://ir.library.oregonstate.edu/xmlui/bitstream/handle/1957/56357/HandyJohnB2015.pdf?sequence=1 (accessed on 25 July 2016).
- Ingwersen, W.W. Emergy as a Life Cycle Impact Assessment Indicator: A Gold Mining Case Study. J. Ind. Ecol. 2011, 15, 550–567. [Google Scholar] [CrossRef]
- World Bank. Working Together: How Large-Scale Mining Can Engage with Artisanal and Small-Scale Miners; World Bank: Washington, DC, USA, 2008. [Google Scholar]
- Brown, M.T.; Ulgiati, S. Emergy analysis and environmental accounting. Encycl. Energy 2004, 2, 329–354. [Google Scholar]
- Hu, Q.H.; Zhang, L.X.; Wang, C.B. Emergy-based analysis of two chicken farming systems: A perception of the organic production model in China. The 18th Biennial Conference of International Society for Ecological Modelling. Procedia Environ. Sci. 2012, 13, 445–454. [Google Scholar] [CrossRef][Green Version]
- Pang, M.; Zhang, L.; Ulgiati, S.; Wang, C. Ecological impacts of small hydropower in China: Insights from an emergy analysis of a case plant. Energy Policy 2015, 76, 112–122. [Google Scholar] [CrossRef]
- Cavalett, O.; de Queiroz, J.F.; Ortega, E. Emergy Assessment of Integrated Production Systems of Grains, Pig and Fish in Small Farms in the South Brazil, Ecological Modelling. Available online: https://doi.org/10.1016/j.ecolmodel.2005.07.023 (accessed on 26 October 2017).
- Zhang, L.X.; Ulgiati, S.; Yang, Z.F.; Chen, B. Emergy evaluation and economic analysis of three wetland fish farming systems in Nansi Lake area, China. J. Environ. Manag. 2011, 92, 683–694. [Google Scholar] [CrossRef] [PubMed]
- Pang, M.; Zhang, L.; Wang, C.; Liu, G. Emergy Analysis of a Biomass Direct-fired Power Plant in Inner Mongolia of China. J. Environ. Account. Manag. 2013, 1, 321–331. [Google Scholar] [CrossRef]
- Brown, M.T.; Ulgiati, S. Emergy-based indices and ratios to evaluate sustainability: Monitoring economies and technology toward environmentally sound innovation. Ecol. Eng. 1997, 9, 51–69. [Google Scholar] [CrossRef]
- Liu, G.; Yang, Z.; Chen, B. Emergy-based ecological economic evaluation of Beijing urban ecosystem. Procedia Environ. Sci. 2011, 5, 18–24. [Google Scholar] [CrossRef]
- Odum, H.T.; Brown, M.T.; Brandt-Williams, S. Handbook of Emergy Evaluation, Folio #1; Center for Environmental Policy, Environmental Engineering Sciences, University of Florida: Gainesville, FL, USA, 2000; Available online: https://cep.ees.ufl.edu/emergy/documents/folios/Folio_02.pdf (accessed on 5 January 2017).
- De Wilbiss, C.; Brown, M.T.; Ma, C.; Ingwersen, W. Emergy Research for supply chain. J. Environ. Account. Manag. 2015, 3, 308–338. [Google Scholar]
- Bastianoni, S.; Campbell, D.E.; Ridolfi, R.; Pulselli, F.M. The solar transformity of petroleum fuels. Ecol. Model. 2009, 220, 40–50. [Google Scholar] [CrossRef]
- Brown, M.T.; Bardi, E. Folio #3: Emergy of Ecosystems. Handbook of Emergy Evaluation: A Compendium of Data for Emergy Computation Issued in a Series of Folios; Center for Environmental Policy, Environmental Engineering Sciences, University of Florida: Gainesville, FL, USA, 2001. [Google Scholar]
- Ascione, M.; Campanella, L.; Cherubini, F.; Ulgiati, S. Environmental driving forces of urban growth and development: An emergy-based assessment of the city of Rome, Italy. Landsc. Urban Plan 2009, 93, 238–249. [Google Scholar] [CrossRef]
- Cohen, M.J.; Sweeney, S.; Brown, M.T. Chapter 16. Computing the Unit Emergy Value of Crustal Elements. In EMERGY SYNTHESIS 4: Theory and Applications of the Emergy Methodology. Proceedings from the Fourth Biennial Emergy Conference; University of Florida: Gainesville, FL, USA, 2007; pp. 1–18. Available online: https://cep.ees.ufl.edu/emergy/documents/conferences/ERC04_2006/ERC04_2006_Chapter_16.pdf (accessed on 15 June 2017).
- NEAD. Emergy by Country; Ghana—2000. Available online: http://www.cep.ees.ufl.edu/nead/data.php?country=58&year=58 (accessed on 9 July 2016).
- Ulgiati, S.; Brown, M.T. Monitoring patterns of sustainability in natural and manmade ecosystems. Ecol. Model. 1998, 108, 23–36. [Google Scholar] [CrossRef]
- Lefroy, E.; Rydberg, T. Emergy evaluation of three cropping systems in southwestern Australia. Ecol. Model. 2003, 161, 195–211. [Google Scholar] [CrossRef]
- Agostinho, F.; Diniz, G.; Siche, R.; Ortega, E. The use of emergy assessment and the Geographical Information System in the diagnosis of small family farms in Brazil. Ecol. Model. 2008, 210, 37–57. [Google Scholar] [CrossRef]
- Dong, X.; Brown, M.T.; Pfahler, D.; Ingwersen, W.W.; Kang, M.; Jin, Y.; Ulgiati, S. Carbon modeling and emergy evaluation of grassland management schemes in Inner Mongolia. Agric. Ecosyst. Environ. 2012, 158, 49–57. [Google Scholar] [CrossRef]
- Schueler, V.; Kuemmerle, T.; Schröder, H. Impacts of Surface Gold Mining on Land Use Systems in Western Ghana. AMBIO 2011, 40, 528–539. [Google Scholar] [CrossRef] [PubMed]
- PMBull, Historical Gold Prices: December 2015. Available online: http://www.pmbull.com/gold-price/december-2015/ (accessed on 4 November 2016).
- World Currency Exchange Rates and Currency Exchange Rates History, Ghanaian Cedi (GHS) per US Dollar (USD). Available online: https://www.exchange-rates.org/history/GHS/USD/T (accessed on 4 November 2016).


| Case Name | Type | Scale | Capacity (g/Year) | No. of Workers | Area Exploited |
|---|---|---|---|---|---|
| AMASS Ltd. | Alluvial (“dig and wash”) | Small-scale | 6.00 × 10³ | 100 | 50 acres |
| JYK Co., Ltd. | Underground (“ghetto” mine) | Small-scale | 5.20 × 10⁴ | 1285 | 25 acres |
| Items | Expression | Description |
|---|---|---|
| Renewable Natural Resources | R | Includes river water, the sun, wind, etc. |
| Non-Renewable Natural Resources | N | Includes soil, rock mineral, etc. |
| Feedback from Economy | F | The economic resource inputs. |
| Purchased Renewable Resources | FR | The portion of the economic resources inputs that are from renewable sources. |
| Purchased Non-Renewable Resources | FN | The portion of the economic resource inputs that are of non-renewable origin. |
| Total Emergy Used | U = R + N + F | The total emergy used to support the whole production system. |
| System Yield | Y | The total gold (grams) produced. |
| Unit Emergy Value | UEV = U/Y | The ratio of the total invested emergy to the yield of the system. A lower UEV implies higher efficiency [24]. |
| Per Cent Renewable | %R = (R + FR)/U | The ratio of the renewable inputs divided by the total emergy of the system. The higher the %R, the more likely the system will survive against the economic stress and the more sustainable the system. The opposite is also true. |
| Emergy Yield Ratio | EYR = U/F | The ratio of total emergy used divided by the emergy inputs from the economy. Higher EYR implies lesser use of external inputs and dependence on local resources [25,26,27]. |
| Emergy Exchange Ratio | EER = [($income) × (sej/$)world]/U | The EER is the ratio of emergy embodied in the money received to the emergy embodied in the products sold to the market. When EER < 1, it indicates the emergy in the money received is less than the emergy in the products. |
| Environmental Loading Ratio | ELR = (N + FN)/(R + FR) | The ratio of non-renewable emergy to the renewable inputs. Systems with higher ELR depend on indirect resources compared to a fully natural system that depends on local renewable resources [28]. |
| Emergy Sustainability Index | ESI = EYR/ELR | ESI is the composite ratio of the emergy yield ratio to the environmental loading ratio, indicating the process trade-off between the emergy advantage provided by the process and its environmental pressure. Systems with an ESI lower than 1 is less resource-depleting and high environmental stress. 1 < ESI < 10 implies that the system has good economic viability and good sustainability. ESI > 10 implies the system is undeveloped [29]. |
| Item | Em-Flow Φ (Sej/Year) | UEV (Sej/Unit) | Ref. | ||
|---|---|---|---|---|---|
| “U” System | “A” System | ||||
| Renewable Resource Inputs (R) | |||||
| 1 | Sun | 7 × 10¹⁴ | 1.06 × 10¹⁵ | 1.00 | [30] |
| 2 | Wind | 1.07 × 10¹⁴ | 2.45 × 10³ | [30] | |
| 3 | Rain | 3.26 × 10¹⁶ | 4.93 × 10¹⁶ | 3.10 × 10⁴ | [30] |
| 4 | River water | 5.73 × 10¹⁶ | 1.26 × 10¹¹ | [31] | |
| 5 | Wood | 1.26 × 10¹⁸ | 3.50 × 10⁹ | [30] | |
| Subtotal (R) | 1.26 × 10¹⁸ | 5.73 × 10¹⁶ | |||
| Non-renewable Resource (N) | |||||
| 6 | Charcoal | 6.82 × 10¹⁵ | 1.78 × 10⁵ | [17] | |
| 7 | Soil loss | 6.97 × 10¹⁷ | 1.24 × 10⁴ | [17] | |
| 8 | Groundwater | 1.12 × 10¹⁷ | 6.23 × 10¹¹ | [31] | |
| 9 | Mineral oxide | 2.53 × 10¹⁸ | 1.73 × 10⁶ | [31] | |
| Subtotal (N) | 2.64 × 10¹⁸ | 6.97 × 10¹⁷ | |||
| Purchased Resources (F) | |||||
| 10 | Fuel ‡ | 5.39 × 10¹⁷ | 1.56 × 10¹⁵ | 3.85 × 10⁴ | [32] |
| 11 | Electricity ‡ | 5.24 × 10¹⁴ | 2.92 × 10⁵ | [17] | |
| 12 | Machinery ‡ | 2.32 × 10¹⁶ | 9.23 × 10¹⁴ | 1.79 × 10¹⁰ | [30] |
| 13 | Explosives ‡ | 4.19 × 10¹³ | 4.19 × 10⁹ | [33] | |
| 14 | Blanket ‡ | 2.01 × 10¹⁶ | 3.02 × 10¹⁶ | 1.34 × 10¹¹ | [34] |
| 15 | Mercury ‡ | 2.56 × 10¹⁷ | 4.20 × 10¹⁶ | 4.20 × 10¹³ | [35] |
| 16 | Labour * | 3.29 × 10¹⁸ | 3.91 × 10¹⁷ | 3.10 × 10¹³ | [36] |
| 17 | Wood * | 5.67 × 10¹⁶ | 1.61 × 10¹⁶ | 3.10 × 10¹³ | [36] |
| 18 | Machine rentals and M ‡ | 4.90 × 10¹⁸ | 8.72 × 10¹⁷ | 3.10 × 10¹³ | [36] |
| 19 | Refinery cost ‡ | 1.32 × 10¹⁵ | 9.70 × 10¹⁴ | 3.10 × 10¹³ | [36] |
| 20 | Operational cost ‡ | 3.26 × 10¹⁸ | 3.56 × 10¹⁷ | 3.10 × 10¹³ | [36] |
| Purchased Renewable Resources(FR) | 3.35 × 10¹⁸ | 4.07 × 10¹⁷ | |||
| Purchased Renewable Resources (FN) | 8.99 × 10¹⁸ | 1.31 × 10¹⁸ | |||
| Subtotal (F) | 1.23 × 10¹⁹ | 1.71 × 10¹⁸ | |||
| Total Emergy Used (U) | 1.62 × 10¹⁹ | 2.47 × 10¹⁸ | |||
| Indices | Unit | Cases | ||
|---|---|---|---|---|
| Alluvial System | Underground System | Peruvian Mine | ||
| Emergy used (U) | sej | 2.47 × 10¹⁸ | 1.62 × 10¹⁹ | 1.41 × 10²¹ * |
| Yield (Y) | g | 6.00 × 10³ | 5.20 × 10⁴ | 9.40 × 10⁷ ** |
| Market Value | USD | 2.27 × 10⁵ | 1.97 × 10⁶ | 1.19 × 10⁹ * |
| Emergy Received | sej/USD | 6.14 × 10¹⁷ | 5.32 × 10¹⁸ | 3.22 × 10²¹ * |
| UEV | sej/g | 4.11 × 10¹⁴ | 3.12 × 10¹⁴ | 1.50 × 10¹³ ** |
| %R | % | 18.8 | 28.4 | 35.0 ** |
| EYR | 1.44 | 1.32 | - | |
| ELR | 4.31 | 2.53 | - | |
| ESI | 0.33 | 0.52 | - | |
| EER | 0.23 | 0.33 | 2.28 ** | |
© 2017 by the authors. Licensee MDPI, Basel, Switzerland. This article is an open access article distributed under the terms and conditions of the Creative Commons Attribution (CC BY) license (http://creativecommons.org/licenses/by/4.0/).
Share and Cite
Asamoah, E.F.; Zhang, L.; Liang, S.; Pang, M.; Tang, S. Emergy Perspectives on the Environmental Performance and Sustainability of Small-Scale Gold Production Systems in Ghana. Sustainability 2017, 9, 2034. https://doi.org/10.3390/su9112034
Asamoah EF, Zhang L, Liang S, Pang M, Tang S. Emergy Perspectives on the Environmental Performance and Sustainability of Small-Scale Gold Production Systems in Ghana. Sustainability. 2017; 9(11):2034. https://doi.org/10.3390/su9112034
Chicago/Turabian StyleAsamoah, Ernest Frimpong, Lixiao Zhang, Sai Liang, Mingyue Pang, and Shoujuan Tang. 2017. "Emergy Perspectives on the Environmental Performance and Sustainability of Small-Scale Gold Production Systems in Ghana" Sustainability 9, no. 11: 2034. https://doi.org/10.3390/su9112034
APA StyleAsamoah, E. F., Zhang, L., Liang, S., Pang, M., & Tang, S. (2017). Emergy Perspectives on the Environmental Performance and Sustainability of Small-Scale Gold Production Systems in Ghana. Sustainability, 9(11), 2034. https://doi.org/10.3390/su9112034