1. Introduction
The objective of increasing agricultural incomes in developing countries ranks high on the political agenda. In part, the crisis over the last few years in prices in world food markets has led to renewed attention to agricultural policies [
1]. Different rates of poverty reduction are closely related to differences in agricultural performance, particularly as regards the rate of growth of agricultural productivity [
2].
In the case of sub-Saharan Africa (SSA), the majority of the population lives in rural areas with higher levels of poverty than in urban areas, and where almost all rural households depend directly or indirectly on agriculture. As a major contributor to the economy in general, agriculture is a key sector in the development of countries south of the Sahara (see [
3,
4]).
Traditionally, the study of the role of agriculture in economic development and the reduction of poverty has attracted the attention of economists, generating an enormous number of theoretical and empirical studies, with special attention to the case of SSA [
5,
6,
7,
8]. Much of this literature focuses on the process of structural transformation of economies, both for developing countries, where economic activity relies heavily on agriculture, and high-income countries, where industry and services dominate [
5].
Thus, several authors [
3,
9,
10] suggest that agricultural growth is more pro-poor than industrial growth, basically because it allows for greater participation of the poor in the growth process. Moreover, although some African countries have potential sources of growth outside of agriculture, growth in industrial sectors is, at least in the short- to medium-term, unlikely to be substantial in many countries [
3].
Agriculture is the main driving force of a rural economy, so there is a need to increase and diversify production of farmers and promote sustainable rural development: “The interventions of the past half century have also shown that agriculture can be a key driver of growth and development for many of the poorest countries in the world” [
11]
. This development requires the promotion of agricultural policies that improve the incomes of the poor and the sources from which they draw their sustenance, namely the agricultural sector and employment in non-agricultural rural activities.
Taking Cape Verde as an example, the agricultural sector, excluding agribusiness, represents more than 20% of regional gross national product (GNP) for the Economic Community of West African States (ECOWAS) countries, employing 44% of its population [
12], and the incidence of poverty is twice as high in rural areas as in urban areas [
13].
This reality has made various governments of Cape Verde consider that the fight against poverty and the development of agriculture is a priority in its programs and policies (National Development Plans from 1980 to 2002 and Strategic Plan for the Development of Agriculture (PEDA in Portuguese)) (2004–2015). The total expenditure on agricultural policies has stayed steady during the period 2006–2013 (available period), around 6% of the total Cape Verde national budget in all years except 2011, in which it was 11% (see
Table 1). Thus, for example, the agricultural policy of the last planning period (2004–2015) focused on organization of rural areas in general and water basin management in particular, as an opportunity to exploit the potential of the agricultural sector to achieve a reduction in poverty [
14]. However, despite the development of these policies and their links with poverty reduction programs, they have not been subject to the required assessments to determine to what extent they have contributed to the reduction or not of poverty in rural areas. This is particularly relevant, as poverty rates remain high in rural areas.
Boirivant [
15] states that to combat rural poverty through the agricultural sector “actions should be harmonized and implemented to effectively achieve social equity in the field through agriculture. The State should promote such actions always aimed at a fair distribution of wealth, only then can rural poverty end”.
According to this author, investment should be aimed at five major domains to achieve this goal:
- (1)
Strengthening institutions to regulate the food market and agricultural inputs, as well as to promote macroeconomic policies and favourable trade policies that incentivize farmers to adopt new and sustainable technologies.
- (2)
Implementing measures to ensure the improvement of living conditions of rural populations (i.e., education, health, housing etc.).
- (3)
Creating the conditions to allow diversification of production towards high-value crops, which will increase incomes and reduce poverty of households living from agriculture.
- (4)
Making water available for irrigation, building roads and bridges to transport the output and input at all times.
- (5)
Encouraging banks to provide credit at preferential rates and terms, crop insurance at low cost to small farmers and technical advice to assist in and promote local farmers’ organizations and rural development.
In this sense, the objective of this research is to determine the effects of agricultural policies implemented with the aim of reducing poverty in water basins located in rural areas. The study focuses on an in-depth analysis of five areas: (a) living conditions; (b) infrastructure; (c) water availability; (d) diversification of production and (e) farmer/community organization and participation.
To do this, two aspects will be analyzed: firstly, whether there has been a reduction in poverty in the basins analyzed for the period 2006–2013; and secondly, whether that poverty reduction, in the event that it has occurred, has been due to the agricultural policies applied.
This paper is structured in the following manner. In the second section, the water basins and agricultural policies are described, subsequently, in the third section the proposed methodology is discussed. The results section shows, through qualitative and quantitative indicators, whether poverty has been reduced in these basins for the period 2006–2014. The fifth section examines whether that poverty reduction was due to the agricultural policies implemented. Finally, some reflections on the methodology and effectiveness of agricultural policy in reducing poverty as well as a series of recommendations for future reviews of agricultural planning are presented.
2. Case Study
Cape Verde is located in the Atlantic Ocean about 550 km off the West African coast with 10 islands of which 9 are inhabited and an area of 4033 km
2. It has a population of 521,000 inhabitants according to the 2015 census [
16]. Since its independence in 1975, it has made a significant socio-economic progress; Cape Verde was the second country after Botswana to leave the group of least developed countries. Until 2008 the country was classified as “least developed country” due to its low income, a lack of human resources and an economic vulnerability, due to the instability of agricultural production and low levels of goods and services exports.
Due to its island status, the country is more economically, socially and environmentally vulnerable, so that their development is greatly compromised. Its physical and geographical isolation accentuates the regional imbalance between the islands and its inability to withstand external shocks, increasing their susceptibility to natural disasters caused by climate change. Fluctuations in agricultural production are large and unpredictable and constitute an enormous risk for rural populations. Agricultural production depends on 10% of the surface or country, since only 40,000 hectares have agricultural vocation. Together with the insufficient farming area, there is instability in production, which is related to the rainfall regime, both in volume and in its distribution in time and space altogether. Thus, the production did not cover more than 40% of the needs for cereals in the food area. Under these conditions the agricultural production devoted to food is constantly in deficit; 80% of the food needed is imported.
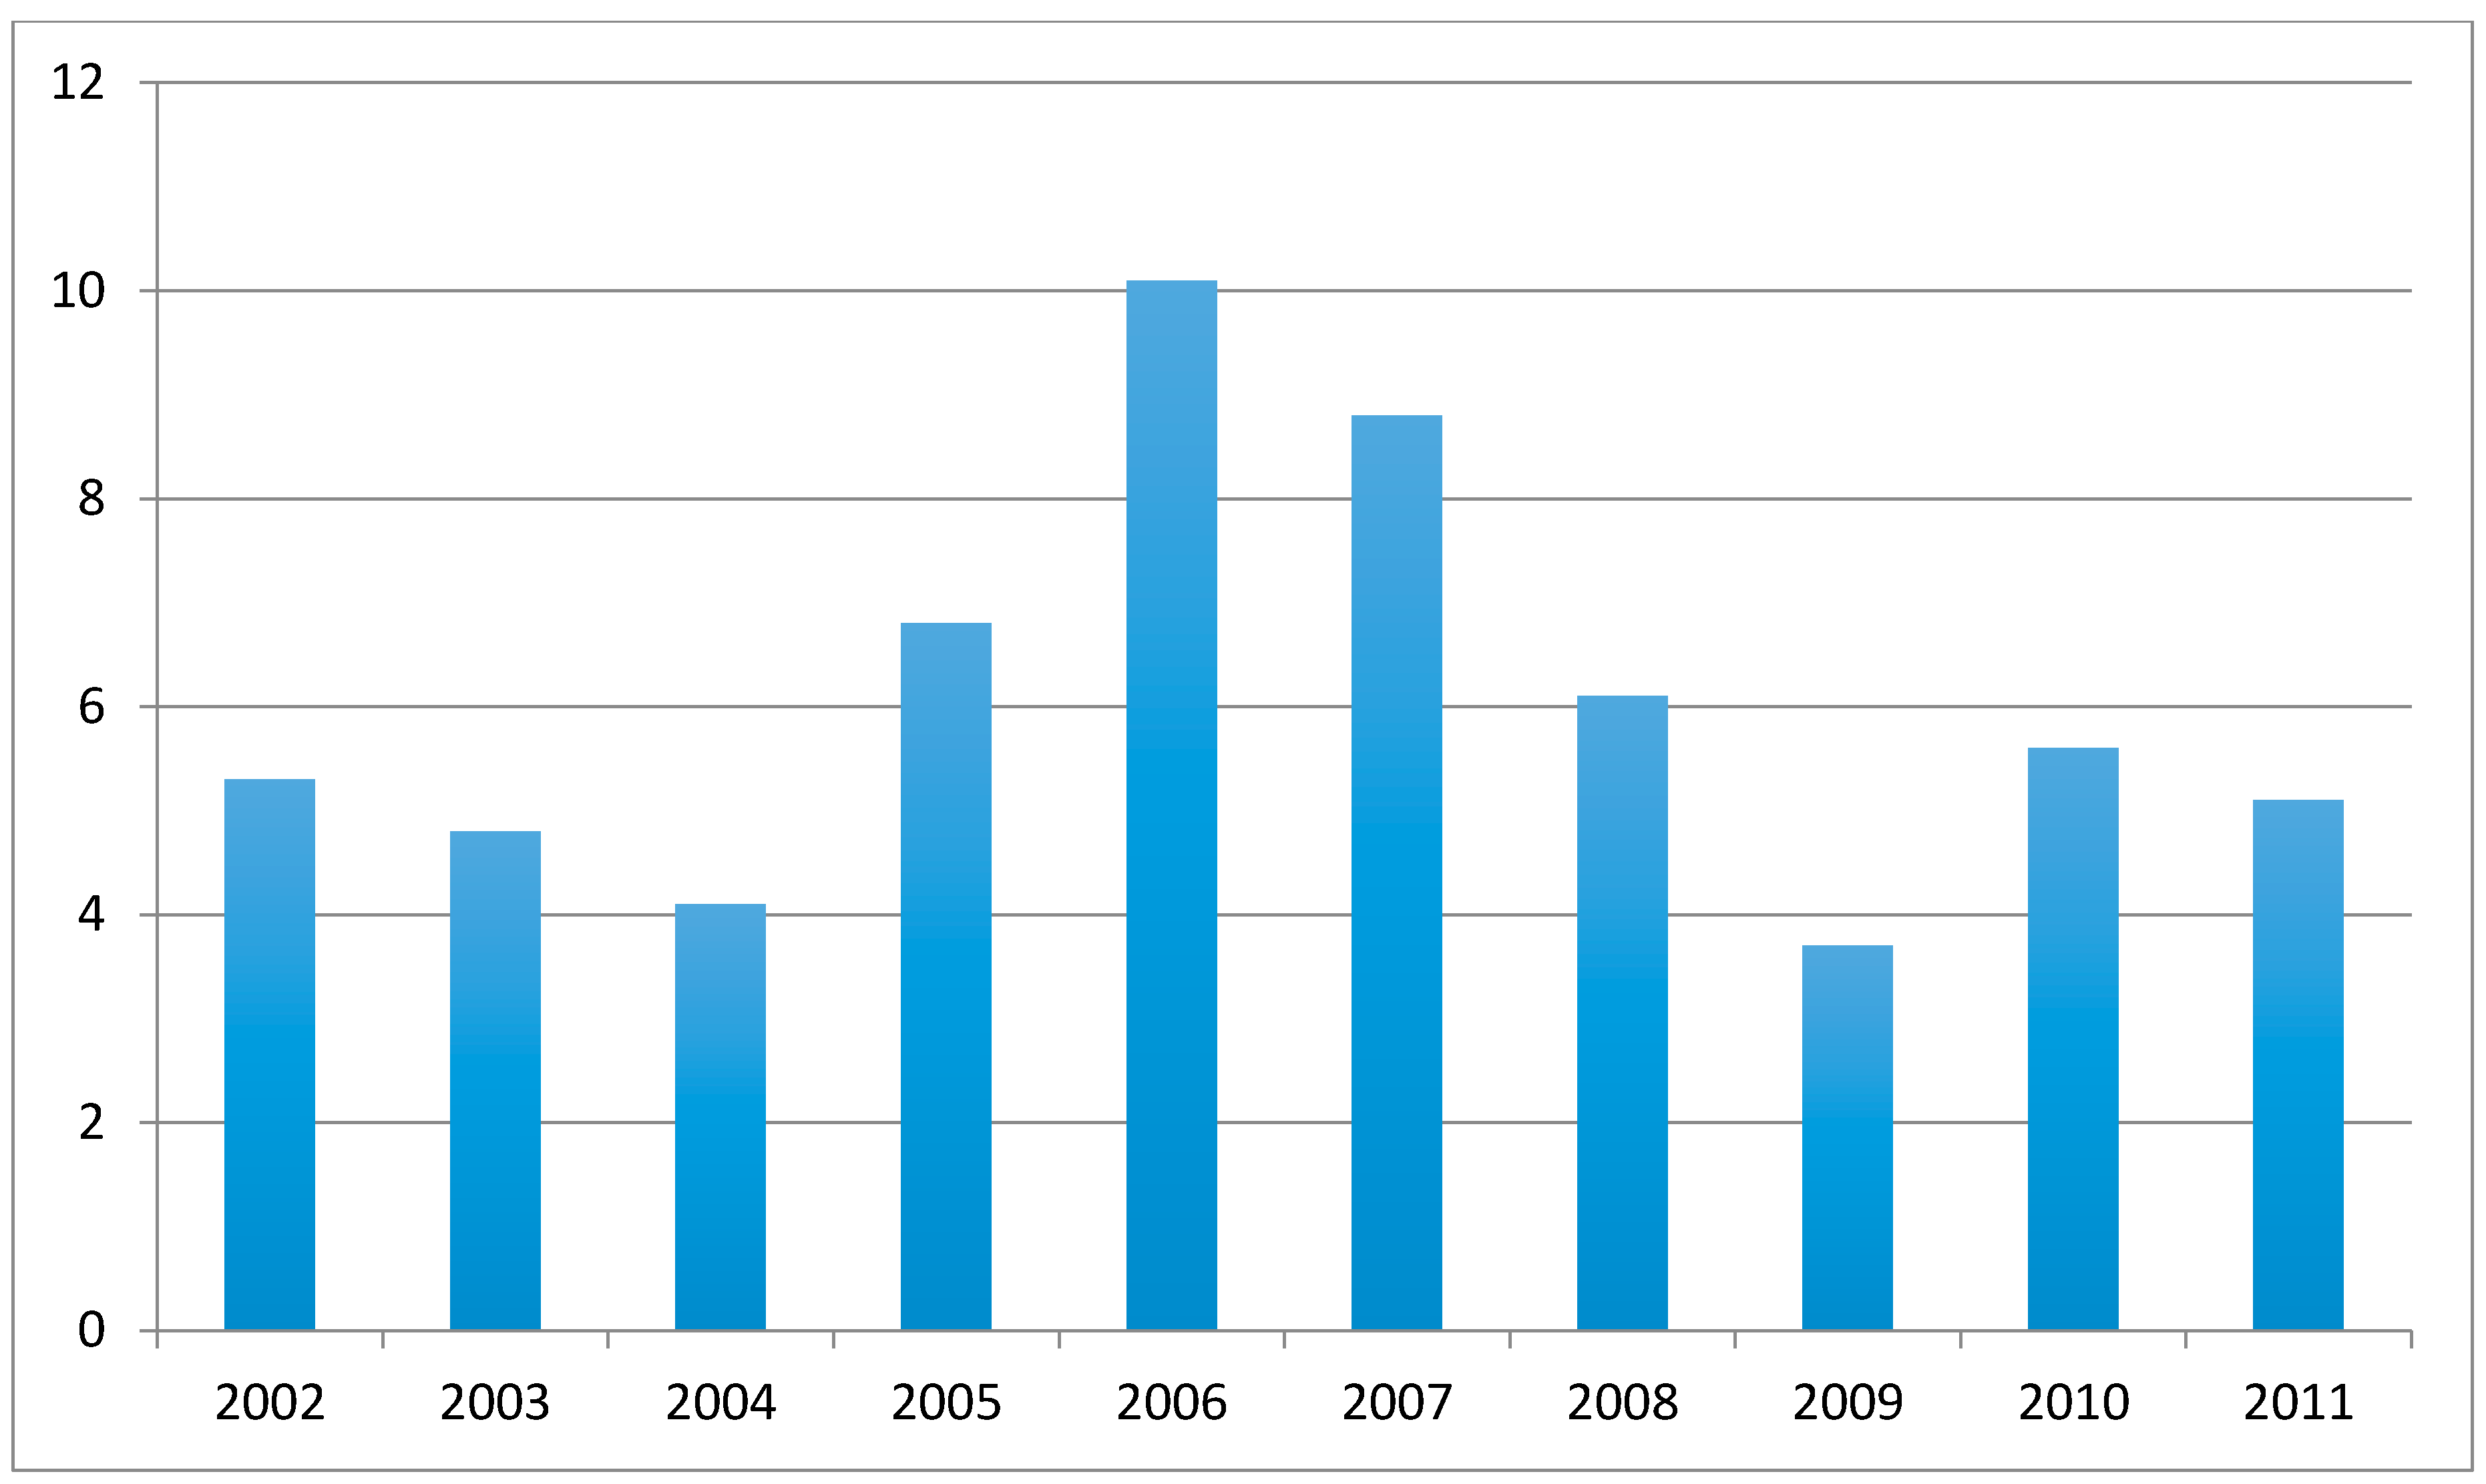
According to the latest official statistics, the country’s economy has achieved significant advances between 2002 and 2011, despite national weaknesses and vulnerabilities. Cape Verde has made great progress in improving their health and education standards and other aspects of human development. In 2013, the country’s score for the Human Development Index of the United Nations (UN HDI) was 0.636, up from 0.573 in relation to 2000. As shown in
Figure 1, the gross domestic product (GDP) doubled in nominal value between 2002 and 2010, this represented an average growth of more than 5% (growing from USD 620 million in 2002 to USD 1.648 million in 2010) [
17]. However, due to the effects of the international crisis, this growth has slowed considerably in recent years [
18].
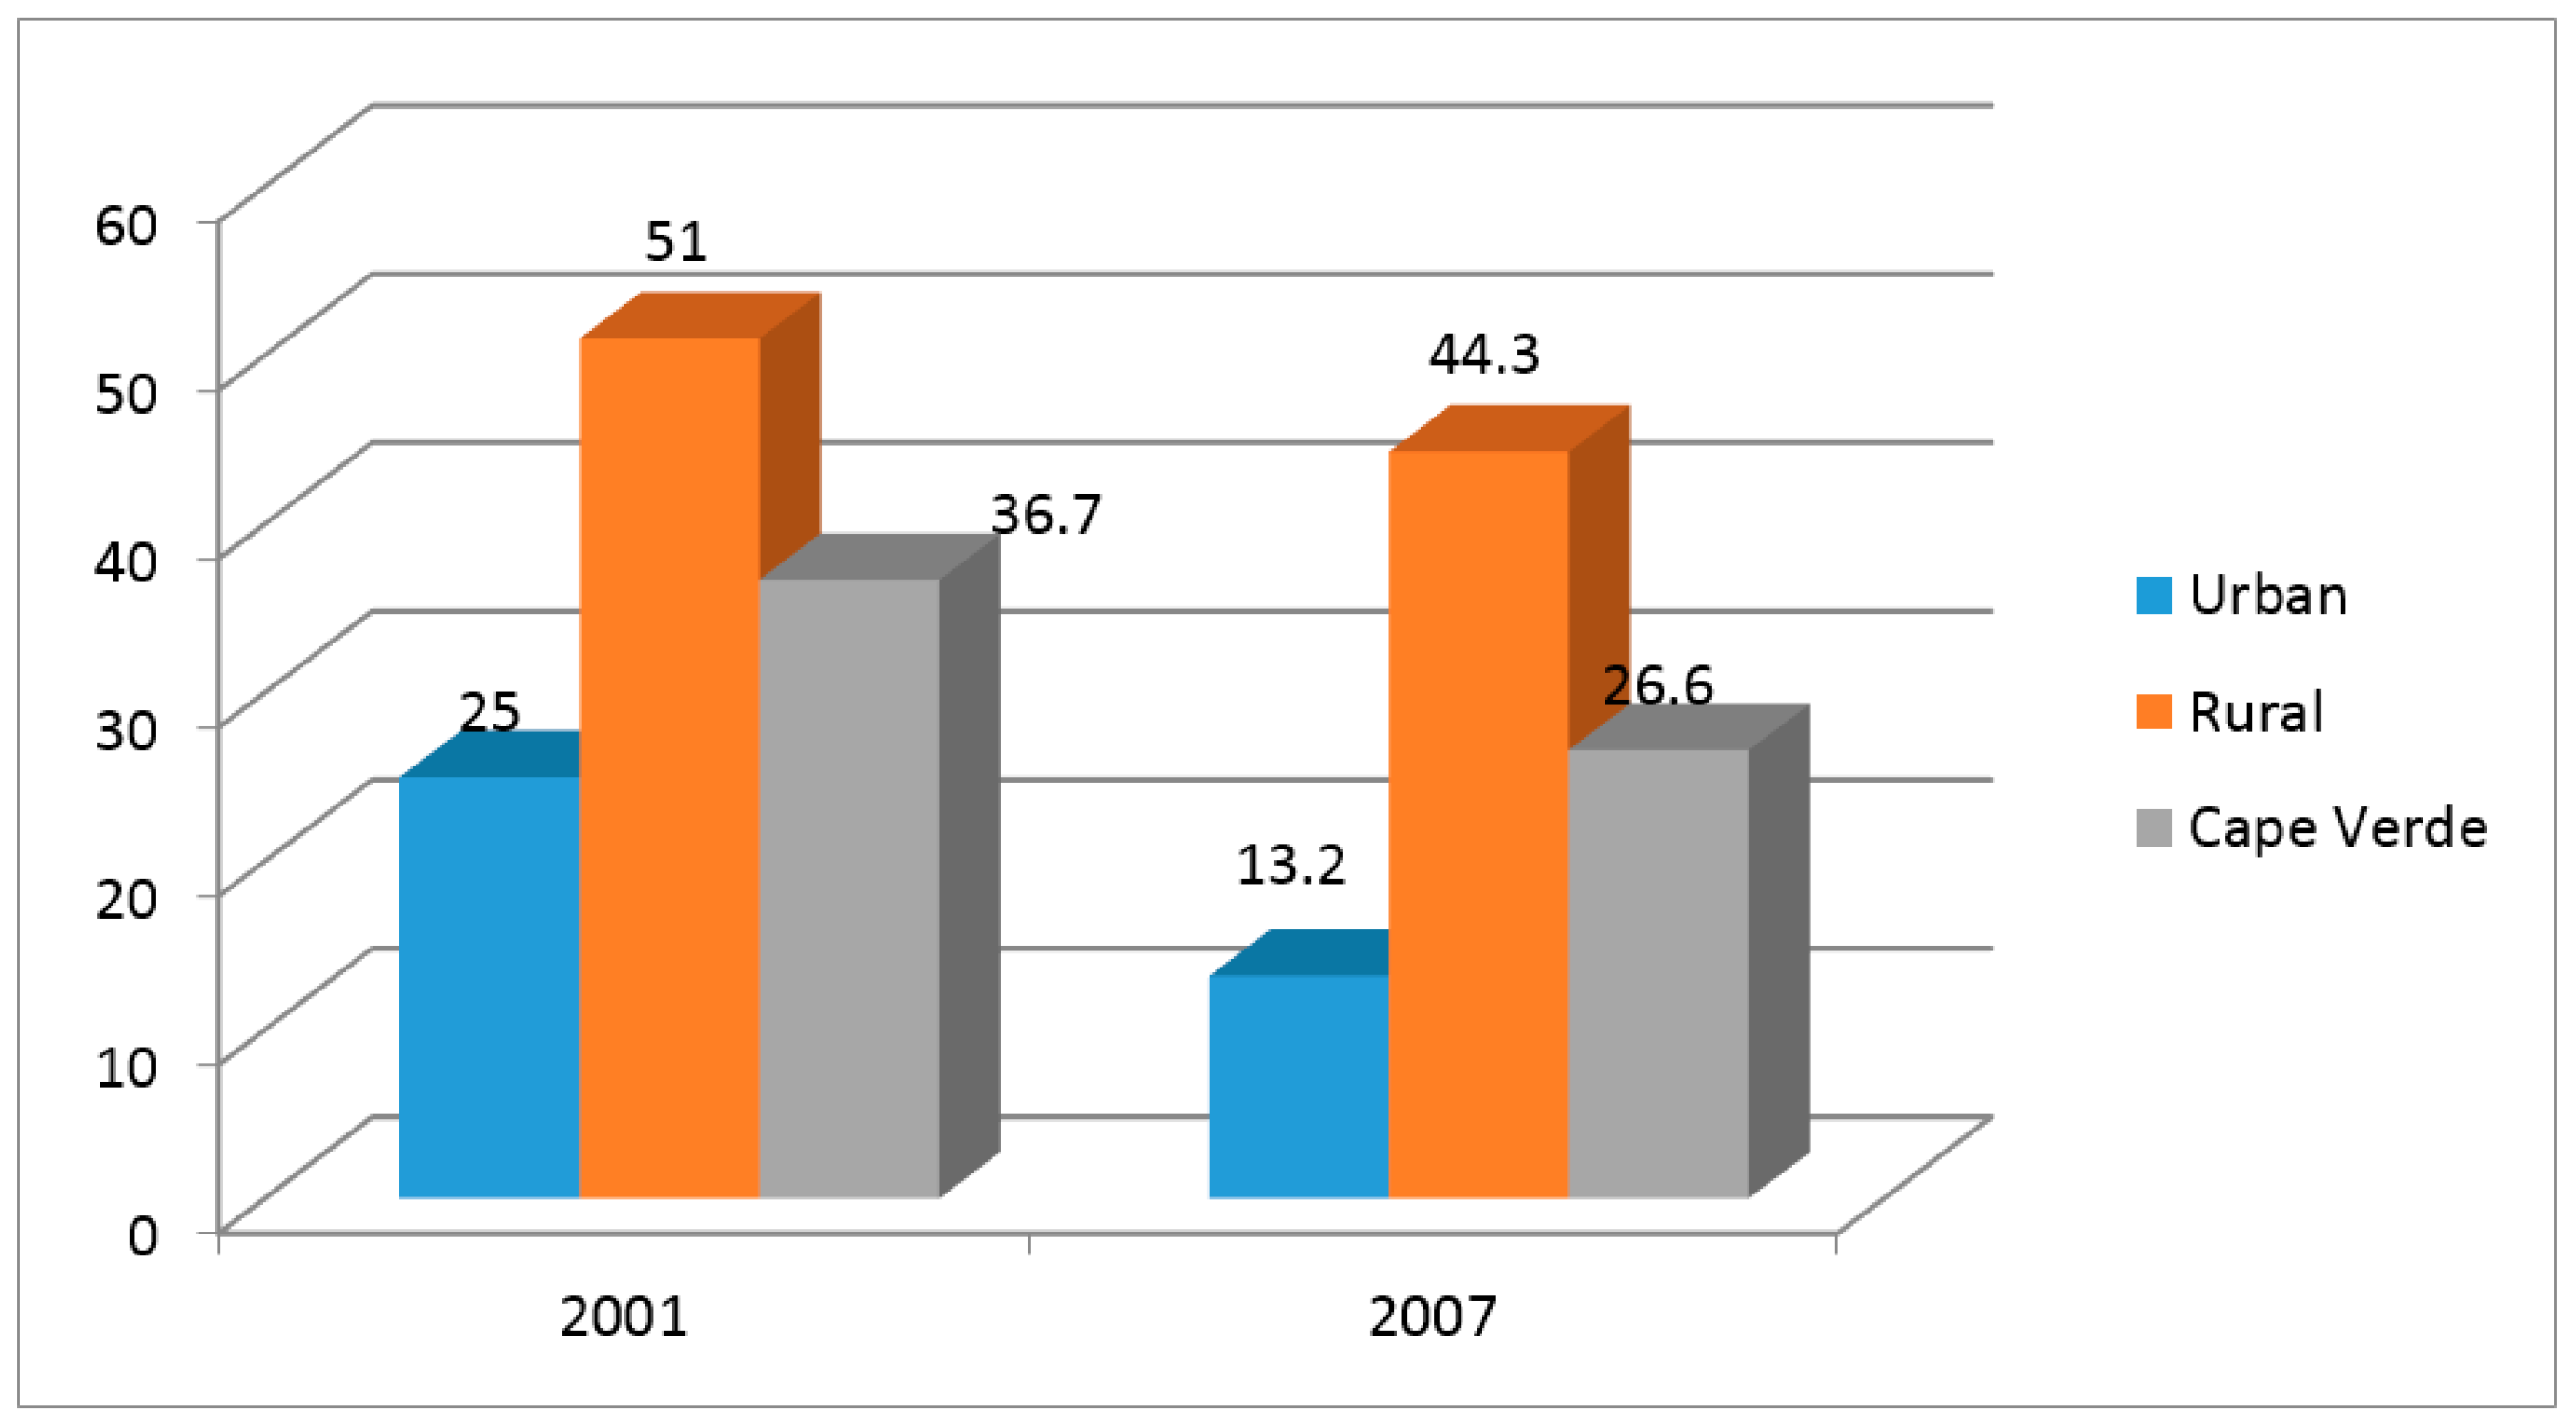
Cape Verde’s economic growth has been accompanied by poverty reduction of 37% in 2001 and 26.6% in 2007, as can be seen in
Figure 2. However, this reduction has not been the same in urban and rural areas: 62% of those residing in rural areas [
20], producing a greater decrease in the former, which also started from lower levels of poverty. The Gini index for Cape Verde is 43.8, which shows high inequality and income concentration in Cape Verde [
21]. Poverty is mainly concentrated in rural areas, and much of urban poverty is a consequence of deprivation and economic decline in rural areas [
19].
The main social differentiation between farmers depends on whether the agriculture is practised on dry land or irrigated land. Family farms occupy 44,358 hectares (ha) of which 90.8% (40,295 ha) are operated under rainfed conditions, 7.8% (3476 ha) under irrigation and 1.3% (588.4 ha) in a mixed regime. Rainfed cultivation is unprofitable and it is directed to consumption. Women are primarily responsible for this type of cultivation as they are those more touched by poverty.
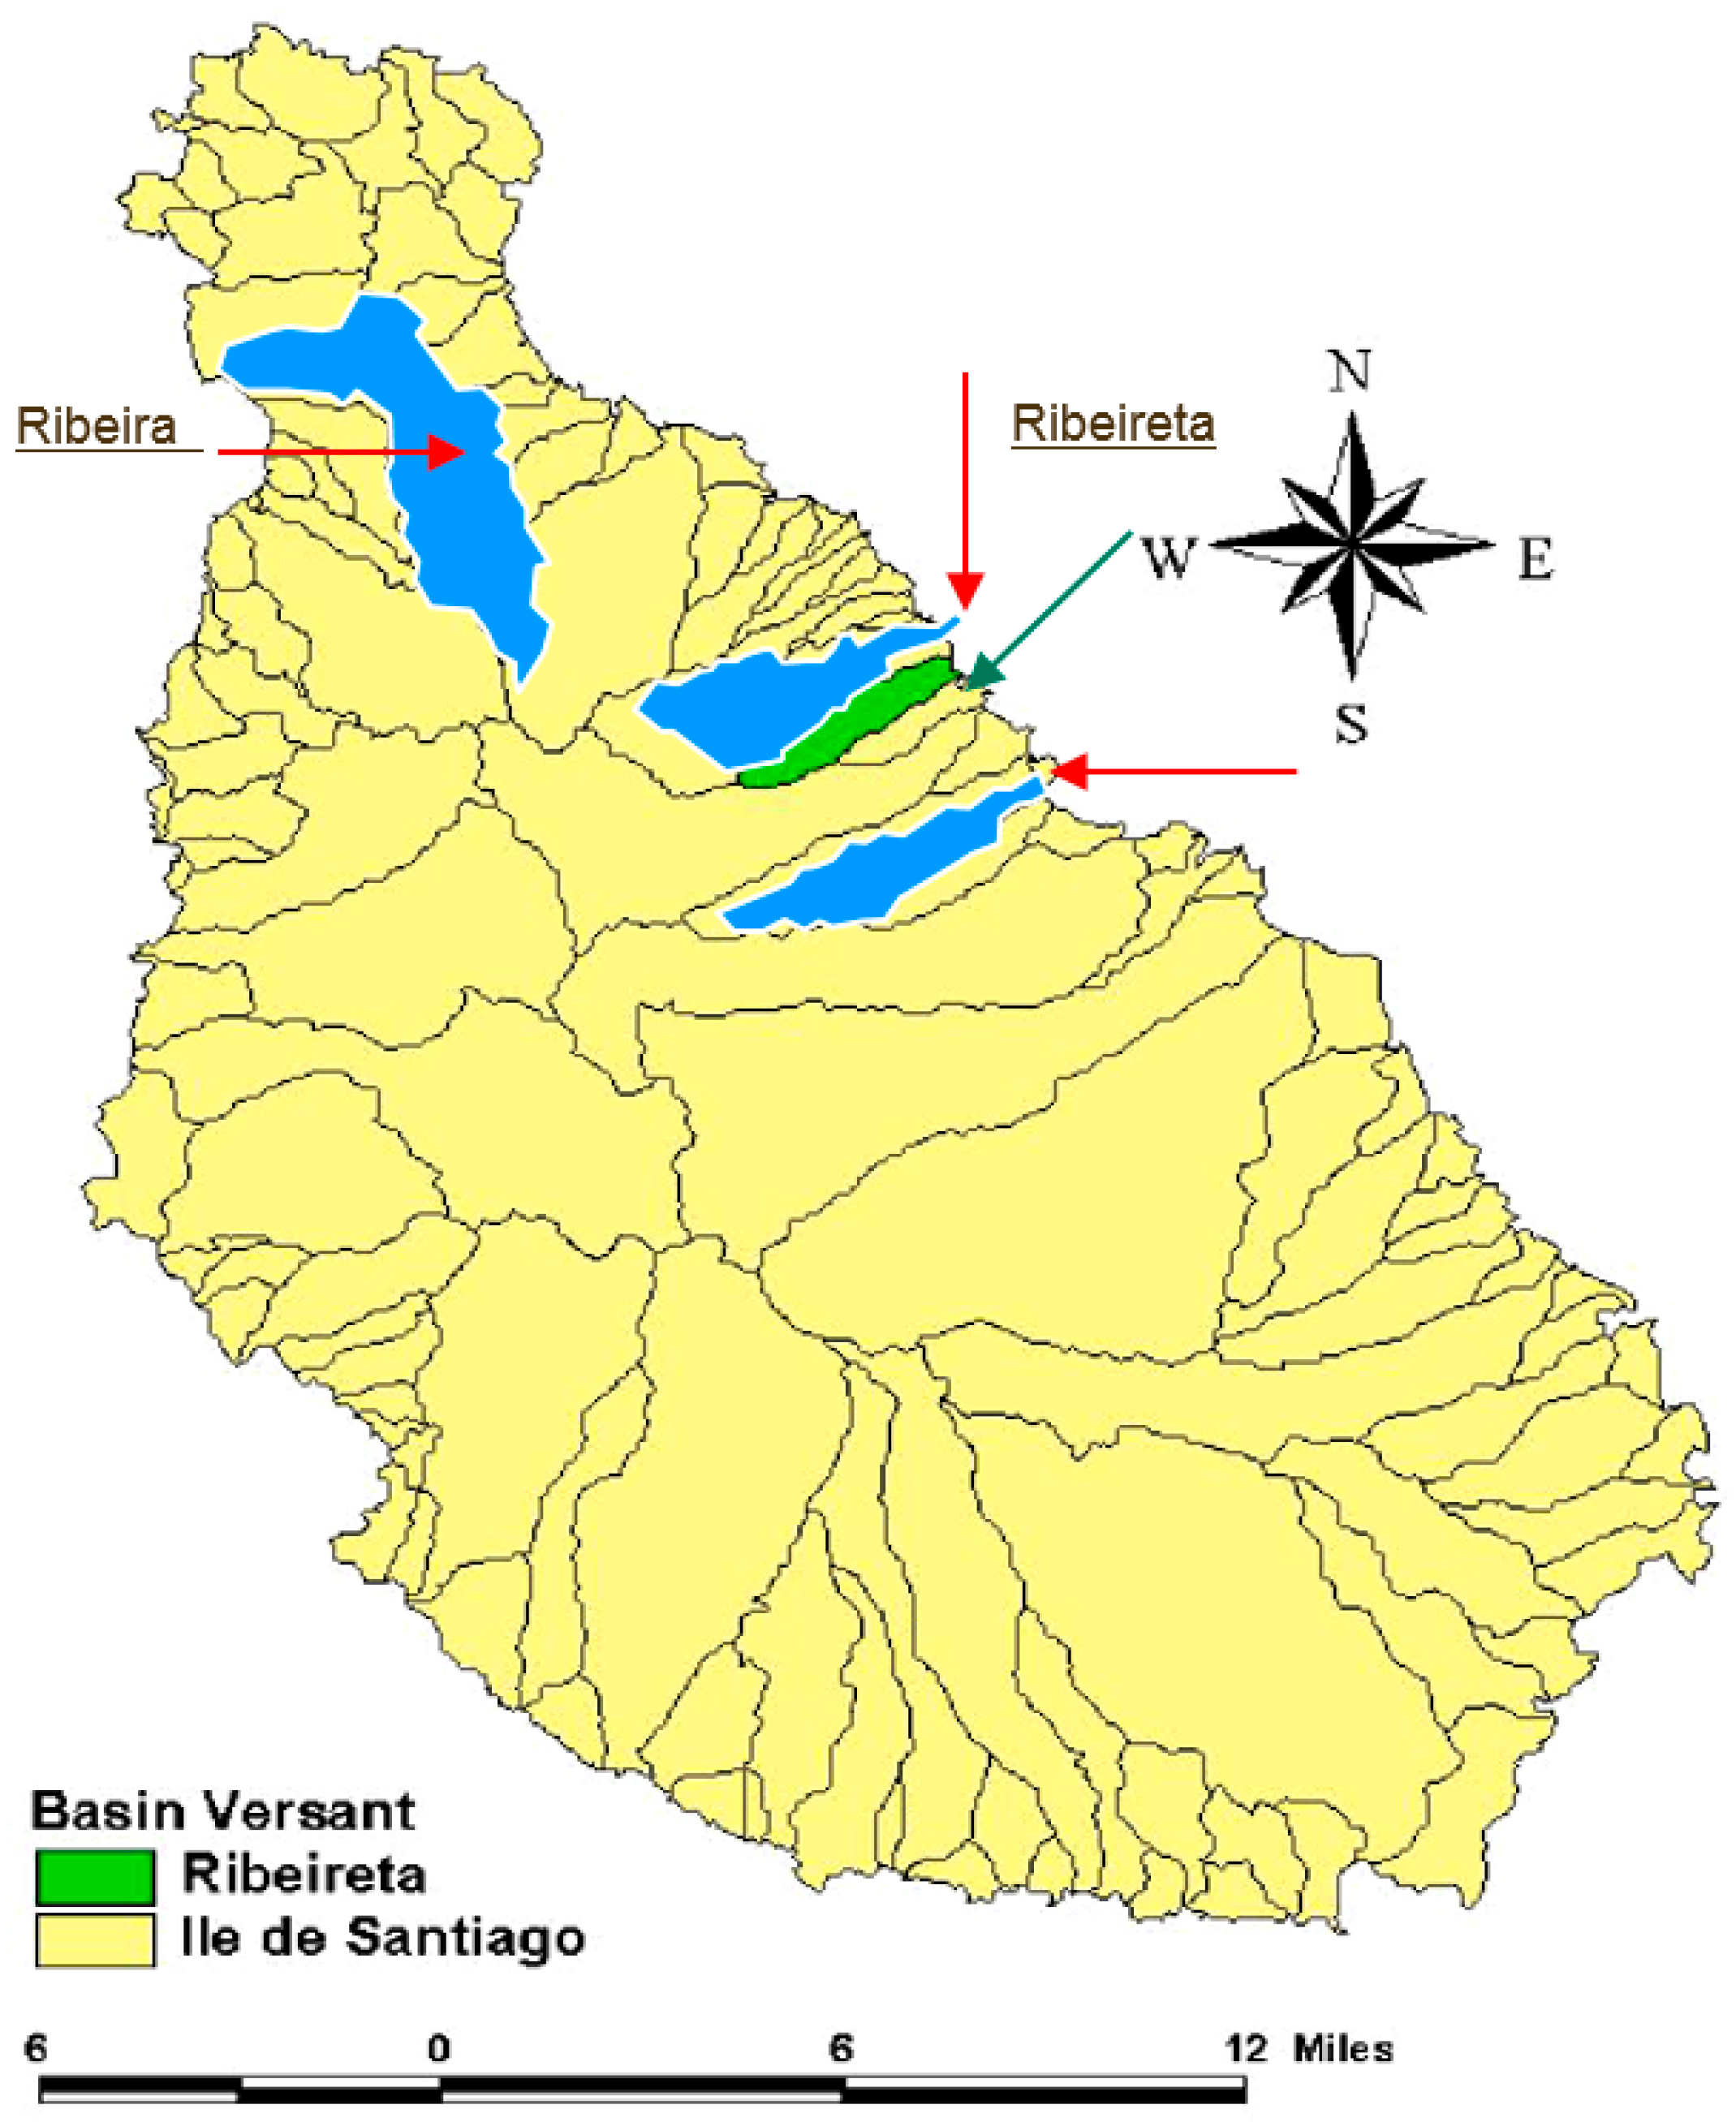
The application of the latest agricultural policies in Cape Verde, the
Plan Estratégico de Desarrollo Agrícola (Strategic Agricultural Development Plan) (PEDA) 2004–2015, is analyzed in the Ribera Grande, Saltos and S. Miguel water basins on the island of Santiago, Cape Verde Republic (see
Figure 3).
Santiago Island is the largest island of the archipelago (1007 km
2), and is also the most populous, representing more than 50% of the population −521,000 in 2015 [
16]. It has the greatest agricultural surface area, approximately 23,378 ha (52.7% of total area of the country) [
14]. The island is affected by drought (39% of the land is part of an arid zone and just 25% is a sub-humid zone) and the recurring effects of this phenomenon (ibid.).
Santiago is also characterized by a high incidence of poverty: in 2001, 49% of the resident population of the island (except in Praia) was affected by poverty. Of the 173,000 people living in poverty in Cape Verde, about 95,000, or 55 in every 100 live on the island of Santiago [
22]. Women are the most affected by this social problem. In 2007, the municipalities of Santiago (with the exception of Praia), were still the poorest in the country (41.5%) [
23].
Along with poverty, Santiago ranks second in terms of food insecurity, with an incidence of 31.6%, of which 7.8% of families are in a situation of severe food insecurity [
24]. Other limitations are related to the topography of the territory, the predominant forms of land use and fragmentation of land and the low level of schooling and vocational training of people engaged in agriculture.
In this context, the water basins of Ribeira Grande, Saltos and S. Miguel, studied in this work, all show similar natural and socioeconomic characteristics.
In 2010, these basins had a population of approximately 12,186 people, constituting 2571 families [
26]. The three basins cover an area of approximately 80 km
2. A high incidence of poverty characterizes all basins. Most homes have a woman as the head of the household (women are also the majority in the overall population). Women are also those with least human capital (less educated, more precarious jobs despite being the largest proportion of the working population). They take on most of the responsibilities of households having little time to improve their capacities. It was also found that in the three water basins, most of the workforce was employed in low-skilled jobs and, were, therefore, low-paid. The majority (86%) of the inhabitants practiced rain-fed agriculture, which is uneconomical due to the limited range of crops (mainly subsistence farming) and high dependence on the randomness of the rains [
27]. In the basins, all the population was facing the same problems: lack of water and unemployment. The latest unemployment rate at a national level in 2014 was around 15.8%, while in municipalities where the basins are located the unemployment rate varied between 10 and 15% [
28].
In this context, the Proyecto Integrado de Desarrollo de las Cuencas Hidrográficas de la isla de Santiago (PIDBHIS) (Integrated Development Project of the Water Basins of the Island of Santiago) is considered a priority for the eradication of poverty and for economic growth in the region through the enhancement of these water basins. It is based on decentralization and community-based decision-making, guaranteeing “the participation of local communities in the process of identification, planning and implementation of activities of management of natural resources aimed at improving sustainable living conditions in rural areas” [
25].
This project aimed to improve the socio-economic conditions of the target communities (Ribeira Saltos, Ribeira Grande and Ribeira S. Miguel) through the integrated development of the water basins and good management of natural resources (water, soil, vegetation and atmosphere). This should lead to increased agricultural production, improved household income and sanitary conditions of the respective communities and strengthening of the human and social capital in order to reduce levels poverty of the area [
27].
Thus, the PEDA states that the solutions for these basins are based on the creation of income-generating alternatives for families. More specifically, “it is in agriculture and livestock where the solution to the problem lies: the construction of pig and poultry farms, the application of drip irrigation and development activities related to trade in agricultural and livestock products. To do this, the construction of infrastructure for water mobilization for the development of such activities” [
27] is required.
We believe that this is insufficient, it is necessary to go beyond the mobilization of water and adopt a holistic view of development of rural areas involving the organization of farmers. Based on this diagnosis and the objectives of the PEDA, this research will evaluate the effect of agricultural policies in reducing poverty in the communities of Saltos, Ribeira Grande and S. Miguel.
3. Methodology
This study aims to analyse whether there has been a reduction in poverty in the three basins mentioned over a period of seven years, between 2006–2013, and secondly, in the event that poverty reduction has occurred, to what extent it has been due to the agricultural policies applied. In order to do so, it was necessary to integrate both quantitative and qualitative tools to focus on the mechanisms and the context in which the agricultural policy actions were carried out. Aspects such as population change or access to energy for lighting or access to drinking water might be evaluated quantitatively, however, other elements, either due to the lack of statistics or information or by the very nature of the issues (e.g., quality water or energy access), should be approximated through qualitative indicators. The fieldwork took place on the island of Santiago, where the basins are located, with the duration of three months, during autumn season, a good period from the standpoint of the availability of farmers.
Thus, the proposed assessment consists of the integration of different social techniques to deal with the complexity of agricultural governance issues. Those methods were structured in four research steps as follows:
- (a)
collection and analysis of documentation, and active observation;
- (b)
interviews with key informants to provide current and historical data;
- (c)
setting up focus groups with the inhabitants of the observed areas and finally;
- (d)
conducting a set of interviews with participants in the focus groups.
This integrated analysis follows previous works carried out by [
29,
30,
31], among others, on approaches based on the relevance of extended participatory assessments [
32,
33]. The first two approaches aimed at framing the issue and identifying its main impacts, in order to contextualise the
problematique, covering all possible analytic variables, and analyse the social, environmental, economic and governance impacts caused by earlier adopted agricultural policies. Together it allowed the mapping of stakeholders, identifying the preferences and interests that cannot be explained and forecast on the basis of rational calculation, but are conditioned by rules, by the role of institutions, by values and habits, and interactions with other agents; may change over time and through interaction with other agents [
30].
3.1. Data Collection (Documents and Personal Observation)
Data collection and analysis consisted of searching and reviewing technical documentation of the policies generated by the PIDBHIS project, the Ministry of Rural Development and other national institutions between 2004 and 2013. Firstly, the political and technical leaders of the Ministry of Rural Development of Cape Verde were contacted, specifically, the Minister of Rural Development (MDR), the Director-General for Planning and Budget, the Director-General for Agriculture and Rural Development, the Director of Agriculture, the Director of Rural Extension and the Coordinator of the PIDBHIS Project. The latter provided all the material and existing documentation, and also indicated the people who could support the completion of the fieldwork.
The main sources examined and analysed were the Strategic Agriculture Development Plan (PEDA) for the period 2004–2015 and the Poverty Reduction and Growth Document I and II (DECRP I, DEPRP II and DECRP III) accessible through the web pages of the ministries of agriculture and finance of Cape Verde- as well as the documents and project reports provided by the coordination of the PIDBHIS project. This allowed the research team to establish the baseline, or frame of reference, to evaluate the changes produced by the interventions.
Personal observation was made of the locality, people and infrastructure built during the project’s implementation. These observations were made during field trips to conduct interviews and arrange focus groups. Observations were organized taking into account the following aspects: (a) how land is used and what people’s activities are; (b) how inhabitants’ roles in community activities are organized; and (c) how infrastructure is used and any advantages made of entrepreneurship. The information gathered through this observation allowed to complement the information collected from official reports, providing a more realistic picture of the period of analysis.
3.2. Interviews with Key Informants and Focus Gropus Participants
A total of 66 interviews were carried out, 20 of which were with key informants and 46 were participants of the focus groups. They were conducted at two levels: on the one hand, there were those considered key to the understanding of the study, including members of associations existing in the basins, and on the other, people who participated in focus groups and represented the population of the basins. The interviews were conducted in the institutions where informants belonged (municipalities, Delegation of the Ministry of Agriculture, Office of the Ministry of Education, Hospital, etc.). The reliability of informants, knowledge, credibility, impartiality and willingness to respond were assessed. This set of interviews allowed a better understanding of the characteristics of the evaluation units.
Two questionnaires were used as a guide for the interviews, one for the key informants and one for the members of the associations. Given the difficulty of bringing together all the participants of the program, subjects were selected according to the accessibility and proximity of the interviewed, and depending on available human and economic resources.
The key questions addressed in the interviews were:
- (a)
Which are the main existing issues in the localities of the watersheds;
- (b)
Level of knowledge of agricultural policy and the PIDBHIS project;
- (c)
To explore the impact of interventions on the lives of the inhabitants of the research units;
- (d)
Interviewee’s perception of the changes occurred during the period of analysis;
- (e)
The changes that have occurred in the basins once the project was completed;
- (f)
The existence or not of other factors that may have influenced/impeded the development and improvement of the quality of life of the inhabitants of the research units;
- (g)
The contribution of agricultural policy, through the PIDBHIS project, to improving living conditions and reducing poverty in the basin population.
As a time frame for the interviews, the period from 2006 to 2013 was considered, which coincides with the implementation of the PIDBHIS project and the validity of the Strategic Plan for the Development of Agriculture in Cape Verde (2004–2015).
The purpose of these interviews was to fully understand the problem, to fill gaps in the analysts’ knowledge, acquired from other sources. Meeting the various stakeholders was an additional benefit. The interviews with experts and stakeholders thus had to reflect their take on events and offer them the opportunity to voice their opinions on the problem [
34,
35,
36,
37].
3.3. Focus Groups
Finally, three focus group sessions were conducted in the three water basins, where issues were discussed and responses were recorded for further analysis. This information helped to understand participants’ perceptions better regarding the impact of the interventions in the water basins on improving the wellbeing of their families.
In order to establish an open discussion among those present, the following guide was used:
- (a)
What is the current state of the river basin?
- (b)
With the implementation of the project what has worked? What did not work and why?
- (c)
What project activities had the greatest impact?
- (d)
What do you expect from the work of the Ministry of Rural Development? How should it be?
- (e)
Is the river basin currently poorer or less poor?
- (f)
What factors influenced that situation?
- (g)
What is expected of the inhabitants of the basin?
The treatment of all this qualitative information from both transcripts of interviews and focus group discussions was supplemented with information from the documentary and observational analysis.
The variables below were used to analyse whether the objectives of poverty reduction had been achieved:
- -
Living conditions
- -
Infrastructures
- -
Access to and availability of water
- -
Diversity of production
- -
Organization and Participation of communities in projects
4. Results
The results of this integrated approach involving documentary, statistical reviews and qualitative analysis with members of the agricultural communities in the water basins are shown in
Table 2. This table summarizes, for the different basins, how the variables proposed to analyze poverty evolved between 2006 and 2016 using existing data and the qualitative information collected, as well as from the perceptions of stakeholders and informants.
In 2013, as in 2006, unemployment and lack of water were identified as the main problems afflicting communities. A new problem had also arisen related to the theft of telephone cables that sometimes interrupted communications. On the other hand, it was observed that an increasing number of family farms had diversified their crops, which contributed to an expansion in the range of horticultural produce offered on the market and produce for families’ own consumption. This contributed to increased food security for families and a possible increase in family income.
Similarly, it was found that the construction of collection, storage and distribution of water infrastructure, strengthening drip irrigation, together with technical training for farmers had led to greater diversification and performance of farms. This was mainly due to greater accessibility to water, and better training to meet the challenges of converting dry farming to irrigation farming, that is, to a more modern agriculture.
Despite the problems, the inhabitants of the areas had the perception that they were less poor. For the purposes of this investigation, poverty is considered not just monetary poverty but the result of a social and economic process with cultural and political components in which individuals and households are deprived of essential assets and opportunities for different causes and processes, both individual and collective, which gives a multidimensional character to the concept of poverty. As such, the population, including those interviewed, see that their people are better served in several areas, such as infrastructure, education, health, and so they “feel less poor”.
Moreover, the beneficiaries of projects were positive about the interventions, even though they had not yet solved the problem of lack of water and employment. Below, the analysis of the results are structured using the five variables: Improvements in Living Conditions; Infrastructure; Increase in Water Availability; Diversification of Production; and Participation and Organization.
4.1. Living Conditions
The situation was almost identical for the three basins with respect to improvement of living conditions. The populations of the three basins had the perception that in 2013 they were less poor than in 2006. This perception could be observed on the ground, where it was verified that the communities studied had benefited from an improvement in living conditions. Although the people surveyed felt less poor and highlighted how agricultural policies had contributed to this, the achievements in this area had not been accompanied by an effective monitoring system (and production of statistics) that could verify this improvement quantitatively. However, the fieldwork carried out in this study showed that because of the interventions, there had been significant changes that had influenced the evolution of the quality of life of populations (see Table 2). It is also worth mentioning that the national context from 2001 to 2008 had also been conducive to the strengthening of achievements so far, as there was increased investment in infrastructure construction and social sectors.
Living conditions also rose through improvements in the health system (medical visits, increased number of doctors and thereby increased health coverage, improved nutritional status and education of young people). However, the drainage system was still incomplete in the towns of San Miguel. There was also insufficient rubbish collection, so that each house left its rubbish around, and there was a strong prevalence of diseases attributed to a lack of sanitation.
The beneficiaries considered that there were interventions that had strengthened the technical capacities of members of associations or farmers but these interventions had not guaranteed jobs. On a positive note, road construction by the Government had helped to reduce the isolation of many villages and helped the marketing of agricultural produce. This was highly valued. By contrast, many respondents felt that the tourism sector had only marginally contributed to the development of water basins.
4.2. Infrastructure
Infrastructure construction was especially appreciated, especially roads and tracks (2000 km of tracks of which 44% were tarmacked [
19], electrification of rural areas (nearly 100% electrification in 2015). All of which helped to improve living conditions. The impact of project interventions, framed within agricultural policies, also promoted the return of some families to abandoned towns, as in the case of Achada Grande, Tarrafal.
On the other hand, despite agricultural infrastructure being planned, it was observed on field trips that many projects were paralyzed. This was often due to deficiencies or lack of additional equipment, such as aviaries, cages for rabbits and even in some cases problems or community conflicts with the management of a well, (Ponta Verde) or incompletion of projects such as Varanda’s water supply (S. Miguel).
For key informants, the actions carried out by the project were well appreciated, except in the case of the S. Miguel basin: many of those interviewed there felt that the expected impact of the project had not been felt (see
Table 3). In fact, much of the infrastructure promoted during the period under analysis did not work or had not been completed (Saltos and S. Miguel). In particular, some wells and home water pipes were not working and water management of the wells had not been achieved in the S. Miguel basin, so it seemed that the situation in the S. Miguel basin was stagnant.
One aspect that may well have contributed to the situation of infrastructure paralysis, from our point of view, was the lack ownership. Infrastructure was generally not perceived, or assumed, to be private property of the community, for that reason, the beneficiaries behaved as “simple users” free of charge, with no responsibility for their conservation and maintenance of, for example, wells, pumps, pens, and so on. This was precisely why one of the problems identified in 2006, the lack of water, had not been resolved. Many informants also reported problems with the management systems established, (irrigation distribution network, strengthening localized irrigation, reclaimed land), which revealed a lack of local ownership and sustainability in interventions.
4.3. Access and Availability of Water
During the period under study, agricultural policy interventions of the project resulted in increased water availability. This was mainly due to the opening of wells, construction/repair of water tanks and the protection and conservation of slopes using plant material (aloe vera) (see
Table 4).
Key actors (City Council President S. Miguel, Administrator, nurses and some extension of the MDR) perceived conflicts over water management. It was clear to informants that the creation of an institution to manage or clarify the problem of water management could help resolve this situation. Despite some improvements in access to water, difficulties and conflicts in its management hampered its collective use and optimization. From what was seen on the ground, despite the conflicts, there was a better use of water for agriculture, since the opening of new wells.
Agriculture is the dominant economic activity in the areas studied, hence the lack of water has been, is, and will always be a key issue for people who depend on this scarce resource in Cape Verde. Therefore, effective measures to ensure sustainable management of this resource by users should be promoted.
4.4. Participation and Organization
A well-appreciated aspect was the opportunity given to farmers to participate in defining action plans for each basin. To achieve this goal, there was strong investment in strengthening the institutional capacity for an integrated water basin management. Despite this, the sense of ownership of the populations still did not reach the desired level to allow the works carried out and activities undertaken to be “owned” by the community. We believe that this happened because the works that were carried out with the support of associations were seen by the population as simply being job agencies.
Some weaknesses were also observed in reinforcing social capital. This was due to the lack of an organizational body that could bring together producers in the production, marketing, and distribution of agricultural produce, which could provide advantages in market scale and product quality. This aspect is very important in Cape Verde because there is now a clear opportunity for people engaged in agriculture to market agricultural produce with the required levels of quality to supply hotels and other institutional markets such as hospitals, schools, and so on. An organization of producers in our view is essential because it would promote trade mechanisms to ensure local supplies with the required quality for these markets. However, this requires that producers be effectively organized.
However, any intervention that creates new physical capital (such as irrigation or infrastructure) is unlikely to be sustained if there is not enough social and human capital organized to take advantage of the new infrastructure. This is what we consider has happened with most of the interventions in the basins. The sustainability of the interventions was low, as verified by the observations made in the field, and the results of the interviews and discussions in focus groups. Many of the projects (wells, animal cages, agricultural infrastructure) stopped working when the project intervention ended. This had its origin in the low ownership of interventions by the farmers receiving them. It should be noted that the sustainability of an intervention is measured by the percentage of goods and services still delivered and held five years after the completion of the flow of resources from the donor. The continuation of local action was stimulated by the project, and the generation of services and initiatives resulting from the project were strengthened.
5. Discussion
The populations of the three basins had the perception that they were less poor in 2013 than in 2006. This improvement was due to both interventions in agricultural policies and other policies (related to the strengthening of human, social and physical capital) that generated several positive impacts in the areas with interventions.
More specifically, improvements in the living conditions of most of the population of the studied areas were an indirect result of the implementation of agricultural policies, related to the construction of infrastructure in the country. These included the construction of runways, ports, airports and improvements in access to electricity, water and sanitation.
There were improvements due to strengthening in human capital (education, health, vocational training). The health sector also contributed to better living conditions of the population in the areas studied. There was an increase in doctors in the area, improved nutritional status, and increased vaccination rates, as pointed out by those interviewed from the basins.
In addition, a significant increase in rural electrification had a positive impact on several aspects. In terms of health, there was improved air quality in homes. Electrification also positively affected the employment situation, especially for women, as it allowed them to perform other income-generating activities. Young people benefited as well, because they had more hours of study, among other examples.
Improvements in access to water were also noted, both for household consumption as well as for agricultural production. This has had a major impact on raising the quality of life of the population.
By contrast, the intervention of institutions linked to tourism was negligible in the basins: the population of the basins did not see the tourism sector as a sector that has contributed to improving their living conditions or to poverty reduction. In fact, the type of tourism that is being implemented in the country is beach tourism. It would, however, be desirable to investigate how rural tourism could be linked to agriculture to improve the contribution of this sector to poverty reduction in rural areas and, consequently, of families making a living from agriculture.
It was due to agricultural policy interventions that improvements were found in the provision of and access to water along with the adoption of new technologies, which allowed the diversification of agricultural and livestock production (distribution of rabbits, goats and cows). However, there was insufficient technical assistance and ownership by the beneficiaries of the project interventions, which hindered the continuity of actions and, therefore, prevented better results from being achieved.
Lack of water remains a problem for the populations studied. Most of the families still live on rain-fed agriculture, which prevents them from getting the necessary resources to meet their basic needs fully. This lack is also a difficult structural problem to solve, especially when facing situations of drought. Management and rational use of this resource still constitute challenges to solve nationally and locally in the study areas; challenges that the implementation of agricultural policies has not yet managed to solve. Other aspects that agricultural policies have not solved are the unavailability of services, such as agricultural insurance and unemployment insurance, which would mitigate the impact of certain events (drought, floods, etc.).
It is clear that there are still problems to overcome to achieve sustainable management of natural resources, especially water, despite the use of improved production techniques. In addition, it was found, through interviews and work with focus groups, that the promotion of rural tourism activities was insufficient or almost non-existent. It was also not possible to promote an efficient organization of production and distribution, thus preventing the realization of economies of scale and leading to losses in competitiveness. The lack of organization also hindered access to markets linked to expanding tourism, which tend to be more organized and demanding in terms of quality, price, logistics and supply stability.
Although an increase in production was observed, serious difficulties limiting the harmonious development of the agricultural sector in Cape Verde remain: the small size of cultivation plots and land fragmentation (which tends to increase due to legal and cultural factors linked to inheritance) leading to overall inefficiencies in the sector and reduced productivity per ha. In addition to these difficulties, there are problems related to the inter-island transport, impacting heavily on distribution and marketing of agricultural products between producing and consuming islands.
6. Conclusions
The qualitative method used helped to analyze the mechanisms that generated changes and the contexts in which these changes took place. This facilitated the identification of the factors that influenced poverty reduction in the three water basins, as well as enabling an assessment of the impact of agricultural policies on the dynamics of this poverty reduction.
It can be concluded that agricultural policies have contributed to poverty reduction in general and, in particular, to the resolution of some of the mismatches identified in 2006. Between 2006 and 2013 there was a considerable improvement in the living conditions of the inhabitants of the water basins studied, which coincided with the goals set out in the PEDA.
In other respects, the implementation of agricultural policies has not been successful. The underlying problems of unemployment, lack of water, and lack of organization of producers all remain, and the solutions we consider essential for a better contribution of agricultural policy to reducing rural poverty.
Unemployment is a structural problem, related to the economic structure of the country. Generally, socioeconomic projects have a temporary effect related to the direct income of families carrying out the work. However, this work is not considered sustainable over time, and therefore, it does not solve the problem of unemployment.
Another aspect of poverty where agricultural policy has not had the expected success was in equity actions, despite efforts to integrate farmers with greater difficulty, giving them the opportunity to improve their living conditions. This is a matter of utmost importance in Cape Verde, as, in the agricultural sector, women especially are strongly disadvantaged compared to men in access to and control of the means of production (water and land). In this area, no impact was perceived due to the long-term nature of this issue. Basically, there is no effective implementation of a gender approach in interventions, thus agricultural policies should be improved in this regard.
Despite some poverty reduction, it should be noted that the country’s geographical and environmental vulnerabilities mean there are limitations to such a reduction. For example, the country has limited land for agricultural use, a lack of natural resources and scattered markets that increase production and marketing costs. These factors are always present, so to overcome them, the incorporation of innovations in the agricultural sector will be necessary.
After weighing up the balance between what was expected to be achieved under the Strategic Plan for Agricultural Development (PEDA), and what was actually achieved, we can identify which actions of agricultural policy worked and which did not.
The main objective of the PEDA was to contribute to poverty reduction through “an integrated and supportive management of natural resources” on a family and community scale, and on a geographical level of water basins, municipalities and islands. This should engender a genuine restructuring of agricultural practices (based on the sustainable exploitation of resources) that would leave a sustainable base and break the vicious cycle of environmental degradation/poverty. Additionally, the “reduction in poverty” would be achieved through the promotion of economically profitable activities, both in agriculture and in other sectors generating incomes including rural tourism. This would ensure the conditions for a growing part of the rural population in terms of employment and creation of small and medium-sized enterprises for which the organization of local communities, investments in infrastructure (accommodation, transport, etc.) and the promotion of human capacities in management would be required.
At this point, we can confirm that the implementation of agricultural policies helped achieve the objectives concerning the intensification, diversification and enhancement of agricultural production. However, if the aim is for the agricultural policy to contribute to poverty reduction, it will have to work together and in harmony with other sectors: tourism, sustainable economy, industry, and so on. The ministry responsible for rural development should be the integrator for all sectoral public policies that affect rural areas, strengthening links and interactions between the actors, as the rural sector, not agriculture, is the link between agriculture and rural development and the alleviation of rural poverty.
Therefore, our perception is that there is still a need to promote measures to better promote the agricultural sector and rural areas, and improve the living conditions of the population, whose main source of income is agriculture. There is a need to establish the conditions for a profound transformation in the forms of land use. In particular, there is a need to take measures to prevent the fragmentation of agricultural plots. In addition, a policy of access to agricultural credit should be implemented and a solid, durable assistance program to farmers’ organizations could start to attract private investment to the rural environment and to other economic infrastructure.
In conclusion, changes are needed in the paradigm that addresses basins as agricultural units to one that considers them as units of land management. This new paradigm will allow a holistic view of the development of agriculture and rural areas.

 ,
, 


