Sustainable Production Line Evaluation Based on Evidential Reasoning
Abstract
1. Introduction
2. Literature Review
3. Problem Description
4. Sustainable Production Line Evaluation Based on ER
5. Case Study for ER
- (1)
- Original plan: C1 = {(high, 0.8), (low, 0.2)}; C2 = {(high, 0.4), (low, 0.6)}; C3 = {(high, 0.25), (low, 0.75)}; C4 = {(high, 0.4), (low, 0.6)}; and C5 = {(high, 0.8), (low, 0.2)}. The above underlying data are substituted to activate the rule base, and the result is calculated by the formulas in Section 3, P1 = (0.7393, 0.2626).
- (2)
- Plan 2: C2 = {(high, 0.2), (low, 0.8)}; C3 = {(high, 0.25), (low, 0.75)}, C4 = {(high, 0.2), (low, 0.8)}; and C5 = {(high, 0.2), (low, 0.8)}. Then, the result is calculated as P2 = (0.7983, 0.2029).
- (3)
- Plan 3 is different from Plan 2 with C1 = {(high, 0.2), (low, 0.8)}. Similarly, P3 = (0.8552, 0.1454).
6. Simulation Modeling and Analysis Verification Using FlexSim
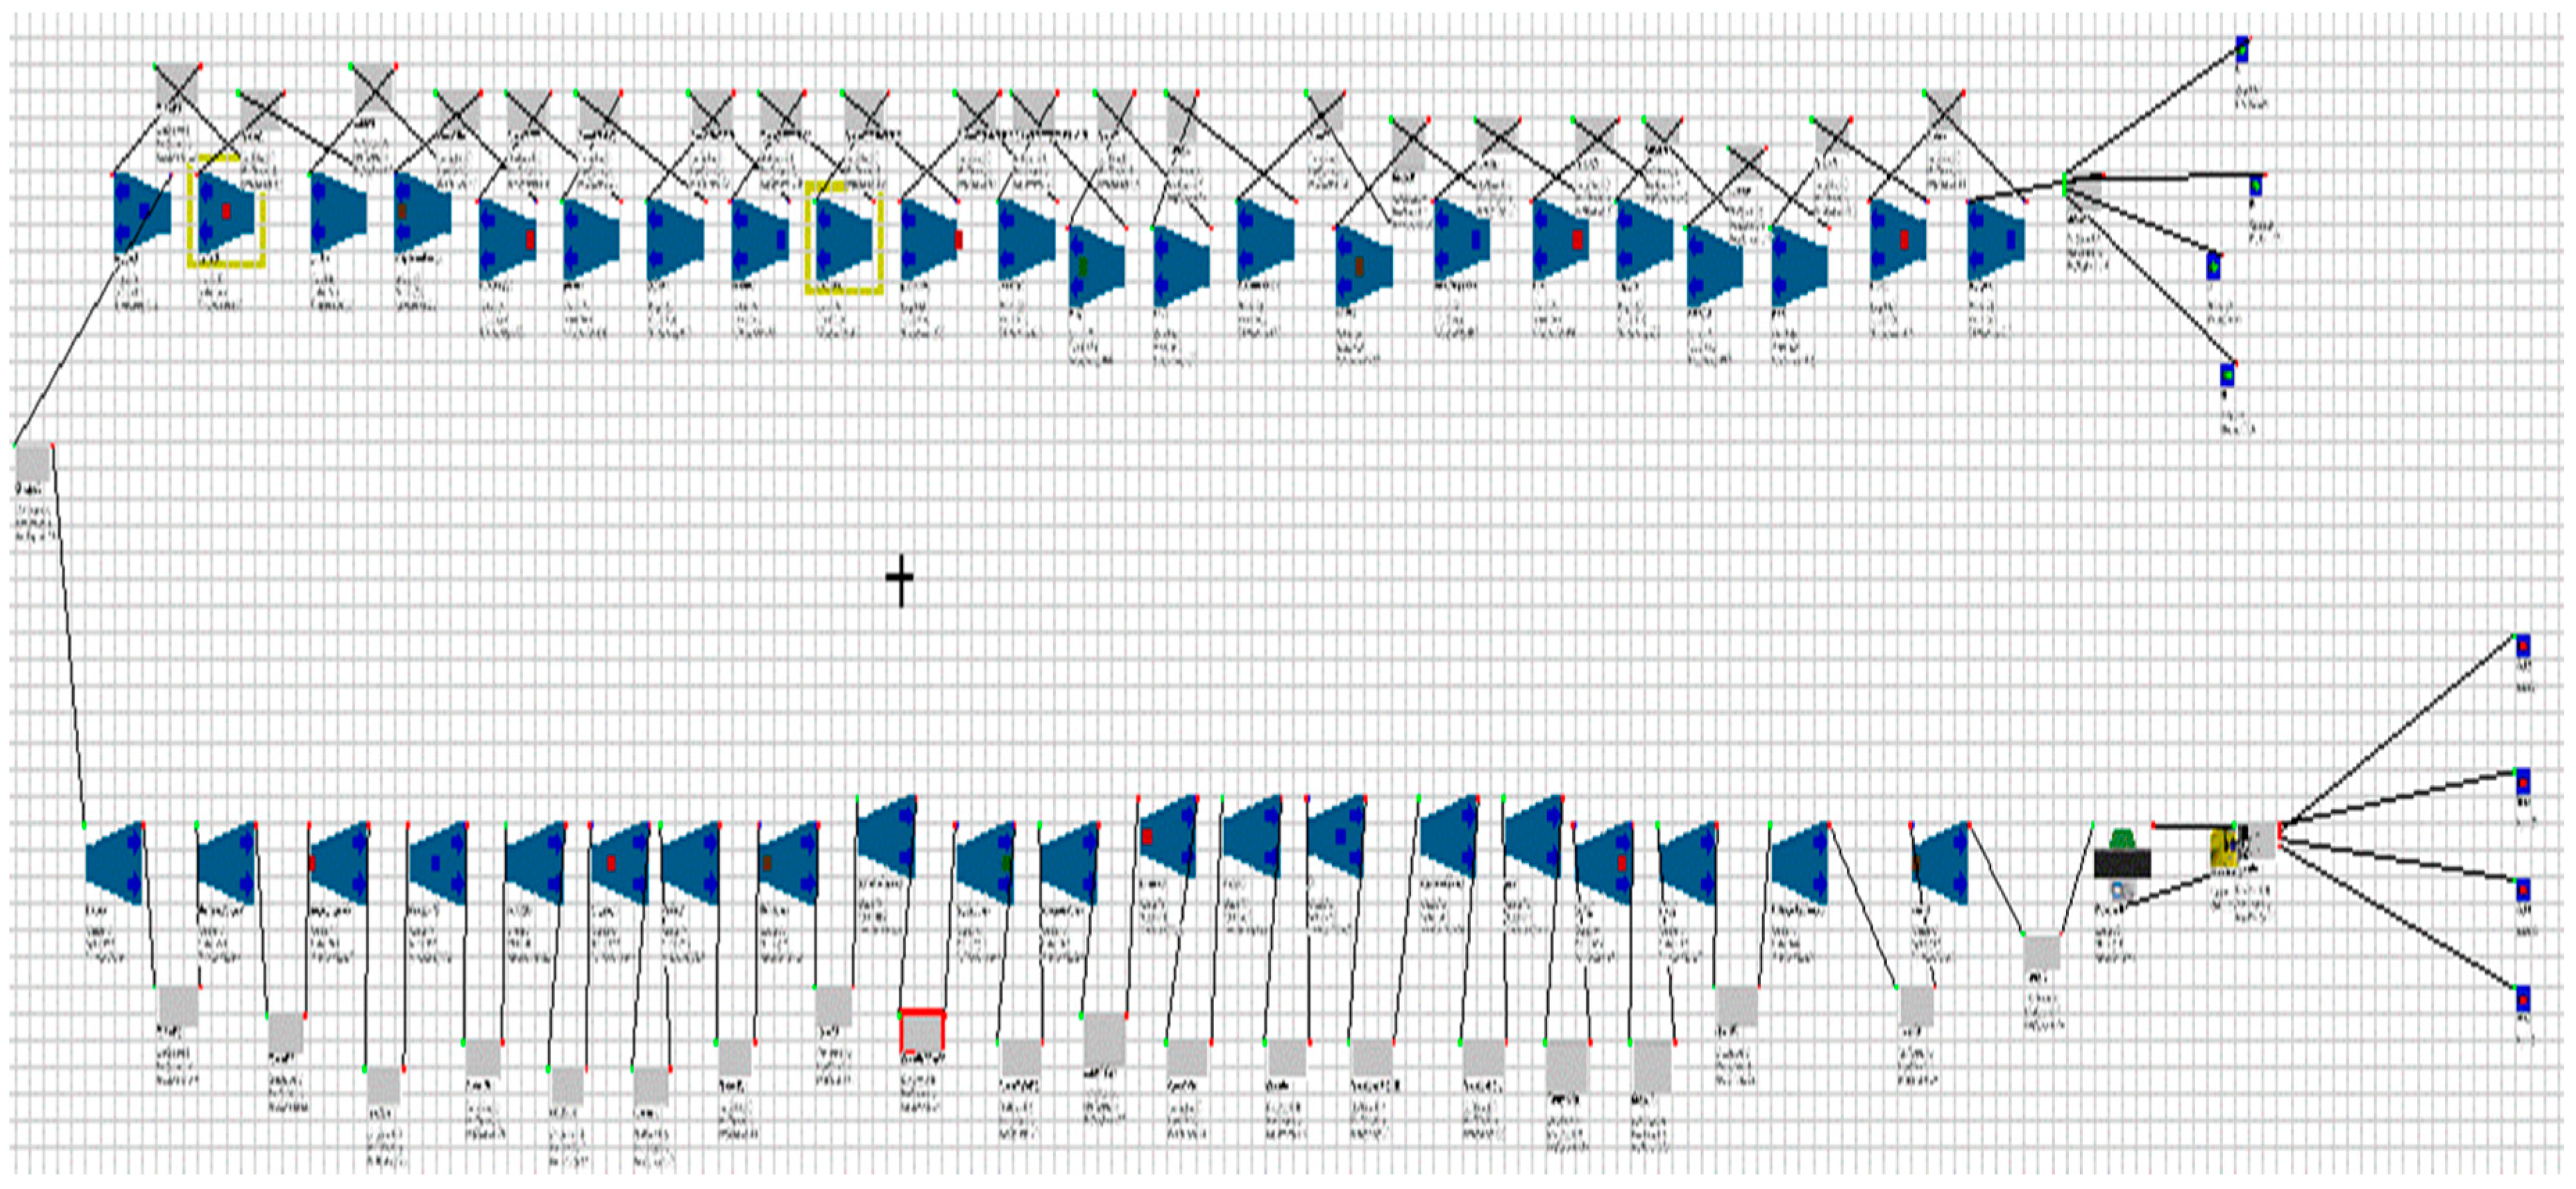
- (1)
- Original plan 1.
- (2)
- Plan 2, which combines “fastening the gear chamber cover” with “pulley” and increases the workers appropriately in the “hoisting cylinder head”, and the “starter”.
- (3)
- Plan 3, in which the production line is adjusted based on Plan 2. The best producing order is calculated and, subsequently, batch production is used.
7. Conclusions
7.1. Result Analysis
7.2. Discussion
- (1)
- Comparing with existing production line evaluation methods, ER evaluation model needs less clear input data. With the ER model, the overall capacity for the production line evaluation is obtained by using the underlying indicator status to activate the rule base.
- (2)
- The cost of ER is considerably low. Most of the existing methods for production line evaluation do not meet the sustainability criteria, as they are relatively expensive. For instance, production line evaluation through FlexSim is a widely used method, which can achieve good results. However, an industrial simulation of a production line needs investigation of the production line factors and collection of multiple sets of specific industrial data. Moreover, professional simulation software is necessary for modeling. Therefore, the cost of production line simulation is high.
- (3)
- It has been shown that ER model is effective in evaluation problem with uncertainty. Strict logical reasoning is necessary in the decision-making process, and the synthesis of evidence in ER model can be used to describe the rules in real world with the rigorous process, which is important in production line evaluation.
7.3. Summary
Acknowledgments
Author Contributions
Conflicts of Interest
Appendix A
| Numbers | Prerequisites | Conclusions |
|---|---|---|
| C1 | C1 = {(High, 0.8), (Low, 0.2)} | |
| C1 | C1 = {(High, 0.9), (Low, 0.1)} | |
| C2 | C2 = {(High, 0.4), (Low, 0.6)} | |
| C2 | C2 = {(High, 0.2), (Low, 0.8)} | |
| C3 | C3 = {(High, 0.25), (Low, 0.75)} | |
| C3 | C3 = {(High, 0.2), (Low, 0.8)} | |
| C4 | C4 = {(High, 0.4), (Low, 0.6)} | |
| C4 | C4 = {(High, 0.2), (Low, 0.8)} | |
| C5 | C5 = {(High, 0.7), (Low, 0.3)} | |
| C5 | C5 = {(High, 0.8), (Low, 0.2)} | |
| 1 | (C1 = High)∧(C2 = High)∧(C3 = High)∧(C4 = High)∧(C5 = High) | P = {(High, 0.65), (Low, 0.35)} |
| 2 | (C1 = High)∧(C2 = High)∧(C3 = High)∧(C4 = High)∧(C5 = Low) | P = {(High, 0.5), (Low, 0.5)} |
| 3 | (C1 = High)∧(C2 = High)∧(C3 = High)∧(C4 = Low)∧(C5 = High) | P = {(High, 0.68), (Low, 0.32)} |
| 4 | (C1 = High)∧(C2 = High)∧(C3 = High)∧(C4 = Low)∧(C5 = Low) | P = {(High, 0.65), (Low, 0.35)} |
| 5 | (C1 = High)∧(C2 = High)∧(C3 = Low)∧(C4 = High)∧(C5 = High) | P = {(High, 0.6), (Low, 0.4)} |
| 6 | (C1 = High)∧(C2 = High)∧(C3 = Low)∧(C4 = High)∧(C5 = Low) | P = {(High, 0.69), (Low, 0.31)} |
| 7 | (C1 = High)∧(C2 = High)∧(C3 = Low)∧(C4 = Low)∧(C5 = High) | P = {(High, 0.8), (Low, 0.2)} |
| 8 | (C1 = High)∧(C2 = High)∧(C3 = Low)∧(C4 = Low)∧(C5 = Low) | P = {(High, 0.6), (Low, 0.4)} |
| 9 | (C1 = High)∧(C2 = Low)∧(C3 = High)∧(C4 = High)∧(C5 = High) | P = {(High, 0.65), (Low, 0.35)} |
| 10 | (C1 = High)∧(C2 = Low)∧(C3 = High)∧(C4 = High)∧(C5 = Low) | P = {(High, 0.52), (Low, 0.48)} |
| 11 | (C1 = High)∧(C2 = Low)∧(C3 = High)∧(C4 = Low)∧(C5 = High) | P = {(High, 0.66), (Low, 0.34)} |
| 12 | (C1 = High)∧(C2 = Low)∧(C3 = High)∧(C4 = Low)∧(C5 = Low) | P = {(High, 0.65), (Low, 0.35)} |
| 13 | (C1 = High)∧(C2 = Low)∧(C3 = Low)∧(C4 = High)∧(C5 = High) | P = {(High, 0.78), (Low, 0.22)} |
| 14 | (C1 = High)∧(C2 = Low∧(C3 = Low)∧(C4 = High)∧(C5 = Low) | P = {(High, 0.65), (Low, 0.35)} |
| 15 | (C1 = High)∧(C2 = Low)∧(C3 = Low)∧(C4 = Low)∧(C5 = High) | P = {(High, 1), (Low, 0)} |
| 16 | (C1 = High)∧(C2 = Low)∧(C3 = Low)∧(C4 = Low)∧(C5 = Low) | P = {(High, 0.67), (Low, 0.33)} |
| 17 | (C1 = Low)∧(C2 = High)∧(C3 = High)∧(C4 = High)∧(C5 = High) | P = {(High, 0.8), (Low, 0.2)} |
| 18 | (C1 = Low)∧(C2 = High)∧(C3 = High)∧(C4 = High)∧(C5 = Low) | P = {(High, 0), (Low, 1)} |
| 19 | (C1 = Low)∧(C2 = High)∧(C3 = High)∧(C4 = Low)∧(C5 = High) | P = {(High, 0.4), (Low, 0.6)} |
| 20 | (C1 = Low)∧(C2 = High)∧(C3 = High)∧(C4 = Low)∧(C5 = Low) | P = {(High, 0.2), (Low, 0.8)} |
| 21 | (C1 = Low)∧(C2 = High)∧(C3 = Low)∧(C4 = High)∧(C5 = High) | P = {(High, 0.55), (Low, 0.45)} |
| 22 | (C1 = Low)∧(C2 = High)∧(C3 = Low)∧(C4 = High)∧(C5 = Low) | P = {(High, 0.65), (Low, 0.35)} |
| 23 | (C1 = Low)∧(C2 = High)∧(C3 = Low)∧(C4 = Low)∧(C5 = High) | P = {(High, 0.5), (Low, 0.5)} |
| 24 | (C1 = Low)∧(C2 = High)∧(C3 = Low)∧(C4 = Low)∧(C5 = Low) | P = {(High, 0.65), (Low, 0.35)} |
| 25 | (C1 = Low)∧(C2 = Low)∧(C3 = High)∧(C4 = High)∧(C5 = High) | P = {(High, 0.49), (Low, 0.51)} |
| 26 | (C1 = Low)∧(C2 = Low)∧(C3 = High)∧(C4 = High)∧(C5 = Low) | P = {(High, 0.65), (Low, 0.35)} |
| 27 | (C1 = Low)∧(C2 = Low)∧(C3 = High)∧(C4 = Low)∧(C5 = High) | P = {(High, 0.2), (Low, 0.8)} |
| 28 | (C1 = Low)∧(C2 = Low)∧(C3 = High)∧(C4 = Low)∧(C5 = Low) | P = {(High, 0.22), (Low, 0.78)} |
| 29 | (C1 = Low)∧(C2 = Low)∧(C3 = Low)∧(C4 = High)∧(C5 = High) | P = {(High, 0.45), (Low, 0.65)} |
| 30 | (C1 = Low)∧(C2 = Low)∧(C3 = High)∧(C4 = High)∧(C5 = Low) | P = {(High, 0.18), (Low, 0.82)} |
| 31 | (C1 = Low)∧(C2 = Low)∧(C3 = Low)∧(C4 = Low)∧(C5 = High) | P = {(High, 0.6), (Low, 0.4)} |
| 32 | (C1 = Low)∧(C2 = Low)∧(C3 = Low)∧(C4 = Low)∧(C5 = Low) | P = {(High, 0.52), (Low, 0.48)} |
References
- Xu, J.; Jiang, X.; Wu, Z. A Sustainable Performance Assessment Framework for Plastic Film Supply Chain Management from a Chinese Perspective. Sustainability 2016, 8, 1042. [Google Scholar] [CrossRef]
- Joo, S.J.; Choi, H.C.P. Assessing comparative production efficiencies for product line management. Int. J. Prod. Res. 2015, 53, 241–5250. [Google Scholar] [CrossRef]
- Dong, C.; Shen, B.; Chow, P.S.; Yang, L.; Chi, T.N. Sustainability investment under cap-and-trade regulation. Ann. Oper. Res. 2016, 240, 509–531. [Google Scholar] [CrossRef]
- Liu, J.; Mooney, H.; Hull, V.; Davis, S.J.; Gaskell, J.; Hertel, T.; Lubchenco, J.; Seto, K.C.; Gleick, P.; Kremen, C.; et al. Systems integration for global sustainability. Science 2015, 347, 1258832. [Google Scholar] [CrossRef] [PubMed]
- Bardos, R.P.; Bone, B.D.; Boyle, R.; Evans, F.; Harries, D.N.; Howard, T.; Smith, J.W. The rationale for simple approaches for sustainability assessment and management in contaminated land practice. Sci. Total Environ. 2016. [Google Scholar] [CrossRef] [PubMed]
- Galal, N.; Moneim, A. A Mathematical Programming Approach to the Optimal Sustainable Product Mix for the Process Industry. Sustainability 2015, 7, 13085–13103. [Google Scholar] [CrossRef]
- Lee, J.; Jun, S.; Chang, T.W.; Park, J. A Smartness Assessment Framework for Smart Factories Using Analytic Network Process. Sustainability 2017, 9, 794. [Google Scholar] [CrossRef]
- Wang, C.N.; Huang, Y.F.; Le, T.N.; Ta, T.T. An Innovative Approach to Enhancing the Sustainable Development of Japanese Automobile Suppliers. Sustainability 2016, 8, 420. [Google Scholar] [CrossRef]
- Čereška, A.; Zavadskas, E.; Cavallaro, F.; Podvezko, V.; Tetsman, I.; Grinbergienė, I. Sustainable Assessment of Aerosol Pollution Decrease Applying Multiple Attribute Decision-Making Methods. Sustainability 2016, 8, 586. [Google Scholar] [CrossRef]
- Burinskiene, M.; Bielinskas, V.; Podviezko, A.; Gurskiene, V.; Maliene, V. Evaluating the Significance of Criteria Contributing to Decision-Making on Brownfield Land Redevelopment Strategies in Urban Areas. Sustainability 2017, 9, 759. [Google Scholar] [CrossRef]
- Zhaoxia, G.; Haitao, L.; Dongqing, Z.; Jing, Y. Green Supplier Evaluation and Selection in Apparel Manufacturing Using a Fuzzy Multi-Criteria Decision-Making Approach. Sustainability 2017, 9, 650. [Google Scholar] [CrossRef]
- Wei, F.; Lu, J.; Kong, Y. Research on Sustainability Financial Performance of Chinese Listed Companies. Sustainability 2017, 723. [Google Scholar] [CrossRef]
- Shankar, K.M.; Kumar, P.U.; Kannan, D. Analyzing the Drivers of Advanced Sustainable Manufacturing System Using AHP Approach. Sustainability 2016, 8. [Google Scholar] [CrossRef]
- Wu, G.; Duan, K.; Zuo, J.; Zhao, X.; Tang, D. Integrated Sustainability Assessment of Public Rental Housing Community Based on a Hybrid Method of AHP-Entropy Weight and Cloud Model Sustainability. Sustainability 2017, 9, 603. [Google Scholar] [CrossRef]
- Koltai, T.; Lozano, S.; Uzonyi-Kecskés, J.; Moreno, P. Evaluation of the results of a production simulation game using a dynamic DEA approach. Comput. Ind. Eng. 2017, 105, 1–11. [Google Scholar] [CrossRef]
- Levitt, T. Production Line Approach to Service. McKinsey Q. 1973, 9, 2–18. [Google Scholar] [CrossRef]
- Kłosowski, G.; Gola, A.; Świć, A. Application of Fuzzy Logic Controller for Machine Load Balancing in Discrete Manufacturing System. In International Conference on Intelligent Data Engineering and Automated Learning; Springer: Cham, Switzerland, 2015; pp. 256–263. [Google Scholar]
- Mastor, A.A. An Experimental Investigation and Comparative Evaluation of Production Line Balancing Techniques. Manag. Sci. 1970, 16, 728–746. [Google Scholar] [CrossRef]
- Grabowski, D.; Cristalli, C. Production line quality control using infrared imaging. Infrared Phys. Technol. 2015, 71, 416–423. [Google Scholar] [CrossRef]
- Chen, G.; Wang, C.; Zhang, L.; Arinez, J.; Xiao, G. Transient, Performance Analysis of Serial Production Lines with Geometric Machines. IEEE Trans. Autom. Control 2015, 61, 877–891. [Google Scholar] [CrossRef]
- Shin, K.Y.; Suh, S.H.; Choi, S.W. A unified system-framework engine for industrial instrumentation systems. Int. J. Comput. Integr. Manuf. 2017. [Google Scholar] [CrossRef]
- Yao, X.; Cui, J.; Yu, H.; Qi, X.; Mi, X.; Jiang, Y.; Wang, M.; Li, X. An improved accuracy-measuring method in manufacturing the lead screw of grating ruling engine. Precis. Eng. 2017. [Google Scholar] [CrossRef]
- Shui, H.; Jin, X.; Ni, J. Manufacturing productivity and energy efficiency: A stochastic efficiency frontier analysis. Int. J. Energy Res. 2015, 39, 1649–1663. [Google Scholar] [CrossRef]
- Chen, Q.; Liao, S.L.; Wu, Z.Z.; Yi, S.P. Comparative analysis of the performance of a novel, U-shaped ‘chasing-overtaking’ production line. Int. J. Prod. Res. 2016, 54, 1–14. [Google Scholar] [CrossRef]
- Ham, W.K.; Ko, M.; Sang, C.P. A framework for simulation-based engine-control unit inspection in manufacturing phase. Control Eng. Pract. 2017, 59, 137–148. [Google Scholar] [CrossRef]
- Alrabghi, A.; Tiwari, A.; Savill, M. Simulation-based optimisation of maintenance systems: Industrial case studies. J. Manuf. Syst. 2017, 44, 191–206. [Google Scholar] [CrossRef]
- Haneef, M.D.; Randall, R.B.; Smith, W.A.; Peng, Z. Vibration and Wear Prediction Analysis of IC Engine Bearings by Numerical Simulation. Wear 2017. [Google Scholar] [CrossRef]
- Boysen, N.; Fliedner, M.; Scholl, A. Assembly line balancing: Which model to use when. Int. J. Prod. Econ. 2008, 111, 509–528. [Google Scholar] [CrossRef]
- Borisovsky, P.A.; Delorme, X.; Dolgui, A. Genetic algorithm for balancing reconfigurable machining lines. Comput. Ind. Eng. 2013, 66, 541–547. [Google Scholar] [CrossRef]
- Peng, J. Mixed Production Line Balancing and Optimization Based on Flexsim. Mod. Mach. Tool Autom. Manuf. Tech. 2014, 9, 140–143. (In Chinese) [Google Scholar]
- Yang, J.B.; Xu, D.L. On the evidential reasoning algorithm for multiple attribute decision analysis under uncertainty. IEEE Trans. Syst. Man Cybern. Part A Syst. Hum. 2002, 32, 289–304. [Google Scholar] [CrossRef]
- Wu, B.; Yan, X.; Wang, Y.; Soares, C.G. An Evidential Reasoning-Based CREAM to Human Reliability Analysis in Maritime Accident Process. Risk Anal. 2017. [Google Scholar] [CrossRef] [PubMed]
- Zhang, M.J. A general evidential reasoning algorithm for multi-attribute decision analysis under interval uncertainty. Eur. J. Oper. Res. 2017, 257, 1005–1015. [Google Scholar] [CrossRef]
- Liu, F.; Zhu, W.D.; Chen, Y.W.; Xu, D.L.; Yang, J.B. Evaluation, ranking and selection of, R&D projects by multiple experts: An evidential reasoning rule based approach. Scientometrics 2017, 111, 1–19. [Google Scholar] [CrossRef]
- Nodoust, S.; Mirzazadeh, A.; Weber, G.W. An evidential reasoning approach for production modeling with deteriorating and ameliorating items. Oper. Res. 2017, 1–19. [Google Scholar] [CrossRef]
- Gilenson, M.; Hassoun, M.; Yedidsion, L. Setting defect charts control limits to balance cycle time and yield for a tandem production line. Comput. Oper. Res. 2015, 53, 301–308. [Google Scholar] [CrossRef]
- Kovalev, S.; Delorme, X.; Dolgui, A.; Oulamara, A. Minimizing the number of stations and station activation costs for a production line. Comput. Oper. Res. 2017, 79, 131–139. [Google Scholar] [CrossRef]
- Andres, C.; Miralles, C.; Pastor, R. Balancing and scheduling tasks in assembly lines with sequence-dependent setup times. Eur. J. Oper. Res. 2008, 187, 1212–1223. [Google Scholar] [CrossRef]
- Battaia, O.; Dolgui, A. A taxonomy of line balancing problems and their solution approaches. Int. J. Prod. Econ. 2013, 142, 259–277. [Google Scholar] [CrossRef]
- Boysen, N.; Fliedner, M. A versatile algorithm for assembly line balancing. Eur. J. Oper. Res. 2008, 184, 39–56. [Google Scholar] [CrossRef]
- Fan, L.; Shen, D.; Jian, X.; Chen, Y.; Hui, Q.; Zhang, Z.Z. Based on Simulafion in a Balanced Improvement of Engine Hybrid Production Line. Mod. Mach. Tool Autom. Manuf. Tech. 2016, 8, 118–123. (In Chinese) [Google Scholar]
- Cheng, B.; Jiang, J.; Tan, Y.J.; Lu, Y.J. A novel approach for WSoS capability requirement satisfactory degree evaluation using evidential reasoning. Syst. Eng. Theory Pract. 2011, 31, 2210–2216. (In Chinese) [Google Scholar]


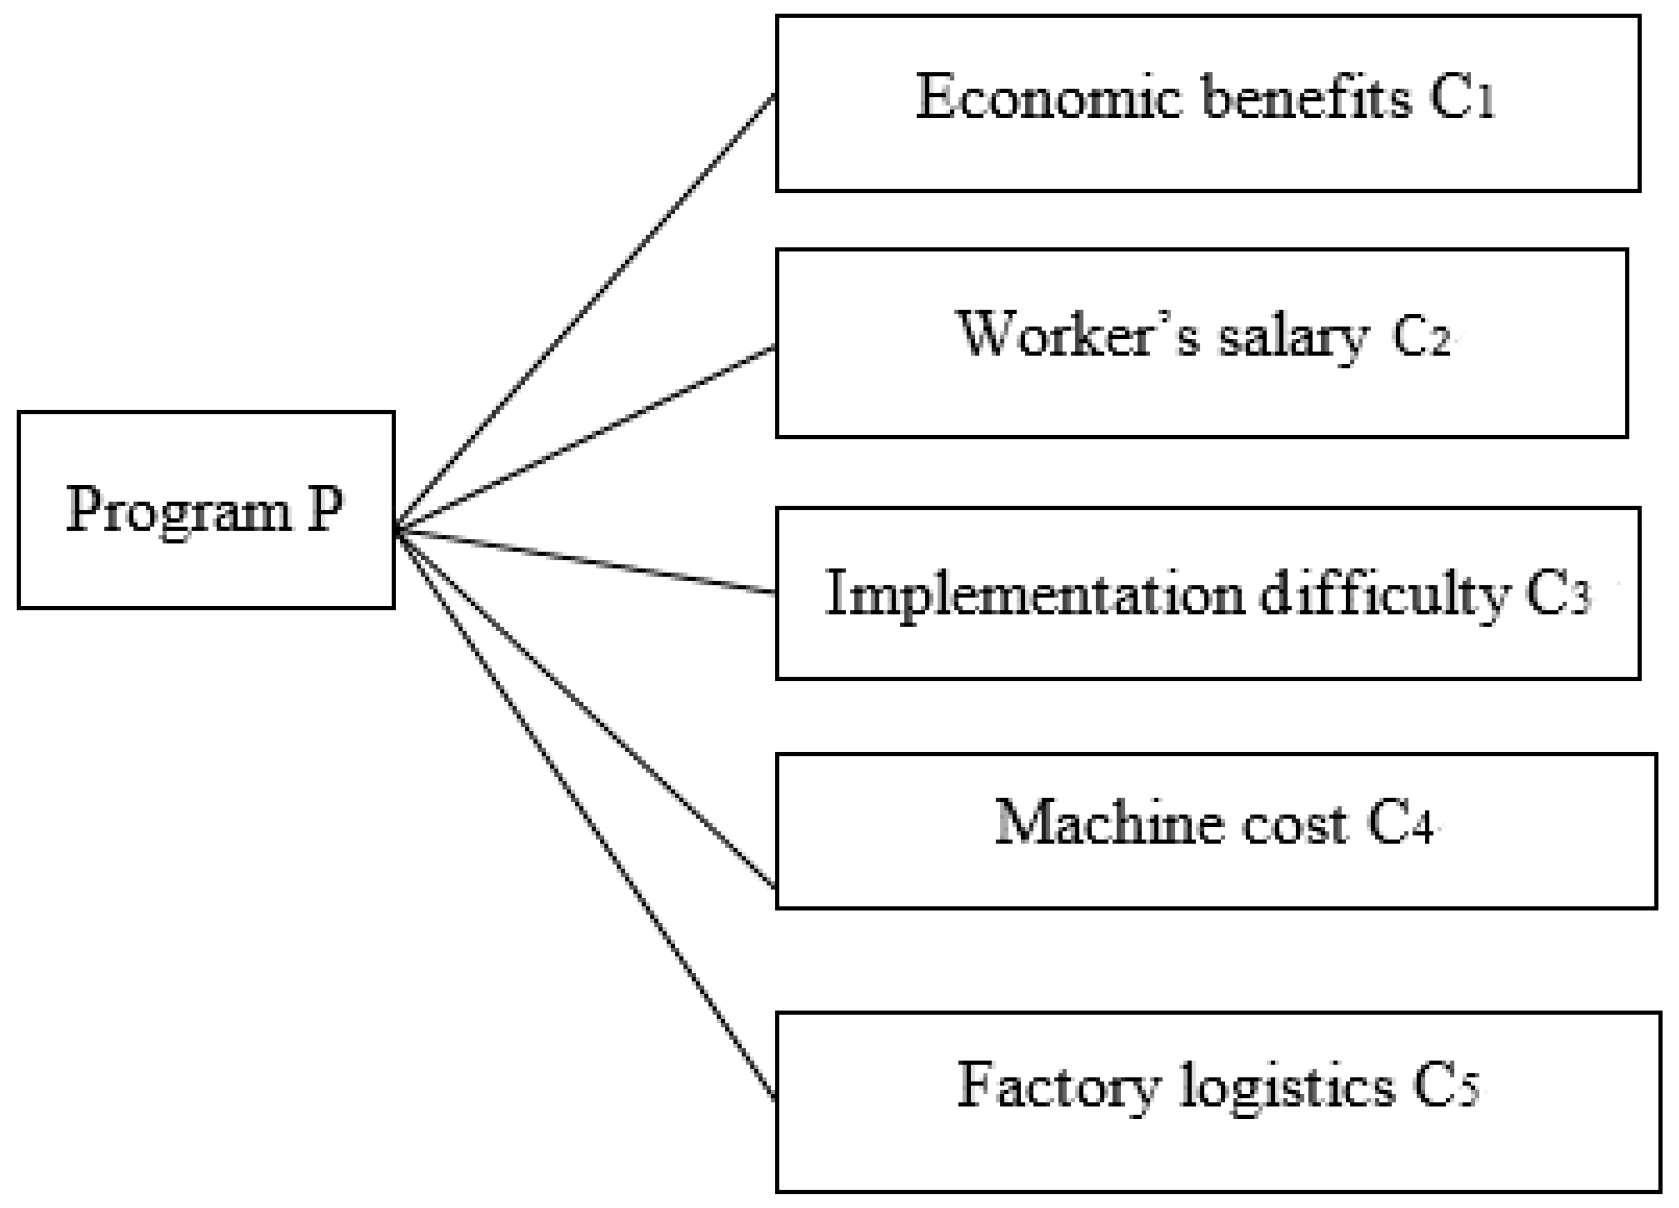
| Code | Influencing Factors’ Capability Name | Capability Value |
|---|---|---|
| P | Total capacity of the plan | (high, low) |
| C1 | Economic benefits | (high, low) |
| C2 | Worker’s salary | (high, low) |
| C3 | Implementation difficulty | (high, low) |
| C4 | Machine cost | (high, low) |
| C5 | Factory logistics | (high, low) |
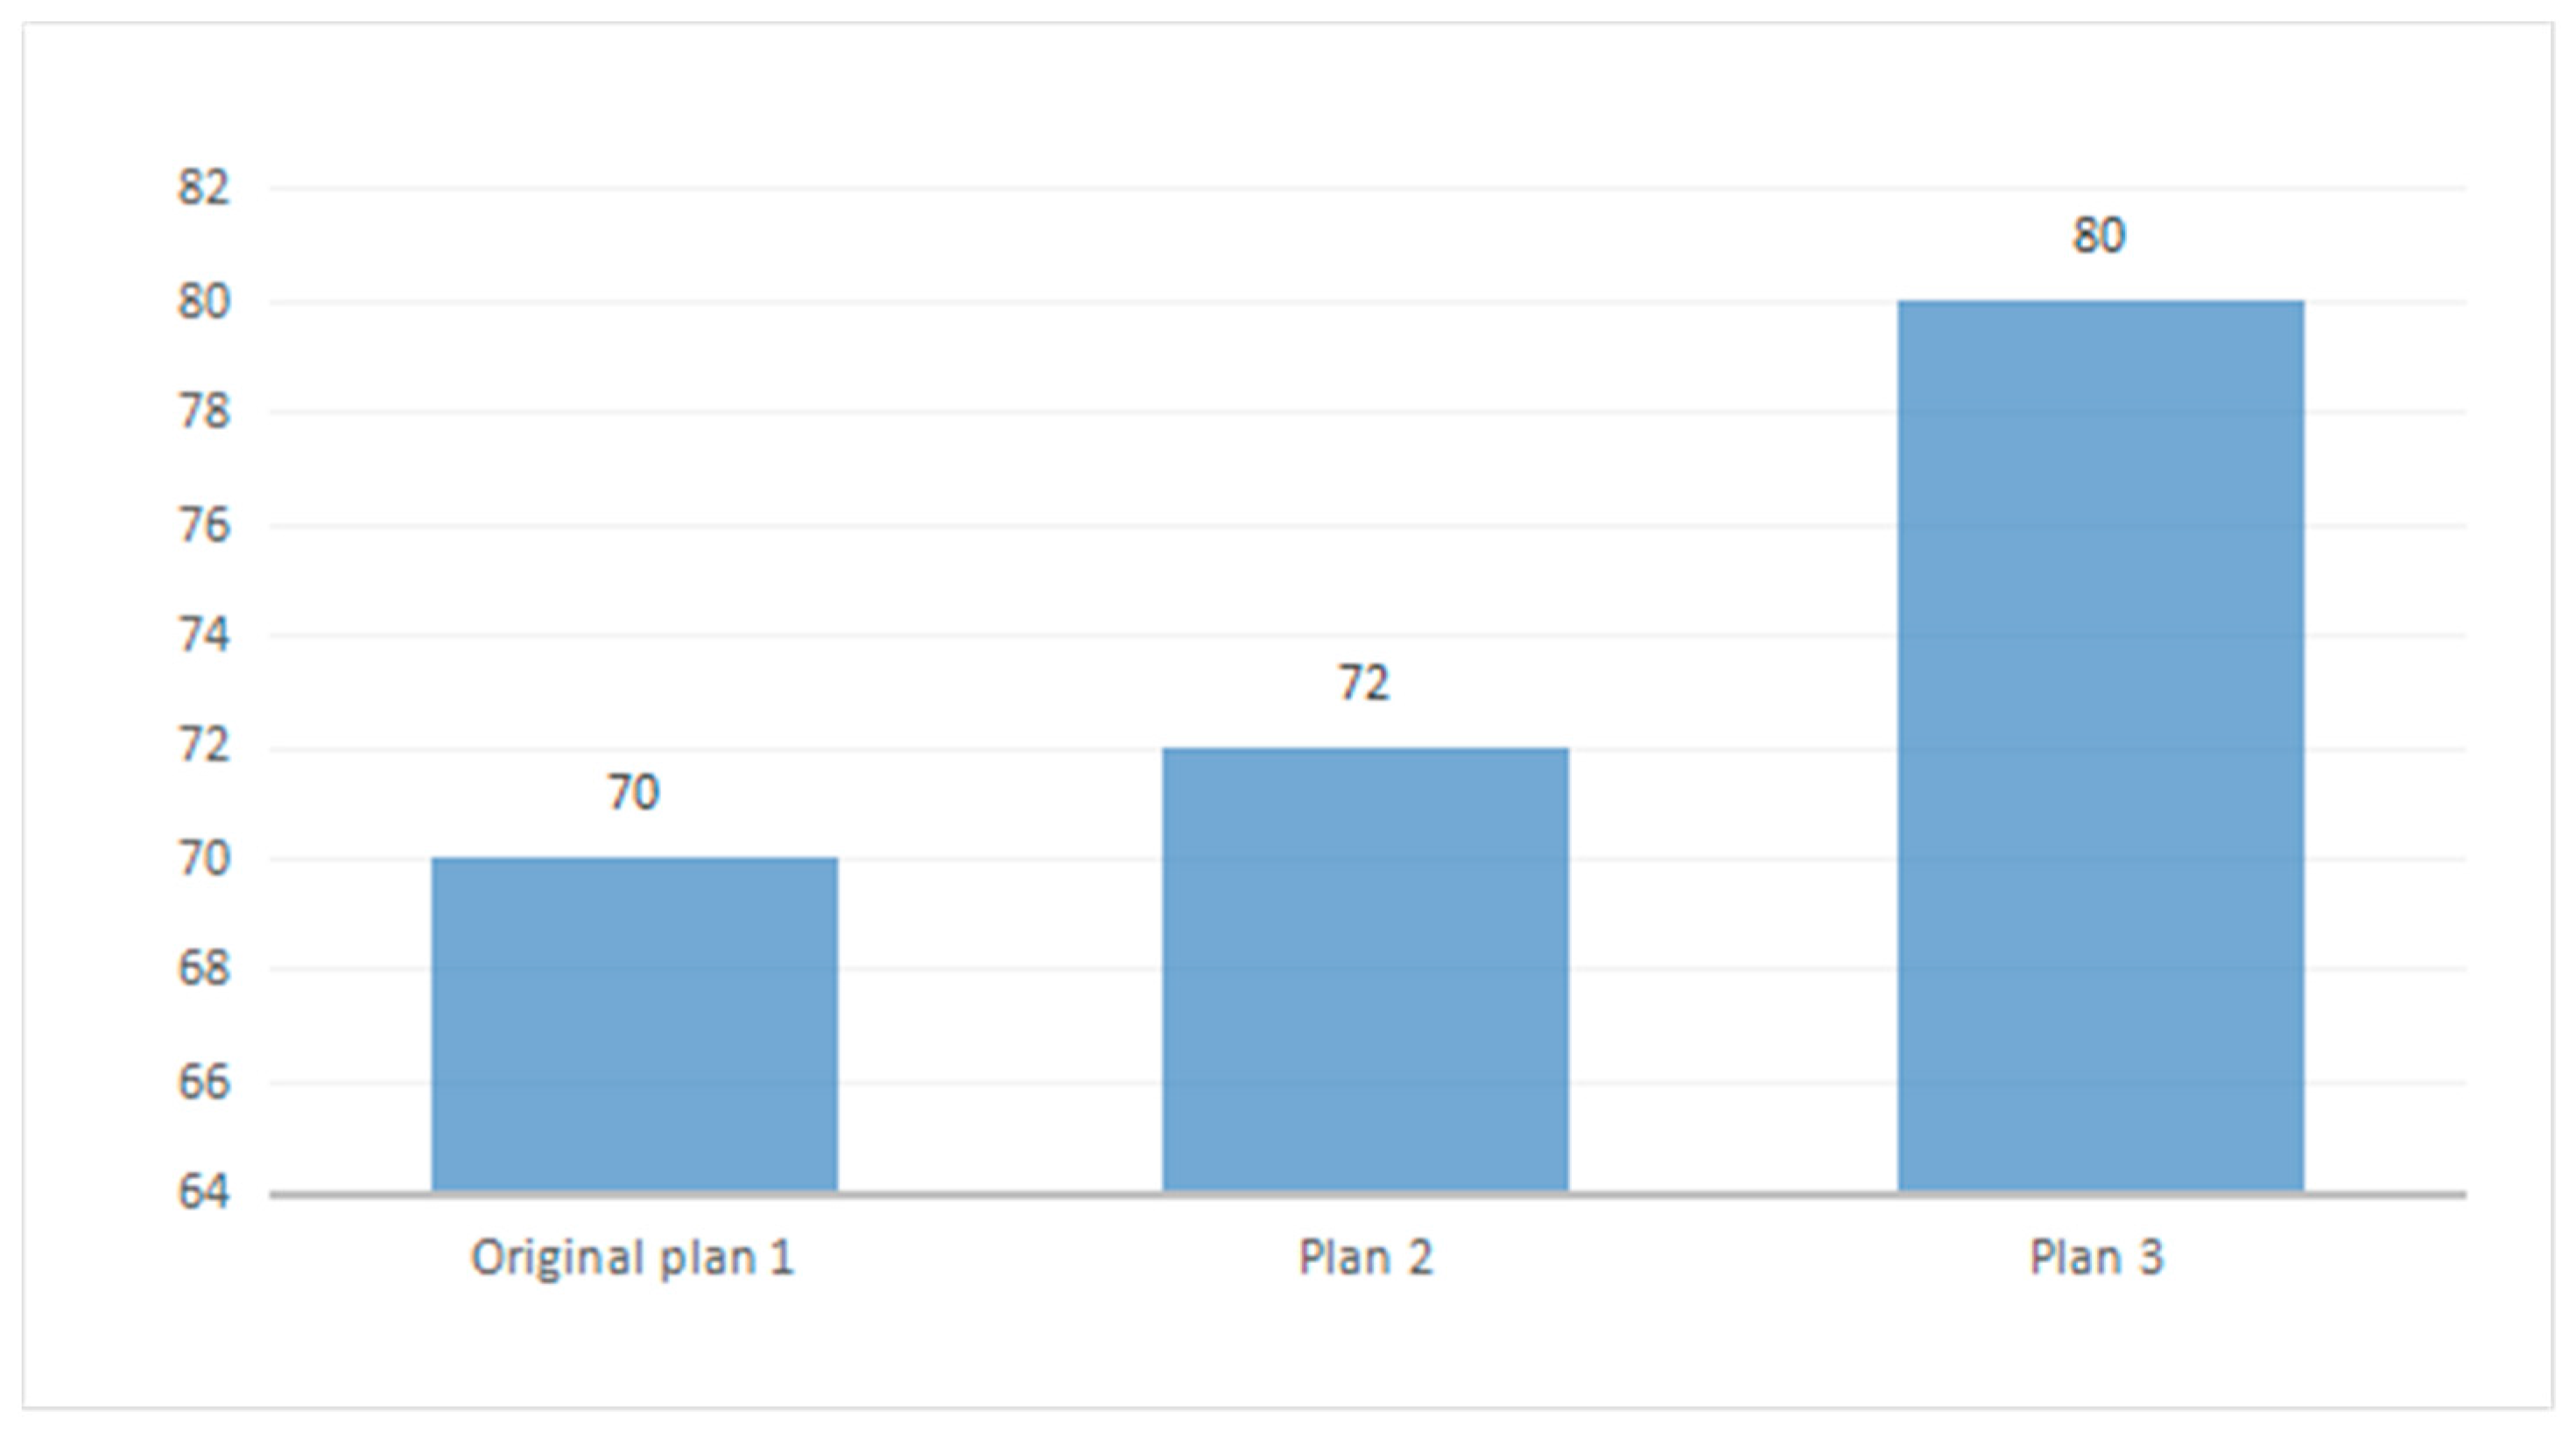
| Plans | Daily Production (Unit) |
|---|---|
| Original plan 1 | 70 |
| Plan 2 | 72 |
| Plan 3 | 80 |
© 2017 by the authors. Licensee MDPI, Basel, Switzerland. This article is an open access article distributed under the terms and conditions of the Creative Commons Attribution (CC BY) license (http://creativecommons.org/licenses/by/4.0/).
Share and Cite
Zhou, Z.; Dou, Y.; Sun, J.; Jiang, J.; Tan, Y. Sustainable Production Line Evaluation Based on Evidential Reasoning. Sustainability 2017, 9, 1811. https://doi.org/10.3390/su9101811
Zhou Z, Dou Y, Sun J, Jiang J, Tan Y. Sustainable Production Line Evaluation Based on Evidential Reasoning. Sustainability. 2017; 9(10):1811. https://doi.org/10.3390/su9101811
Chicago/Turabian StyleZhou, Zhexuan, Yajie Dou, Jianbin Sun, Jiang Jiang, and Yuejin Tan. 2017. "Sustainable Production Line Evaluation Based on Evidential Reasoning" Sustainability 9, no. 10: 1811. https://doi.org/10.3390/su9101811
APA StyleZhou, Z., Dou, Y., Sun, J., Jiang, J., & Tan, Y. (2017). Sustainable Production Line Evaluation Based on Evidential Reasoning. Sustainability, 9(10), 1811. https://doi.org/10.3390/su9101811


