1. Introduction
There are many applications of hydrogen: for example, it can be used for long-term energy storage, as an energy carrier that can be converted again to electricity using fuel cells, or as an industrial feedstock for fertilizer production or food processing [
1,
2]. One suggested usage of hydrogen is as a fuel since it creates no greenhouse gas emissions at the point of use [
3,
4,
5,
6]. However, commercialisation of hydrogen as an alternative fuel is not easy as it is still expensive compared with fossil fuels (the price of hydrogen from wind-powered electrolysis is
$7–11/kg at present, with the US DOE setting a target for future costs of
$3–4/kg) [
7,
8,
9]. Most of the cost of electrolytic hydrogen comes from the capital expenditure on equipment and the electricity cost. For a large-scale system, the electricity cost has greater impact than the capital cost [
10,
11]. Many studies have analysed the concept of applying electrolysers to counteract variable renewable energy generation, to supply grid services, and derive revenue from differences in peak and off-peak electricity prices [
12,
13,
14]. These studies reveal that there are possibilities for electrolysers to absorb off-peak (lower cost) electricity for hydrogen production through the use of different electricity markets and electricity rate structures, as well as consuming surplus renewable energy.
Hydrogen production from electricity systems with high wind energy penetration has been widely investigated, since such systems require a high level of flexibility to accommodate the fluctuations of wind power generation [
15,
16]. For example, production of hydrogen from excess electricity in the Irish electrical system was investigated and it was shown that, to reach profitability, low electricity price and high hydrogen selling price are required and also the use of some non-curtailed or peak-time power is necessary [
17]. The off-peak electrolysis operation could lead to a reduction in the hydrogen cost, as studied in the case of the Danish system [
18] and also in the Canadian context [
19]. In these studies, production of hydrogen at the forecourt, using off-peak electricity, was investigated and different scenarios of electricity price were tested. These ranged from
$0.01/kWh to
$0.24/kWh and varied hourly. The 563 MW wind-hydrogen and storage model was proposed under real wind energy data in Canada [
20]. The price extracted from this scenario is
$9.00/kgH
2, if the wind turbine capital cost is added to the total cost, and
$3.37/kgH
2 if the turbine cost is excluded. Taking into account the hourly hydrogen demand, they concluded that using off-peak electricity hardly reduced the variable cost and yet required more storage, more compressors and a larger electrolyser system, which led to an increase in the investment cost [
21]. Combining the wind-generated electricity with utility-supplied power was also tested using fixed peak and off-peak times [
22].
Like much of the Middle East, Libya is a country whose economy has been heavily dependent upon the export of fossil fuels and it must therefore plan carefully for a future beyond conventional fuel dependency. Yet, compared to other areas, there has been little investigation of electrolytic hydrogen production in the Middle East, where most studies focus on the possibility of hydrogen production from renewable energy without any consideration of the flexible operation of electrolyser or applications for the hydrogen such as replacement of fossil fuels [
23]. For example, wind energy data in Algeria suggests there is the opportunity to produce a large amount of hydrogen, which could be used for many applications [
24]. Another study investigated the usage of hydrogen as a fuel in Algeria and revealed that improvements in technology and advances in manufacturing could to lead to the development of a transport sector fueled by hydrogen [
25]. An investigation of hydrogen production from wind turbines has been has been carried out for the Sistan & Baluchestan area in south eastern Iran. The analyses included 4 different wind turbines with a capacity of
in five areas of the state (Dalgan, Lutak, Mil-Nader, Nosratabad and Zahedan). The result showed that the highest annual hydrogen production (39.82 ton) would be achieved at Lutak, which has the largest wind turbine capacity is [
23].
In coming years, it is expected that a transition from combustion engines fuelled by conventional fuels to electric cars will occur. Hydrogen could play an important role in this transition. Automobile manufacturers have made substantial progress in the improvement of fuel cell vehicles and have been carrying out initial marketing during the 2015–2017 period [
26]. As the anticipated fuel for the transportation sector, hydrogen allows for the operation of cars with fast fuelling and zero tailpipe emissions, which is not possible with other types of zero-emission transport, such as battery-only electric vehicles [
5].
This paper concerns the extent to which the flexible operation of electrolysers consumes electricity that would otherwise be curtailed and produces hydrogen at an appropriate price such that it can provide a clean substitute for conventional fuel in Libya. Tariff structures can be used to incentivise the operation of electrolysers as controllable (dispatchable) loads. This paper compares the cost of hydrogen production by electrolysis at garage forecourts under both dispatchable and continuous operation, while ensuring no interruption of fuel supply to fuel cell vehicles in a future Libya.
2. Renewable Energy Potentials in Libya
Libya has a large potential for generating renewable energy from its wind and solar resources, according to currently available information. Libya has a massive land area of around 1,759,540 km
2 with a long coastline of and nearly 2000 km
2 (88% of its territory) covered by desert [
27,
28,
29]. Data from the wind Atlas of Libya (version 1.03/2008) gives an estimation of mean wind speed in different cities, as presented in
Table 1. Generally, the average wind speeds fluctuate between 5 and 10 m/s in many Libyan regions.
The reasons for choosing Libya as a case study for this research include:
The need for Libya to wean itself off fossil fuels, which, apart from being environmentally damaging, are a limited resource that is too valuable as an export to expend on domestic energy markets. Indeed, the income from fossil fuels is vital for investing in a post-fossil-fuel future for the country.
Electrolytic hydrogen production could be particularly suitable for Libya, with its high solar radiation (2470 kWh/m
2/day), average wind speed (8 m/s in some areas) and abundant water (2000 km (1243 miles) of Mediterranean coastline) [
30].
According to data from the Renewable Energy Authority [
30,
31] of Libya, nearly 30% of its power is expected to be from the renewable sources by 2030. This conversion from fossil fuel power to renewable power could lead to instability in the electrical system without energy storage or DSR. The use of electrolyser for providing DSR services could be critical to balancing the grid.
3. Hydrogen Production Overview
Hydrogen can be produced on-site at a hydrogen refueling station or at a large centralised plant. Building a large centralised electrolyser could reduce the cost of hydrogen production, but on the other hand, the cost of transportation would increase [
32]. There are three main forms of hydrogen transportation, which are:
Compressed hydrogen in trailers,
Liquid hydrogen in tanker trucks,
Hydrogen pipelines.
Gaseous hydrogen can be transported in tube trailers, where it is inserted at pressures of 180 bar (~2600 psig), or higher, and into long cylinders that are stacked on a trailer that can be hauled by truck. Compressed hydrogen is very expensive because of the low energy density of the gas and high cost of compression. Gaseous hydrogen is liquefied by cooling it to below −253 °C (−423 °F), after which it can be stored in large highly-insulated tanks. Using current technology, liquefaction consumes more than 30% of the energy content of the hydrogen and it is expensive. In addition, some of the stored liquid hydrogen will be lost through evaporation or “boil off”. Over long distances, trucking liquid hydrogen is more economical than trucking gaseous hydrogen because a liquid tanker can hold a much larger mass of hydrogen than a gaseous tube trailer. Transporting gaseous hydrogen via existing pipelines is a low-cost option for delivering large volumes of hydrogen; however, the high initial capital costs of new pipeline construction constitute a major barrier to expanding hydrogen pipeline infrastructure [
33,
34,
35].
On-site hydrogen production reduces costs by eliminating the need for transportation. It is the most appropriate technique in the initial phase of creating a hydrogen economy before the formation of a national hydrogen pipeline infrastructure. Hydrogen can be produced from many sources, with steam reforming currently being the cheapest method. However, this has some negative environmental impacts due to the feedstock being a fossil fuel. The hydrogen production method with lowest greenhouse gas emissions is electrolysis, as long as the electricity consumed in the process comes from renewable sources [
36]. More information about hydrogen production, transportation and storage can be found in numerous previous studies [
37,
38].
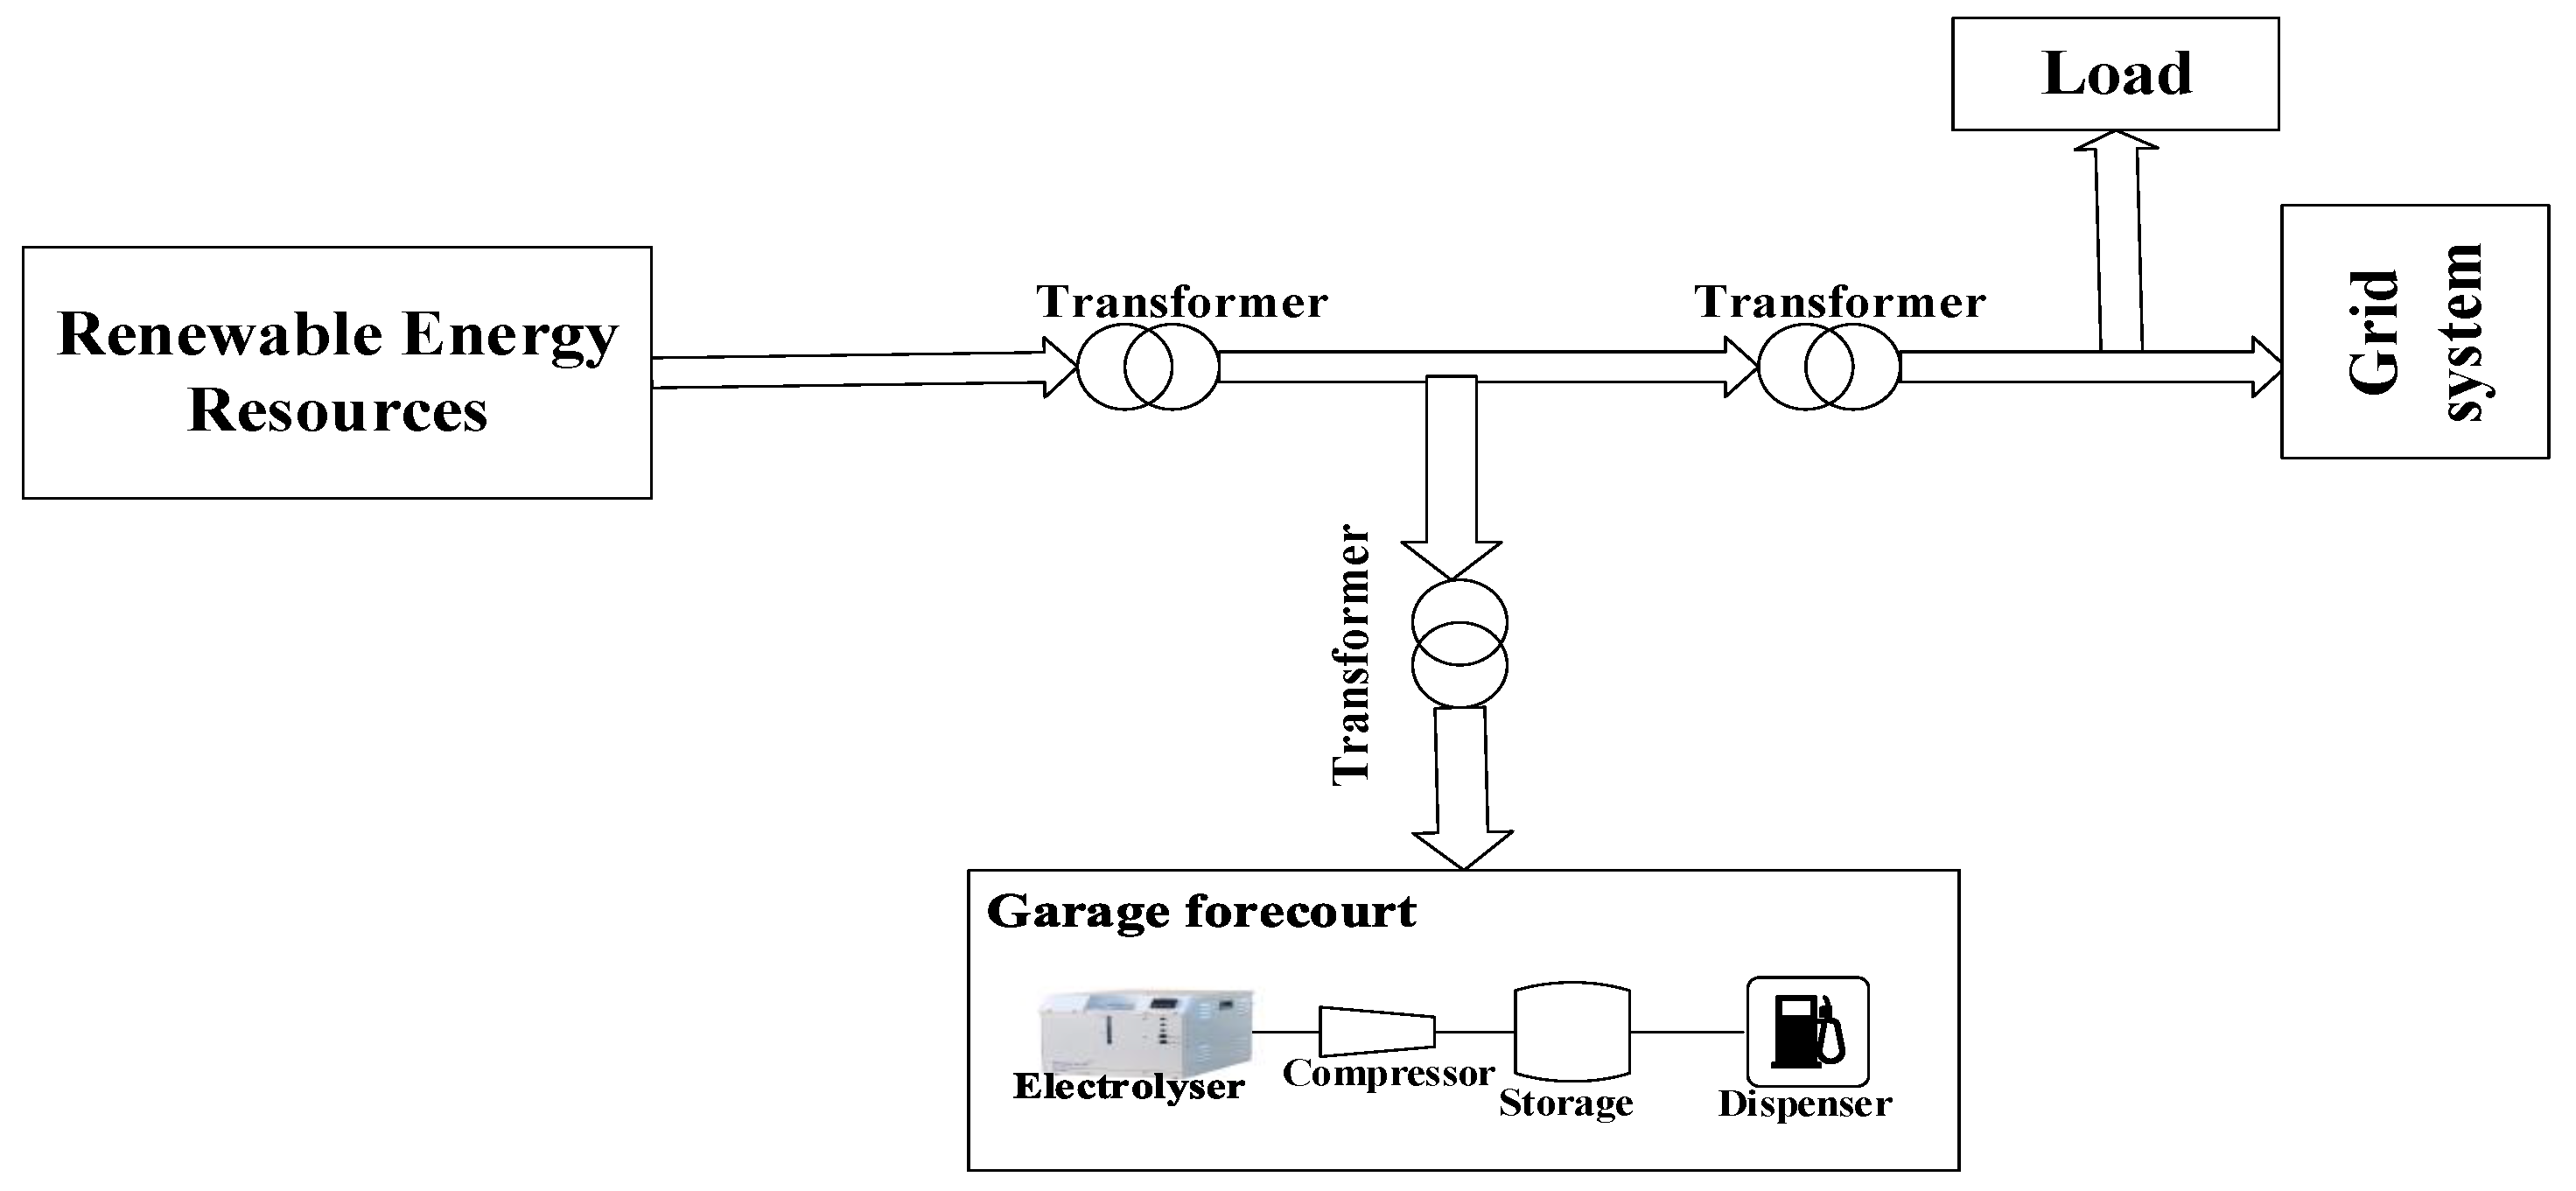
4. System Components
The system under consideration for this study consists of a simplified electricity network and a garage forecourt with an electrolyser and hydrogen store. Since the study focuses on comparative costs, control systems are ignored as they are cost-neutral in this analysis.
Figure 1 shows the system design.
4.1. Electricity Generation
The surplus power, after demand has been accounted for, will be used to produce hydrogen by electrolysis at garage forecourts. The main aim of this paper is to investigate the benefit of using only surplus power in contrast to standard, continuous electrolyser operation. Three scenarios will be tested:
- (1)
“Standard Continuous”, where the electrolyser is operated continuously on a standard all-day tariff of 12 p/kWh
- (2)
“Off-peak Only”, where it runs only during off-peak periods in a 2-tier tariff system at the lower price of 5 p/kWh
- (3)
“2-Tier Continuous”, operating continuously and paying a low tariff at off-peak times and a high tariff at other times
The time and the source of energy is an important factor in the “Off-Peak Only” and “2-Tier” price scenarios. However, in the “Standard Price” case, they make no difference since the price is fixed.
4.2. Wind Power
Hourly wind speed data for Benina Airport from 2013 was used for this paper. There are a large number of weather stations in Libya that not only gauge wind speed but also air pressure, ambient temperature, rainfall, and so on. The wind data were collected from Benina International Airport at a height of 10 m above ground level [
39]. However, wind turbine hubs are much higher than this level, and wind speed changes with height and due to friction from the terrain, buildings, etc., that can cause a slowing of airflow.
Data collected and used in previous studies confirms that the city of Derna, on the northeast coast of Libya, has a relatively high average wind speed of around 8 m/s. These studies agreed on the possibility of producing a large amount of wind power in this region [
29,
40].
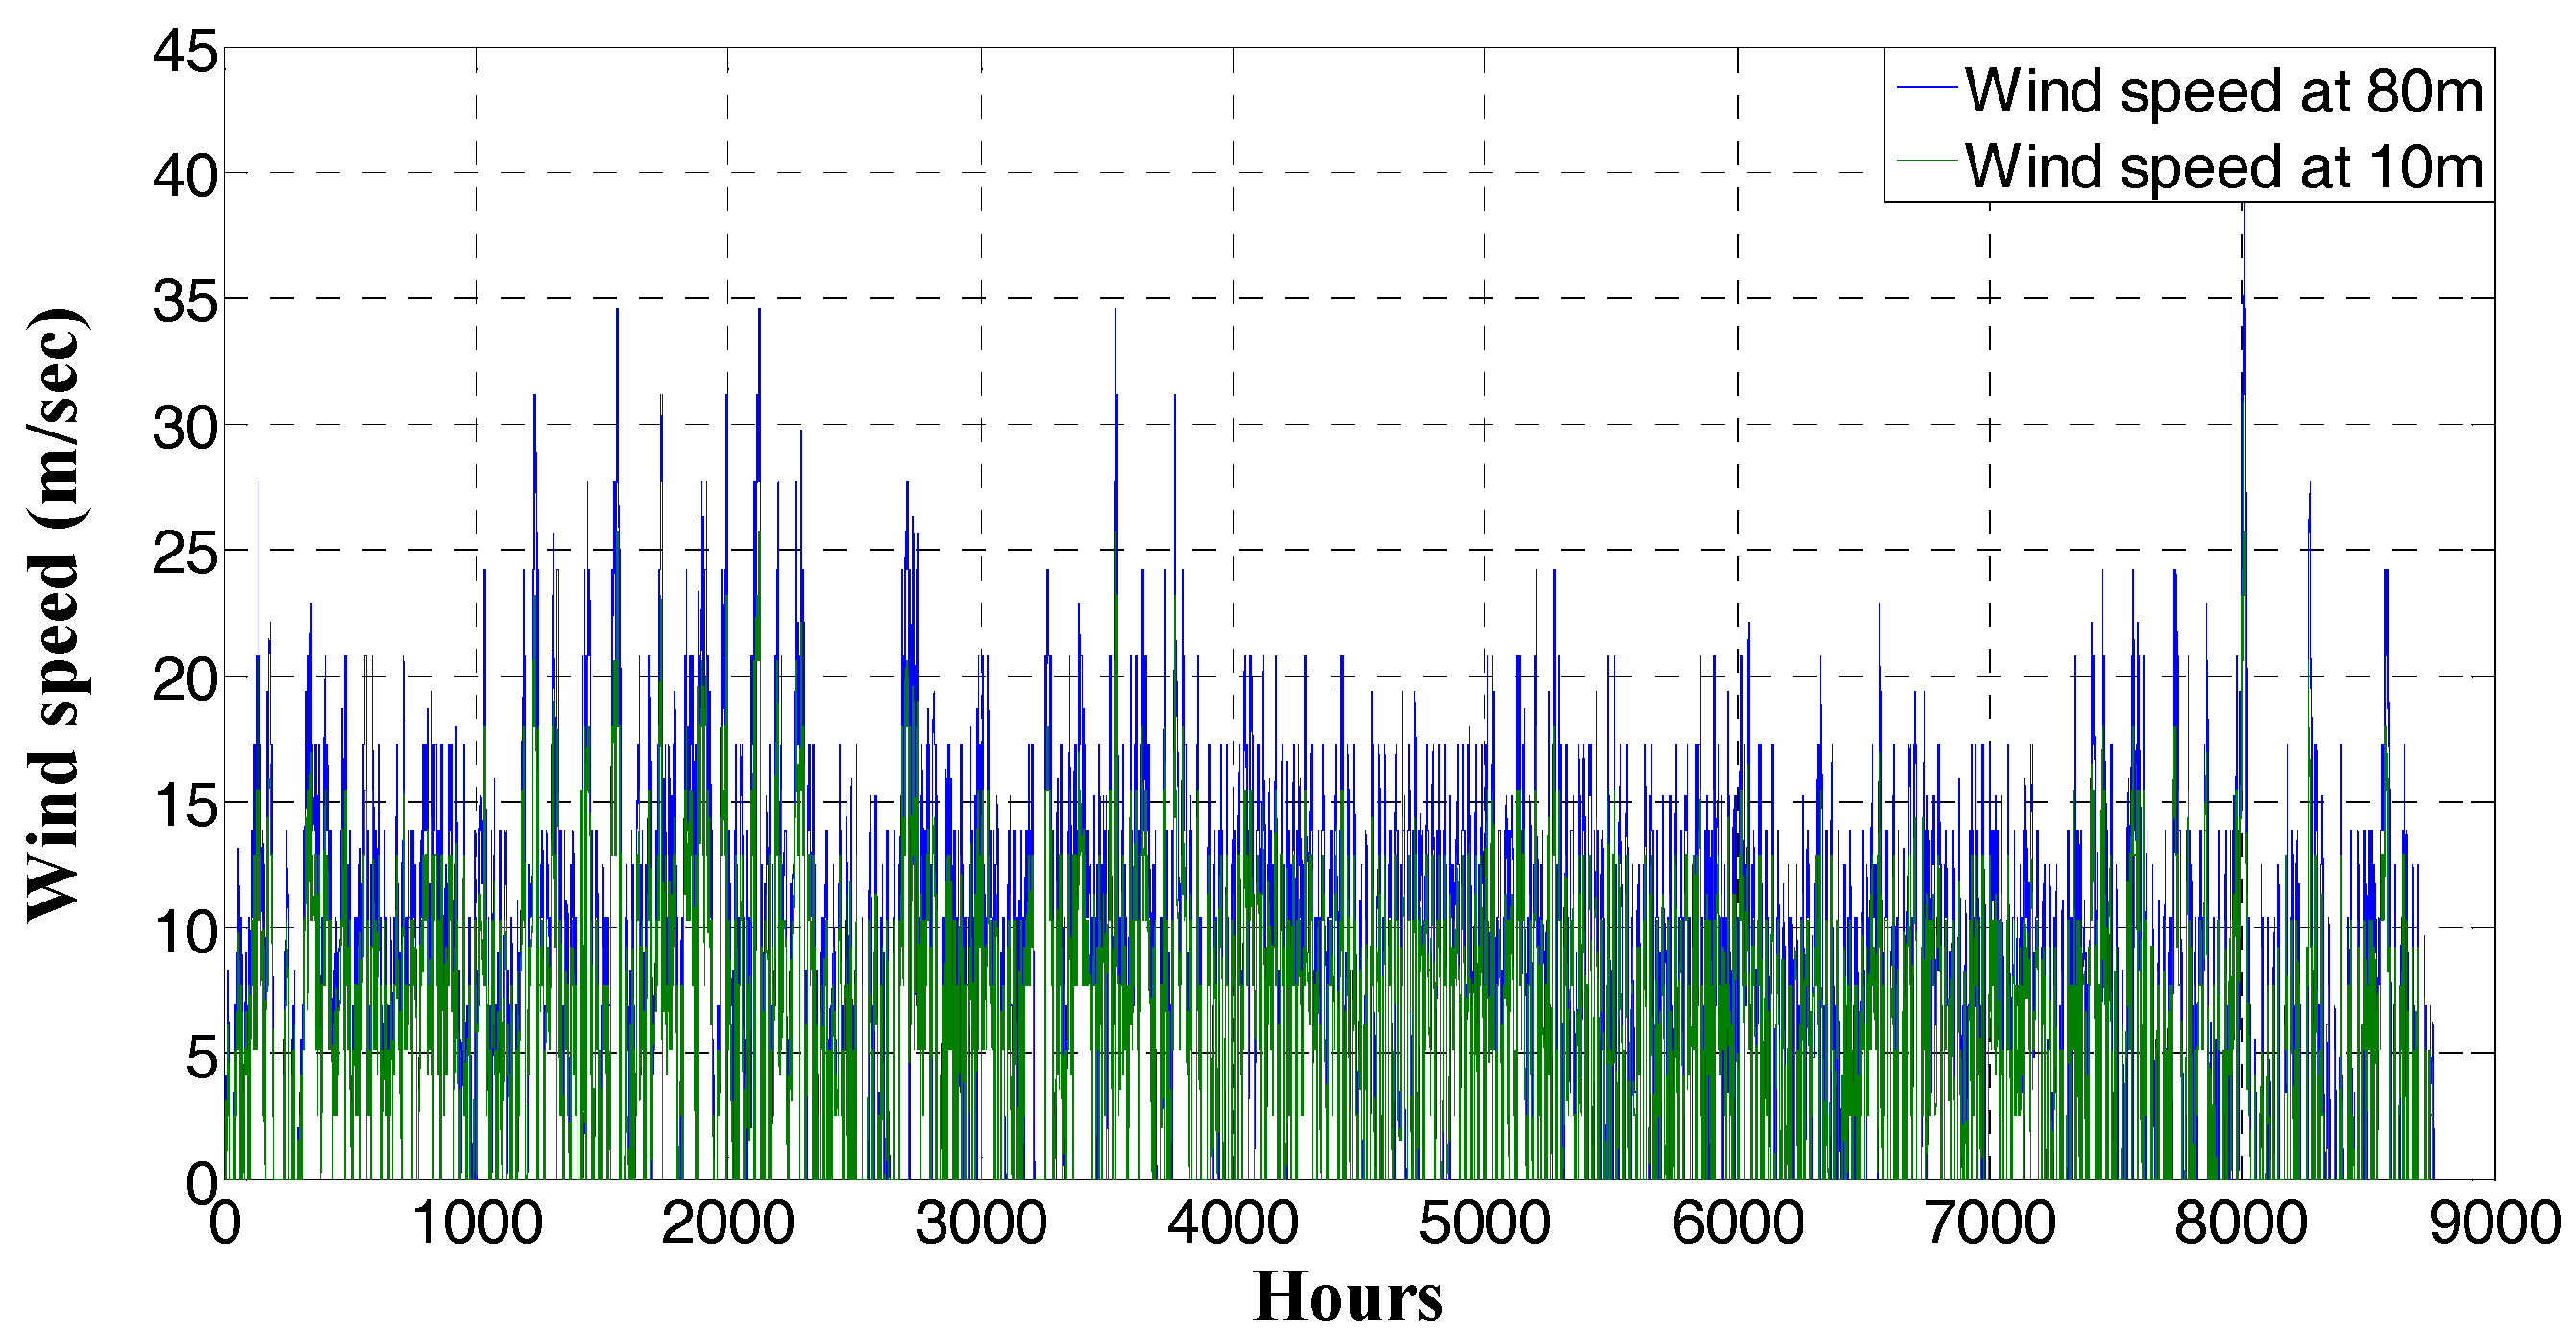
4.3. Wind Data Analysis
Raw hourly wind data was collected by the Met Office from Benina International Airport at a height of 10 m above ground level [
39]. However, since the hub of a wind turbine is much higher than this, the wind speed must be calculated at the hub height. There are two methods of calculating this [
41]: one is called the Power Law Profile and the other is the Logarithmic Law. The Power Law Profile will be used in this paper, as follows:
where,
is the original raw wind speed at 10 m,
is the adjusted wind speed at the turbine hub;
is the hub height, reasonably being assumed to be 80 m (from the project data), and
is the original measurement height (10 m) of the raw wind speed data;
n is the friction coefficient (it varies from 0.09 in smooth landscapes, to 0.41 high-friction topographies) [
42]. A friction coefficient of 1/7 is used in this research.
Figure 2 below shows the wind speed at 10 m and 80 m.
4.4. Calculating Potential Wind Power
The wind turbine output power can be calculated using this formula below [
43]:
where,
is power (kW),
is the power coefficient of the wind turbine;
is the average wind speed (m/s),
is the blades’ swept area (m
2) and
is the air density
[
40],
is the blade pitch angle,
is the turbine RPM,
is the turbine rotor diameter. The wind turbine operation is limited by its power curve, which is unique to each model. In this research, the TWT 1.65-82 turbine will be the example used since it is used in an existing wind power project in Libya. The technical details are given in
Table 2 below [
44]:
The capacity factor is important in determining how much energy can be produced. This step will help an engineer to decide on the economic feasibility of installing wind turbines on a specific area [
45]. The simple definition of capacity factor is the actual generated energy over a given time divided by the total energy the turbine would produce if it ran continuously at its rated output throughout the same period. It can be calculated using this equation [
46]:
where:
is the cut in speed;
is the rated speed;
is the cut out speed,
(shape factor) and
c (scale factor m/s) are Weibull parameters. In the next section, the calculation of Weibull parameters using different methods is discussed.
4.5. Statistical Analysis of Wind Speed
The Weibull probability distribution function method is widely used in the analysis of wind speed [
47]. The Weibull distribution function is given by:
where,
is the frequency or probability of occurrence of a given wind speed,
is the Weibull scale parameter, with unit equal to the wind speed,
is the unitless Weibull shape parameter, and
is the wind speed. A higher value of
indicates that the wind speed is higher, while the value of
shows the wind stability. The cumulative Weibull distribution function
gives the probability of the wind speed. It is expressed by:
However, before using Weibull equations, the scale factor
and shape factor
parameters should be determined first. There are a number of methods for calculating these parameters. In this research, different methods will be applied to check the accuracy of calculation [
48]. Weibull parameter calculation methods and their parameter values are presented in
Table 3 below. Matlab code has been used to calculate Weibull parameters using different methods.
Where:
a and
b are coefficients of straight line,
n is number of nonzero wind speeds,
is the wind speed,
is the standard deviation,
is the mean wind speed,
is gamma function,
is the energy pattern factor and based on the literature
is between 1.45 and 4.4 for most wind distribution in the world [
48]. The wind speed, standard deviation and gamma function are calculated by Equations (8)–(10).
The maximum likelihood result was used in this paper. After calculating the Weibull parameters, the wind turbine capacity factor can be calculated as in Equation (5). The annual energy that can be generated from this turbine is
where
is the rated turbine power (1.65 MW in this case). This paper uses only daily wind profiles due in part to the lack of data, especially demand data, from the Libyan electricity company and hourly output data from Libyan renewables. More importantly, hourly resolution is not needed for this paper, which focusses on grid balancing at a diurnal timescale as there are other DSR and storage options that are more energy-efficient and cost-effective at shorter timescales. While it may be the case that an electrolyser can also provide frequency response as a by-product capability, it would not be competitive as a provider of short-timescale DSR as its primary function. The case under investigation is not that of a micro-grid and the renewable energy generation feeds into the national power network. However, due to the lack of energy consumption data to cover the whole country, this study will deal with satisfying the regional demand in the Green Mountain area where any excess power will be exploited to produce hydrogen.
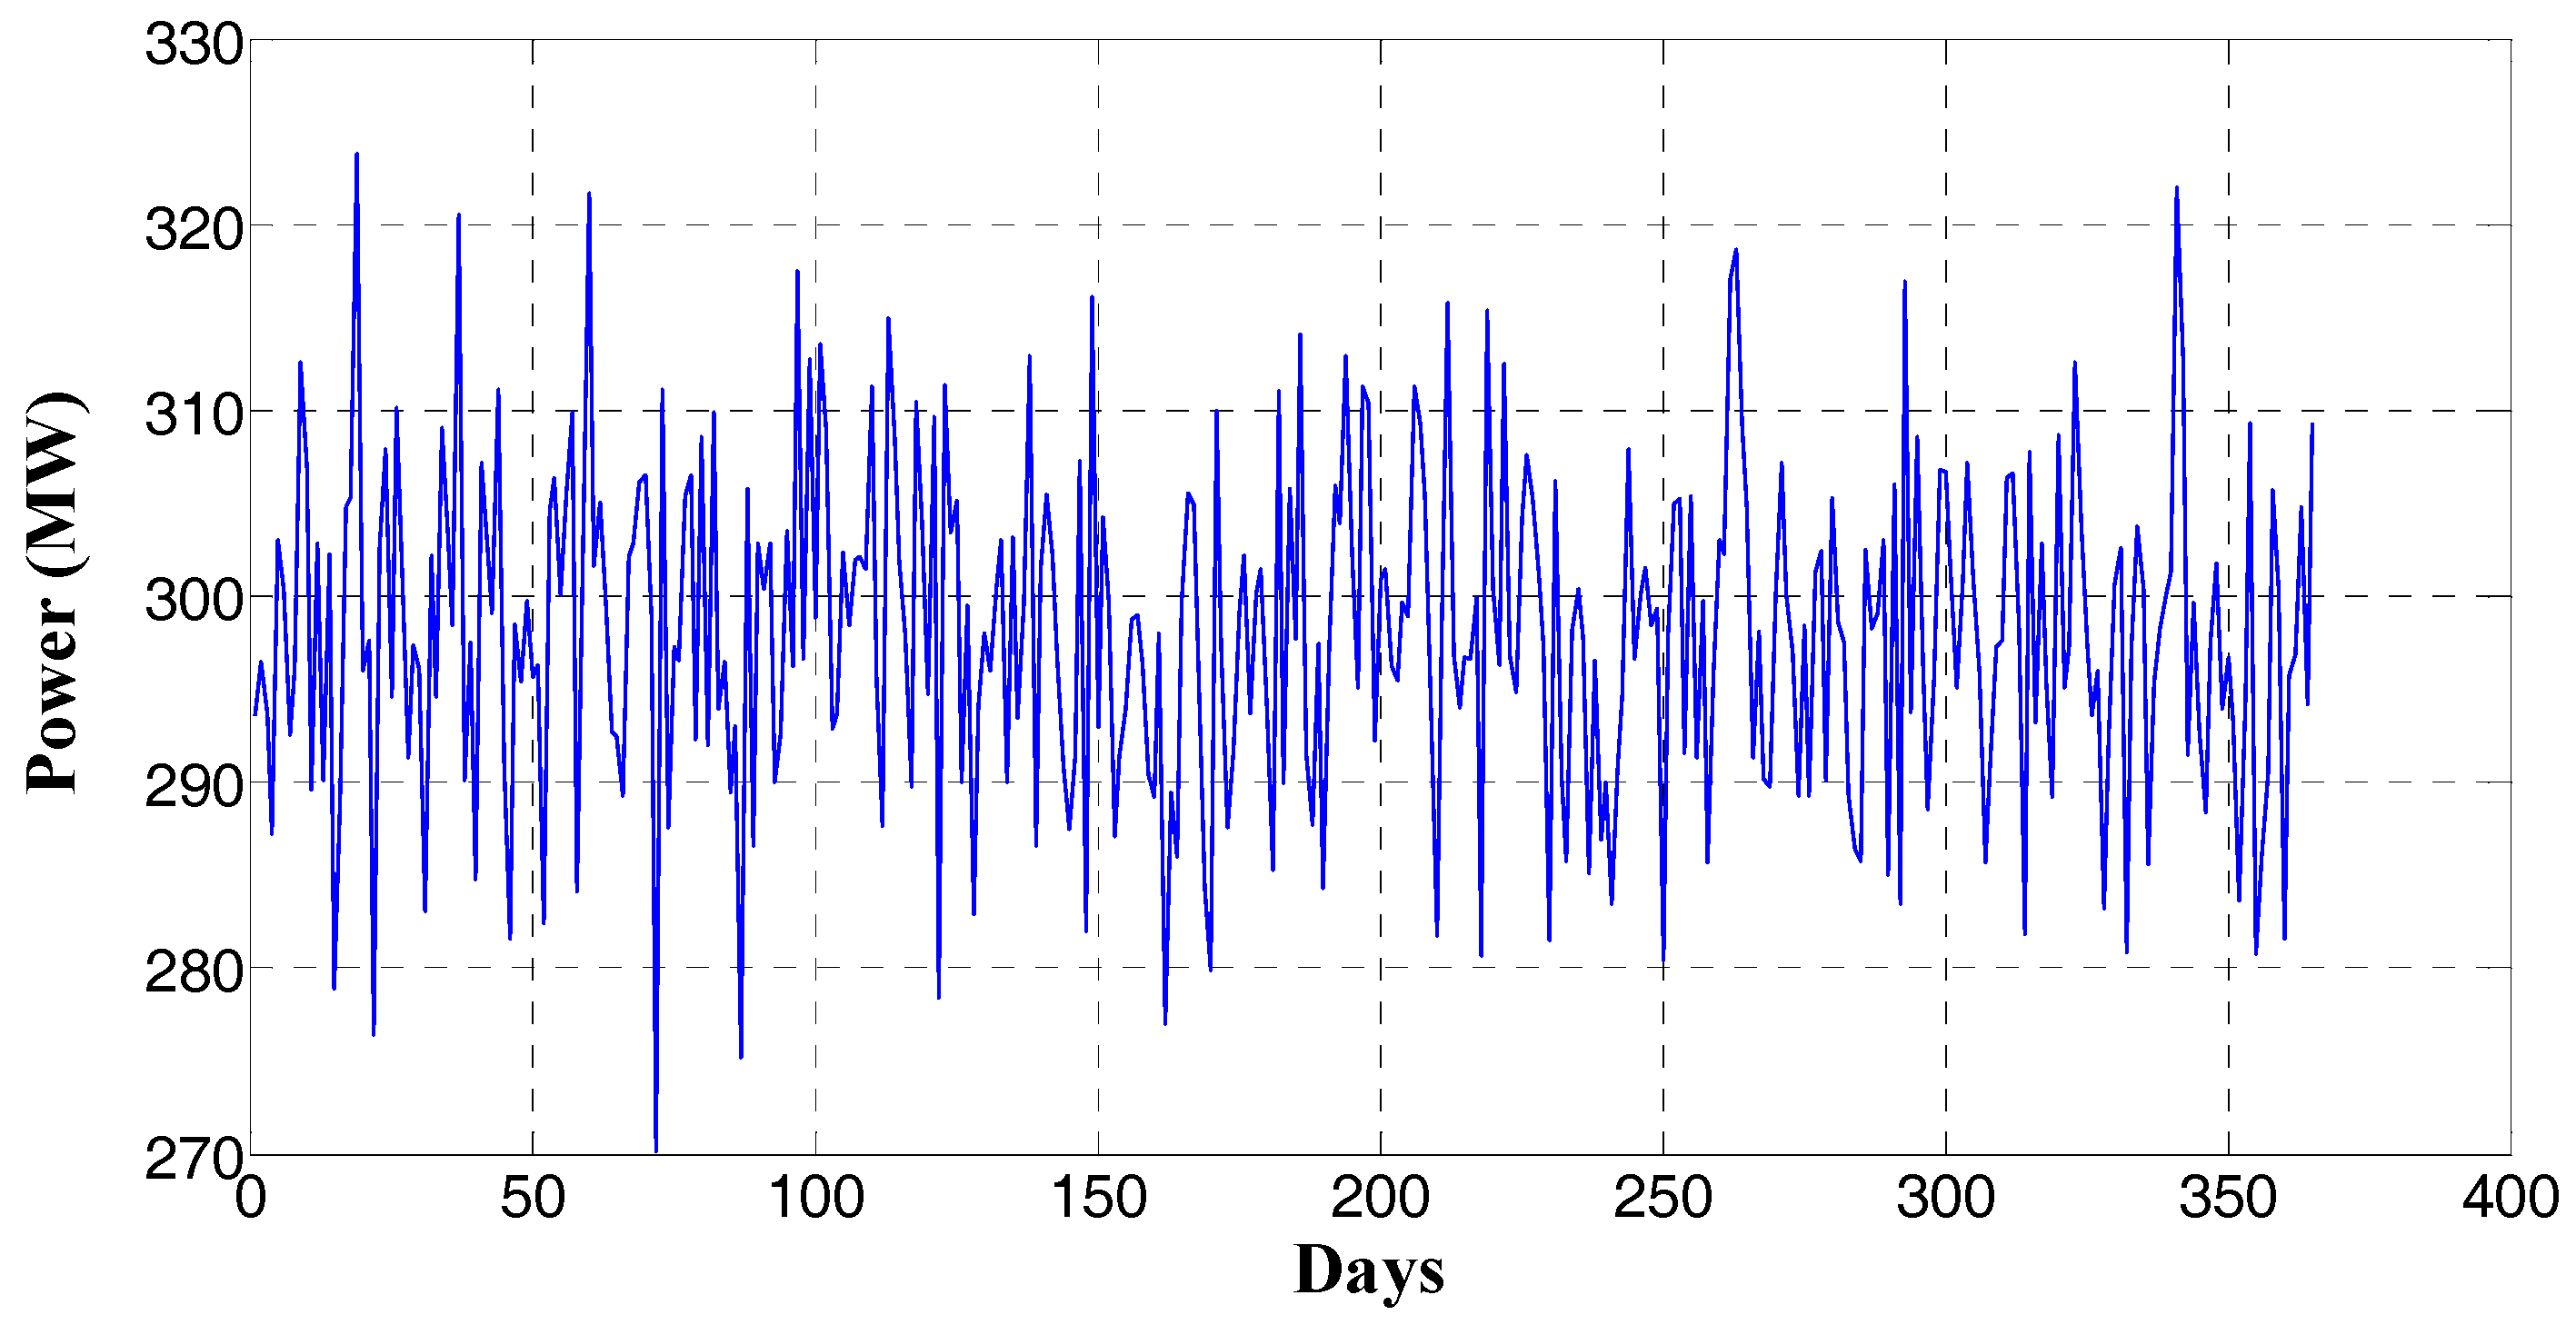
4.6. Energy Demand in Libya
The General Electricity Company of Libya (GECOL) divides the country into sub-regions depending on the number of customers, the number of fuel stations and number of employees. The consumption of the Green Mountain region represents nearly 6% of the total power consumption of Libya during the period of 2000–2007 [
49]. Annual reports are published in which average demand and other details can be found [
50].
This area was chosen for exploring the renewable energy and hydrogen production opportunities in Libya, as there are gaps in the data for other areas and, there are already some renewable energy projects in this area, especially in the city of Derna, and therefore some useful generation and consumption data is available [
40,
51]. The aim of this research is to develop a flexible model that can work with any region once the required data is available.
Figure 3 below shows the variation of daily energy demand of the Green Mountain region over a year, while
Table 4 presents a summary the demand data.
5. Sizing Wind Turbine System
In this section, we determine the overall wind capacity needed to meet demand, based on capacity factor and average power consumption. Once this power requirement is calculated, we can easily determine the number of wind turbines needed to provide this capacity.
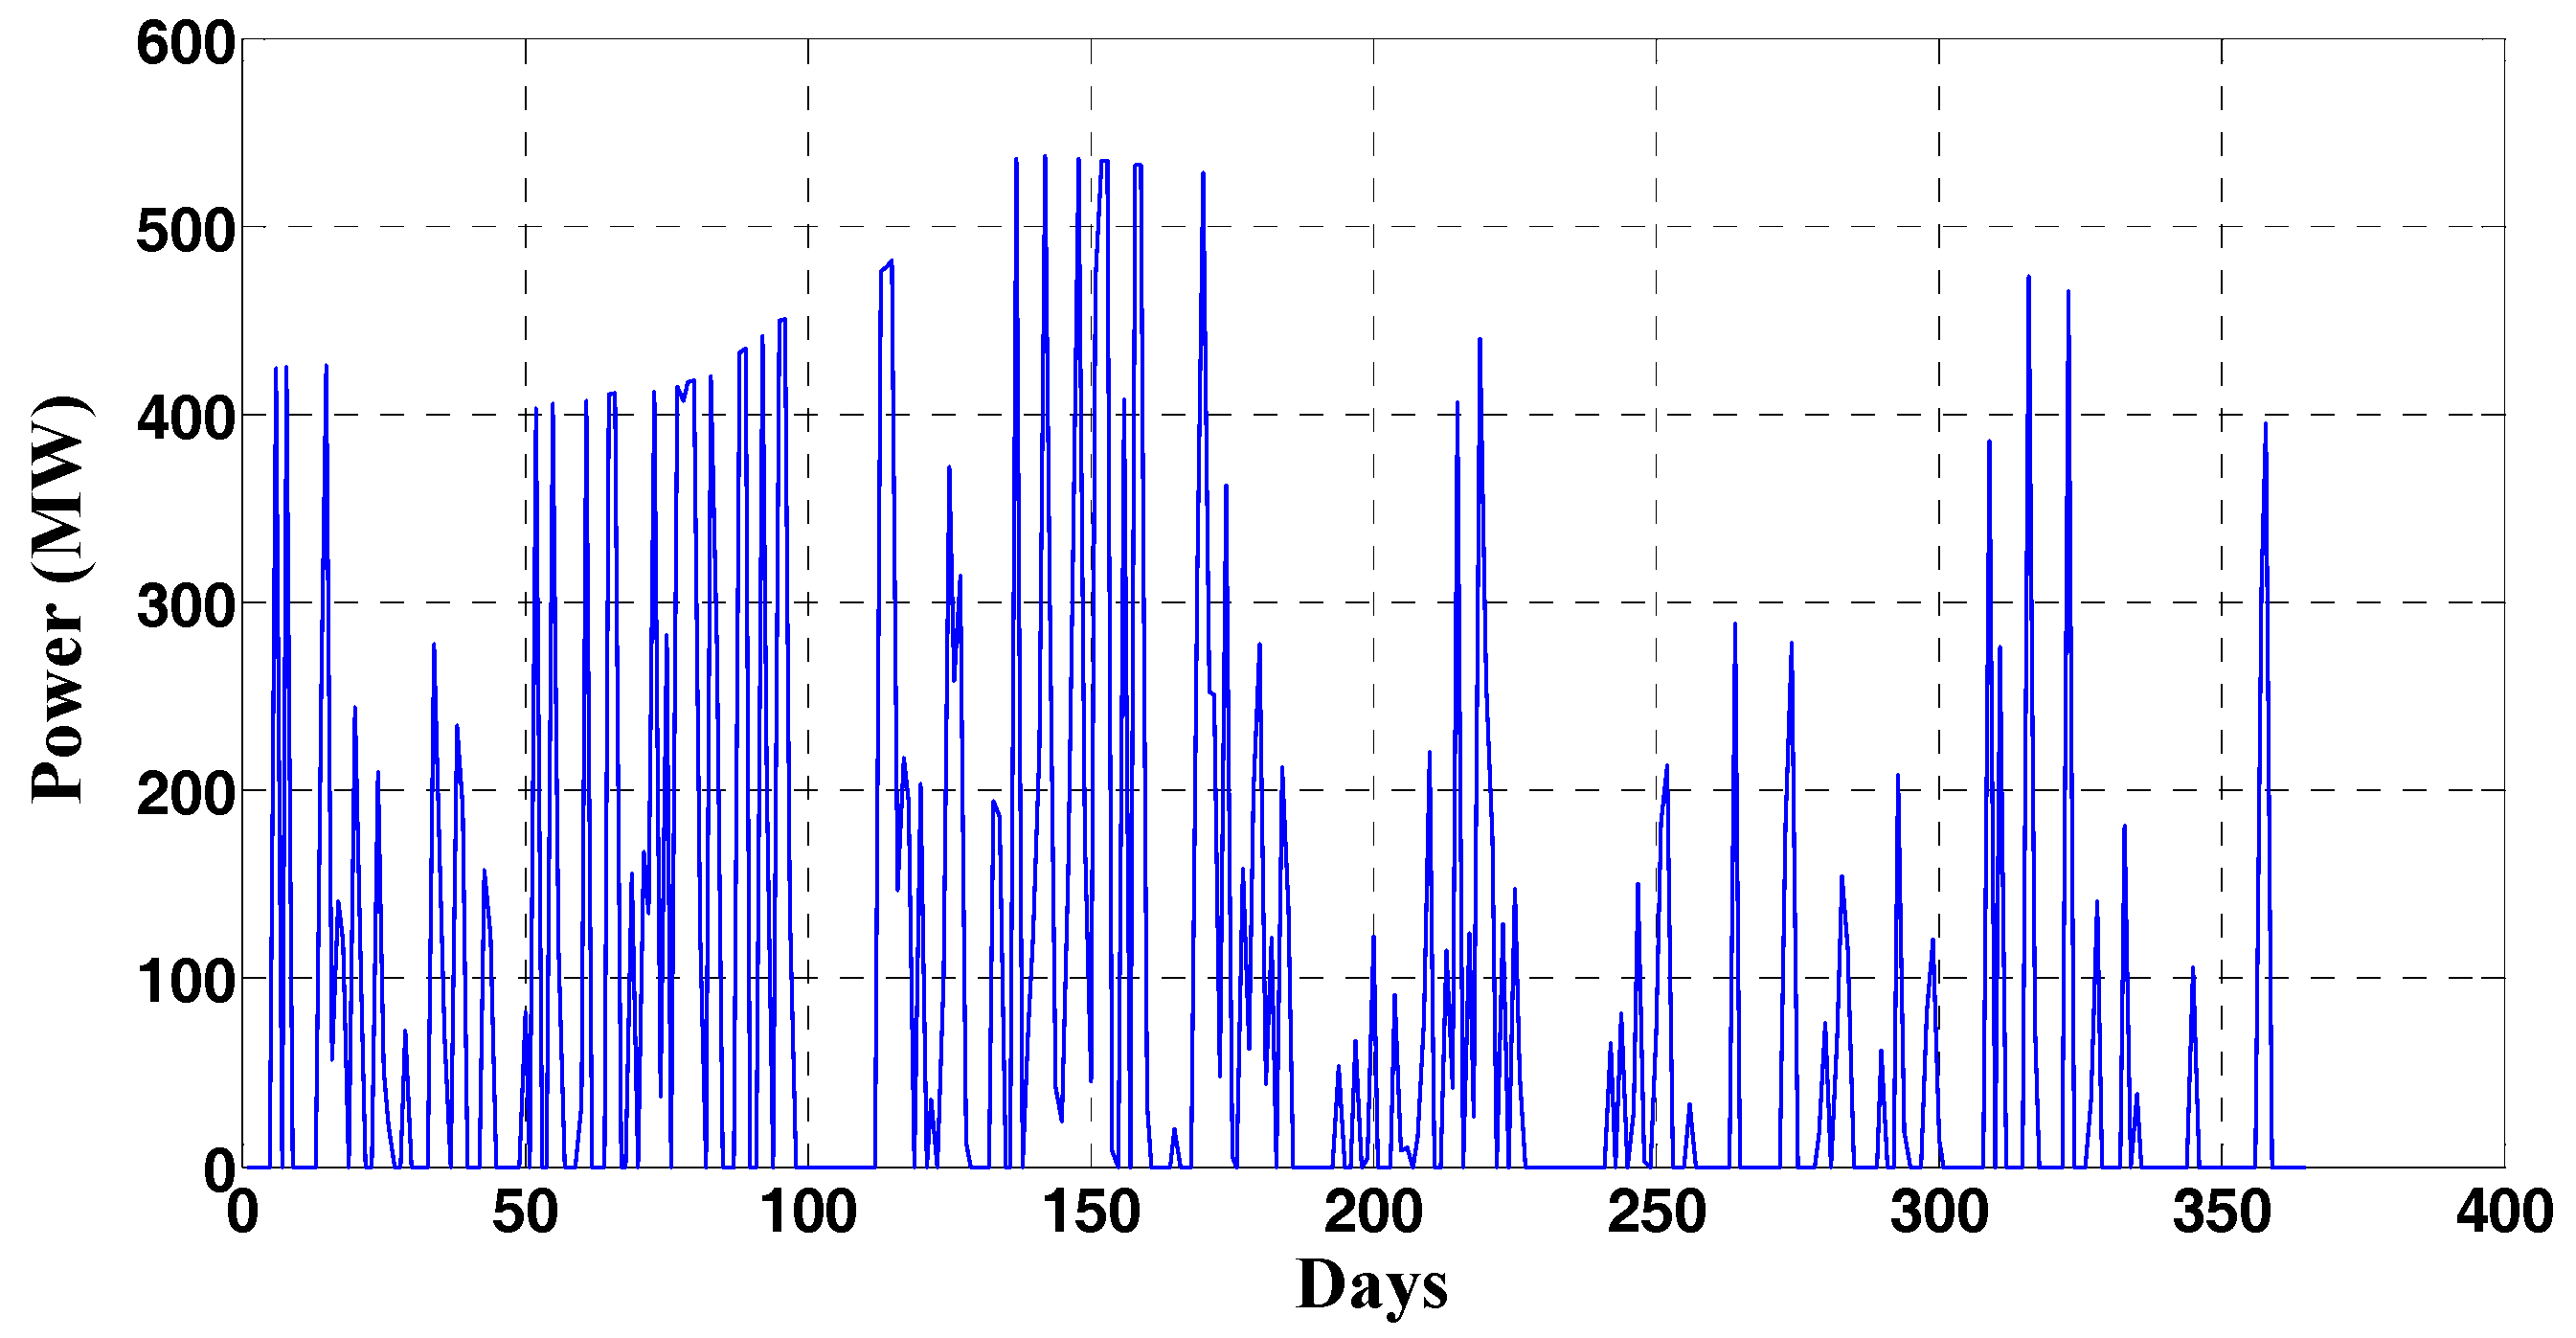
Any temporary excesses in power will be absorbed by electrolysers to produce hydrogen. The capacity factor is calculated using Equation (5), so the required energy to meet the average demand is computed as follows:
where the capacity factor value was 0.35 based on the calculation in Equation (5). The excess energy can be calculated using Equation (10).
where:
is the daily energy production (kWh),
is the daily demand (kWh), and
is the number of days during the year. The surplus energy, after demand has been subtracted, is given in
Figure 4 below.
6. Hydrogen Demand
Because of the absence to data for an extensive hydrogen market, the hydrogen demand calculation cannot be computed with any great accuracy. The widespread uptake of hydrogen markets will rely initially on the availability of hydrogen-based infrastructure, particularly the hydrogen station infrastructure and hydrogen-fuelled cars [
52]. Due to this uncertainty, scenario planning can be deemed as the only systematic method of assessing the future hydrogen supply chain. In this paper, estimates of hydrogen demand (and thus the number of hydrogen refueling stations) are based on the current supply of fuel to today’s conventional petrol stations, which is used to guide evaluations of future hydrogen consumption and corresponding electrolyser capacity. The data for petrol stations is not available in any official form; only annual fuel consumption can be extracted from the National Oil Corporation or Central Bank of Libya. However, after the introduction of the new system, which gives the manager or owner the power to control their own station, daily reports have been utilised to determine costs and revenues, as well as any shortage of oil components. As a result, fuel consumption data were obtained from the stations owners’ daily records. The daily fossil fuel demand will be one value every day. In other words, this value includes the demand of all fossil fuels [
53].
Conventional fuel consumption is high in Libya including in Derna city [
54]. To convert from gallons of petroleum to the equivalent in kilograms of hydrogen, it is necessary to consider the relative efficiency of internal combustion engines and fuel cells with electric drivetrains, plus the energy content (in lower heating values) of petroleum and hydrogen, as in the following formula:
where
is the demand at a fossil-fuel forecourt (kg) which,
is fossil fuel’s lower heating value (kWh/kg),
is the efficiency of a fossil-fuelled engine (%),
is the demand of hydrogen fuel at garage forecourt (kg),
is hydrogen’s lower heating value (kWh/kg),
is the efficiency of the hydrogen engine (%). The Equation’s (10) terms are given in
Table 5 [
55,
56,
57,
58]. Equation (14) was based around two main parameters, which are the efficiencies of hydrogen and fossil fuel engines and lower heating values of fossil fuel and hydrogen. As a guide to the accuracy of this method, the diesel version of the Hyundai ix35 (2.0 litre CRDi 4WD) consumes 5.7 (4.85 kg) litres of diesel per 100 km travelled whereas the hydrogen version of the same car consumes 0.95 kg per 100 km [
59]. The same hydrogen consumption level is reached when applying the equation with a 37% of hydrogen drivetrain efficiency.
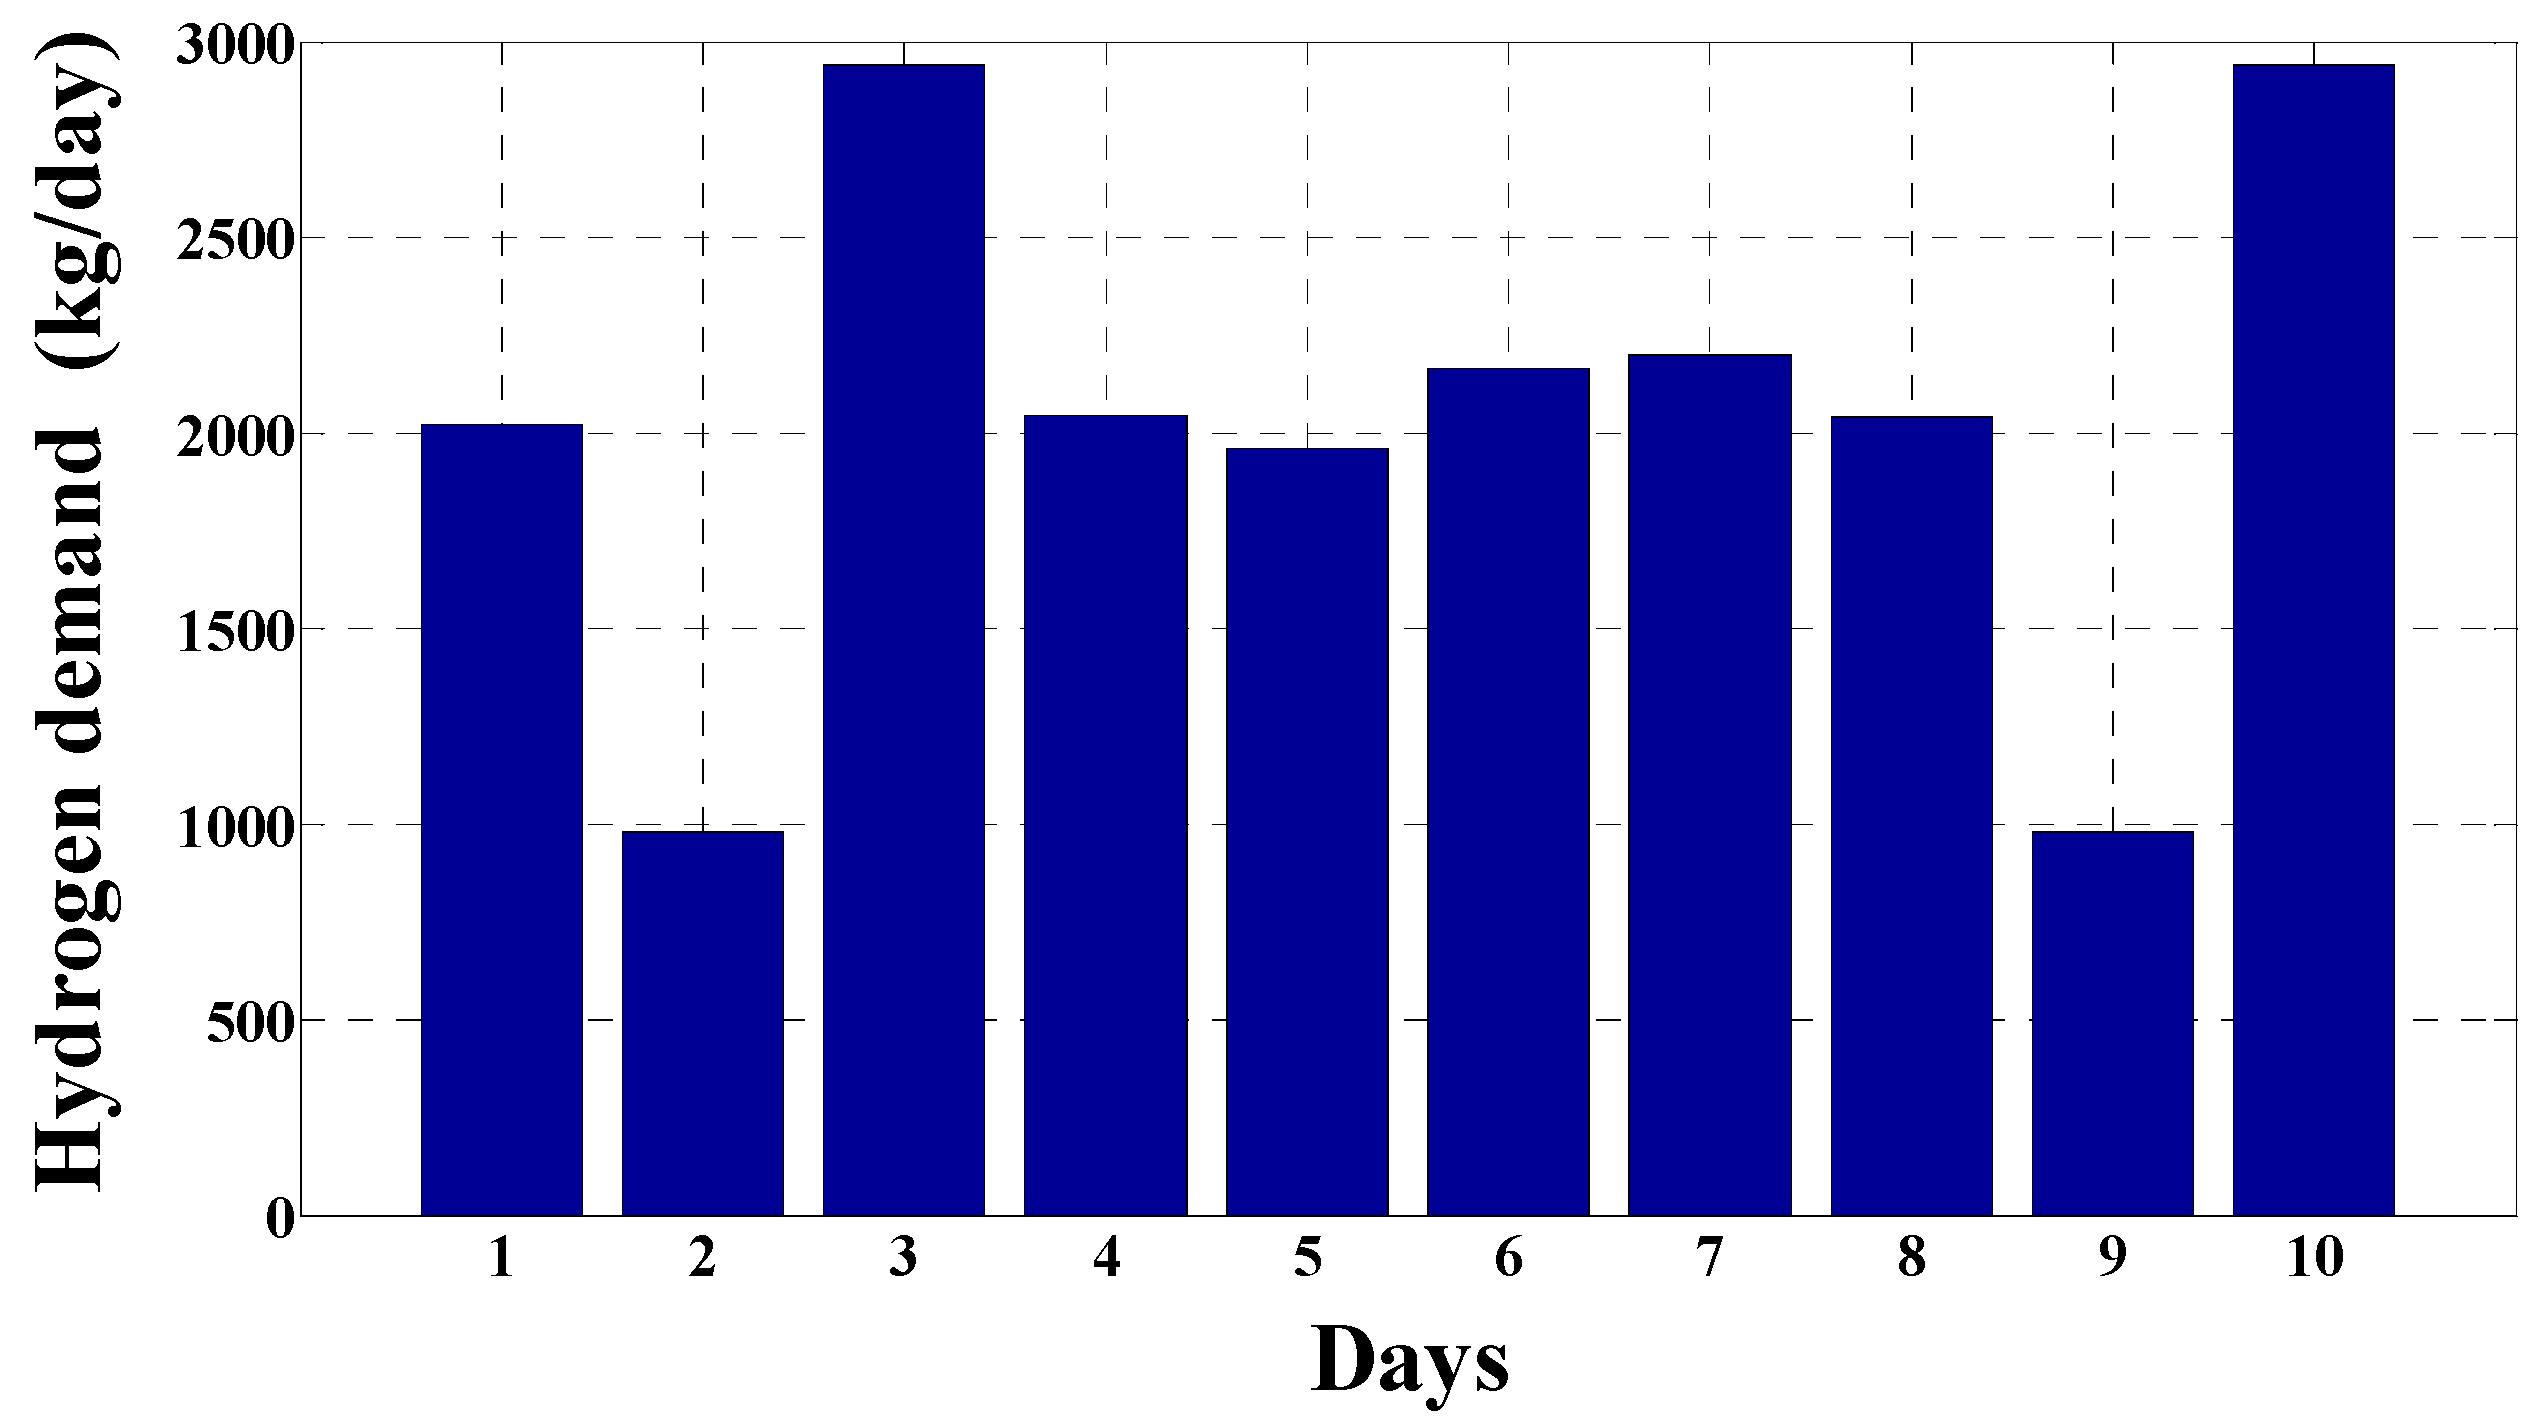
Hydrogen demand followed the same pattern as fossil fuel demand, but is scaled to reflect the different fuel properties and drivetrain efficiencies.
Figure 5 shows the hourly hydrogen consumption for several days after applying Equation (14).
7. Garage Forecourt Components Sizing
The main components of the hydrogen system at the fuel station are the electrolyser, compressor and storage tank. Each should be sized to maximise cost-efficiency.
7.1. Electrolyser Capacity
The capacity of the electrolyser is based on the maximum value of power to be absorbed since the main aims is to consume temporary renewable energy surpluses to enhance the application of hydrogen production as a DSR technique and source of clean fuel. The highest surplus can produce nearly 8000 kgH2/day and can occur on several days of the year so the garage forecourt’s production capacity is fixed at 8000 kg/day for all scenarios.
7.2. Compressor Size
The size of the compression system is dependent upon the production rate of the electrolyser, such that it must be able to transfer the hydrogen from electrolyser to storage tank at the same rate as it is produced.
7.3. Storage Tank Size
For first scenario (standard continuous production), the storage capacity is comparatively small, because only enough storage for one day is required (taking into account any unplanned shortage of production that could happen, such as the 3–5 days per year experienced with the H2A module at NREL [
60]). The size is also chosen based on the lowest daily fuel demand since the target is to reduce the average hydrogen cost.
The storage capacity for the second scenario (surplus renewable energy supply) is 95,000 kg. The storage tank capacity is optimised for daily energy supply and consumption dynamics. This means that electrolysers will be operated when there is surplus renewable energy and storage capacity must accommodate the peaks and troughs caused by following surplus power availability. Storage capacity also relates to the longest continuous shortage of surplus energy supply between days, so the size in this case is seven times the daily fuel demand of each garage forecourt.
For the third (2-tier Continuous) scenario, the optimisation model focuses on absorbing power at off-peak times and storing the hydrogen to avoid buying expensive electricity during peak demand periods. So, a capacity of 18,000 kg was chosen, based on a comparison between the capital cost of the hydrogen store and the energy price at peak times. Storage capacities in this scenario also relate to the longest continuous shortage of surplus energy between days.
Table 6 presents the technical details, operation modes and energy prices of the garage forecourt for these scenarios.
8. Hydrogen Cost
The cost of hydrogen results from two main factors: capital cost and variable operating cost. Capital cost includes the cost of electrolyser, storage, compressor, dispenser and control system. In this paper, the capital cost of these components and those of a central electrolyser (which has the same components, but at larger scale), plus fixed costs, were covered by a bank loan with a 0.07% interest rate (
) over seven years (
). The costs of forecourt components are extracted from many studies and reports [
34,
61,
62,
63,
64] and are given in
Table 7 below:
The capital cost of the forecourt components are presented in Equations (15) to (20) below.
where:
is the required power (kW),
is the daily hydrogen production (kg/day),
is the total electrolyser cost (£),
is the electrolyser cost (£/kW),
is the total storage cost (£),
is the storage size,
is the storage cost (£/tank),
is the total compression cost,
is the compressor cost (£/compressor),
is the compressor size,
is the dispenser cost. The bulk of this cost is in the price of feedstock, i.e., electricity, especially in the case of large electrolysers, and more so when operating throughout the whole day (both on-peak and off-peak times) [
65]. The electricity cost (feedstock + compressor) can be computed by equation below.
The investment cost is calculated using the following equations:
where:
is the total investment cost payment after 7 years (£),
is the fixed cost (£/year),
is the interest rate (0.07),
number of years,
, is the payment for one year (£),
is the number of days in one year,
is the daily energy cost (£),
is the energy price (£/kWh),
is the daily hydrogen production (kg/day),
is the energy required (feedstock + compressor) (kWh/kg) and
is the total daily cost (£/day).
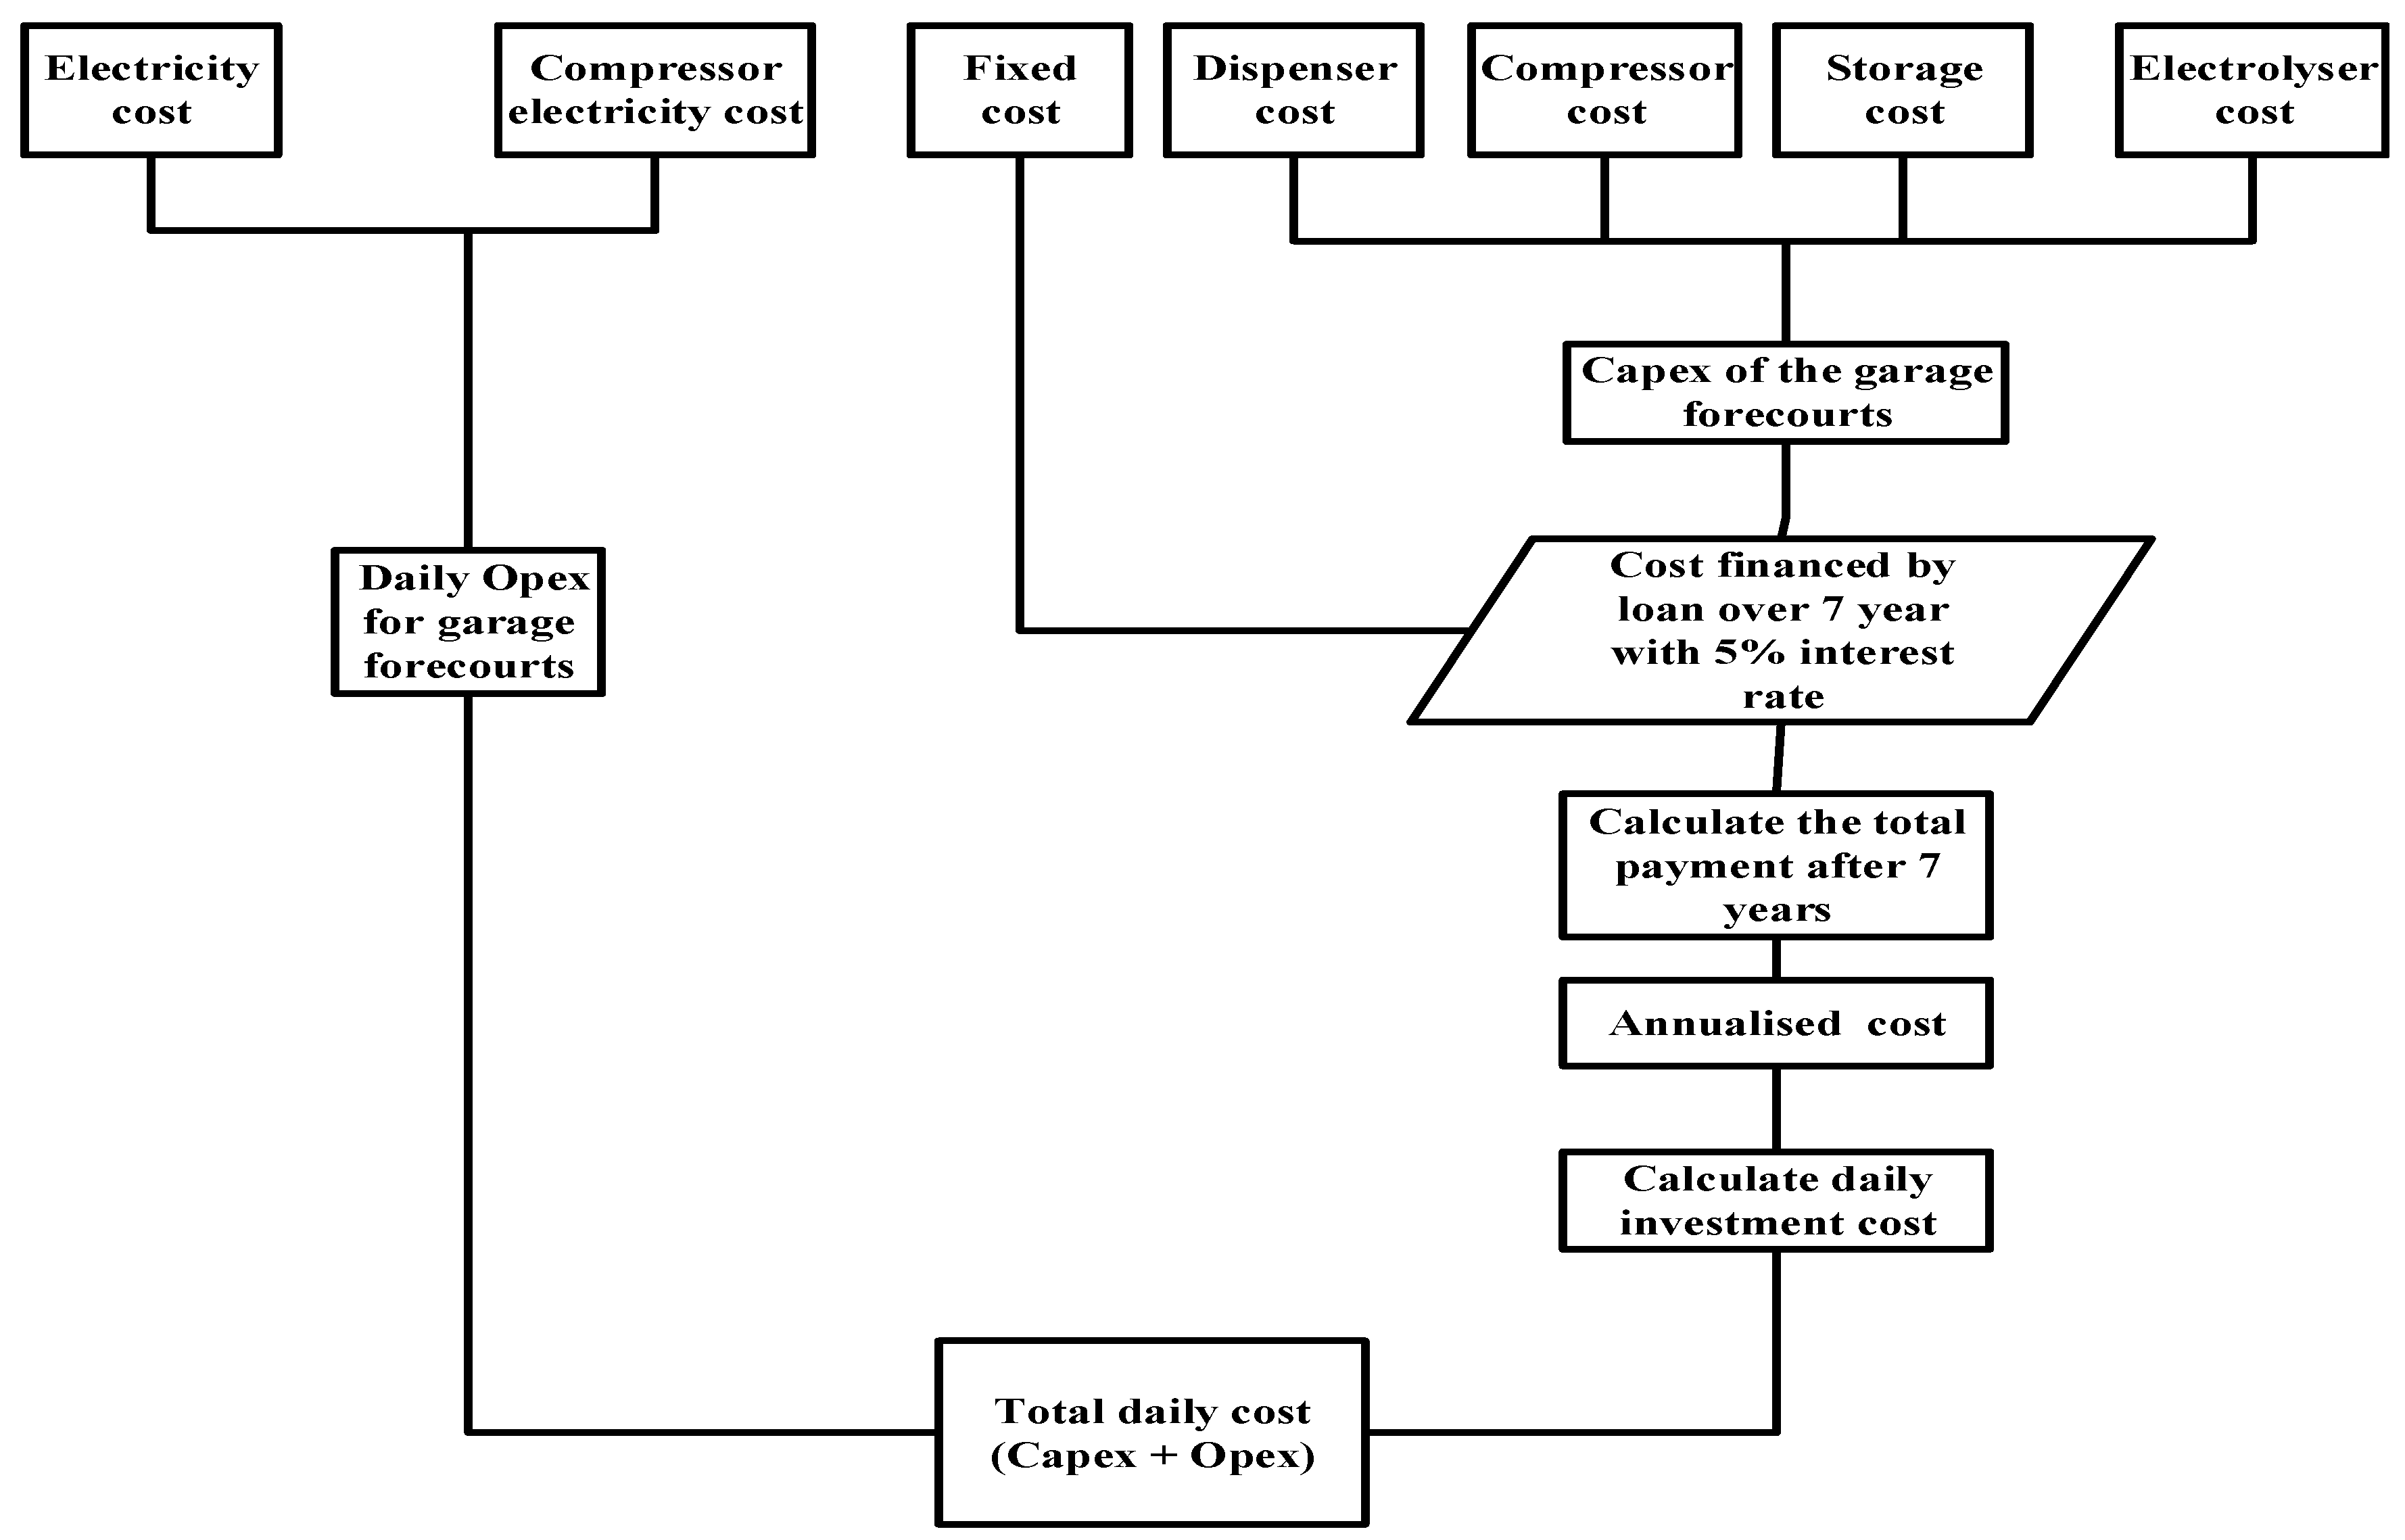
Figure 6 below summarises the process of the system cost.
The average hydrogen cost is based on the total amount of hydrogen production and total cost, as calculated in the equation below.
9. Optimisation
The time slots during the day can be divided into five periods, which are off-peak (12:00 a.m.–5:00 a.m.), high on-peak (6–10), on peak (11–16), high on-peak (17–21) and off-peak (22–5). Matlab software has been used to simulate all aspects of this. A variety of Matlab tools were used, such as probability distribution, Weibull distribution and other facilities, while Matlab code has been written to analyse weather data. The system sizing model was created in Matlab to quantify surplus power through comparing the demand and supply over the whole network. Linear programming was used to optimise the hydrogen cost (based on the time and price of energy) for this paper. Economic equations in Matlab, such as return on investment and payback period formulas, were used to assess the system economically. Generally, the main model is flexible and can deal with any region and any timescale (e.g., day or hours). The inputs of the model are the electricity demand and weather data and the outputs are the average price of hydrogen per fuel station, the energy consumption and the degree to which hydrogen demand is satisfied.
The main target of the research in this paper is to reduce the hydrogen cost. Since the capital cost is known, the optimisation will focus on variable cost to reduce the hydrogen price. There are two sources of electricity with different prices, so the optimisation should focus on cheap electricity price as much as possible to achieve the target. There are some constraints, such as electrolyser size, storage size and fuel demand. Meeting the hydrogen demand could be added as another condition of the process. The optimisation target is to reduce the hydrogen cost by maximising operation at cheap electricity tariff in Scenario 2 and Scenario 3, where there is the option to buy the excess power at a cheap price. However, for the first scenario, the system will run continuously at a fixed price and the cheap hydrogen price will arise from the smaller system size. All system objectives and constraints are linear, so linear programming can be used to solve the optimisation problem in this study. The objective function is the same in all three scenarios, but electricity prices and energy sources may be different. For example, in the Scenario 1, the price is fixed at 12 p/kWh so the energy source doesn’t affect hydrogen cost in this case. For Scenario 2, only surplus power, at 5 p/kWh, will be used, whereas in Scenario 3, the price varies according to the energy availability and time.
For continuous operation, the hydrogen system size will be comparatively small since the energy is available at any time and there is no need to have a large hydrogen store, whereas in off-peak or weather-dependent operation, a much larger store and electrolyser is required to account for the shorter production time and longer storage period.
A linear optimisation is applied in Matlab to solve this problem. The objective function of the system should meet the following goals:
Fully utilise the surplus power,
Minimise the hydrogen cost,
The final hydrogen level must higher than or equal the initial value of hydrogen in the tank each day (to ensure continuity of fuel supply at the forecourt).
The constraints are as follows:
Capacity of hydrogen in the storage tank, where the minimum value is the lowest level allowed in hydrogen tank and the maximum is the full capacity of the tank.
Capacity of electrolyser, ranging from zero up to the full power rating of electrolyser.
According to these objectives and constraints, the optimisation of problem is formulated as follows:
where:
is electricity cost (£/kWh),
is the daily required energy (kWh),
is hydrogen production (kg) at time (t),
is hydrogen consumption (kg) at the time (t),
is allowed minimum level in the tank (kg),
is Hydrogen storage capacity (kg),
is current amount of hydrogen in the tank (kg),
is the electrolyser capacity (kg/day). The required power (
will change based on the time (on-peak or off-peak) and the price will change as well.
Table 8 below shows the values of the constraints for each scenario. The hydrogen cost reduction will be based on the time and the price of energy.
10. Results and Discussion
The optimisation algorithm is implemented in Matlab for the three different scenarios. In all scenarios, the forecourt must always satisfy the hydrogen refuelling demand without interruption.
In terms of hydrogen demand satisfaction, in Scenarios 1 and 3 the demand can be met at almost any time since the power is available at any time. However, nearly 25% of the demand cannot be met in Scenario 2 due to the restrictions of excess energy availability and electrolyser size.
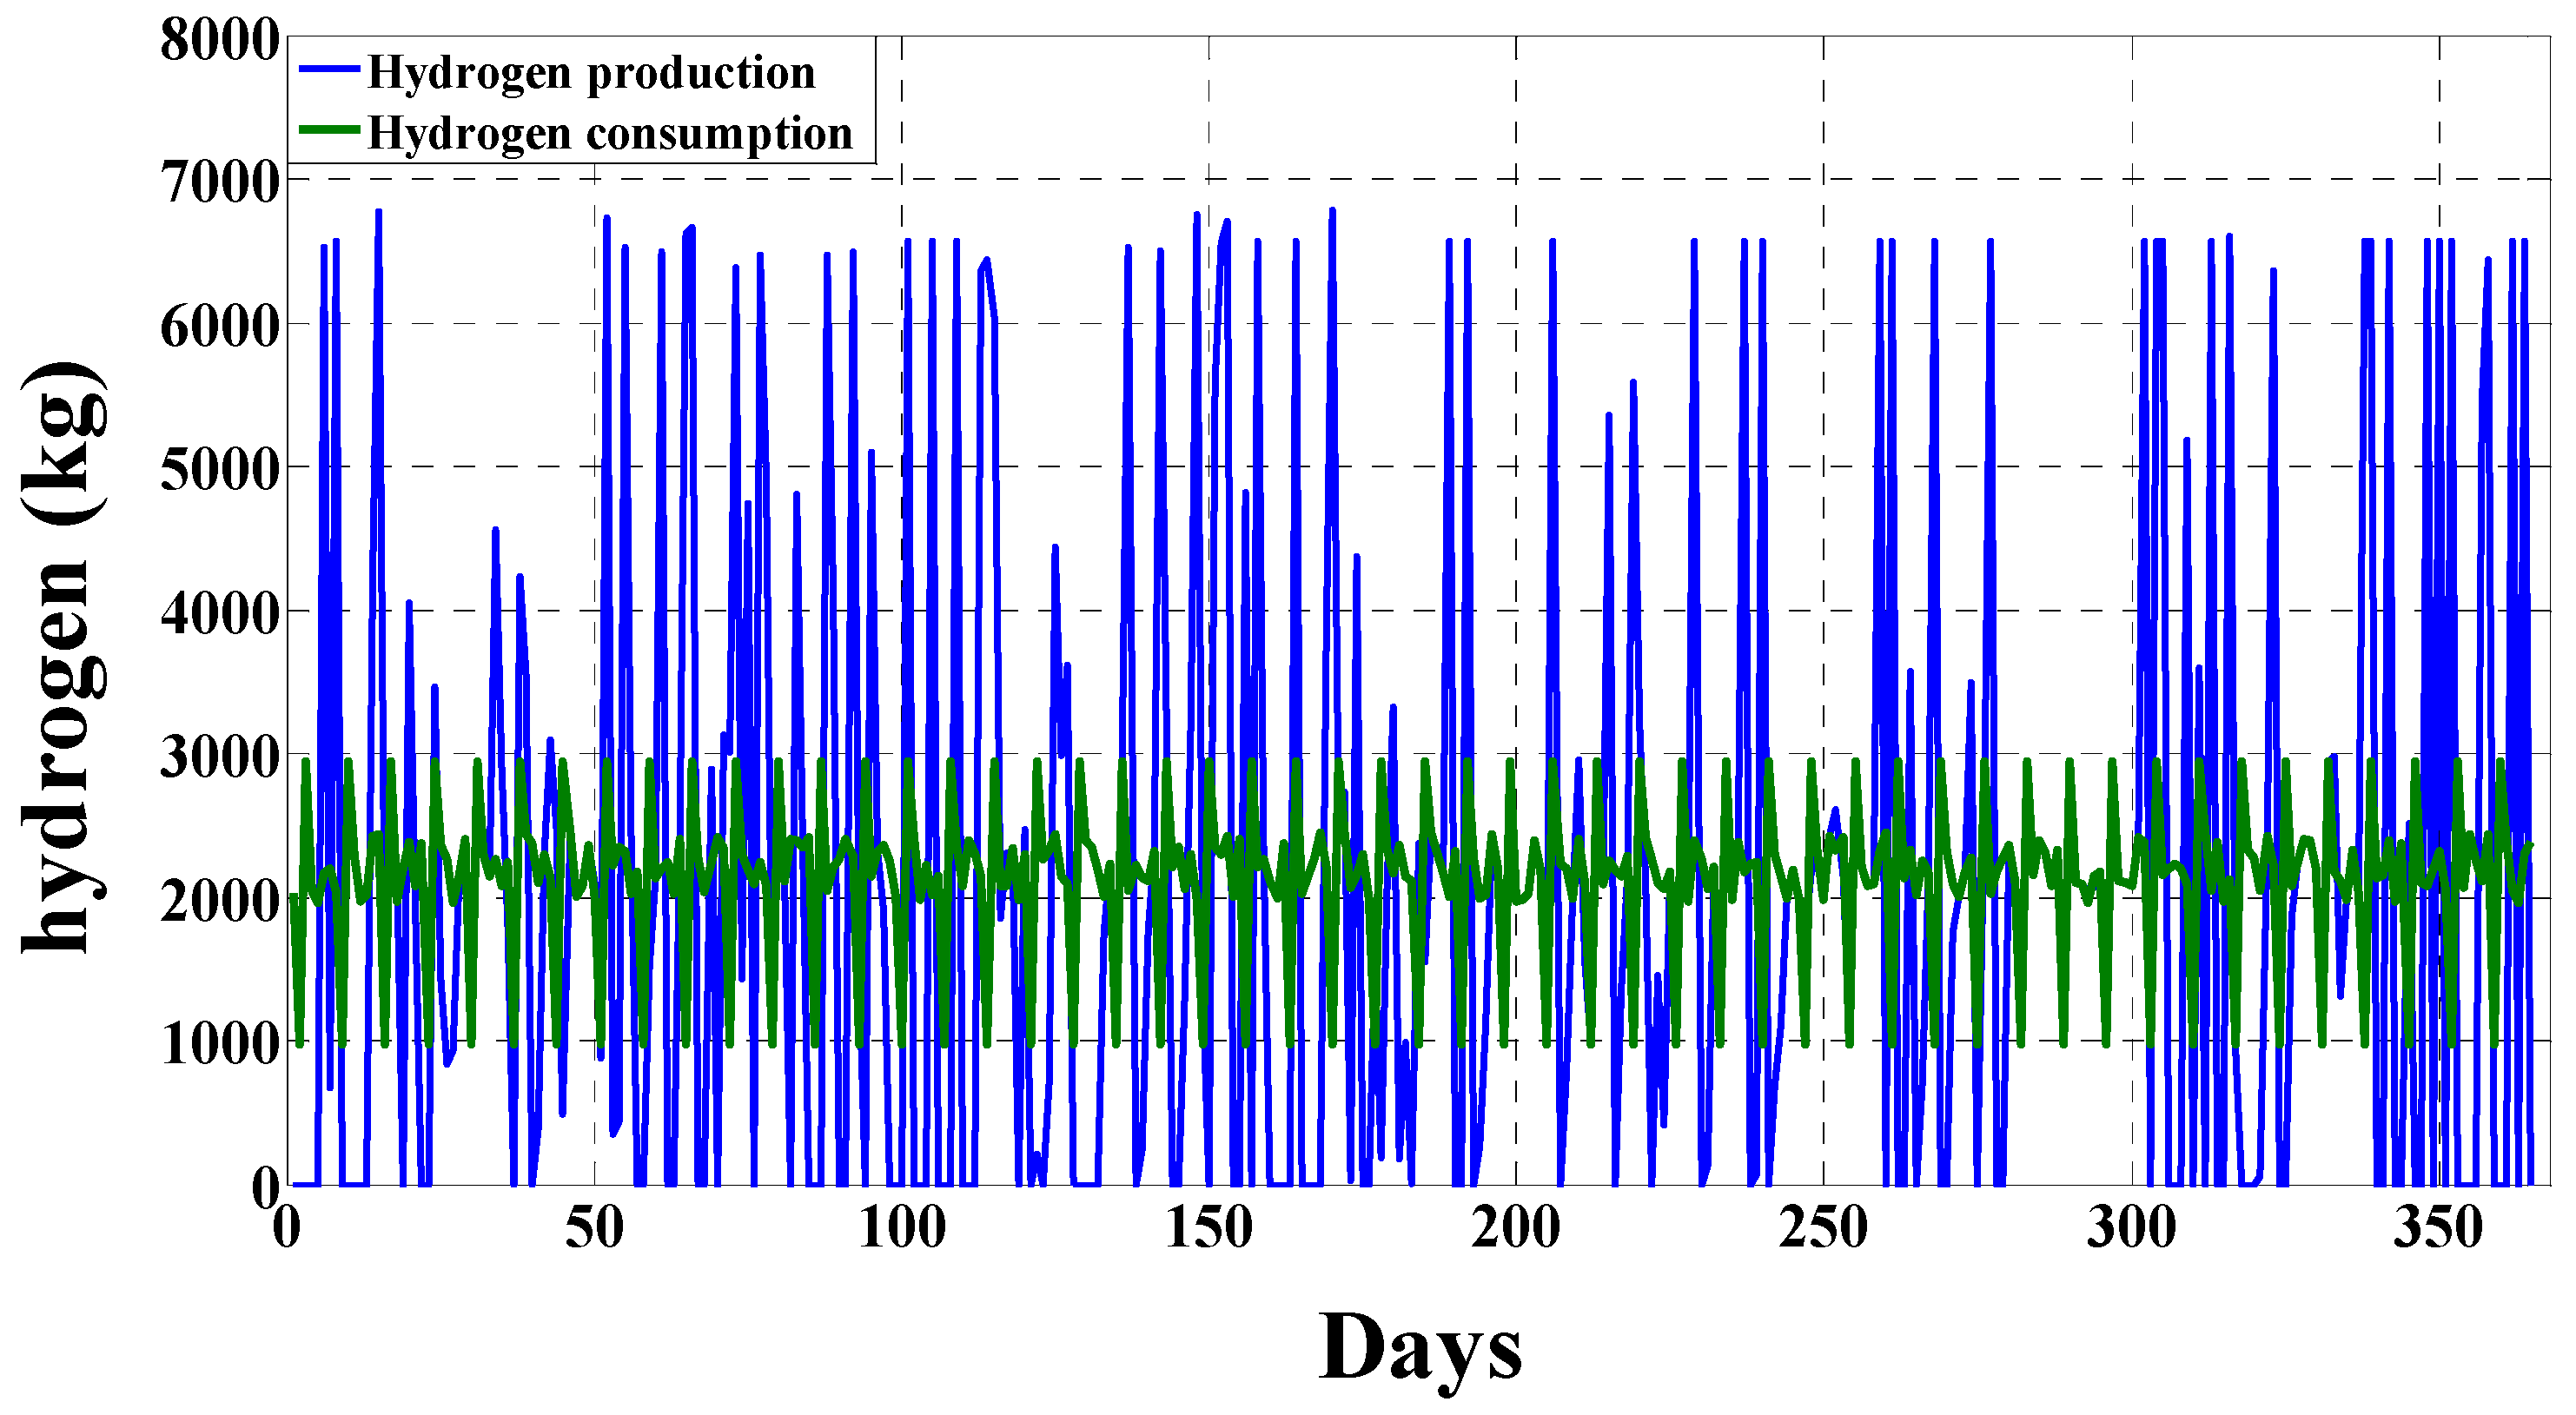
Figure 7,
Figure 8 and
Figure 9 show the hydrogen production in contrast with hydrogen demand for each scenario.
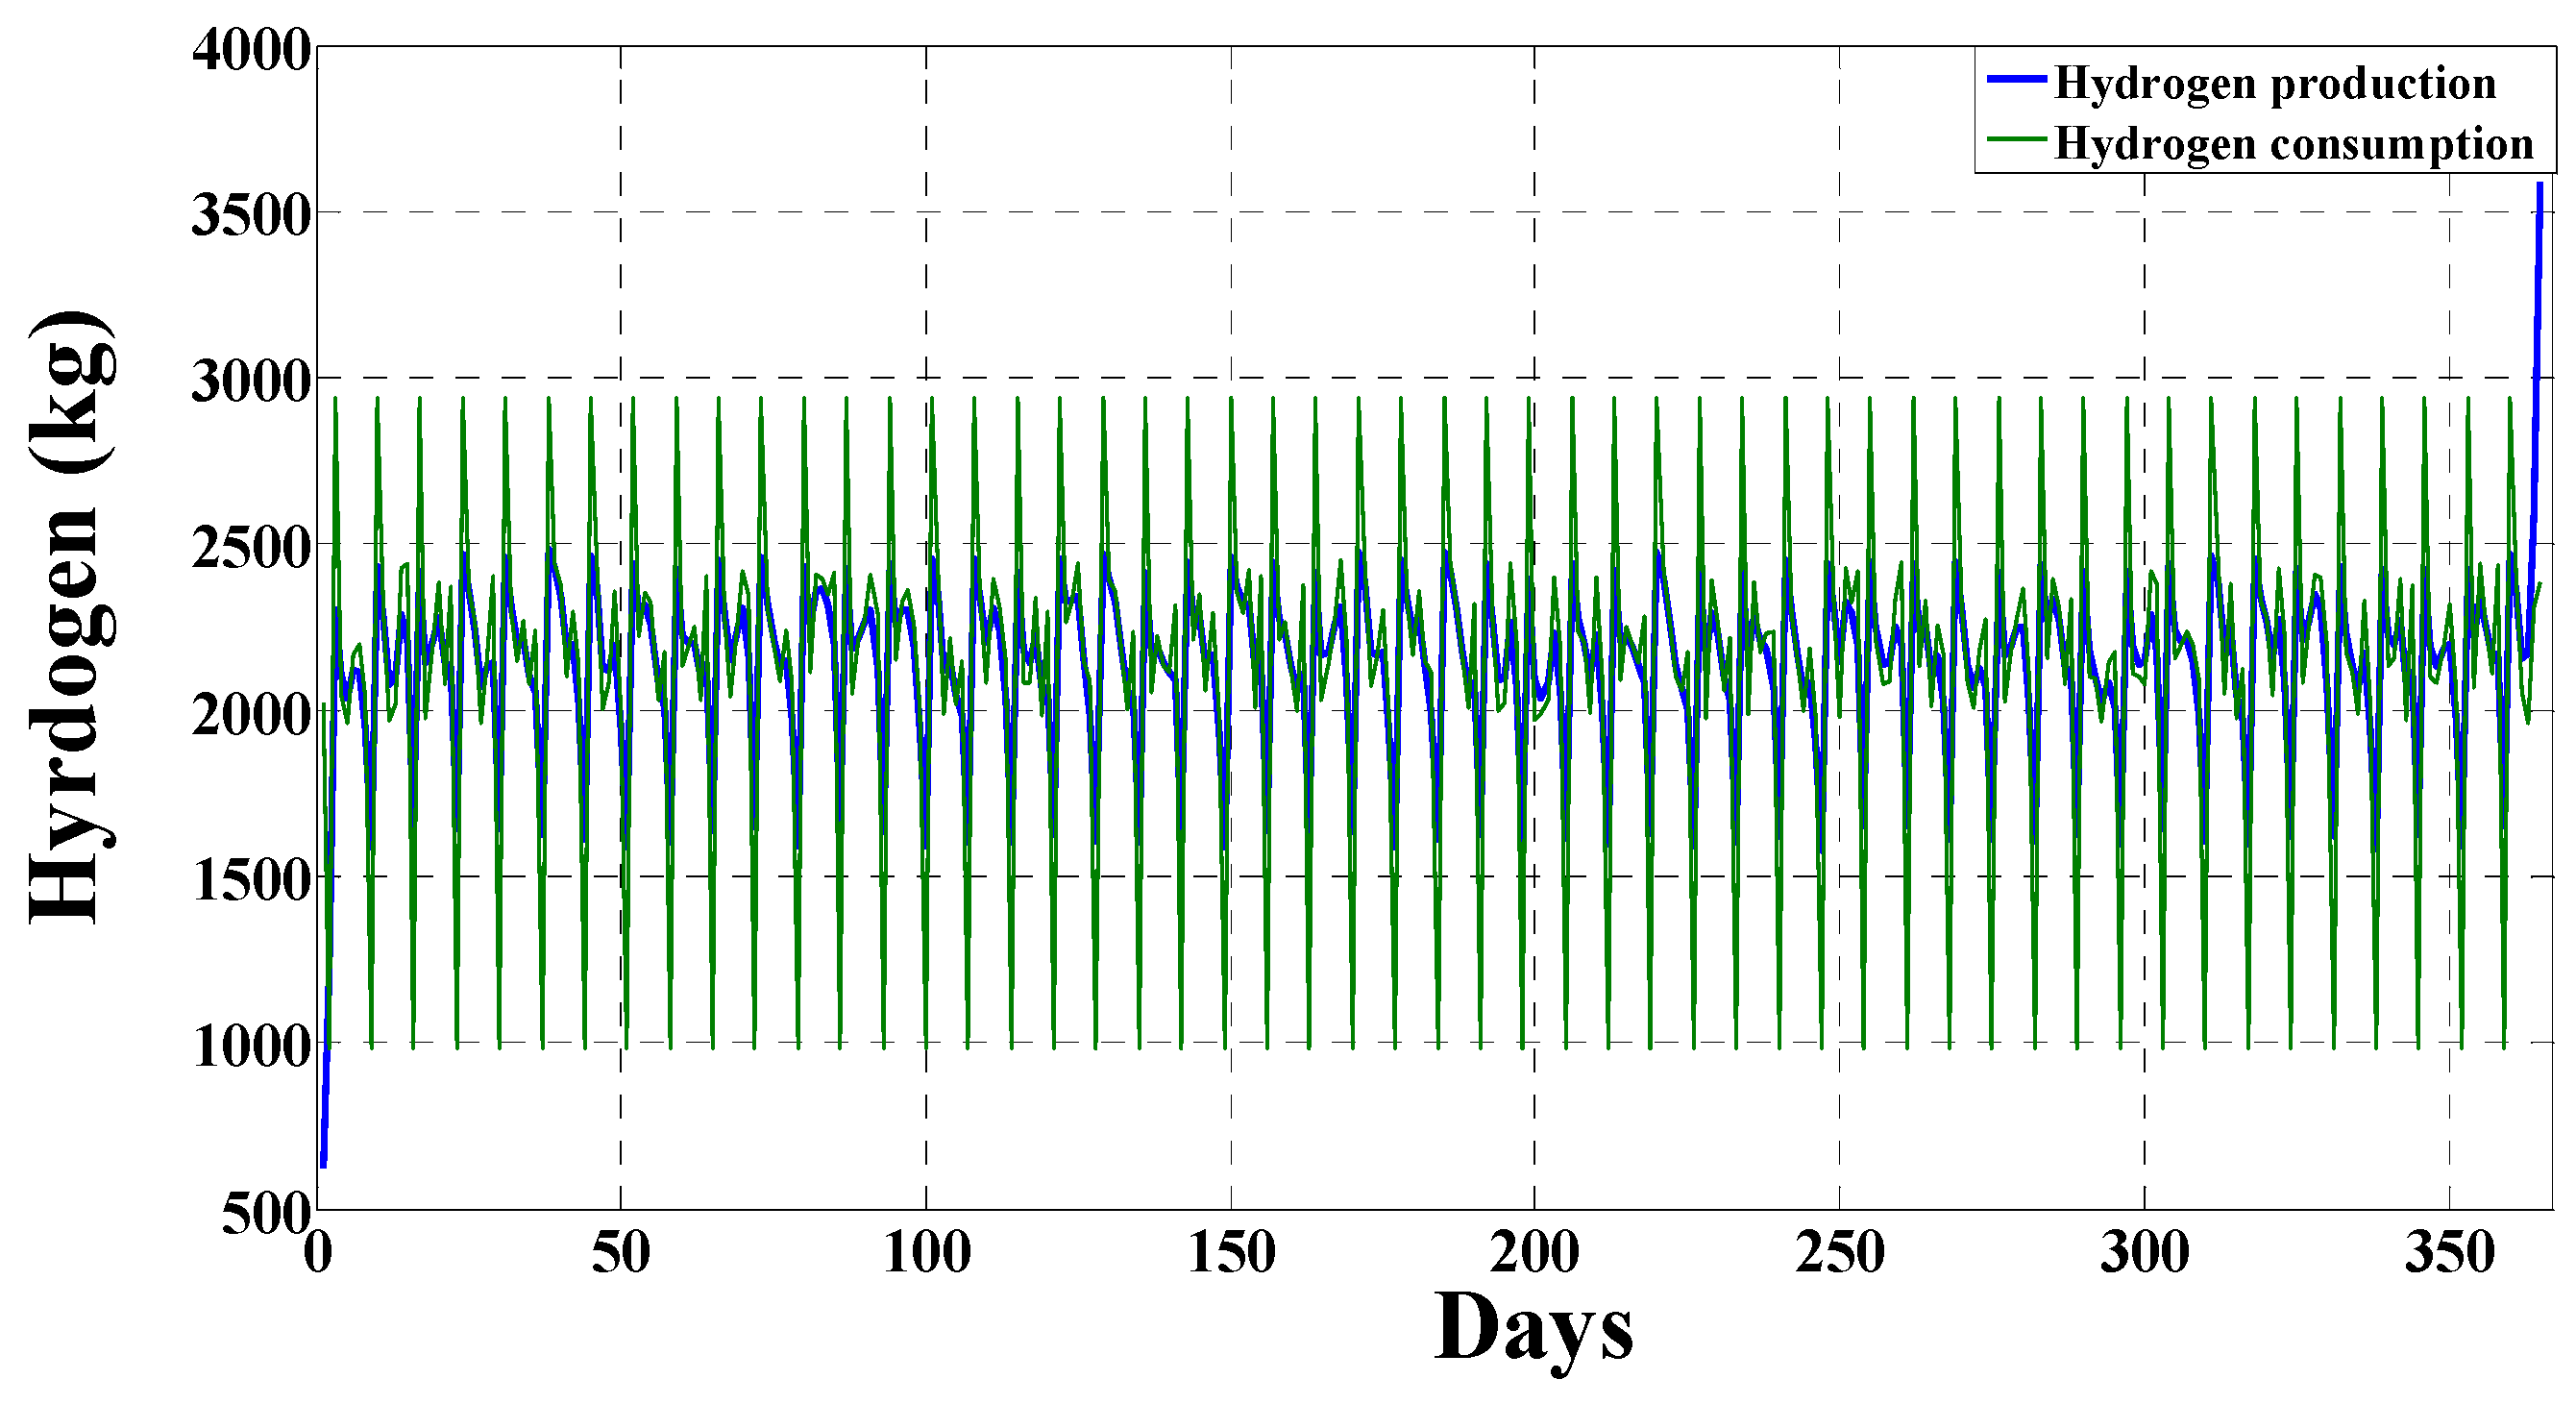
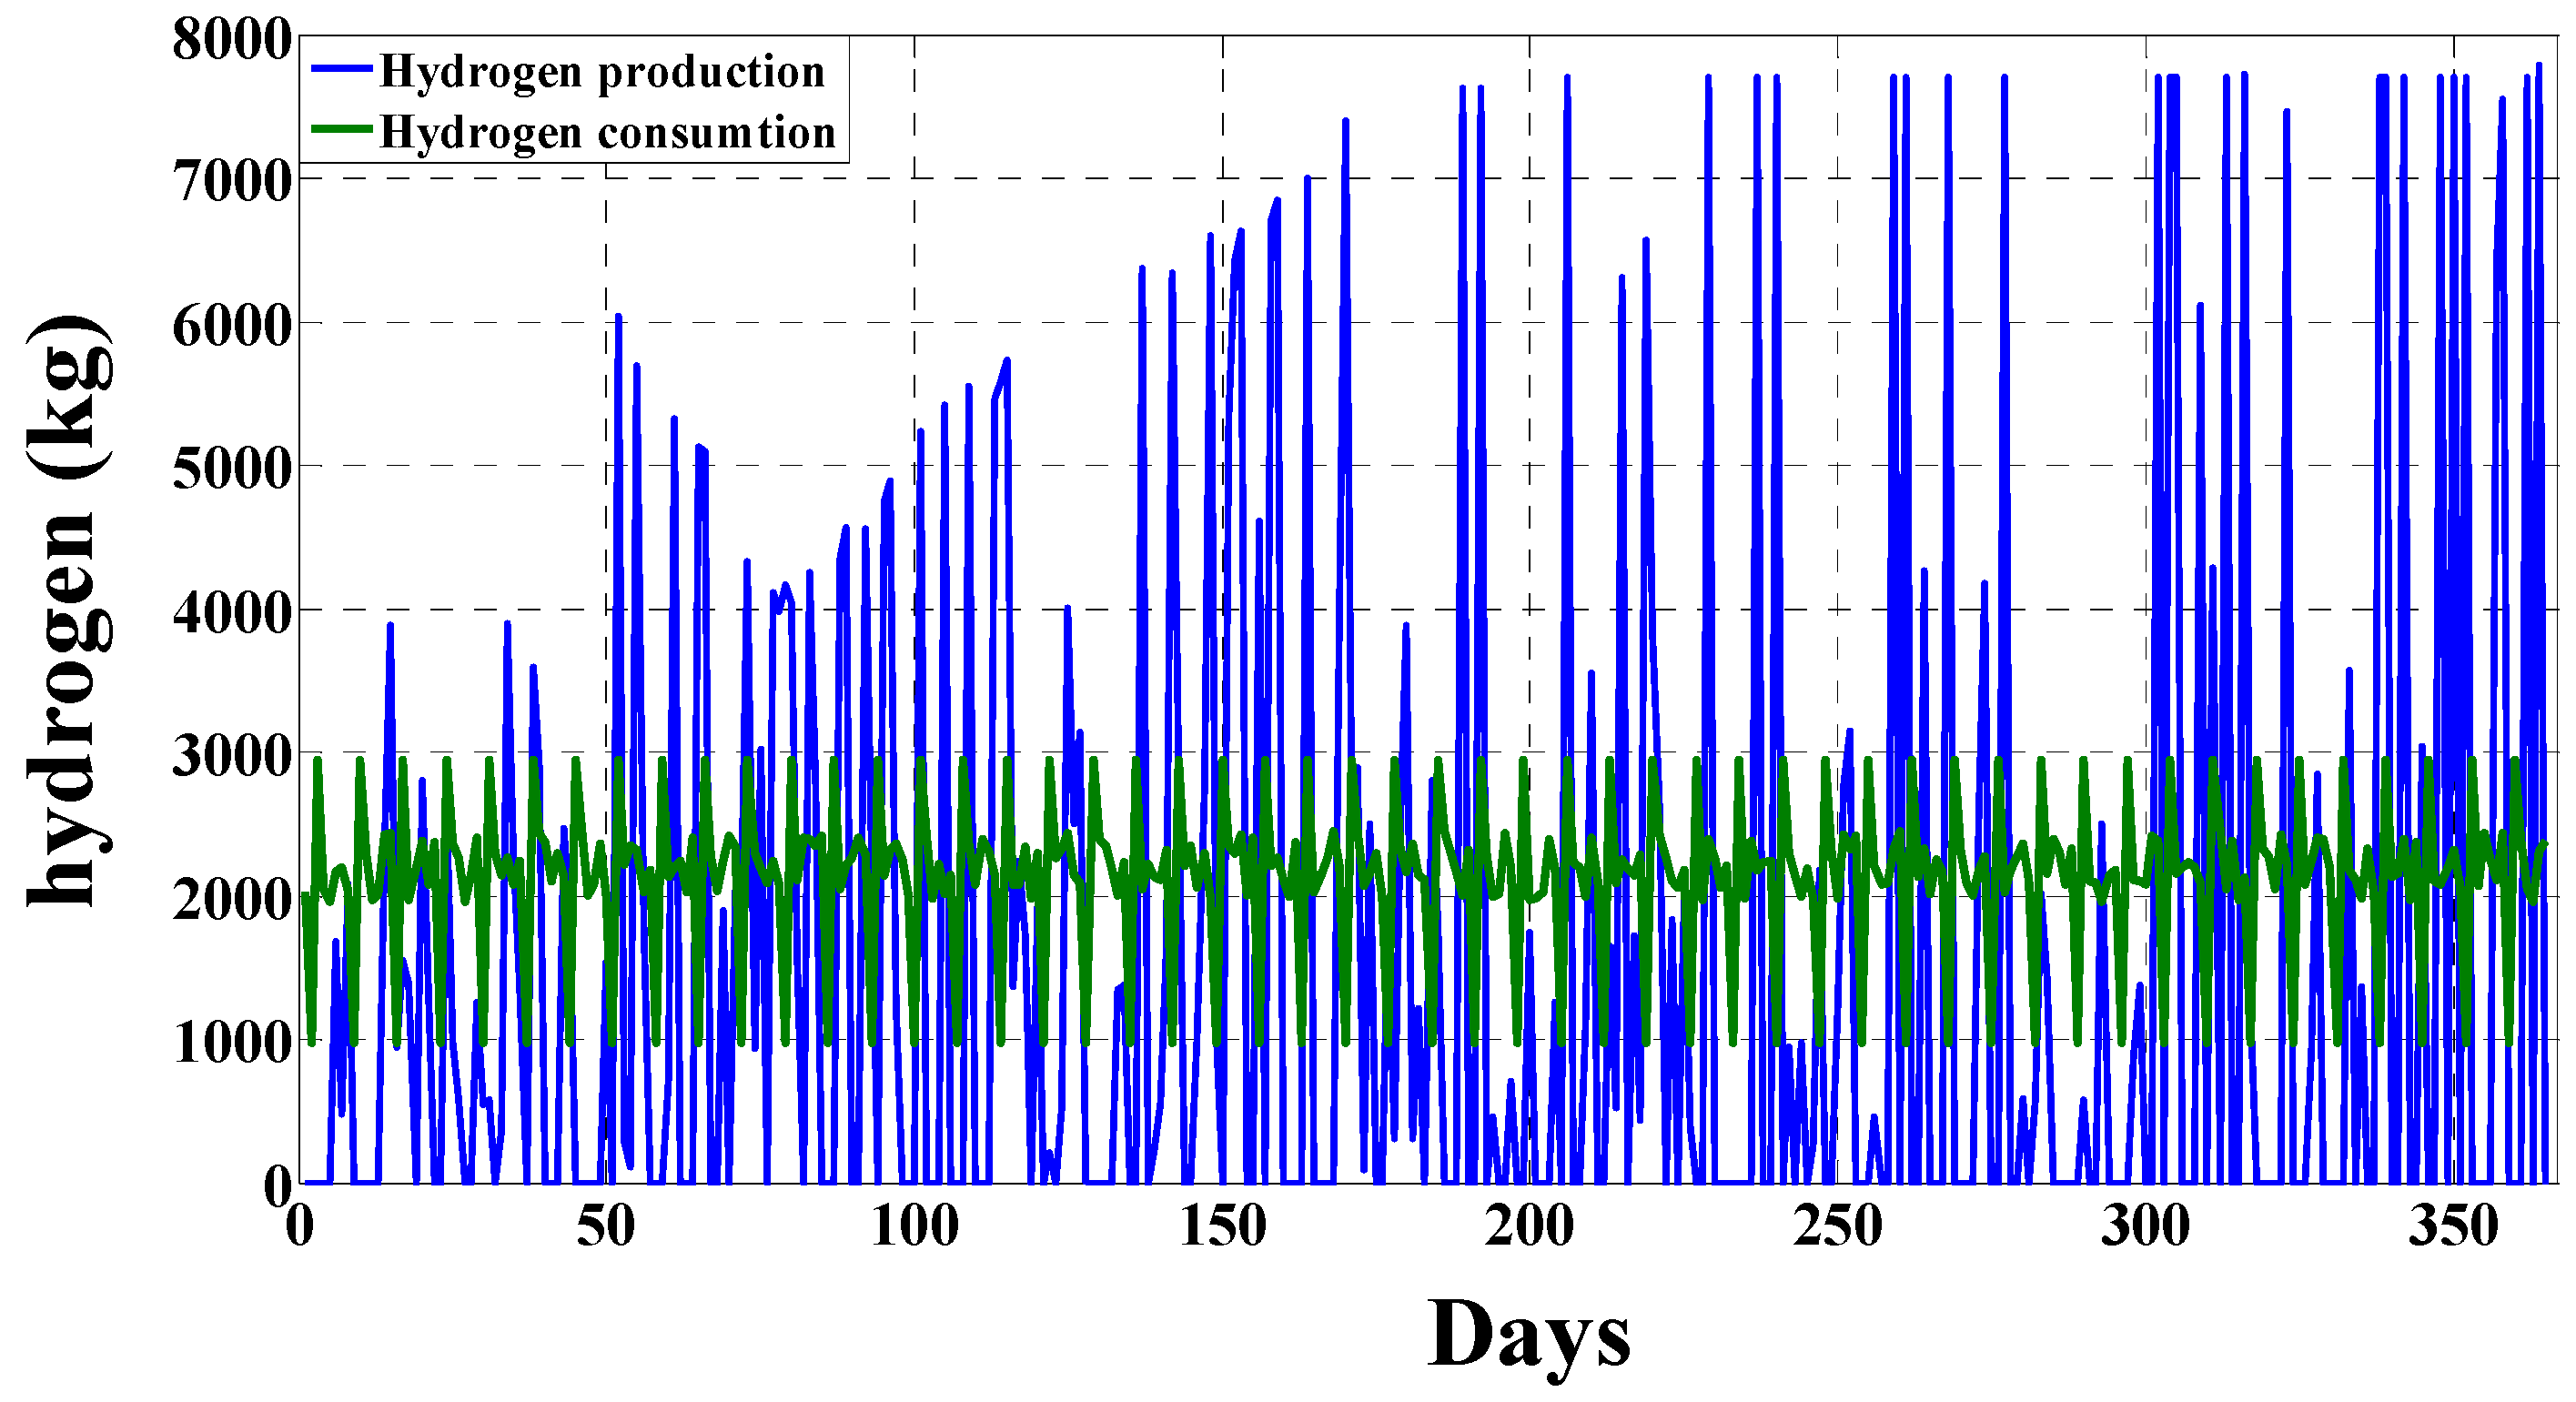
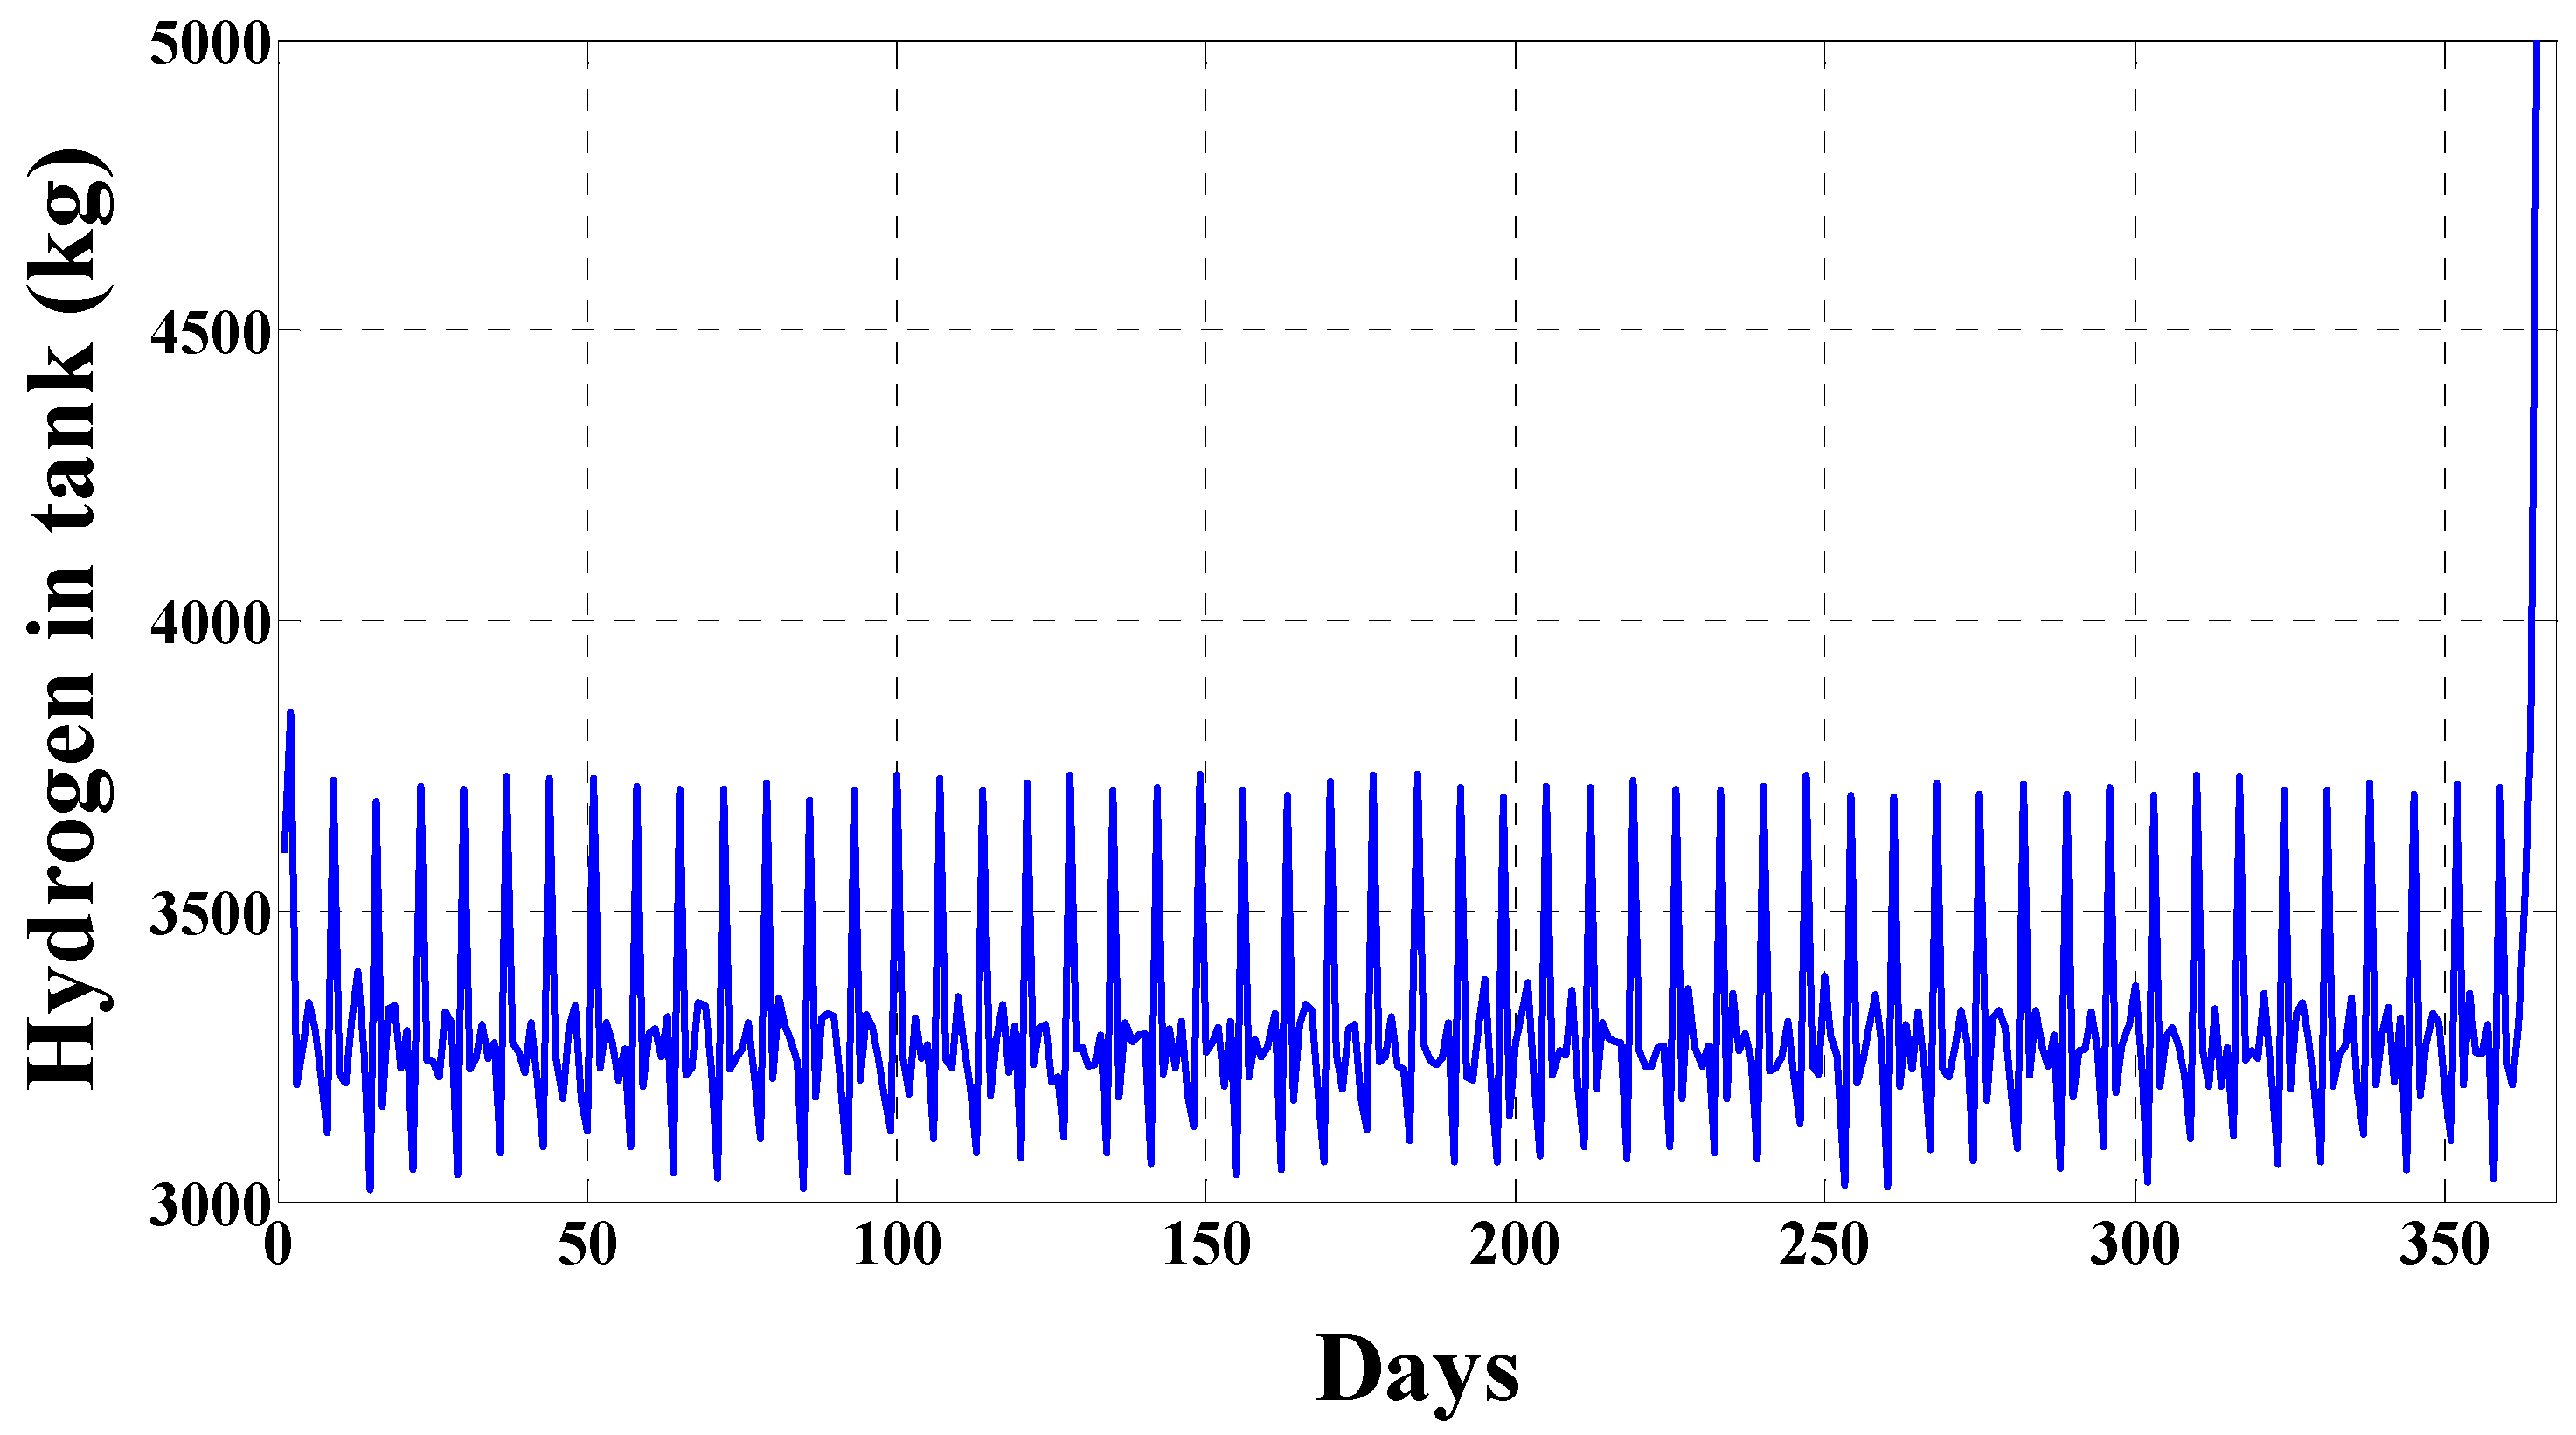
In the Standard Continuous scenario, the production is less than the consumption for most days, but the rest of the demand can be met using the hydrogen stored in the tank. The optimisation focuses on absorbing less energy at during high-tariff periods while there is hydrogen in the tank that can meet the fuel demand. Production on the last day is dramatically increased to meet one of the optimization objectives, which is that the amount of hydrogen in the tank at the end should be higher than, or equal to, the initial value. For the second scenario, the large storage capacity allows the electrolyser to produce a large amount of hydrogen to serve the immediate demand while storing extra fuel to cover the shortage on days of zero renewable energy surplus. This is possible because of the high production rates for most of the days when the excess renewable energy is available. The third scenario follows the same steps as the second, but with less surplus energy consumption due to the storage size restriction. Any shortfall can be met using on-peak energy at the expensive tariff.
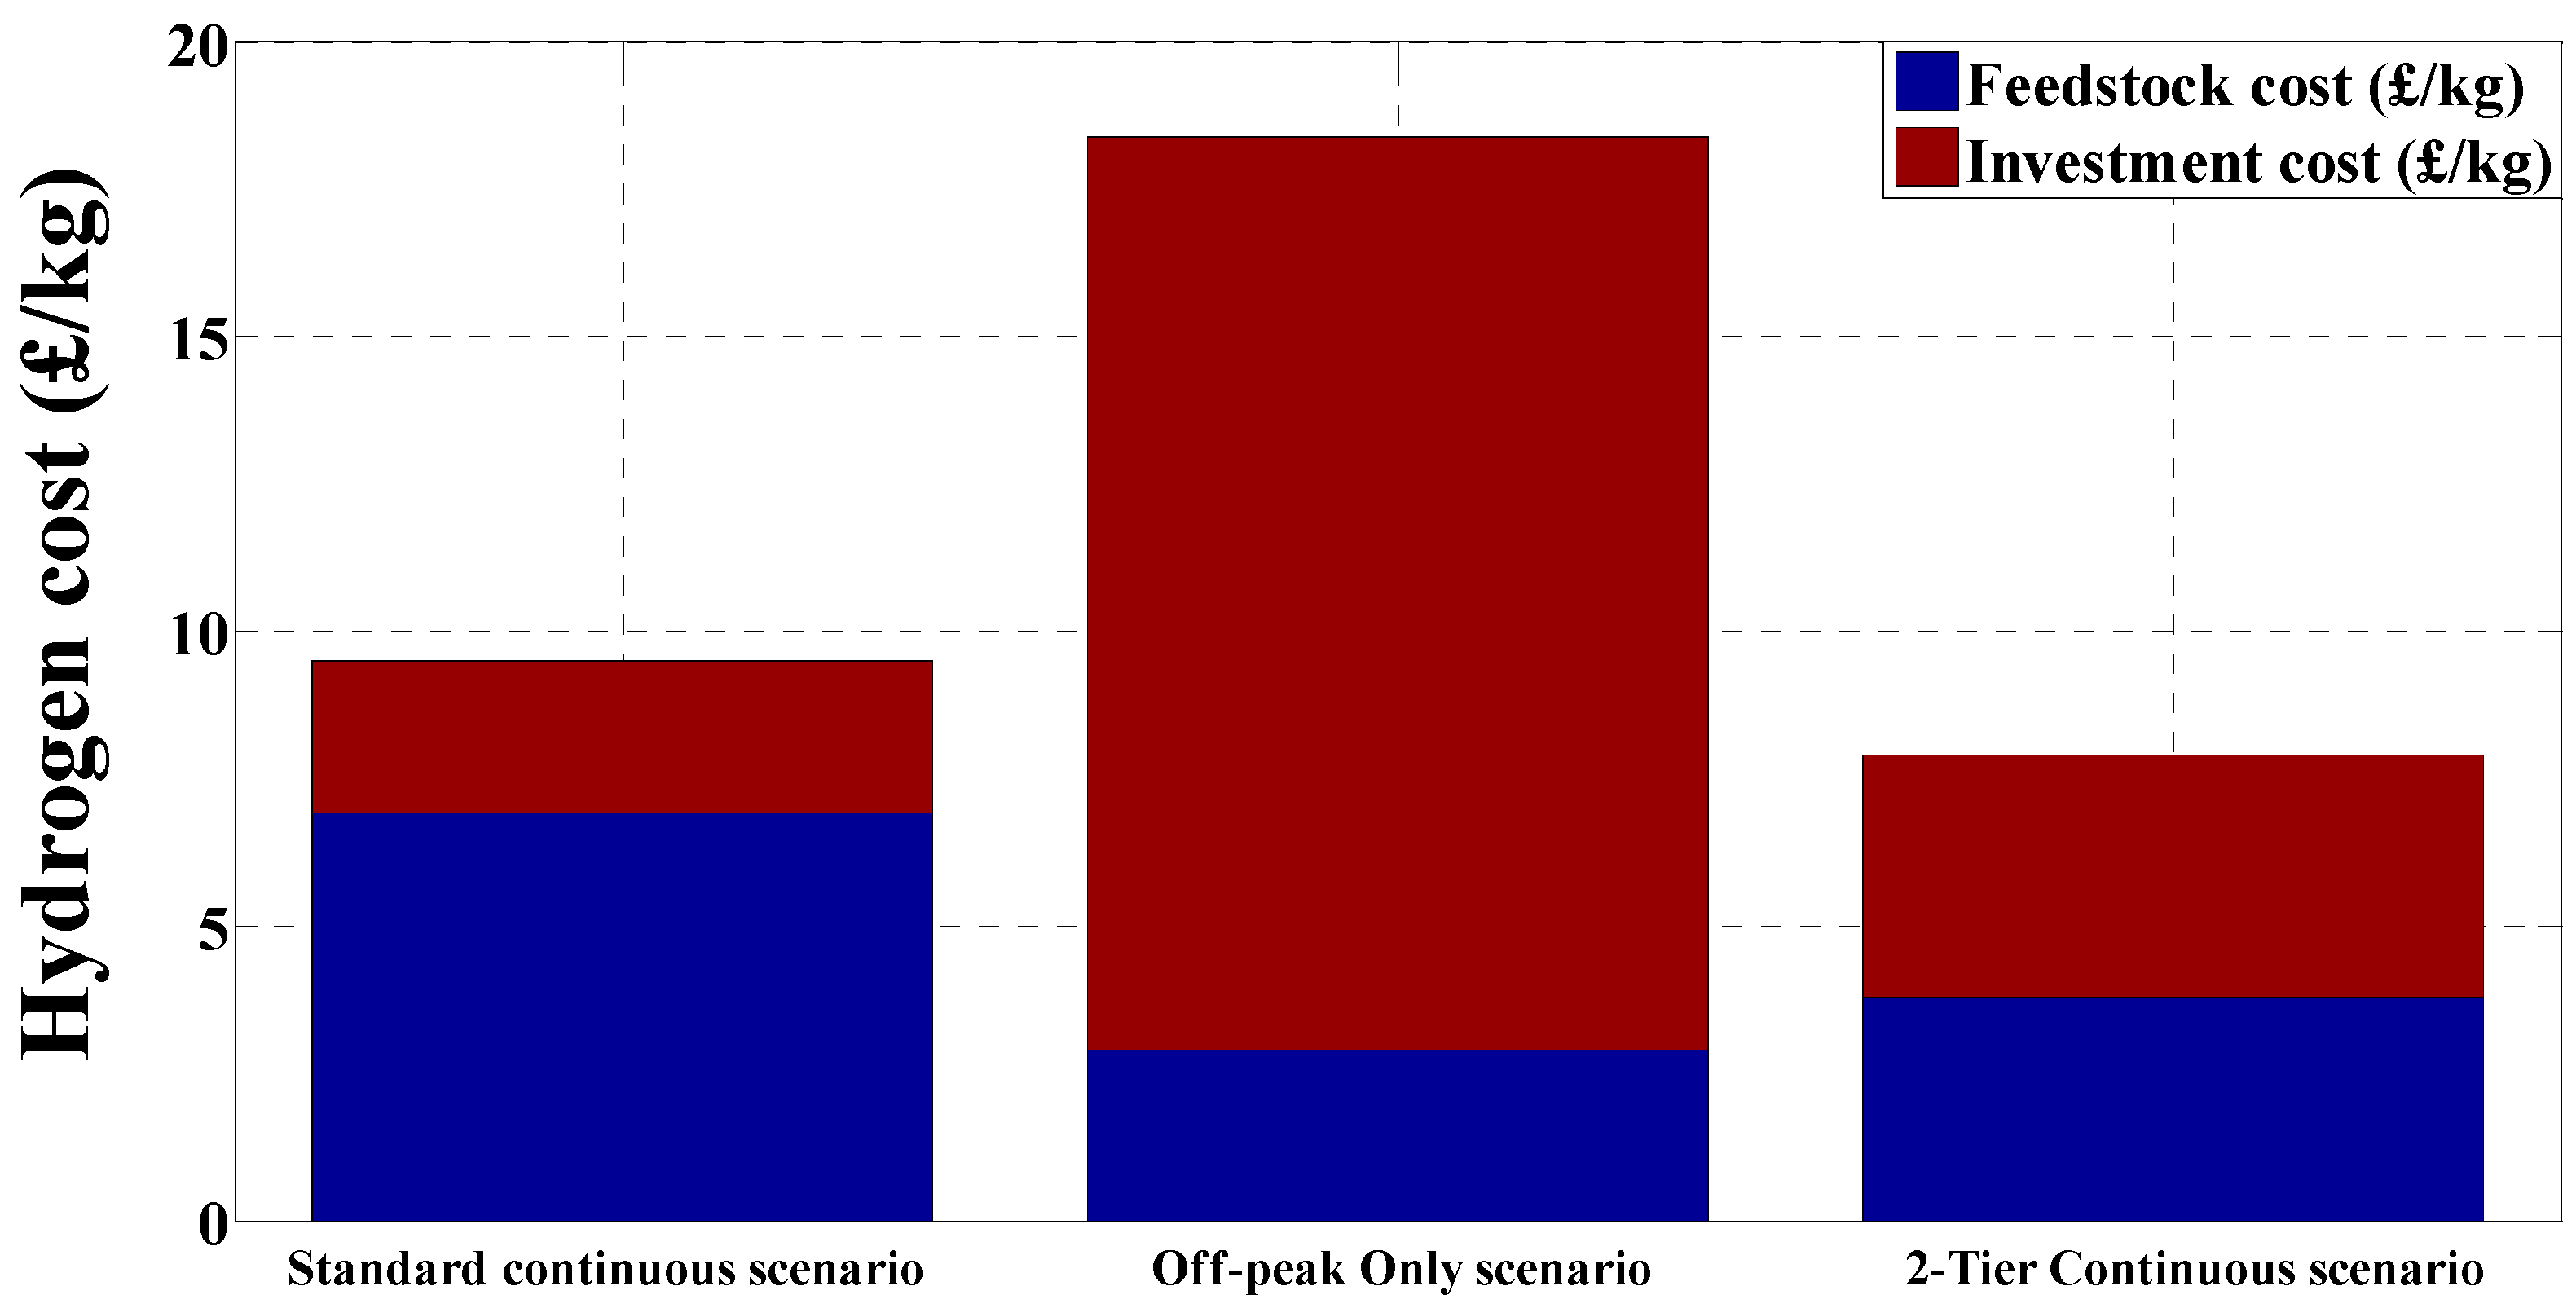
For the first scenario, the electricity price is 12 p/kWh, which equates to £6.90 per kilogram of hydrogen produced. This is very expensive compared to second and third scenarios because all the electricity consumed is at the standard flat-rate tariff. In the other two scenarios, both of which have a 2-tiered tariff arrangement, the higher (peak-rate) tariff is the same price, while the lower (off-peak rate) is 5 p/kWh. In the second scenario, the electricity cost per kilogram of hydrogen is reduced by from £6.90 to £2.90. However, this does not mean that the hydrogen cost will definitely decrease, because the use of off-peak electricity requires the same amount of hydrogen (to satisfy daily demand) being produced over a shorter period of time.
In addition, because the production period is less likely to coincide with the demand profile of the fuel throughout the day, there is a greater need for storage than in the Standard Continuous scenario. A larger hydrogen store costs more and this will increase the cost per kilogram of the fuel.
In the third scenario, the electricity price per kilogram is £3.80. This price is close to that of the second scenario even when buying electricity at times of shortage and expensive tariff. However, this electricity only represents nearly 25% of the total energy consumed in this scenario.
Generally, the third scenario provides the cheapest hydrogen, followed by the first scenario and then second. The cost saving in the third scenario is driven by the low price of energy during off-peak periods (nearly 76% of energy is absorbed at off-peak times with a price of 5 p/kWh) in addition to requiring lower-cost forecourt equipment by comparison with with that of the first scenario. This difference in the price comes from the storage cost since the hydrogen storage tank in the second scenario costs nearly 16 times as much as that in the first scenario and 5 times that in the third. Reductions in investment costs may be confidently anticipated due to intensive ongoing research in this field, which will lead to reduced hydrogen cost in the second scenario and enhanced prospects for hydrogen as a promising energy storage technique. The hydrogen cost details for all scenarios is presented in
Figure 10.
For all scenarios, the condition that the final hydrogen level must equal to, or higher than its initial value each day has been satisfied, as shown in
Figure 11,
Figure 12 and
Figure 13. In other words, on some days, the energy availability is enough to meet fuel demand and produce more hydrogen for later use, but due to the limits of the electrolyser capacity, this surplus energy cannot be absorbed. Increasing the electrolyser capacity could solve the problem and ensure fuel demand is satisfied on days of low hydrogen production, but this would increase the average price of the hydrogen.
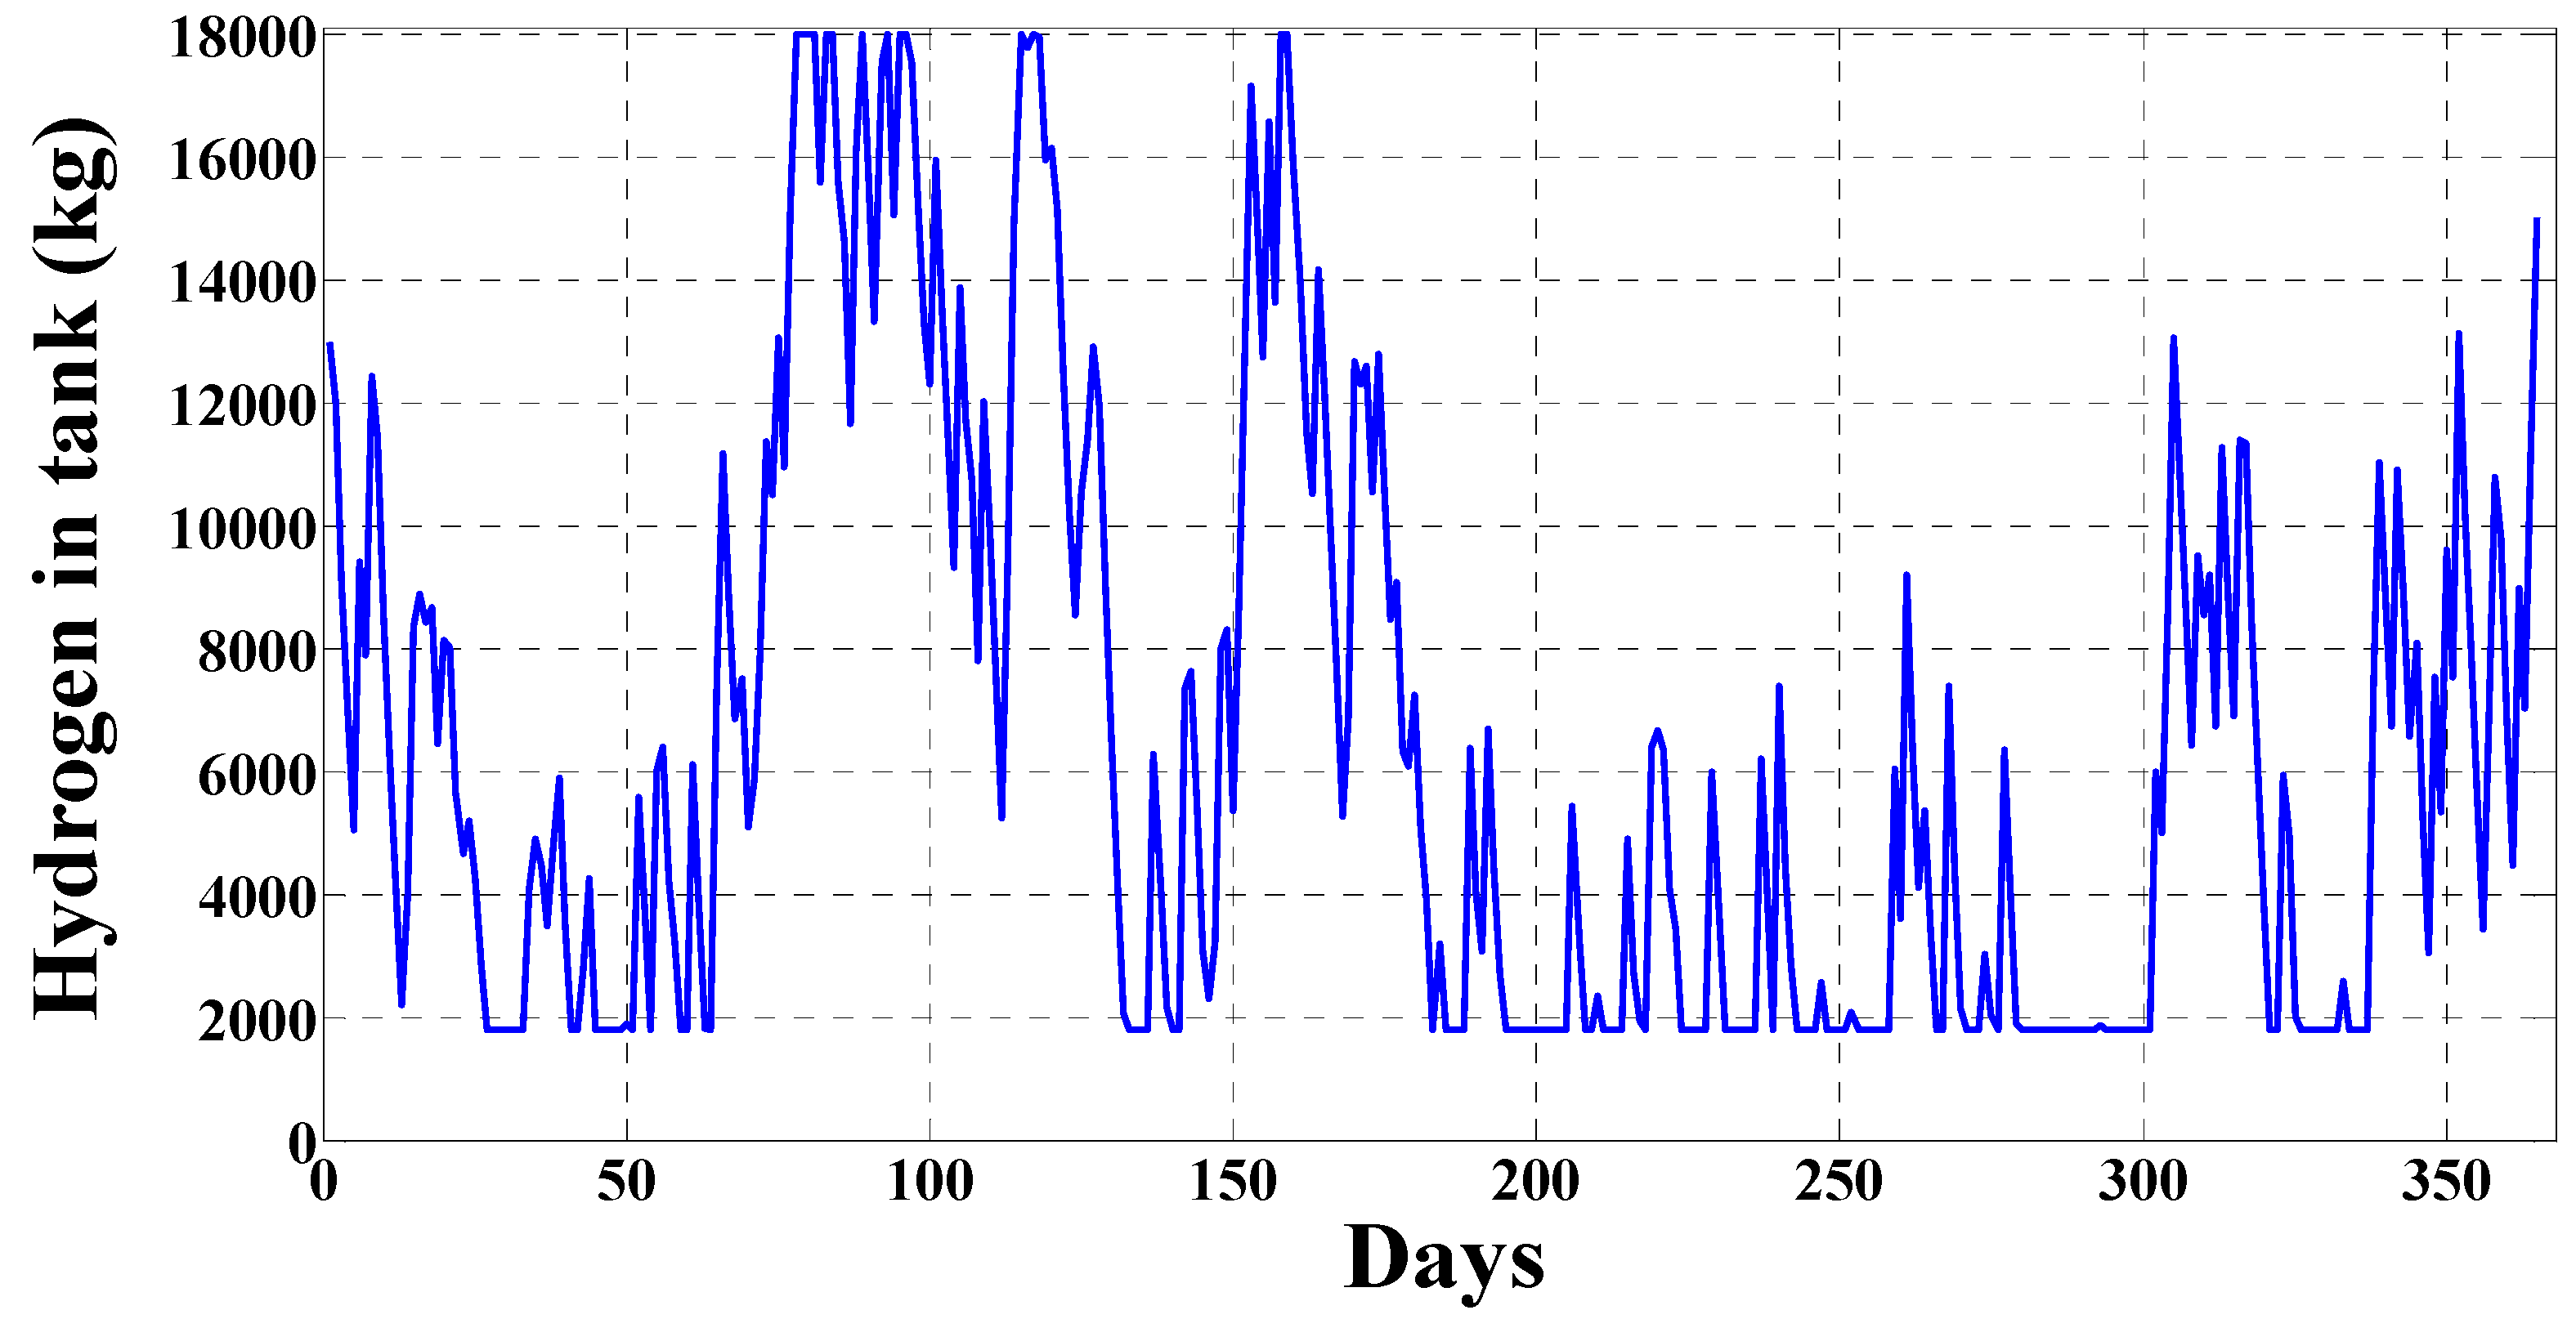
The hydrogen storage tank in Scenario 2 is very large and, due mainly to the consequently high capital cost, this leads to increased hydrogen cost. The cost of the hydrogen store in the second scenario represents nearly 84% of the investment cost and 71% of the resulting hydrogen cost. As shown in
Figure 12, the hydrogen production varies is between 40,000 kg and 95,000 kg, which is equal to 55,000 kg storage space. With the addition of a minimum allowed level in the tank of 9500 kg, the appropriate storage capacity would be 65,000 kg. Reducing the storage to this size would clearly affect the hydrogen cost, dropping it from £20/kg to £14/kg. Optimal sizing of the system components for the second scenario can significantly reduce the hydrogen cost. However, at both storage sizes (95,000 and 65,000 kg), the nearly 25% shortage of fuel supply could be supplied by importing hydrogen from other suppliers and this cost should be added to the total cost.
Hydrogen production, component cost and the hydrogen cost details for all three scenarios is presented in
Table 9.
11. Conclusions and Future Work
This paper investigates the possibility of flexible electrolyser operation at garage forecourts as a demand-side response (DSR) tool for the grid and a production method for hydrogen fuel to be used in the transport sector in Libya. The study compares three main scenarios, based on energy availability and price. An assumption was made that wind power would be used to meet the electricity demand of the Green Mountain area and, based on mismatches between supply and demand, temporary surpluses of available power are absorbed by electrolysis for hydrogen production.
This optimisation of electrolytic hydrogen production has been implemented to achieve the twin goals of balancing the grid by absorbing temporary surpluses of renewable energy and reducing the cost of hydrogen by operating electrolysers at times of lowest electricity tariff. In Scenario 1 (Standard Continuous), the electrolyser is operated continuously on a standard all-day tariff of 12 p/kWh, in Scenario 2 (Off-Peak Only), it only operates only during off-peak periods at a lower price of 5 p/kWh in a 2-tier tariff system, and in Scenario 3 (2-Tier Continuous), it operates continuously, paying the 5 p tariff at off-peak times and 12 p tariff at other times. It was concluded that the cheapest electricity cost per kg of hydrogen produced was £2.90, which occurred in Scenario 2, the next cheapest, at £3.80, was in Scenario 3, and the most expensive was £6.90/kg in Scenario 1. Achieving a competitive price for hydrogen will require reductions in the capital cost of the system as well as the operating costs explored in this paper. The competitive price of hydrogen should be in line with the target price set by the parties that have a long history in this field, e.g., the US DOE. On the other hand, hydrogen prices need to become comparable with those of the conventional fuels it must compete within similar applications. Yet, it should not be forgotten that some other benefits of hydrogen usage, such as its contribution to stable electricity networks and the reduction of harmful emissions, also have potential economic value.
In terms of satisfying projected hydrogen fuel demand, the first and third scenarios were successful; however, the second scenario struggles to satisfy the demand due to the scale of energy surpluses and the electrolyser size restriction. The cheapest hydrogen price is achieved in the off-peak scenario, because cost reduction is driven predominantly by lower electricity price. With larger electrolysers, the effect of feedstock (electricity) cost is higher than capital cost.
The greatest amount of hydrogen was produced in the second and third scenarios for two main reasons: (1) electricity was consumed regardless of whether there were any renewable energy surpluses or when the on-peak tariff was applied, and (2) the ability to store the energy due to the large storage capacity in the second scenario. However, for the first scenario the storage is small since the power is used at any time at a fixed high price as the aim of the storage was solely to deal with unplanned shortages. In the second scenario, the electrolysis operated only at off-peak times (consequently, with a low capacity factor) and, as a result, the storage needed to be large enough to accommodate large variations in production based on the surplus energy availability.
Bold policy measures are needed to reduce emissions and to provide a sustainable economic future for oil-producing nations such as Libya in a post-fossil-fuel era. In particular, this means strong support for renewable energy and hydrogen markets. Future work will focus on the following points: optimising tariff differentials to minimise costs while maximising the opportunities for DSR via dispatchable electrolysis and similar techniques and applying the optimisation to multiple forecourts, each with different hydrogen consumption and a different electrolyser.


