Technical Note

Economic Feasibility of Renewable Electricity Generation Systems for Local Government Office: Evaluation of the Jeju Special Self-Governing Province in South Korea

1
Korea Institute of Civil Engineering and Building Technology (KICT), Goyang, Gyeonggi-do 10223, Korea
2
Department of Media and Communication, City University of Hong Kong, Kowloon, Hong Kong, China
3
Department of Business Administration, Dongguk University, Gyeongju, Gyeongsangbuk-do 38066, Korea
4
University Jaume-I, Avenida de Vicent Sos Baynat, s/n, 12071 Castelló de la Plana, Spain
5
Department of Interaction Science, Sungkyunkwan University, 25-2 Sungkyunkwan-ro, Jongno-gu, Seoul 04620, Korea
*
Authors to whom correspondence should be addressed.
Sustainability 2017, 9(1), 82; https://doi.org/10.3390/su9010082
Submission received: 20 September 2016 / Revised: 28 December 2016 / Accepted: 3 January 2017 / Published: 9 January 2017
(This article belongs to the Section Economic and Business Aspects of Sustainability)

Abstract

:
While environmental and energy concerns have become global issues, the government of South Korea has made notable efforts and formulated plans for the diffusion of renewable energy generation facilities for the nation’s public and governmental institutions. Accordingly, Jeju Island has become one of the most promising locations for utilizing renewable energy resources. This study aims to propose potential configurations for renewable energy generation facilities (mainly solar and wind energy facilities) in response to the electricity demand of the main local governmental offices of Jeju Special Self-Governing Province. The study utilizes the hybrid optimization of multiple energy resources software to simulate two optimized configurations for generation at a cost of energy of $0.306 per kWh (independent) and $0.204 per kWh (grid-connected) with 100% renewable fraction for the island. The implications of the simulation results and limitations of the study are discussed.

1. Introduction

The Act on The Promotion of the Development, Use and Diffusion of New and Renewable Energy was revised in 2013 and, since then, it has played a primary role in supporting the renewable energy industry by obligating newly established buildings with a total floor area of more than 3000 m2 to invest at least 5% of the entire construction cost in a renewable energy system [1]. The Act has been strictly executed, especially with regard to national and local government institutions and offices. Under this Act, the South Korean government initiated the Renewable Energy Portfolio Standard (RPS) and Feed-in-Tariff (FIT) programs, which require electricity suppliers to provide a minimum ratio of their electricity demand via appropriate renewable energy resources [2]. In addition, the government exerted significant effort to install and operate a sustainable electricity system by exploiting solar heat, sunlight, wind power, geothermal heat, and tidal power [3]. Moreover, the South Korean government has stipulated that both public and private sectors should actively participate in the distribution of renewable energy generation facilities and focus on meeting the citizens’ electricity demands [3]. Therefore, the majority of newly installed electricity generation systems now include some sort of renewable electricity generation facilities [4].
The Act also states that the obligatory energy supply ratio of public institution buildings should be increased to more than 30% by 2020 [2]. Table 1 shows the target ratio of the South Korean government suggested by the Act. The Act includes 20-year promotion plans for renewable and sustainable energy diffusion and aims to identify strategic support locations having promising renewable resources [3]. However, the contribution of renewable energy generation facilities on the national energy production in 2015 is significantly lower than the suggested level (4.54%) [5]. Several islands in these locations have installed independent micro-grid systems, which can be independently operated without the grid connection, replacing their diesel generators run with fossil fuels. A number of studies in the literature have examined the efficiency of such installations. For example, Yoo and his colleagues tested the economic feasibility of independent electricity generation systems for Ulleung Island, one of the far eastern islands in Korea [6]. They proposed an optimized configuration of systems for generation at a cost of energy (COE) of $0.344 per kWh with a 97% renewable fraction (“the ratio of the electricity production of renewable energy generation facilities to the total amount of electricity production”) [6]. Bae and Shim [7] examined the case of Hong-do Island in Korea, and proposed a wind-hybrid energy system consisting of two wind-turbine models and a single diesel generator. These configurations showed a COE of $0.303–$0.313 per kWh with an 84% renewable fraction.
In addition to the cases of these islands, several studies have investigated the feasibility of using renewable energy generation systems in Korea’s interior locations. For example, Choi and colleagues investigated a photovoltaic (PV)-oriented energy generation system for grid-connected semiconductor factories in Korea [8]. They proposed a PV-hybrid electricity system utilizing PV arrays and battery units that generated at a COE of $0.668 per kWh and reduced emissions by more than 250,000 kg of carbon dioxide, 2.8 kg of unburned hydrocarbons, and 1.4 kg of nitrogen oxides per year.
The local government of Jeju Province has been particularly active in implementing policies to promote and support the shift to renewable energy (e.g., using subsidies and tax reduction). Jeju has initiated the “Carbon-Free Island Jeju by 2030” plan to make the island 100% carbon free by 2030. The first stage of the plan has already made Gapa Island (a small island located south of Jeju) completely carbon free, and the island’s diesel generators have been replaced with new and renewable energy grids (mainly solar and wind energy). Jeju continues to implement its carbon-free policies and proposes to achieve more than a 50% renewable fraction, establish smart-grid systems, and utilize wind turbines to generate more than 2 GW of electricity (capacity-oriented) for the island [9]. Ultimately, both the national and local governments plan to disseminate renewable energy infrastructure throughout Jeju so as to supply approximately 330 MW and 850 MW by 2020 and 2030, respectively [10].
In order to find a way to further expedite and promote renewable energy plans in Jeju Special Self-Governing Province, this study develops a renewable energy-generation configuration for government offices in the island and proposes two optimal configurations for both independent and grid-connected systems. The proposed configurations are verified via the hybrid optimization of multiple energy resources (HOMER) software, a simulation tool developed in the United States by the National Renewable Energy Laboratory (NREL); this software allows for analyzing and designing simulated energy generation systems with a large number of economic and technical parameters. Table 2 shows the inputted parameters and potential outcomes of using the HOMER software.
The remainder of the article is organized as follows: Section 2 reviews the current status of the main offices of Jeju Special Self-Governing Province; Section 3 presents background information for the simulation in this study; Section 4 discusses the guidelines and simulation results; and, finally, Section 5 presents the implications and conclusions of the study.

2. Main Government Offices of Jeju Special Self-Governing Province

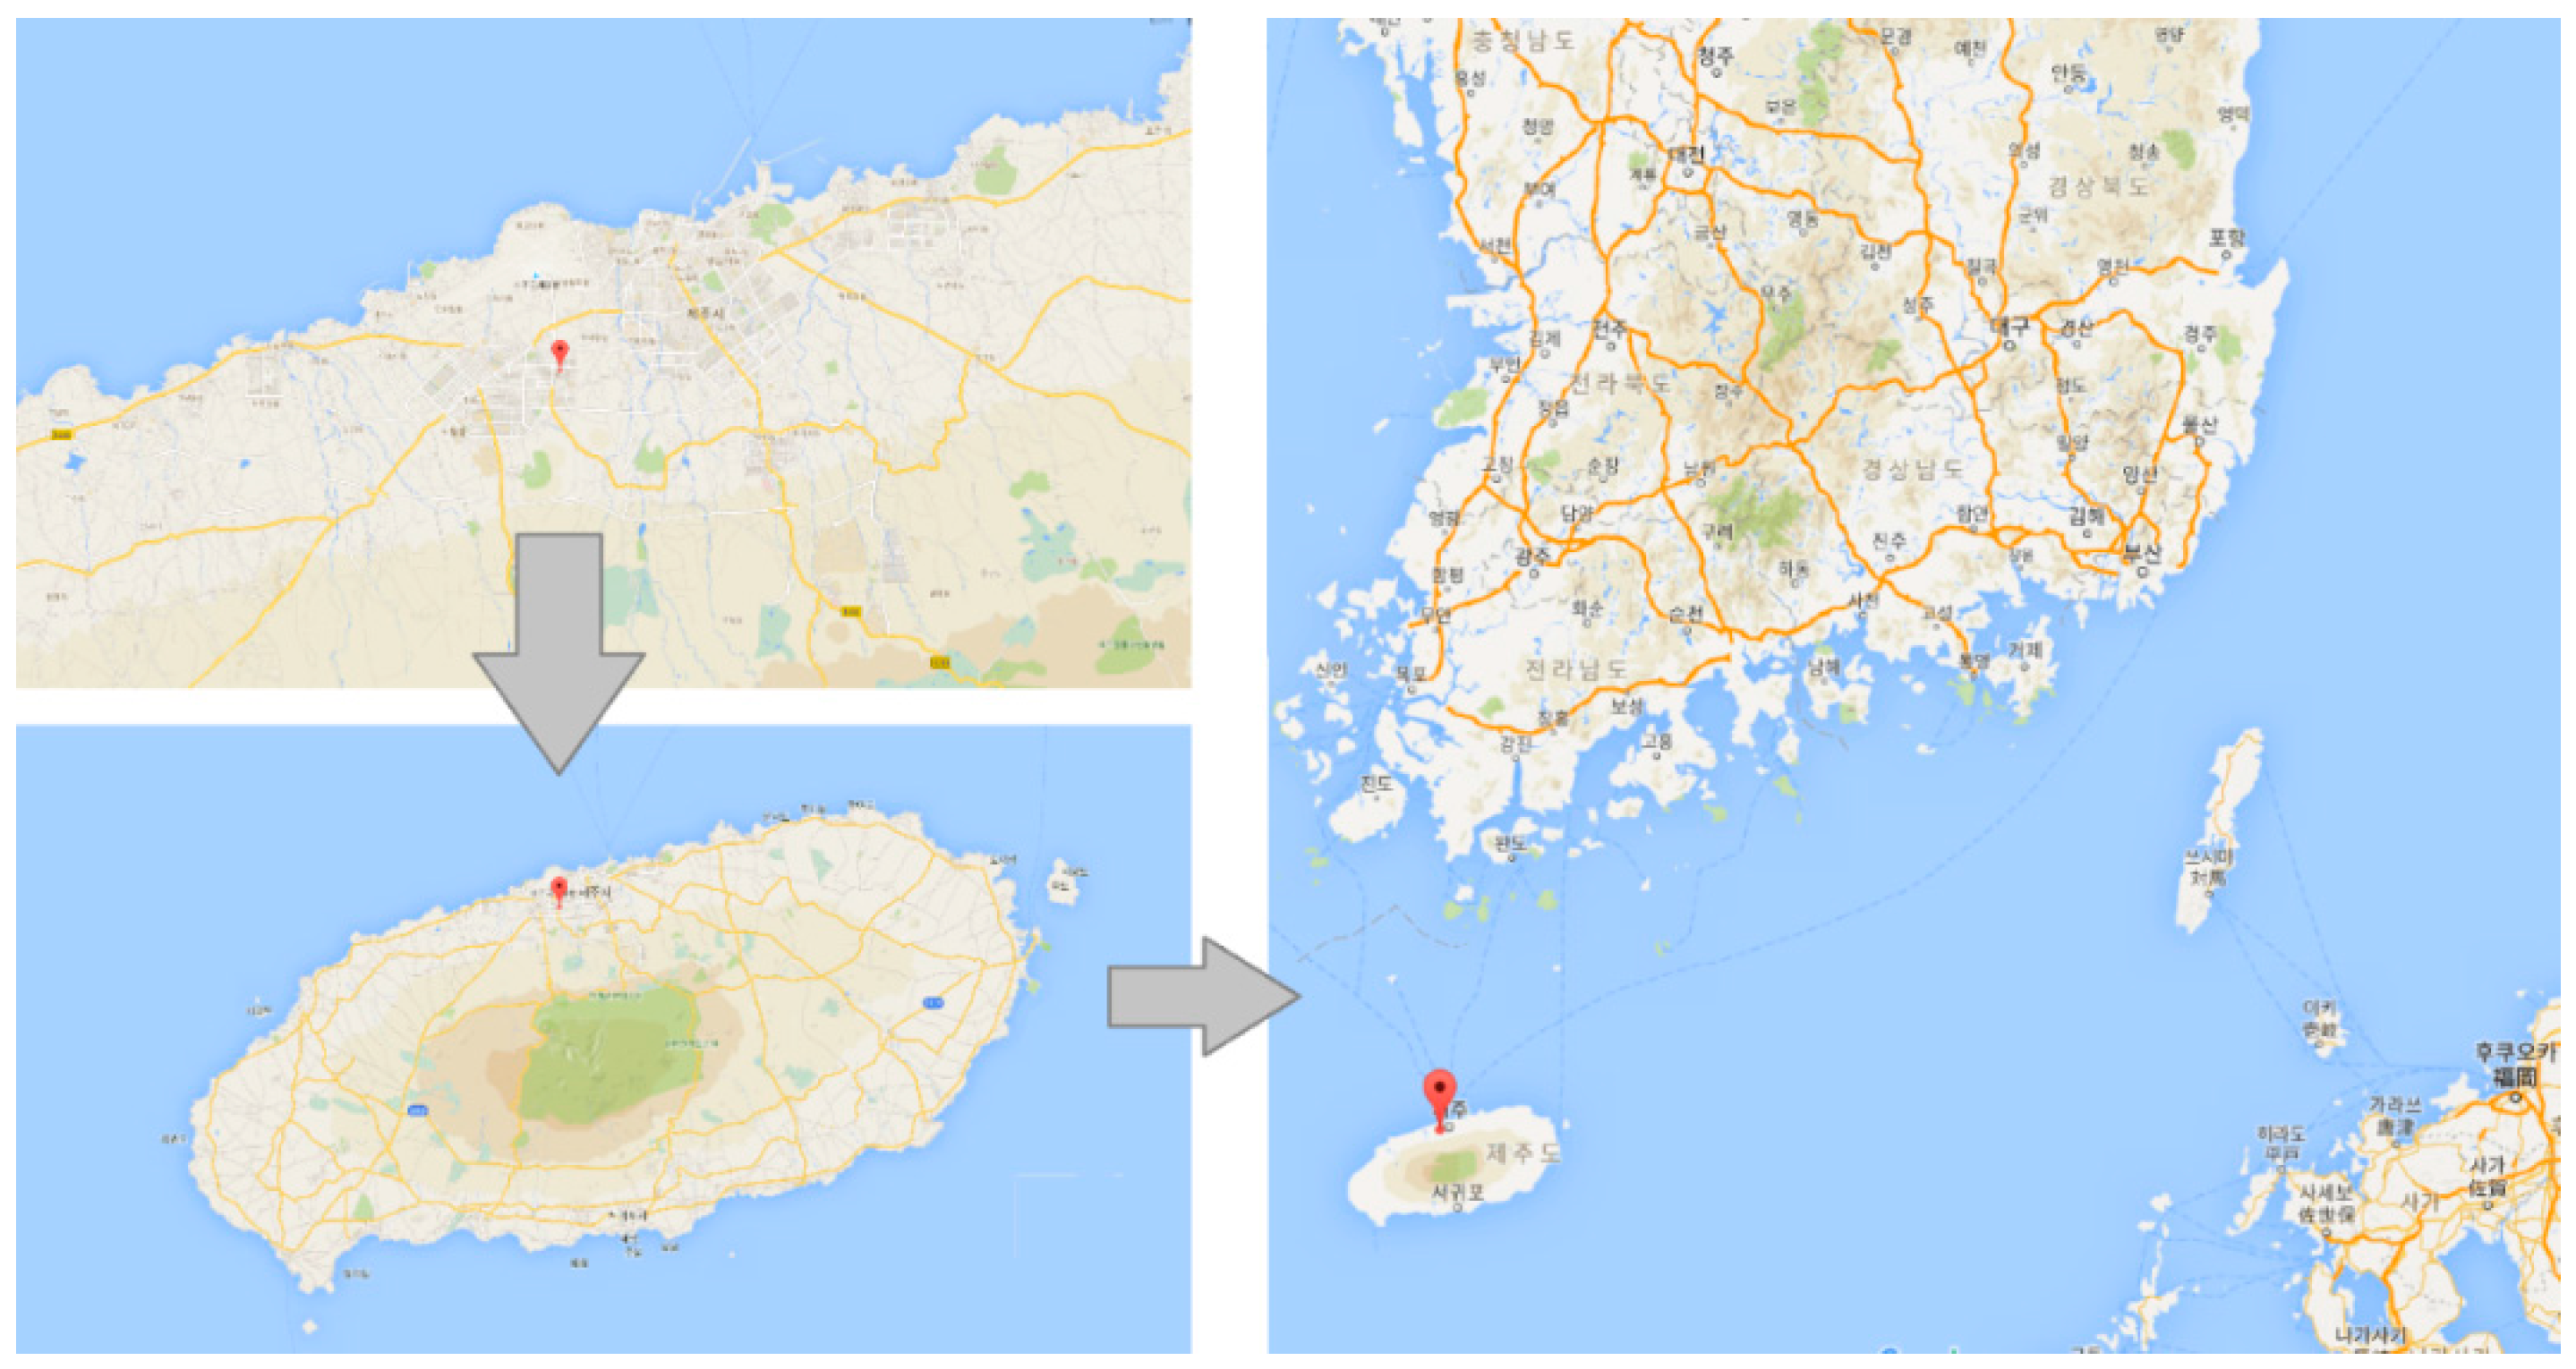
2.1. Geographical Location and Facilities

The government offices of the Jeju Island are in 12 buildings, with approximately 1100 employees [10,12], located in the northern side of the island at 33°29′ latitude and 126°29′ longitude. Figure 1 gives the location of the main offices. The total office area is 32,223 m2.

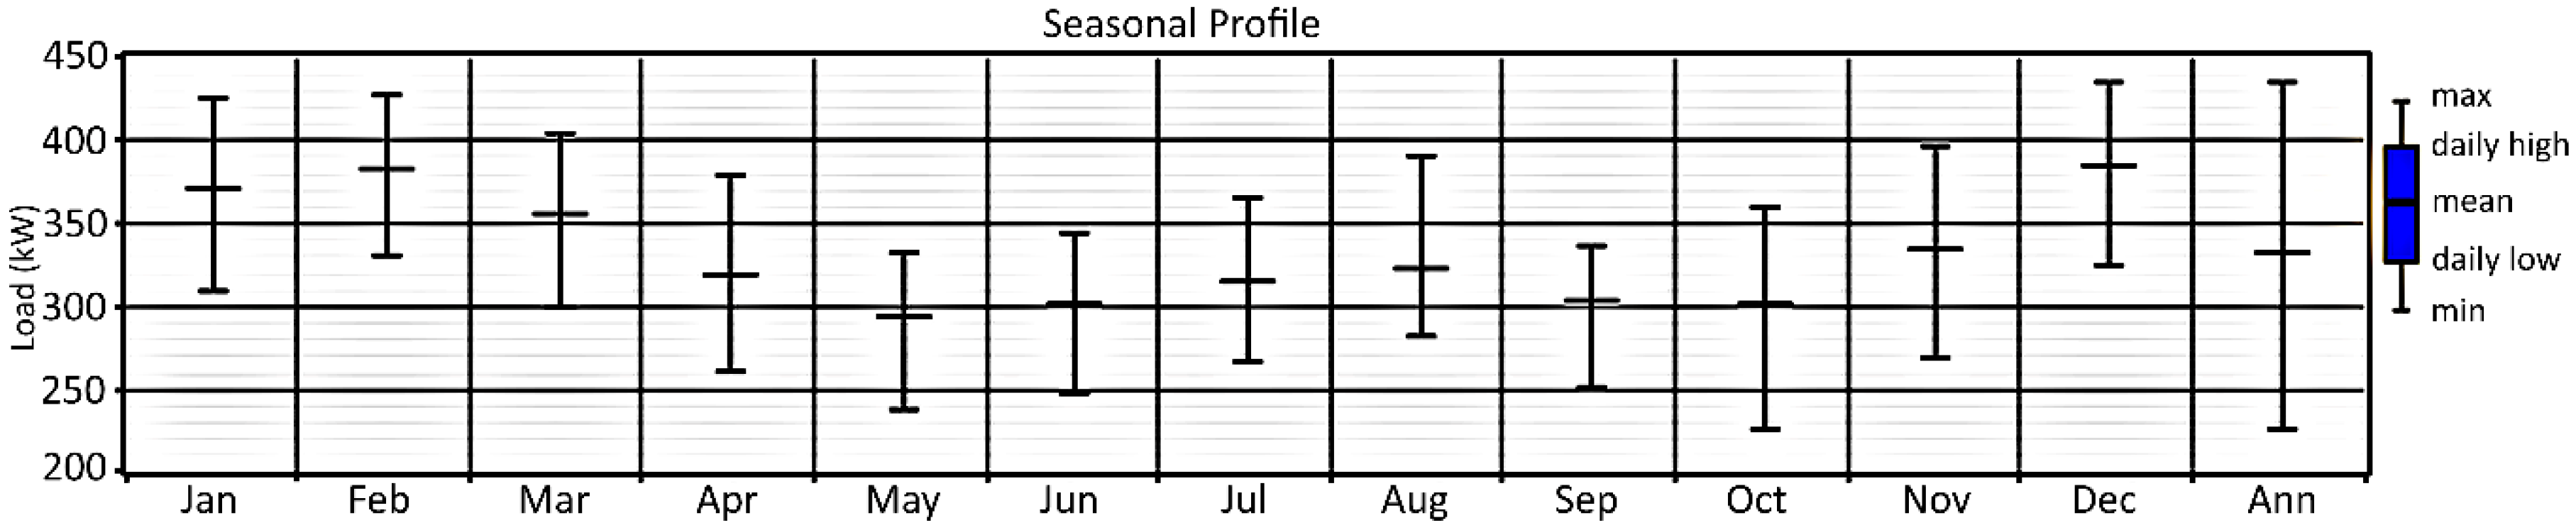
2.2. Load Information

The electricity supply of the main offices of Jeju Province is operated by the grid system of Jeju Island, and this system is connected to the South Korean national grid system. The electricity consumption data for this study are collated from the local government of Jeju Province and the Korea Electric Power Corporation databases in 2015 [6,7,8]. Figure 2 shows the seasonal profile of the electricity load of the main offices; the average electricity demand of the offices is 7948 kWh/d and 331 kW, with a peak demand of 435 kW. Thus, the load factor is calculated as 0.761.

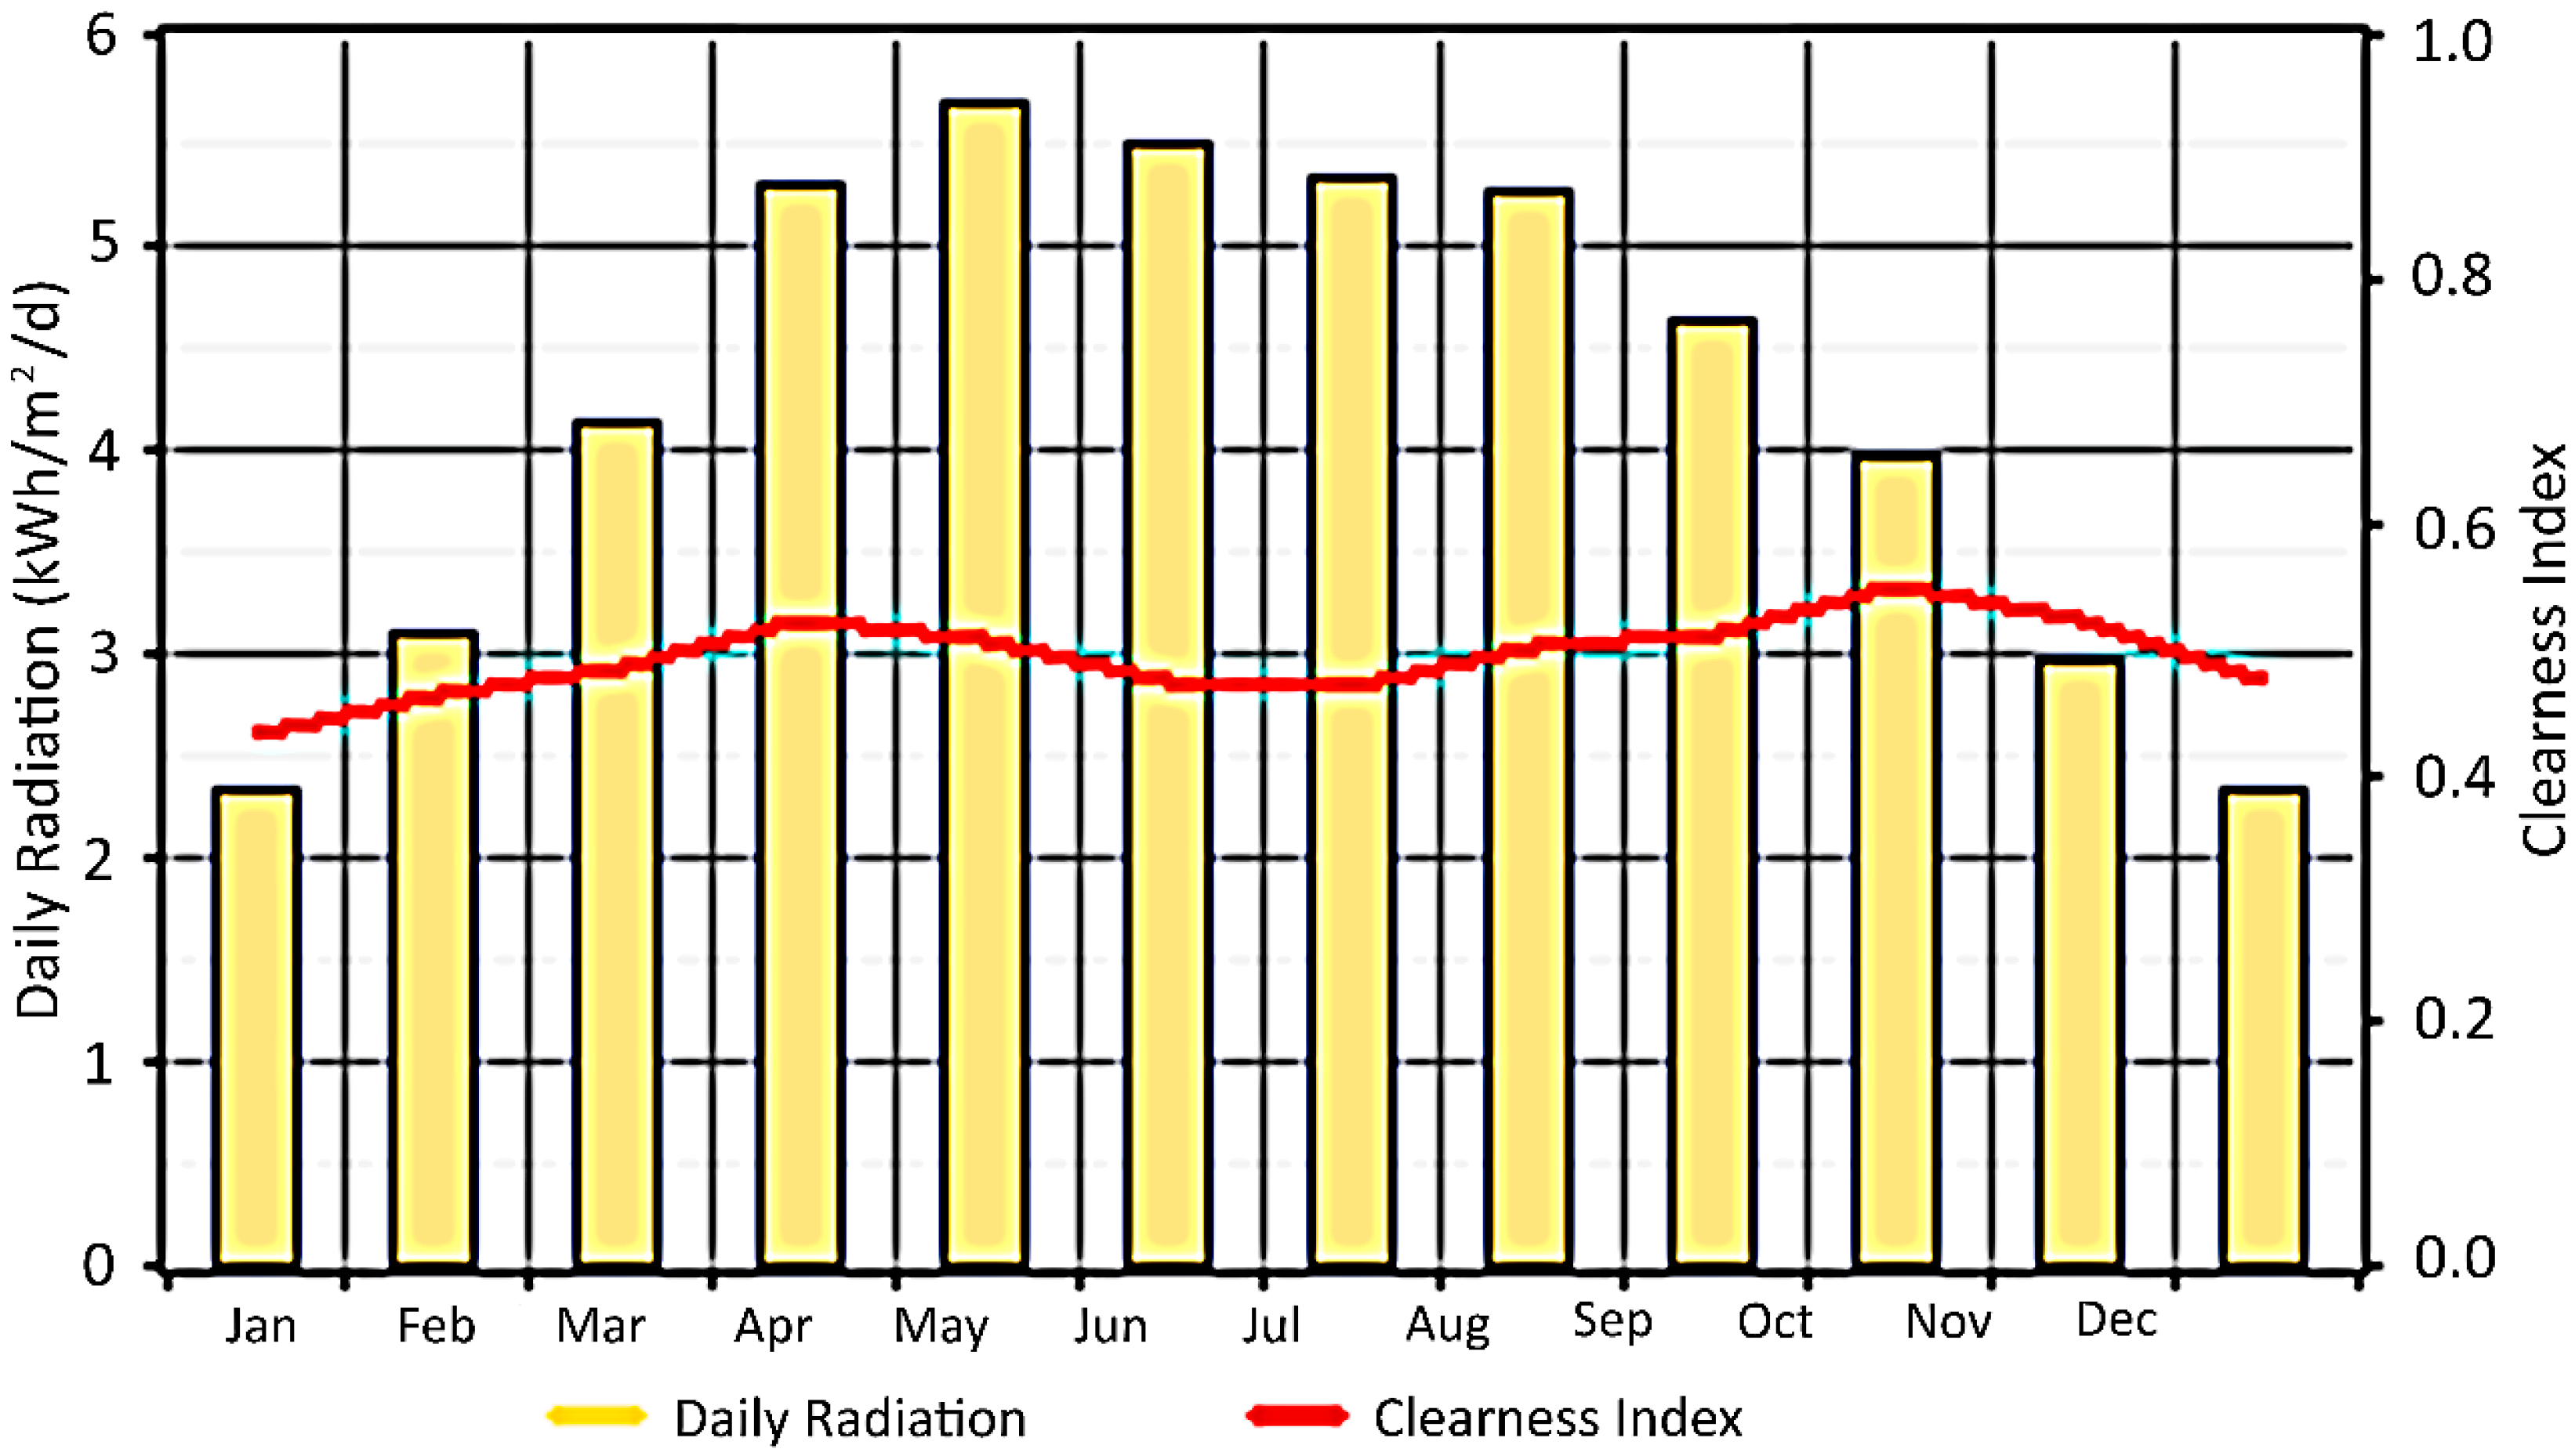
2.3. Solar Resource Information

We use the solar resource data organized by the monthly solar radiation and solar clearness index for our simulation. The data are collected from the National Aeronautics and Space Administration database [6,7,8,10]. The annual radiation and clearness index are 4.190 kWh/m2/d and 0.496, respectively. Figure 3 shows the annual solar resource information for the main offices of Jeju Province.

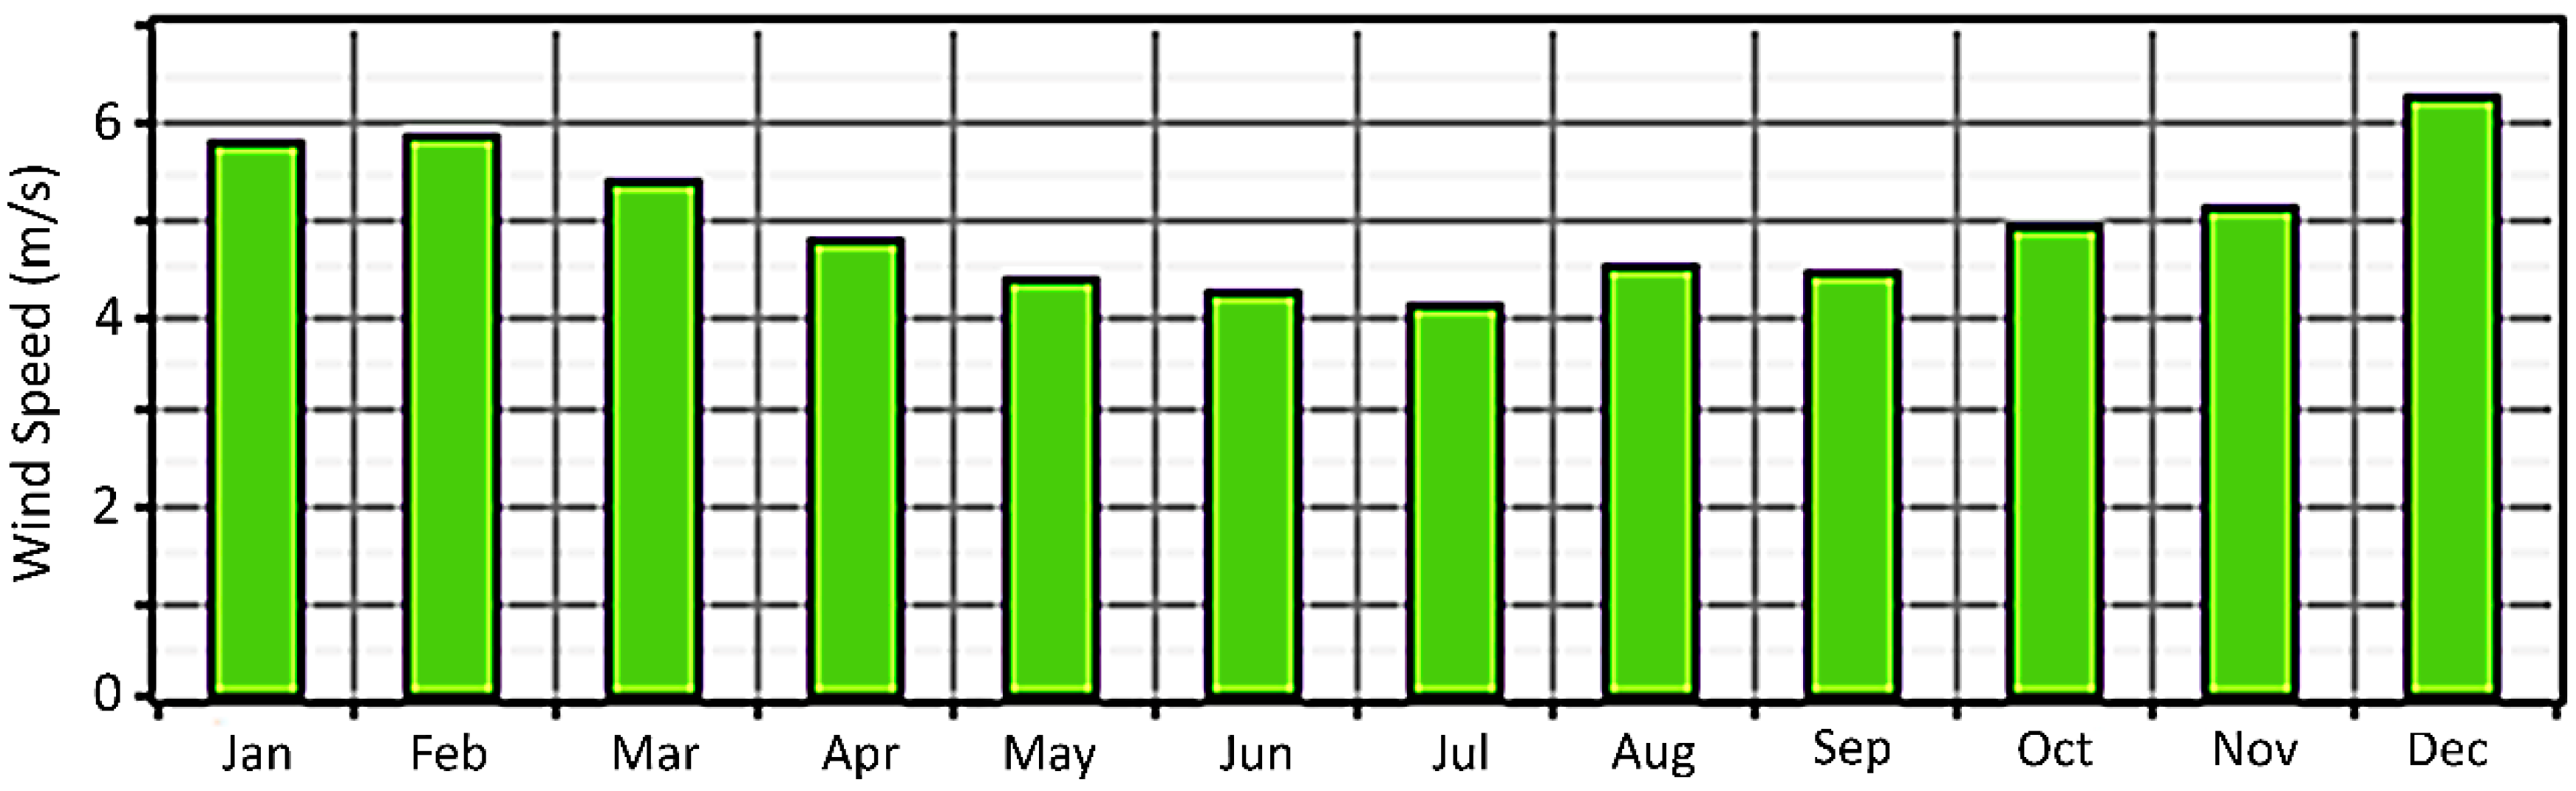
2.4. Wind Resource Information

For information on wind resources at the main offices, this simulation uses data provided by the Korea Meteorological Administration (for ground level) and the National Aeronautics and Space Administration (for 50-m level). Note that the actual hub height of the turbines is 25-m, but the wind speed data provided are only for the 50-m level [6,7,11]. Therefore, the mean of the wind speed between the ground and 50-m levels is calculated to yield the wind speed at the 25-m level (4.964 m/s). The annual wind speed information for the main offices of Jeju Province is depicted in Figure 4.

3. Simulation Background

3.1. Annual Real Interest Rate

As Dursun has shown [13], the annual real interest rate is one of the essential economic inputs required for accurate output of the HOMER software. HOMER software is one of the hybrid renewable systems thhat can be used to present the efficiency and feasibility of renewable electricity generation systems for remote or isolated areas. The annual real interest rate is defined as “the difference between the anticipated inflation rate and the long-term nominal interest rate” [13,14]. From the calculations of previous studies [6,13], this study takes 3.02% as the annual real interest rate for our simulation.

3.2. Economic Evaluation Outputs: COE and NPC

This study uses two simulation outputs as evaluation criteria for testing the feasibility of optimal configurations: COE and NPC (net present cost). COE is defined as “the mean cost of generating 1 kWh electricity from a particular configuration” [6,13,15,16], and NPC is defined as “the difference of the current worth of all cost inflows and outflows over a particular time period” [6,13,17]. In addition, the renewable fraction of the suggested configuration is assumed to be 100% if the configuration is designed for an independent electricity generation system [18].

3.3. Other Assumptions for the Simulation

From previous economic feasibility studies for electricity generation systems [2,4,6], the project lifetime is assumed to be 25 years [19]. In addition, given that the current system (grid connection) for the main offices of Jeju Province does not incur additional capital and management costs, the system fixed capital costs, as well as operation and management costs, are assumed to be zero.

3.4. Information on Cost of Components

In order to propose an optimal configuration for renewable electricity generation systems for the main offices of Jeju Province, the study needs information on the cost of potential components for the configuration. Given that the current simulation configuration involves PV arrays, wind turbines, an electrical converter, and batteries as potential components, our simulation has to consider the detailed information on the cost of each component. The installation and replacement costs of PV arrays are assumed to be $1050 per kW, with an annual operation and management cost of $20 per kW. The capacity of PV arrays is believed to range from 0 to 10,000 kW in steps of 5 kW. In addition, the operational lifetime, derating factor, and ground reflectance of PV arrays are known to be 20 years, 80%, and 20%, respectively [16,20].
A generic 10-kW turbine is one of the potential components for the simulation. The capital and replacement costs of two generic wind turbines are respectively $29,000 and $25,000, and the annual operation and management cost is $400. For the turbine, the simulation assumes a 15-year lifetime, with 25 m of hub height. The capacity of the component is assumed to range from 0 to 500 turbines, in steps of two turbines [6,13].
A WES 5 Tulipo turbine is another possible component for the simulation. This turbine has a capacity of 2.5 kW AC of rated power. The capital and replacement costs of the turbines are $5000 and $4000, respectively. The operation and management cost of the turbine is assumed to be $50 per year [19]. The number of turbines simulated in this study ranges from 0 to 500, with an increment of two turbines (0, 2, 4, …, 500). The simulation assumes a 15-year lifetime and 25-m hub height.
A Surrette 6CS25P battery is another component used in our simulation. The capital cost and replacement cost for one battery unit are $1100 and $1000, respectively [19]. The battery has a nominal voltage of 6 V, a nominal capacity of 1156 Ah and 6.94 kWh, and a lifetime throughput of 9645 kWh. The range simulated is from 0 to 10,000 batteries in steps of five batteries (0, 5, 10, …, 10,000).
An electrical converter is essential to establishing a link between AC and DC components. The capital and replacement cost per kW is $700 each, with an annual operation and management cost of $10. The efficiency ratios of inverter and rectifier inputs are 90% and 85%, respectively [19,21]. The lifetime assumed is 15 years, with 100% capacity relative to inverter. The range simulated is from 0 to 3000 kW in steps of 5 kW (0, 5, 10, …, 3000).
The current grid connection also has a role to play in developing an optimal configuration. Given that the main government offices of Jeju Province spent approximately $380,000 for electricity usage in 2013, the simulation applies $0.137 of the purchase and sell-back price from the grid connection. The purchase capacity is assumed to range from 0 to 30,000 kW.

4. Renewable Electricity Generation System

The current study proposes both an independent (Section 4.1), and a grid-connected renewable power generation systems (Section 4.2) for government offices of Jeju Province by utilizing local renewable resources. Therefore, two simulation sets are conducted.

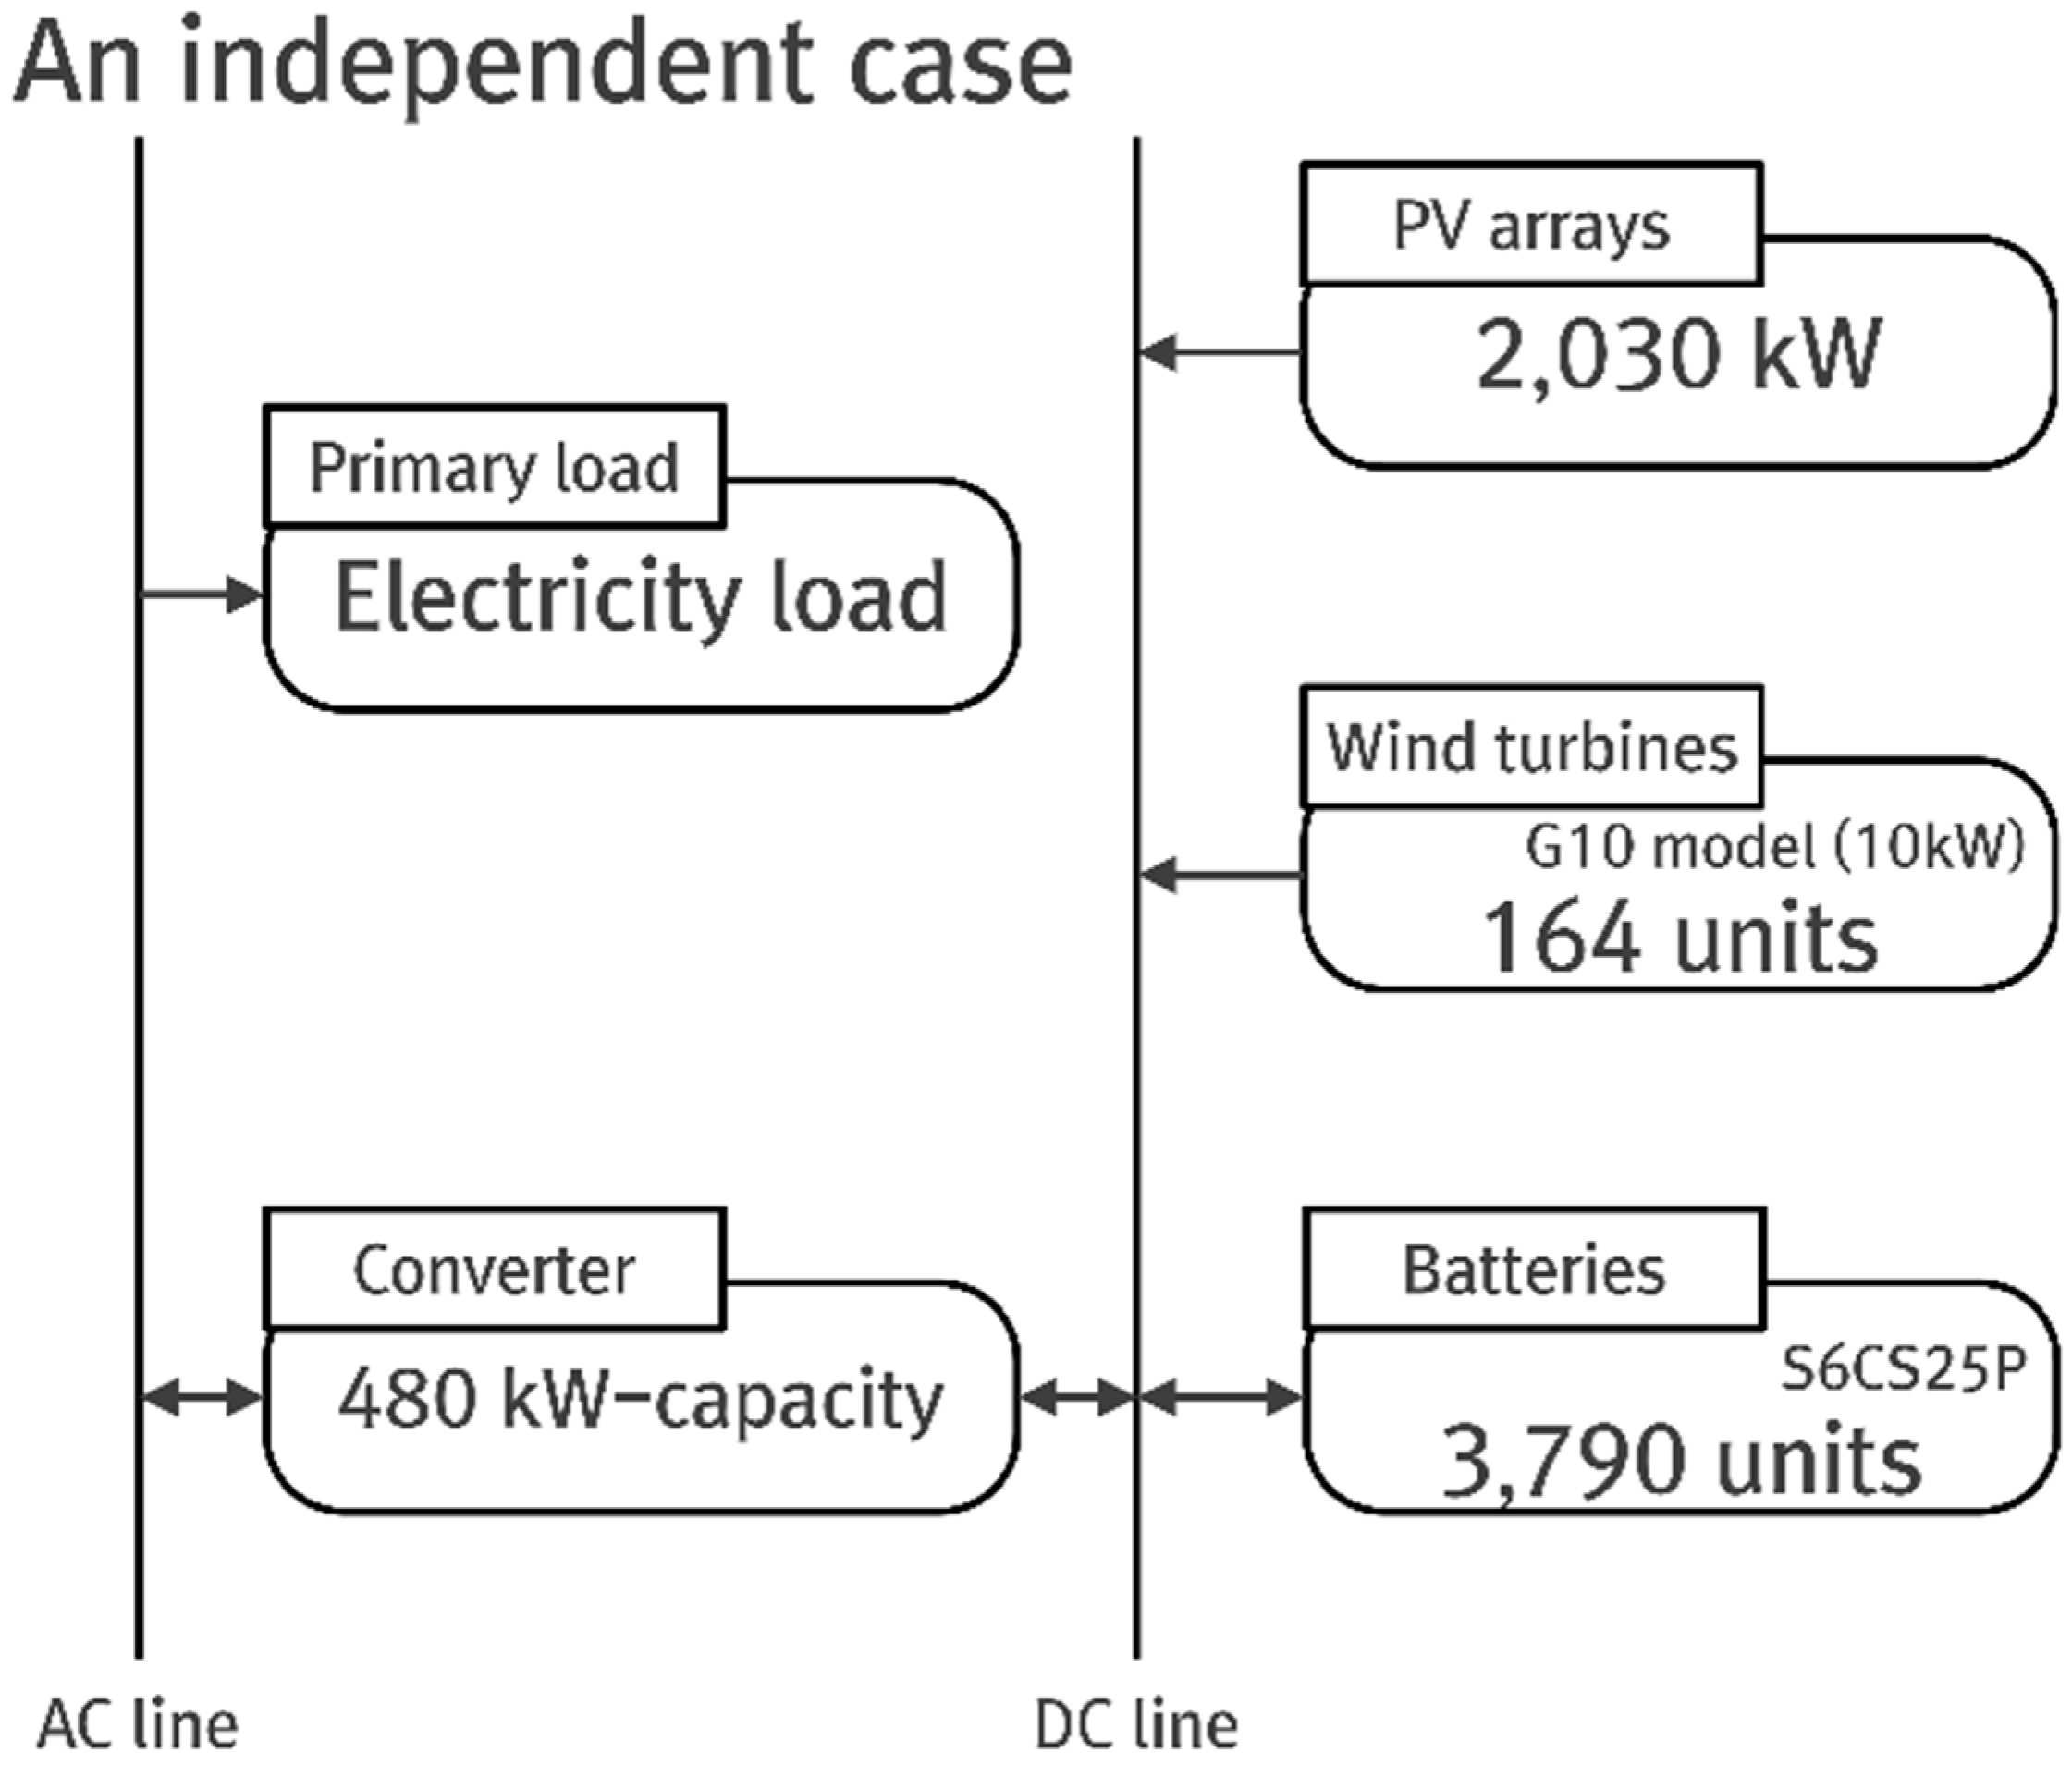
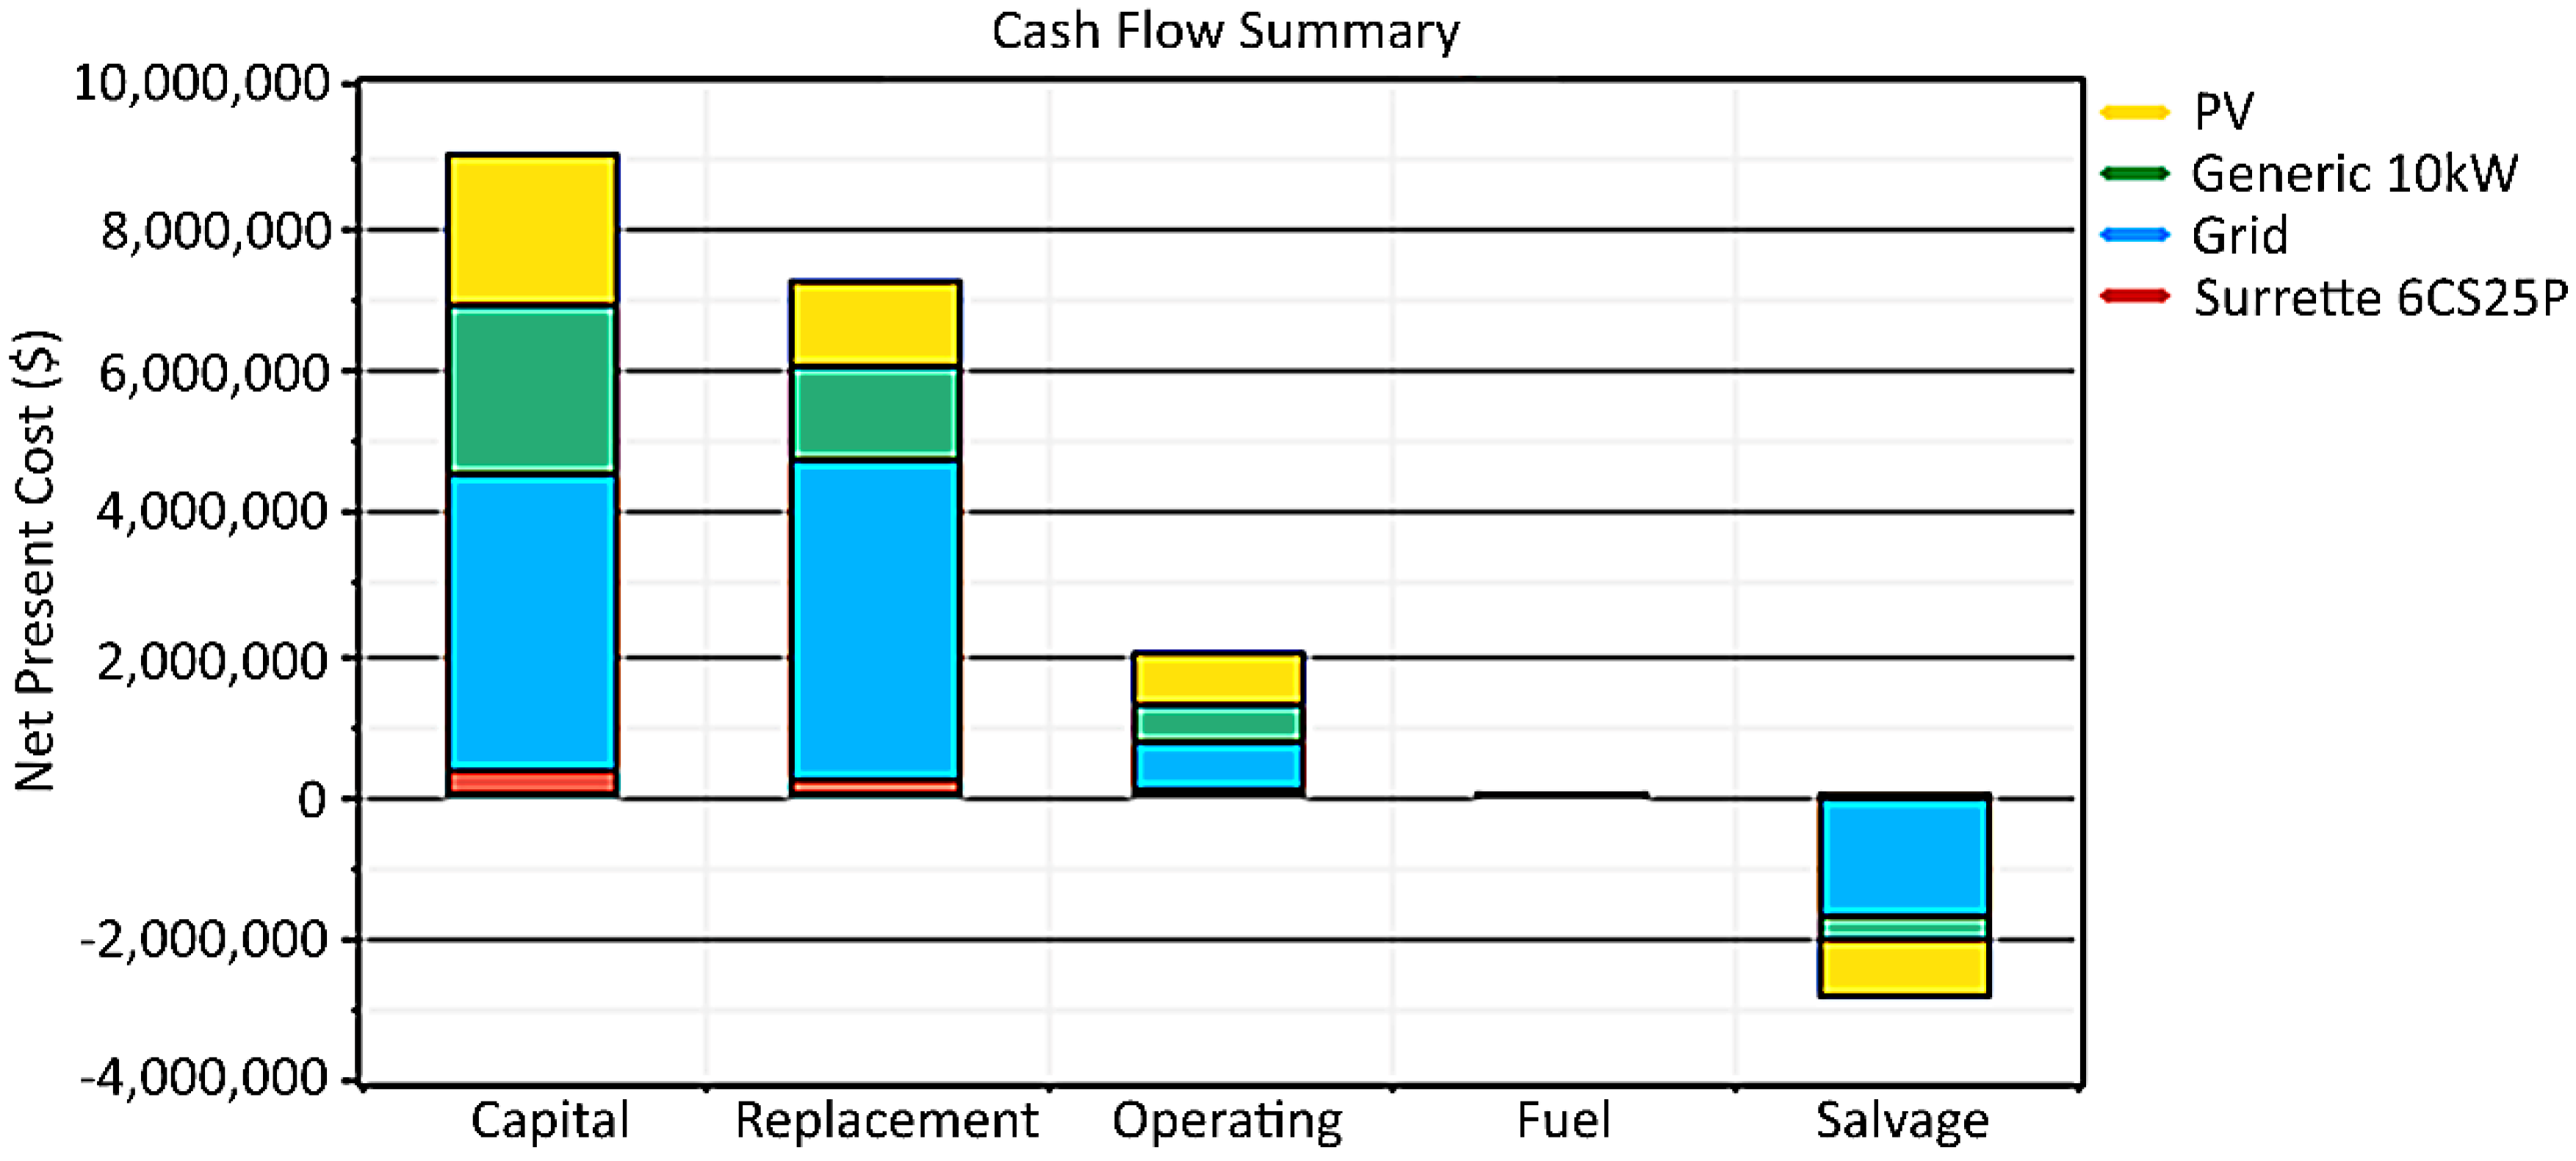
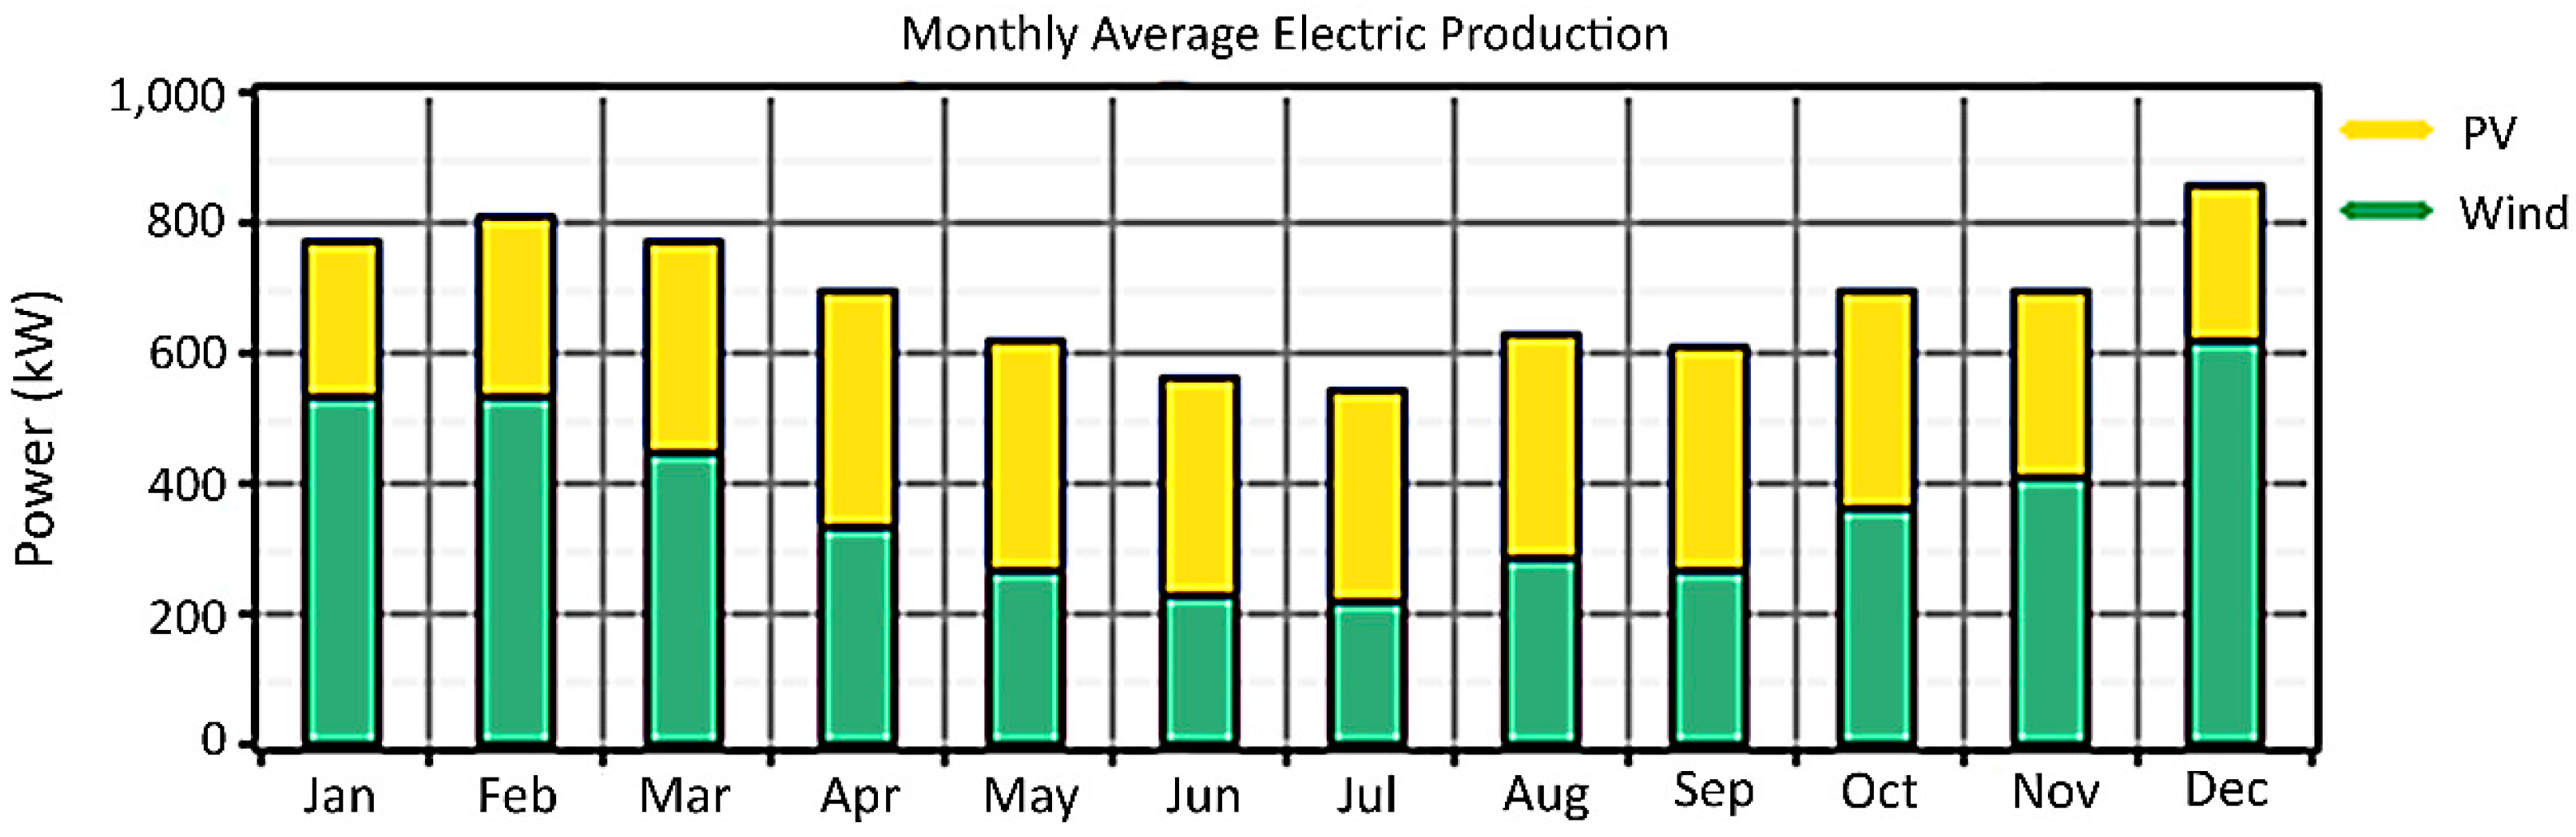
4.1. Simulation Result 1: An Independent Case

As potential configuration for the independent renewable electricity generation system, the simulation proposes a PV arrays-wind turbine (type 1: Generic 10 kW)-batteries-converter combination. The independent optimal configuration is presented in Table 3 and Figure 5. The total net present cost, annual operating cost, and COE of the configuration are $15,467,821, $370,600, and $0.306 per kWh, respectively, with a 100% renewable fraction. Table 4 shows the total and annual consumed costs of configuration. Figure 6 summarizes the cash flow of the configuration, and Table 5 provides the electricity production information. The annual electricity production is summarized in Figure 7.

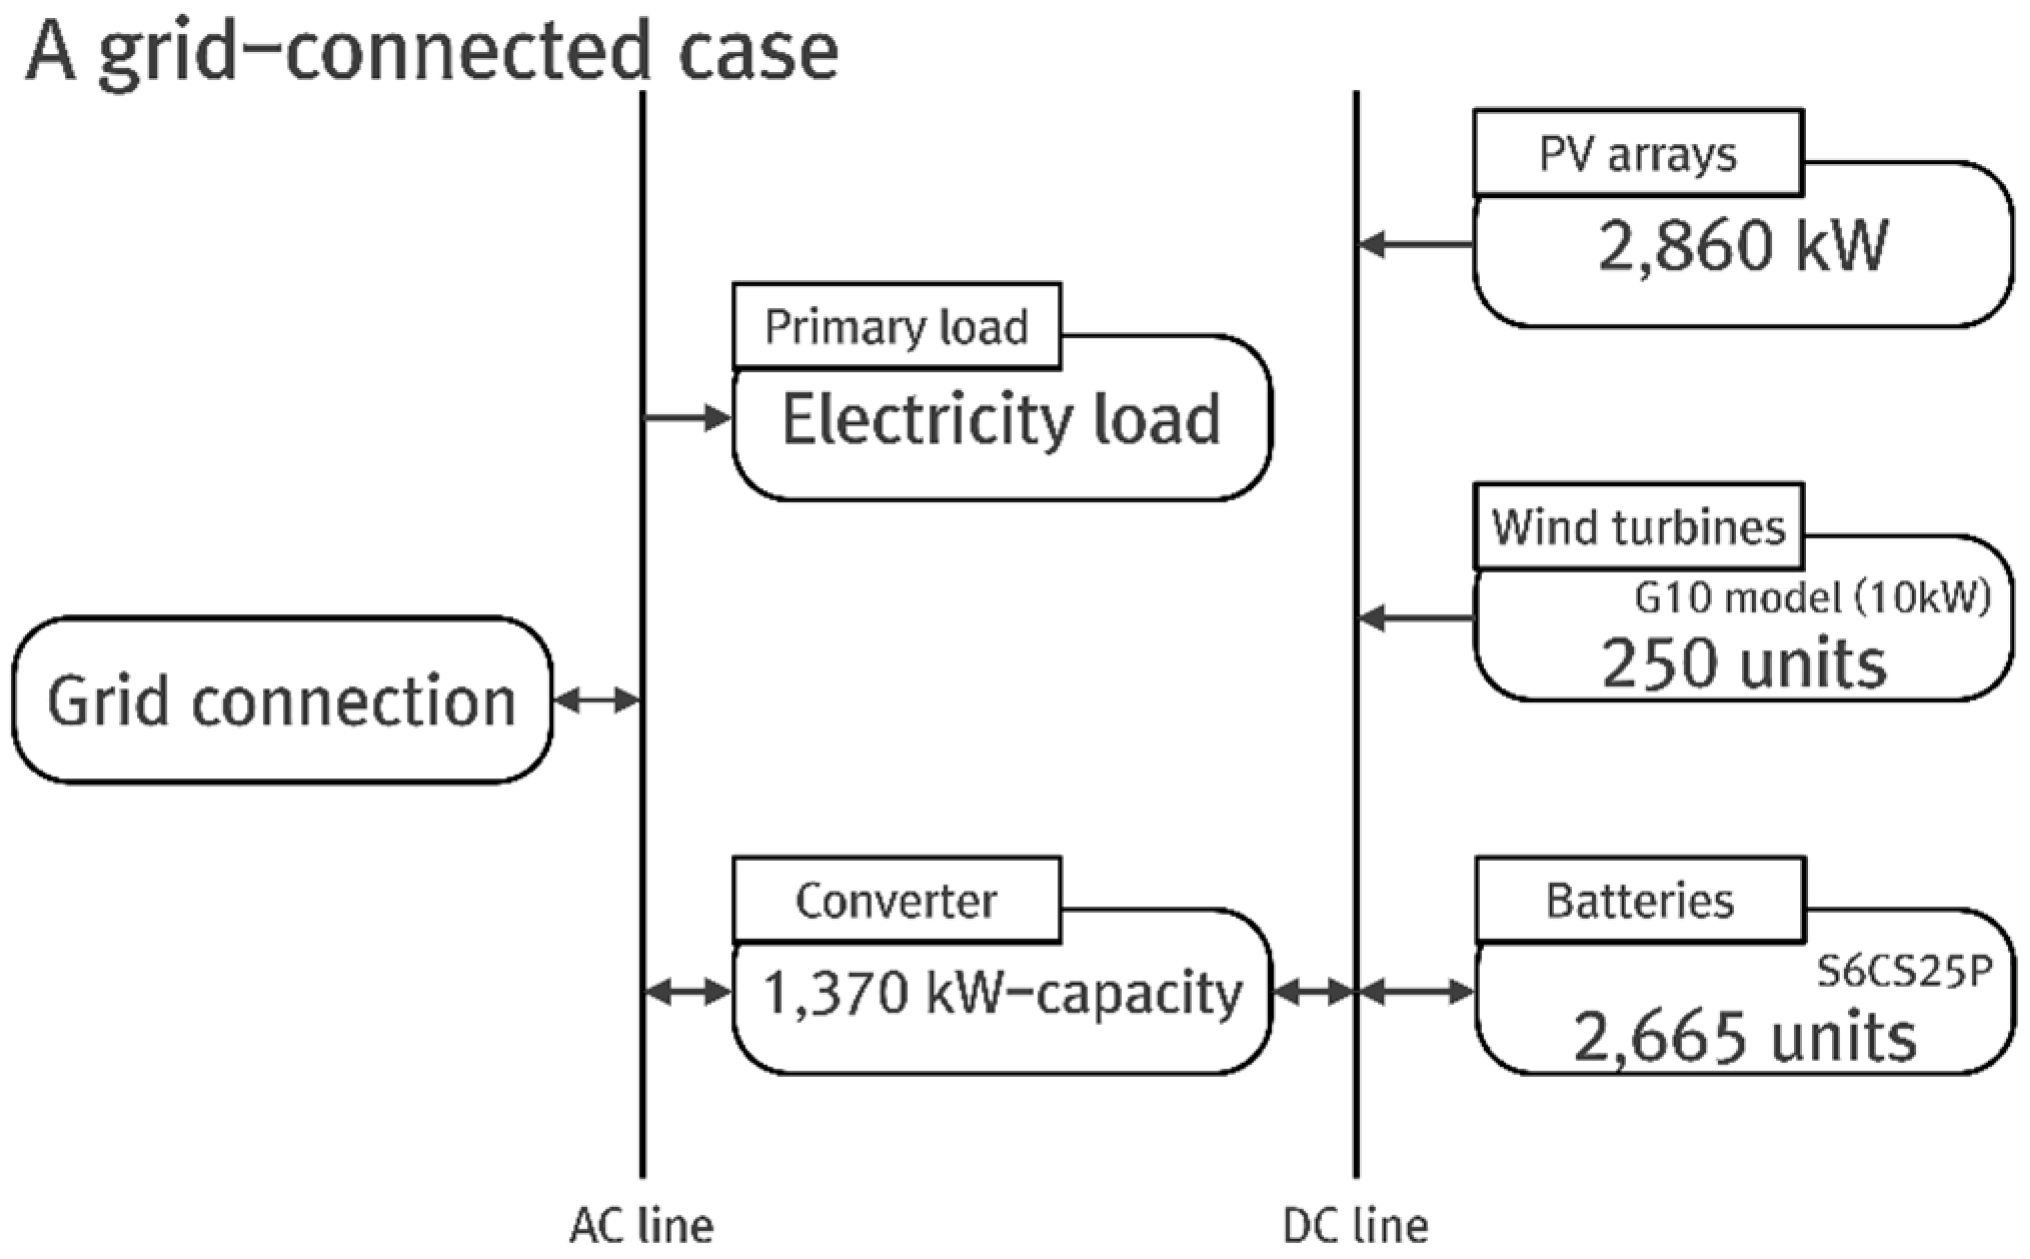
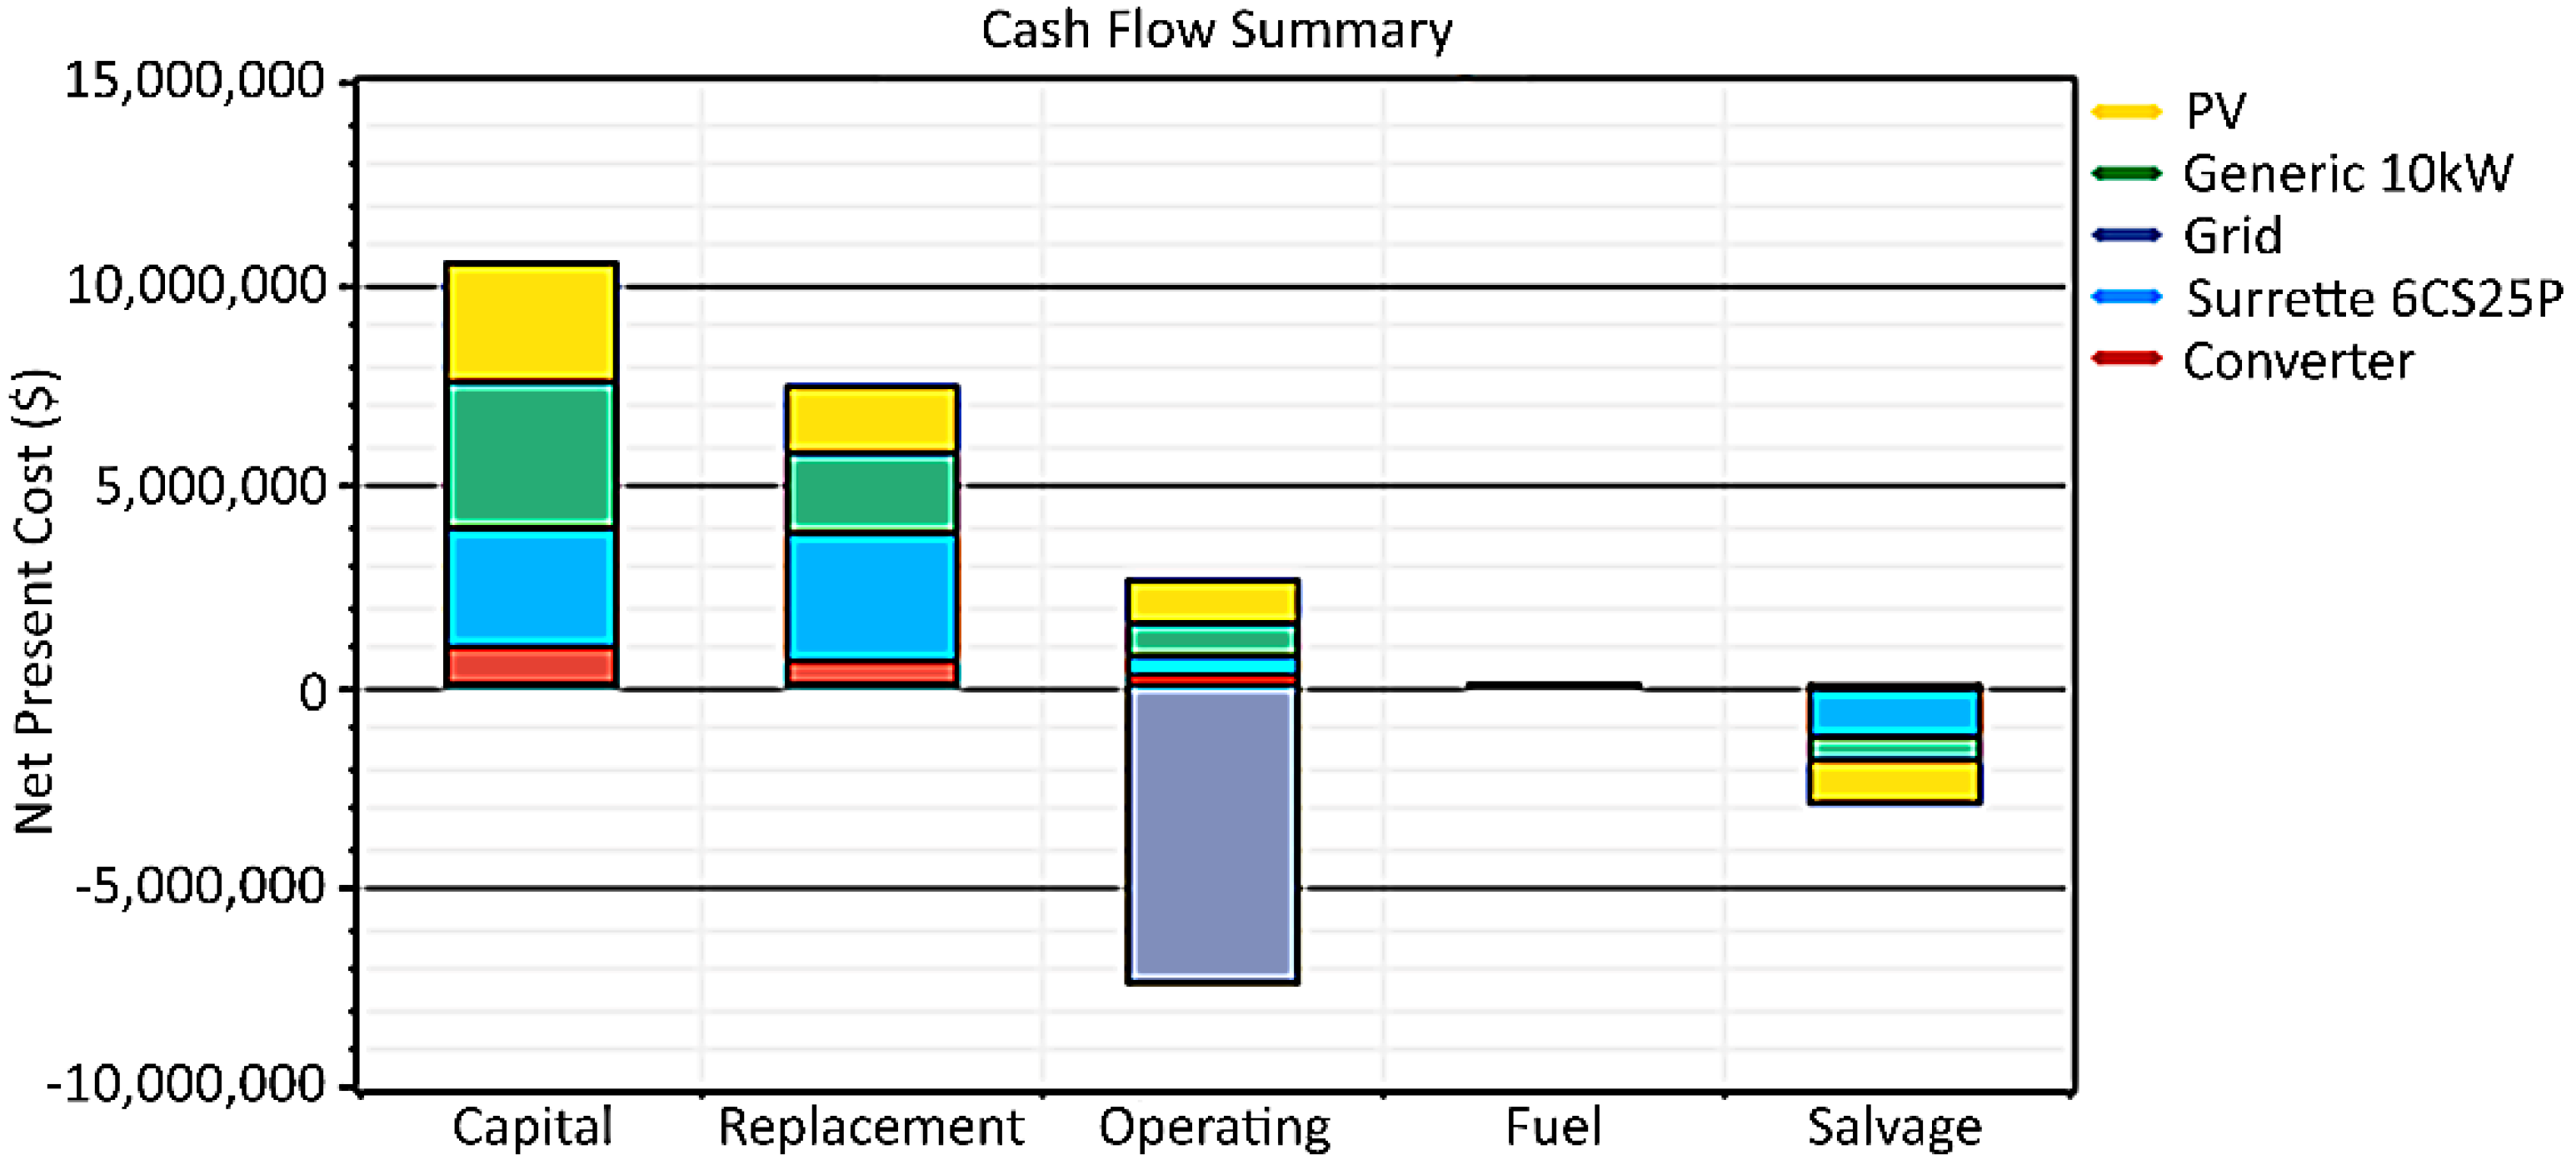
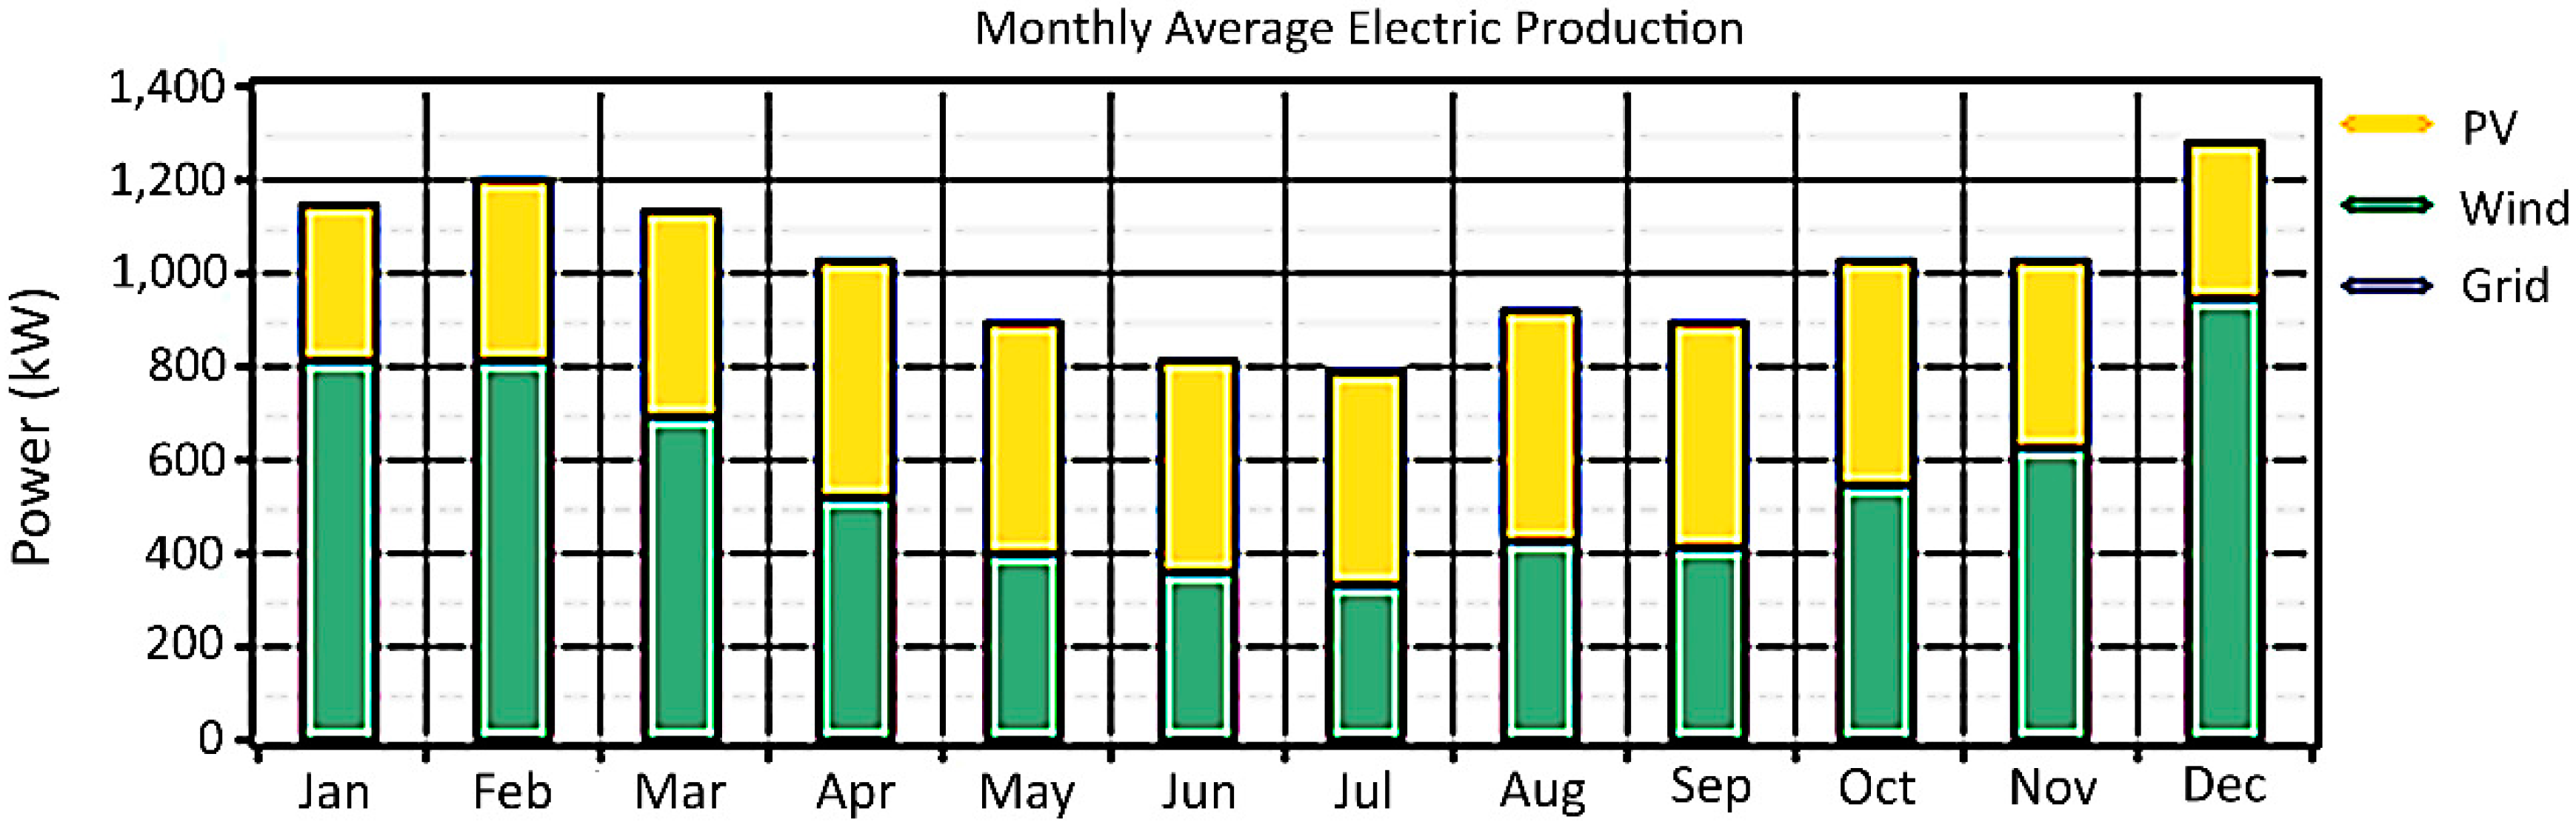
4.2. Simulation Result 2: A Grid-Connected Case

The PV arrays-wind turbine (type 1: Generic 10 kW)-batteries-converter combination is also used for the configuration of the grid-connected renewable electricity generation system. The optimized configuration of the case is shown in Table 6 and Figure 8. The total net present cost, annual operating cost, and COE of the configuration are $10,290,188, $–13,112, and $0.204 per kWh, respectively, with a 100% renewable fraction. Thus, the grid-connected case can be beneficial in the long-term. Table 7 shows the total and annual consumed cost of configuration. Figure 9 summarizes the cash flow of the configuration, while Table 8 provides the electricity production information. The annual electricity production is summarized in Figure 10. Moreover, Table 9 clearly shows that a significant amount of produced electricity can be purchased through the grid connection.
In sum, the simulation results indicate that the PV arrays-wind turbine (type 1: Generic 10 kW)-batteries-converter combination achieves a COE of $0.306 per kWh and $0.204 per kWh for the independent case and grid-connected optimal renewable electricity generation systems, respectively. Further, the results show that the proposed configuration helps to reduce the operating cost to below zero and lower the total NPC to below the initial capital cost.

5. Discussion and Conclusions

The South Korean government has implemented plans and policies to reduce their dependency on fossil fuels and nuclear power and to promote the installation of renewable power generation facilities [22]. Thus, the local governments and research institutes also focused on the wide dissemination and efficient management of renewable electricity generation systems in their offices [23,24]. Jeju Island is one of the most promising regions for utilizing renewable resources [25,26,27]. Accordingly, this study conducts simulations to propose both independent and grid-connected installations at the main government offices of Jeju Province, with NPC and COE as evaluation guidelines of the simulations, to further enhance the island’s energy efficiency. Overall, our simulation results provide a more enhanced and detailed understanding of the possible strategies for planning electricity consumption in buildings for South Korea. Moreover, the office annually emits about 190,000 kg of carbon dioxide, 800 kg of sulfur dioxide, and 400 kg of nitrogen oxides. These emissions can be eliminated when the suggested systems are employed.
Our finding that the grid-connected installation is more efficient than the independent case may be explained in two ways: first, grid connection helps in reducing the initial investments on components. For example, the grid connection can be used as backup storage, thereby reducing the costs on batteries; and second, the operation and management costs of the proposed configurations can be minimized by selling the generated electricity through the existing grid connection. Although the grid connection cannot fully play the role of energy buffer in the system, it can reduce the usage of battery units by using the suggested system. It also reduces the initial capital costs, thereby offering greater flexibility and benefit from installing and operating PV arrays and wind turbines than the independent case.
As the simulation results show, both the cases require a significant amount of initial capital cost. However, the results demonstrate the economic feasibility of renewable electricity generation systems for meeting the electricity demand of Jeju Province. The following points can be useful.
  • In order to utilize the grid connection, strategic plans for the gradual installation of renewable electricity generation systems should be established and implemented.
  • Dependence on the current grid connection should be gradually reduced.
  • The current grid connection should be used for selling the electricity generated using the renewable electricity generation facilities.
However, this study has several shortcomings. First, the local and national supporting plans and policies implemented in South Korea were not considered in the simulation. These are notable plans for promoting the installation and implementation of renewable electricity generation facilities in South Korea. Previous studies have found that such plans are significantly related to the diffusion of facilities [2,26,27]. Second, given that the simulation results are mathematically calculated, alternative configurations involving unexpected factors may significantly affect the results. Third, significantly large investments are required for installing and operating the entire components suggested in the proposed configurations [28]. For example, more than 49% of the total and annual period costs are needed to fully install and operate the suggested capacity of batteries (52.6% in grid-connected and 49.7% in independent cases). Fourth, this study examines only the two wind turbine and PV array models currently used in Jeju Province and neglects other possible energy generation components, such as biomass or geo-thermal energy production facilities. Future studies should address these shortcomings in order to provide more specific guidelines for government and institutional buildings in South Korea.

Acknowledgments

This study was supported by the Dongguk University Research Fund of 2015. Support for the UJI Robotic Intelligence Laboratory is provided in part by Ministerio de Economía y Competitividad (DPI2015-69041-R), by Generalitat Valenciana (PROMETEOII/2014/028) and by Universitat Jaume I (P1-1B2014-52).

Author Contributions

E.P. conducted the investigations and mainly wrote the manuscript. T.H., K.J.K., S.J.K., W.S.N., and A.P.d.P. revised the manuscript and contributed to data presentation.

Conflicts of Interest

The authors declare no conflict of interest.

References

  1. Korea Ministry of Government Legislation. The Act on The Promotion of the Development, Use and Diffusion of New and Renewable Energy. Available online: http://www.law.go.kr/lsInfoP.do?lsiSeq=150378#0000 (accessed on 4 May 2016).
  2. Huh, S.Y.; Lee, J.; Shin, J. The economic value of South Korea’s renewable energy policies (RPS, RFS, and RHO): A contingent valuation study. Renew. Sustain. Energy Rev. 2015, 50, 64–72. [Google Scholar] [CrossRef]
  3. Han, S.; Shin, H.W. Policy trends of renewable energy in Korea. In Proceedings of the 2014 International Conference on Renewable Energy Research and Application, Milwaukee, WI, USA, 19–22 October 2014.
  4. Chen, W.M.; Kim, H.; Yamaguchi, H. Renewable energy in eastern Asia: Renewable energy policy review and comparative SWOT analysis for promoting renewable energy in Japan, South Korea, and Taiwan. Energy Policy 2014, 74, 319–329. [Google Scholar] [CrossRef]
  5. The Ministry of Trade, Industry and Energy in South Korea. The Fourth Renewable Energy Plan in Korea. Available online: http://motie.go.kr/common/download.do?fid=bbs&bbs_cd_n=16&bbs_seq_n=79321&file_seq_n=346 (accessed on 4 May 2016).
  6. Yoo, K.; Park, E.; Kim, H.; Ohm, J.Y.; Yang, T.; Kim, K.J.; Chang, H.J.; del Pobil, A.P. Optimized renewable and sustainable electricity generation systems for Ulleungdo island in South Korea. Sustainability 2014, 6, 7883–7893. [Google Scholar] [CrossRef]
  7. Bae, K.; Shim, J.H. Economic and environmental analysis of a wind-hybrid power system with desalination in Hong-do, South Korea. Int. J. Precis. Eng. Manuf. 2012, 13, 623–630. [Google Scholar] [CrossRef]
  8. Choi, H.J.; Han, G.D.; Min, J.Y.; Bae, K.; Shim, J.H. Economic feasibility of a PV system for grid-connected semiconductor facilities in South Korea. Int. J. Precis. Eng. Manuf. 2013, 14, 2033–2041. [Google Scholar] [CrossRef]
  9. Jeju Special Self-Governing Province. Jejudo-LG, Cooperation for New & Renewable Energy Industry: Global Eco Platform Jeju. Available online: https://www.jeju.go.kr/news/bodo/list.htm;jsessionid=3OVghpPTNGwXJM54umkuXcPeW0KvMQAxTViB2ZAJpzNJJZPWQMf1ID3nm0MrjuaB.was1_servlet_engine1?page=272&act=download&seq=489938&no=1 (accessed on 19 September 2016).
  10. Jeju Special Self-Governing Province. Carbon Free Island Jeju by 2030. Available online: http://www.ksga.org/down/down.asp?file=Carbon%20Free%20Island%20Jeju%20by%202030.pdf (accessed on 4 May 2016).
  11. Ahmed, M.A.; Kang, Y.C.; Kim, Y.C. Modeling and simulation of communication networks for use in integrating high wind power generation into a power grid. J. Renew. Sustain. Energy 2015, 7. [Google Scholar] [CrossRef]
  12. Yang, J. News Jeju Focus. Available online: http://m.newsjeju.net/news/articleView.html?idxno=184496 (accessed on 4 May 2016).
  13. Dursun, B. Determination of the optimum hybrid renewable power generating systems for Kavakli campus of Kirklareli University, Turkey. Renew. Sustain. Energy Rev. 2012, 16, 6183–6190. [Google Scholar] [CrossRef]
  14. Yoshino, N.; Taghizadeh-Hesary, F. Effectiveness of the easing of monetary policy in the Japanese economy, incorporating energy prices. J. Comp. Asian Dev. 2015, 14, 227–248. [Google Scholar] [CrossRef]
  15. Justiniano, A.; Primiceri, G.E. Measuring the equilibrium real interest rate. Econ. Perspect. 2010, 34, 14–27. [Google Scholar]
  16. Das, H.S.; Yatim, A.H.M.; Tan, C.W.; Lau, K.Y. Proposition of a PV/tidal powered micro-hydro and diesel hybrid system: A southern Bangladesh focus. Renew. Sustain. Energy Rev. 2016, 53, 1137–1148. [Google Scholar] [CrossRef]
  17. Park, E.; Yoo, K.; Ohm, J.Y.; Kwon, S.J. Case study: Renewable electricity generation systems on Geoje Island in South Korea. J. Renew. Sustain. Energy 2016, 8. [Google Scholar] [CrossRef]
  18. Park, E.; Kwon, S.J. Towards a Sustainable Island: Independent optimal renewable power generation systems at Gadeokdo Island in South Korea. Sustain. Cities Soc. 2016, 23, 114–118. [Google Scholar] [CrossRef]
  19. Park, E.; Kwon, S.J. Renewable electricity generation systems for electric-powered taxis: The case of Daejeon metropolitan city. Renew. Sustain. Energy Rev. 2016, 58, 1466–1474. [Google Scholar] [CrossRef]
  20. Li, C.; Ge, X.; Zheng, Y.; Xu, C.; Ren, Y.; Song, C.; Yang, C. Techno-economic feasibility study of autonomous hybrid wind/PV/battery power system for a household in Urumqi, China. Energy 2013, 55, 263–272. [Google Scholar] [CrossRef]
  21. Chung, M.H.; Rhee, E.K. Potential opportunities for energy conservation in existing buildings on university campus: A field survey in Korea. Energy. Build. 2014, 78, 176–182. [Google Scholar] [CrossRef]
  22. Ahn, J.; Woo, J.; Lee, J. Optimal allocation of energy sources for sustainable development in South Korea: Focus on the electric power generation industry. Energy Policy 2015, 78, 78–90. [Google Scholar] [CrossRef]
  23. Ku, S.J.; Yoo, S.H. Willingness to pay for renewable energy investment in Korea: A choice experiment study. Renew. Sustain. Energy Rev. 2010, 14, 2196–2201. [Google Scholar] [CrossRef]
  24. Oh, S.D.; Yoo, Y.; Song, J.; Song, S.J.; Jang, H.N.; Kim, K.; Kwak, H.Y. A cost-effective method for integration of new and renewable energy systems in public buildings in Korea. Energy Build. 2014, 74, 120–131. [Google Scholar] [CrossRef]
  25. Park, Y.C.; Kim, D.S.; Huh, J.; Kim, Y.G. New and renewable energy policies of Jeju island in Korea. In Proceedings of the World Renewable Energy Congress, Linköping, Sweden, 8–13 May 2011.
  26. Lee, J.; Kim, S.B.; Park, G.L.; Park, C.J. Monitoring-based temporal prediction of power entities in smart grid cities. In Proceedings of the 2012 ACM Research in Applied Computation Symposium, New York, NY, USA, 23–26 October 2012.
  27. Kim, H.C.; Lim, D.S. A study on the economic effects of new/renewable energy industry of Jeju: The case of photovoltaic and wind-power of Jeju. Tamla Munhwa 2014, 47, 299–324. [Google Scholar]
  28. Park, E.; Kwon, S.J. Solutions for optimizing renewable power generation systems at Kyung-Hee University’s Global Campus, South Korea. Renew. Sustain. Energy Rev. 2016, 58, 439–449. [Google Scholar] [CrossRef]
Figure 1. Geographical location of the main government offices of Jeju Province.
Sustainability 09 00082 g001
Figure 2. Seasonal profile of the electricity load used in our simulation (collected in 2014).
Sustainability 09 00082 g002
Figure 3. Annual solar resource information for the main offices of Jeju Province. Based on the monthly averages of solar resources, the potentiality of PV arrays is computed.
Sustainability 09 00082 g003
Figure 4. Annual wind speed information for the main offices of Jeju Province (minimum: 4.150 m/s, maximum: 6.211 m/s).
Sustainability 09 00082 g004
Figure 5. Overview of the configuration (an independent case).
Sustainability 09 00082 g005
Figure 6. Cash flow summary of the independent case.
Sustainability 09 00082 g006
Figure 7. Annual electricity production of the independent case.
Sustainability 09 00082 g007
Figure 8. Overview of the configuration (a grid-connected case).
Sustainability 09 00082 g008
Figure 9. Cash flow summary of the grid-connected case.
Sustainability 09 00082 g009
Figure 10. Annual electricity production of the grid-connected case.
Sustainability 09 00082 g010
Table 1. The obligatory energy supply ratio of public institution buildings.
Year2014201520162017201820192020
Ratio12%15%18%21%24%27%30%
Table 2. The inputted parameters and outcomes generally generated by the HOMER software [11].
Inputted Parameters
EconomicTechnicalEnvironmental
Annual real interest rate (%), Capital and operation and management „costs ($), Project lifetime (years), Capacity shortage penalty ($ per kWh), Emissions penalty for carbon dioxide, monoxide, unburned hydrocarbons, particulate matter, sulfur dioxide, nitrogen oxides ($ per ton), Diesel price ($ per liter)
PV array, battery, converter, generator, wind and hydro turbines: Capital cost ($), Replacement cost ($), Operation & management cost ($), Lifetime (years)
Grid: Price ($ per kWh), Sellback ($ per kWh), Interconnection charge ($), Standby charge ($ per year)
PV array: Derating factor (%), Slope (degrees), Ground reflectance (%)
Wind turbine: Hub height (meters), Rated power (kW)
Battery: Nominal voltage (V), Nominal capacity (Ah or kWh)
Converter: Efficiency (%)
Electricity load: Hourly electricity consumption (kW)
Generator: Minimum load ratio (%)
Grid: Gas emissions (carbon dioxide, carbon monoxide, unburned hydrocarbons, particulate matter, sulfur dioxide, and nitrogen oxides; g per kWh)
Hydro turbine: Available head (meters), Design flow rate (liters per second), Minimum and maximum flow ratio (%), Efficiency (%)
Stream flow of hydro resource (liters per second),
Monthly average wind speed (m/s),
Clearness of solar resource,
Daily radiation of solar resource (kWh/m2/d), Latitude and longitude
Outcomes
EconomicTechnicalEnvironmental
Total net present costs ($), annualized costs ($ per year) of all components and system in capital, replacement, operation & management, salvage, Cost of energy ($ per kWh), Renewable fraction (%) Annual electricity production of all components (kWh),
Annual electricity consumption and fraction of all components including excess electricity, unmet load, and capacity shortage (kWh, %)
PV array, hydro and wind turbine: Rated capacity (kW), Mean, min. and max. output (kW), PV (or wind, hydro) penetration (%), Hours of operation (hours per year), Levelized cost ($ per kWh)
Battery: Strings in parallel (#), Nominal capacity (kWh), Lifetime throughput (kWh), Energy in and out (kWh per year), Storage depletion and losses (kWh per year), Annual throughput (kWh per year), Expected life (years)
Converter: Mean, minimum, and maximum output (kW), Capacity factor (%), Hours of operation (hours per year), Losses, energy in and out (kWh per year)
Emissions of carbon dioxide, monoxide, unburned hydrocarbons, particulate matter, sulfur dioxide, nitrogen oxides (kg per year)
Table 3. The optimized independent renewable electricity generation system for the main offices of Jeju Province.
ComponentsIndex
PV arrays (kW)2030
Wind turbines: type 1 (Generic 10 kW; #)164
Wind turbines: type 2 (WES 5 Tulipo; #)0
Batteries (#)3790
Converter (kW)480
Operating cost (O and M; $ per year)370,600
Initial capital ($)9,014,500
Total NPC ($)15,467,821
COE ($/kWh)0.306
Renewable fraction (%)100%
Table 4. Cost information of the independent case.
ComponentCapital
($)
Replacement
($)
O and M
($)
Salvage
($)
Total
($)
Total PeriodPV array2,131,5001,180,161706,974–763,5133,255,122
Wind turbine: type 1 (Generic 10 kW)2,378,0001,315,818571,152–326,3643,938,606
Wind turbine: type 2 (WES 5 Tulipo)
Battery4,169,0004,522,661659,959–1,659,2837,692,337
Converter336,000215,66683,583–53,492581,757
System9,014,5007,234,3062,021,668–2,802,65115,467,821
Annual PeriodPV array122,40867,77440,600–43,847186,935
Wind turbine: type 1 (Generic 10 kW)136,56375,56532,800–18,742226,186
Wind turbine: type 2 (WES 5 Tulipo)
Battery239,417259,72737,900–95,289441,755
Converter19,29612,3854800–307233,409
System517,684415,451116,100–160,950888,285
Table 5. Annual electricity production and quantity of components in the independent case.
ComponentsElectricity Production (kWh)/Fraction (%)
PV arrays2,738,148, 45%
Wind turbines3,290,134, 55%
Total6,028,282, 100%
QuantityValue (kWh)
Excess electricity2,524,625
Unmet load2192
Capacity shortage2887
Table 6. The optimized grid-connected renewable electricity generation system for the main offices of Jeju Province.
ComponentsIndex
PV arrays (kW)2860
Wind turbines: Type 1 (Generic 10 kW; #)250
Wind turbines: Type 2 (WES 5 Tulipo; #)0
Batteries (#)2665
Converter (kW)1370
Operating cost ($ per year)–13,112
Initial capital ($)10,518,500
Total NPC ($)10,290,187
COE ($/kWh)0.204
Renewable fraction (%)100%
Table 7. Cost information of the grid-connected case.
ComponentCapital ($)Replacement ($)O and M ($)Salvage ($)Total ($)
Total PeriodPV array3,003,0001,662,689996,032–1,075,6884,586,033
Wind turbine: type 13,625,0002,005,819870,658–497,5066,003,971
Wind turbine: type 2
Grid00–7,369,2390–7,369,239
Battery2,931,5003,180,182464,061–1,166,7525,408,991
Converter959,000615,546238,560–152,6751,660,431
System10,518,5007,464,236–4,799,928–2,892,62110,290,187
Annual PeriodPV array172,45695,48557,200–61,774263,367
Wind turbine: type 1208,176115,19050,000–28,571344,795
Wind turbine: type 2
Grid00–423,2000–423,200
Battery168,350182,63126,650–67,004310,627
Converter55,07335,34913,700–876895,354
System604,055428,655–275,650–166,117590,943
Table 8. Annual electricity production and quantity of components in the grid-connected case.
ComponentsElectricity Production (kWh) and Fraction
PV arrays3,857,697 (43%)
Wind turbines5,015,423 (57%)
Grid purchases0 (0%)
Total8,873,120 (100%)
LoadConsumption (kWh per year) and fraction
AC primary load2,898,654 (48%)
Grid sales3,078,084 (52%)
QuantityValue (kWh)
Excess electricity1,985,863
Unmet load2351
Capacity shortage2893
Table 9. Amount of electricity purchased through the grid connection.
MonthEnergy Sold (kWh)Net Purchases (kWh)Energy Charge ($)
January284,276–284,276–39,085
February278,046–278,046–38,228
March303,852–303,852–41,776
April256,603–256,603–35,280
May244,526–244,526–33,619
June217,538–217,538–29,909
July199,996–199,996–27,497
August222,079–222,079–30,533
September210,954–210,954–29,004
October272,344–272,344–37,444
November245,480–245,480–33,751
December342,389–342,389–47,074
Total (annual)3,078,084–3,078,084–423,200

