
Two-Stage DEA Analysis of Water Resource Use Efficiency


Abstract
:1. Introduction
2. Model Building
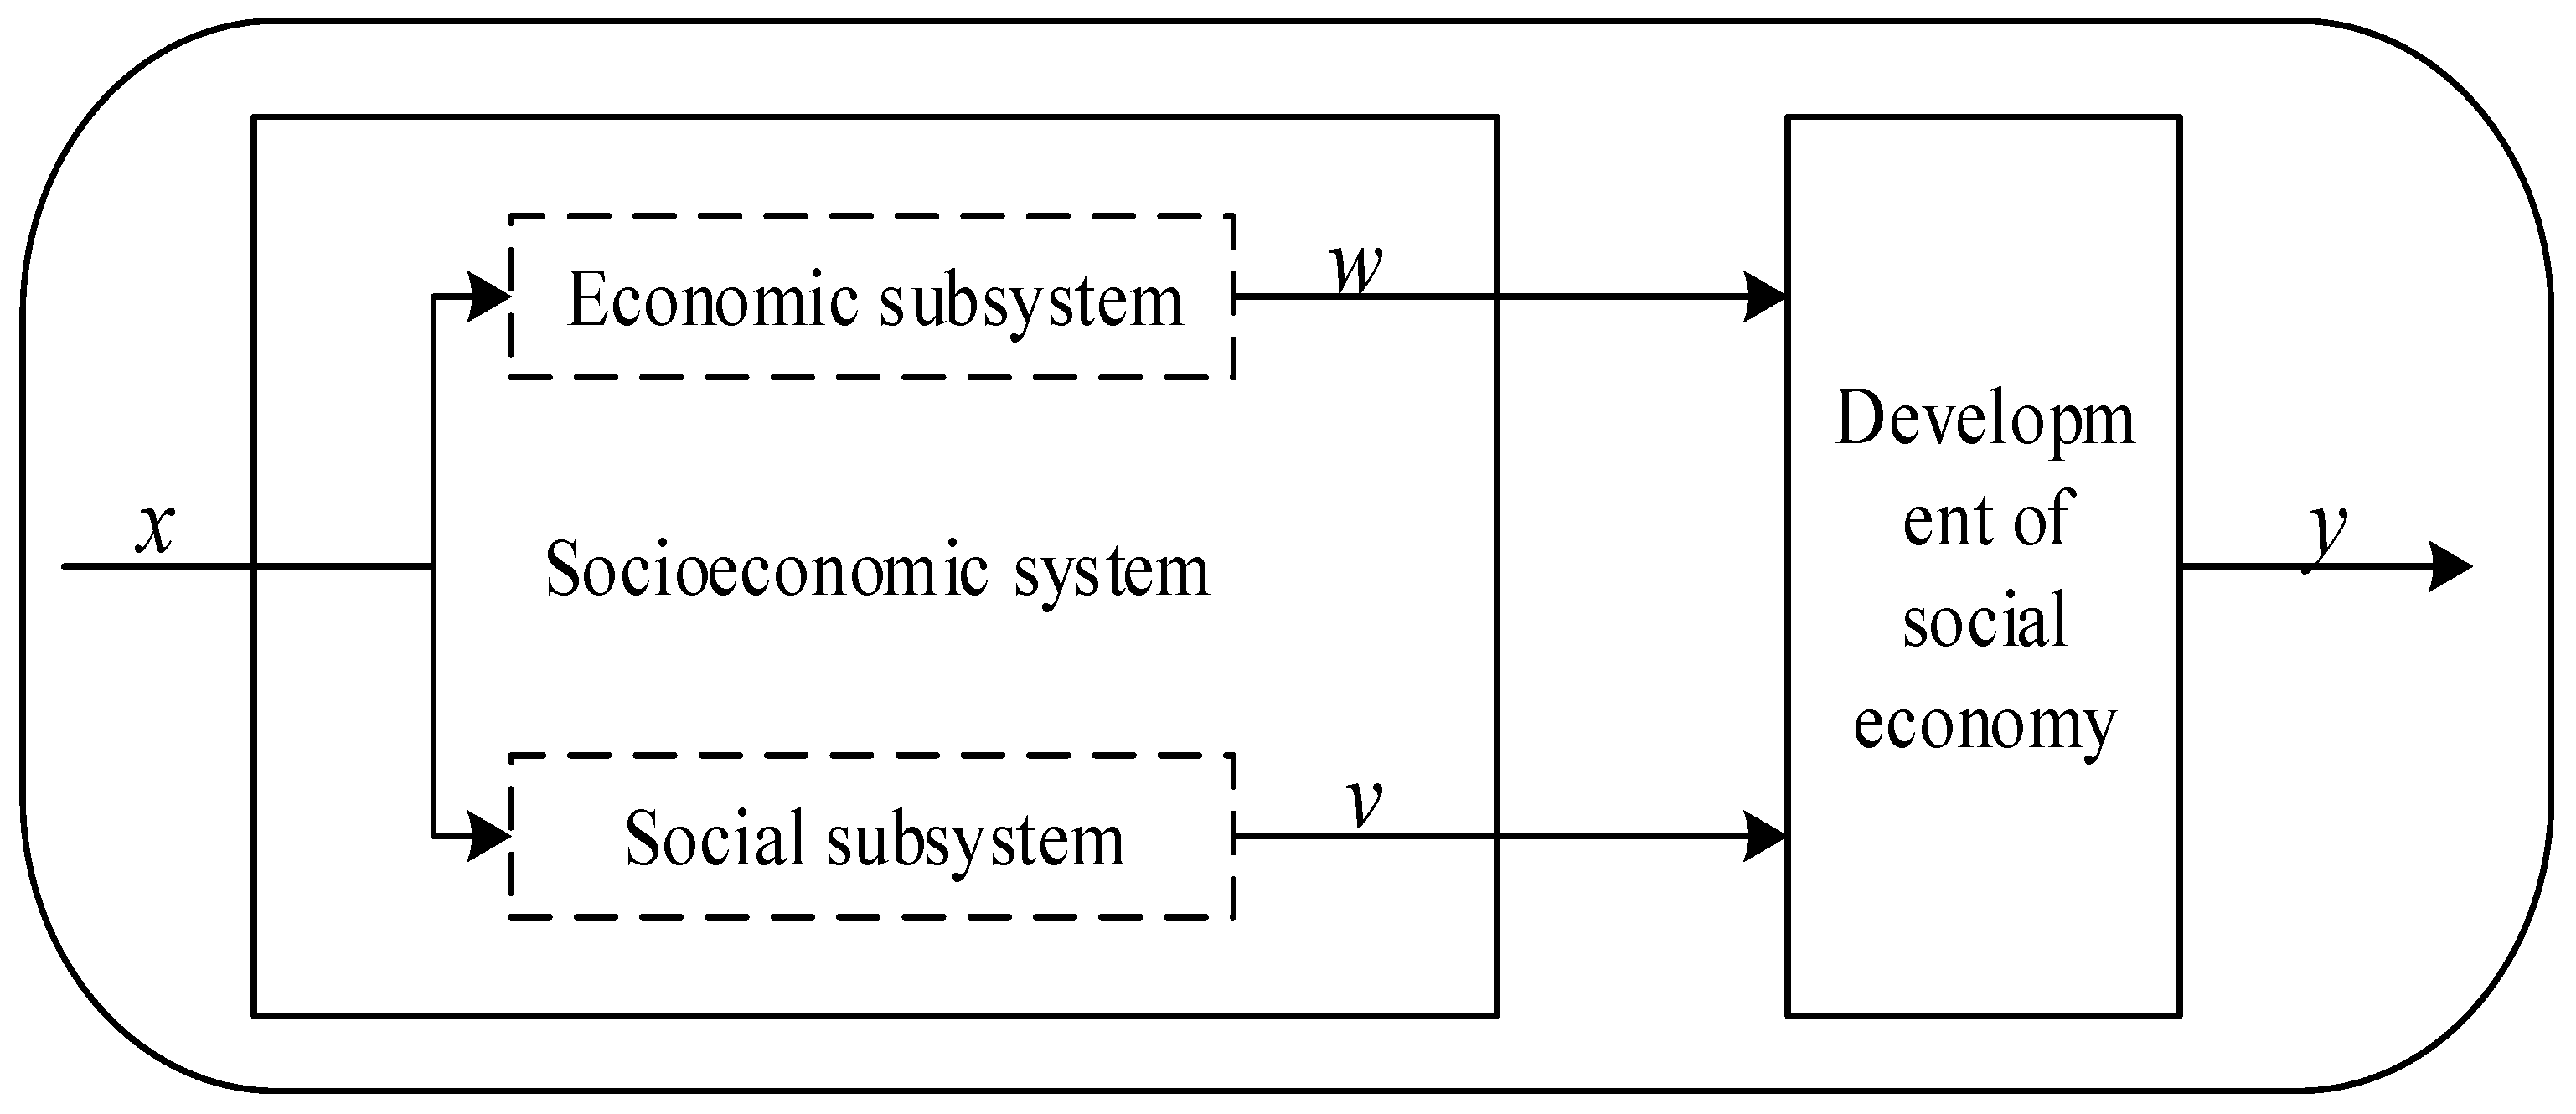
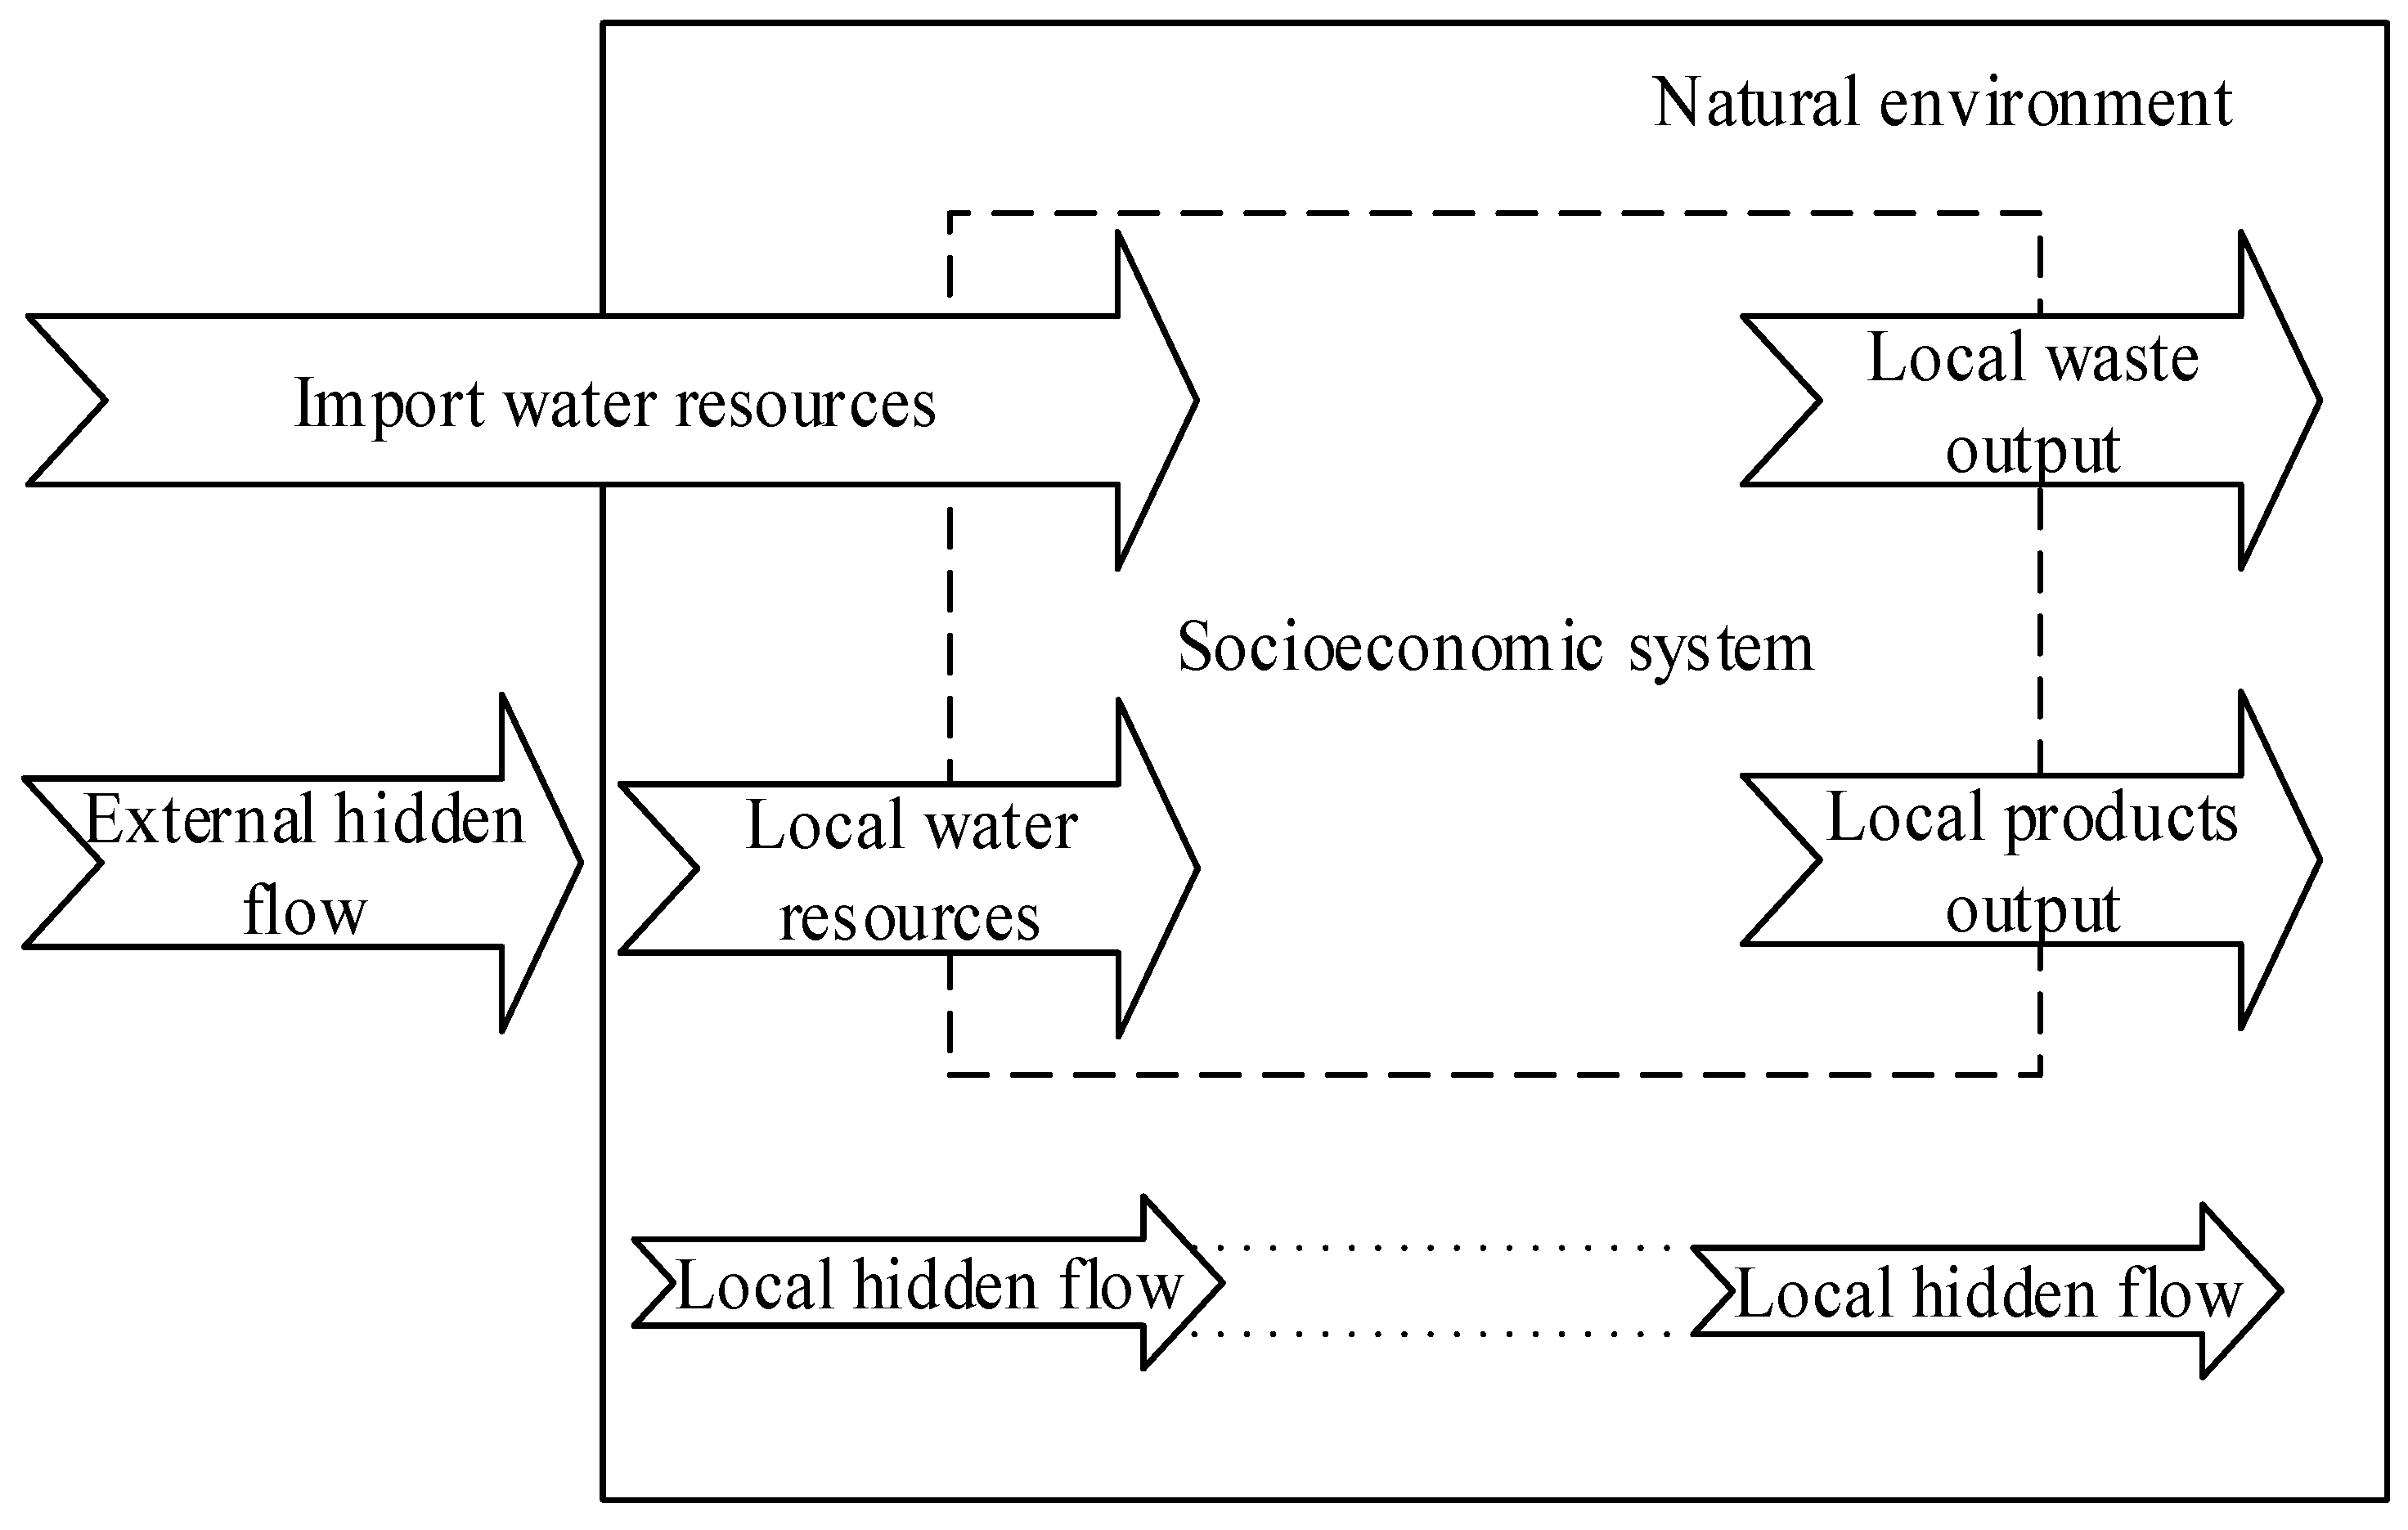
2.1. Regional Water Resource Metabolic Theory
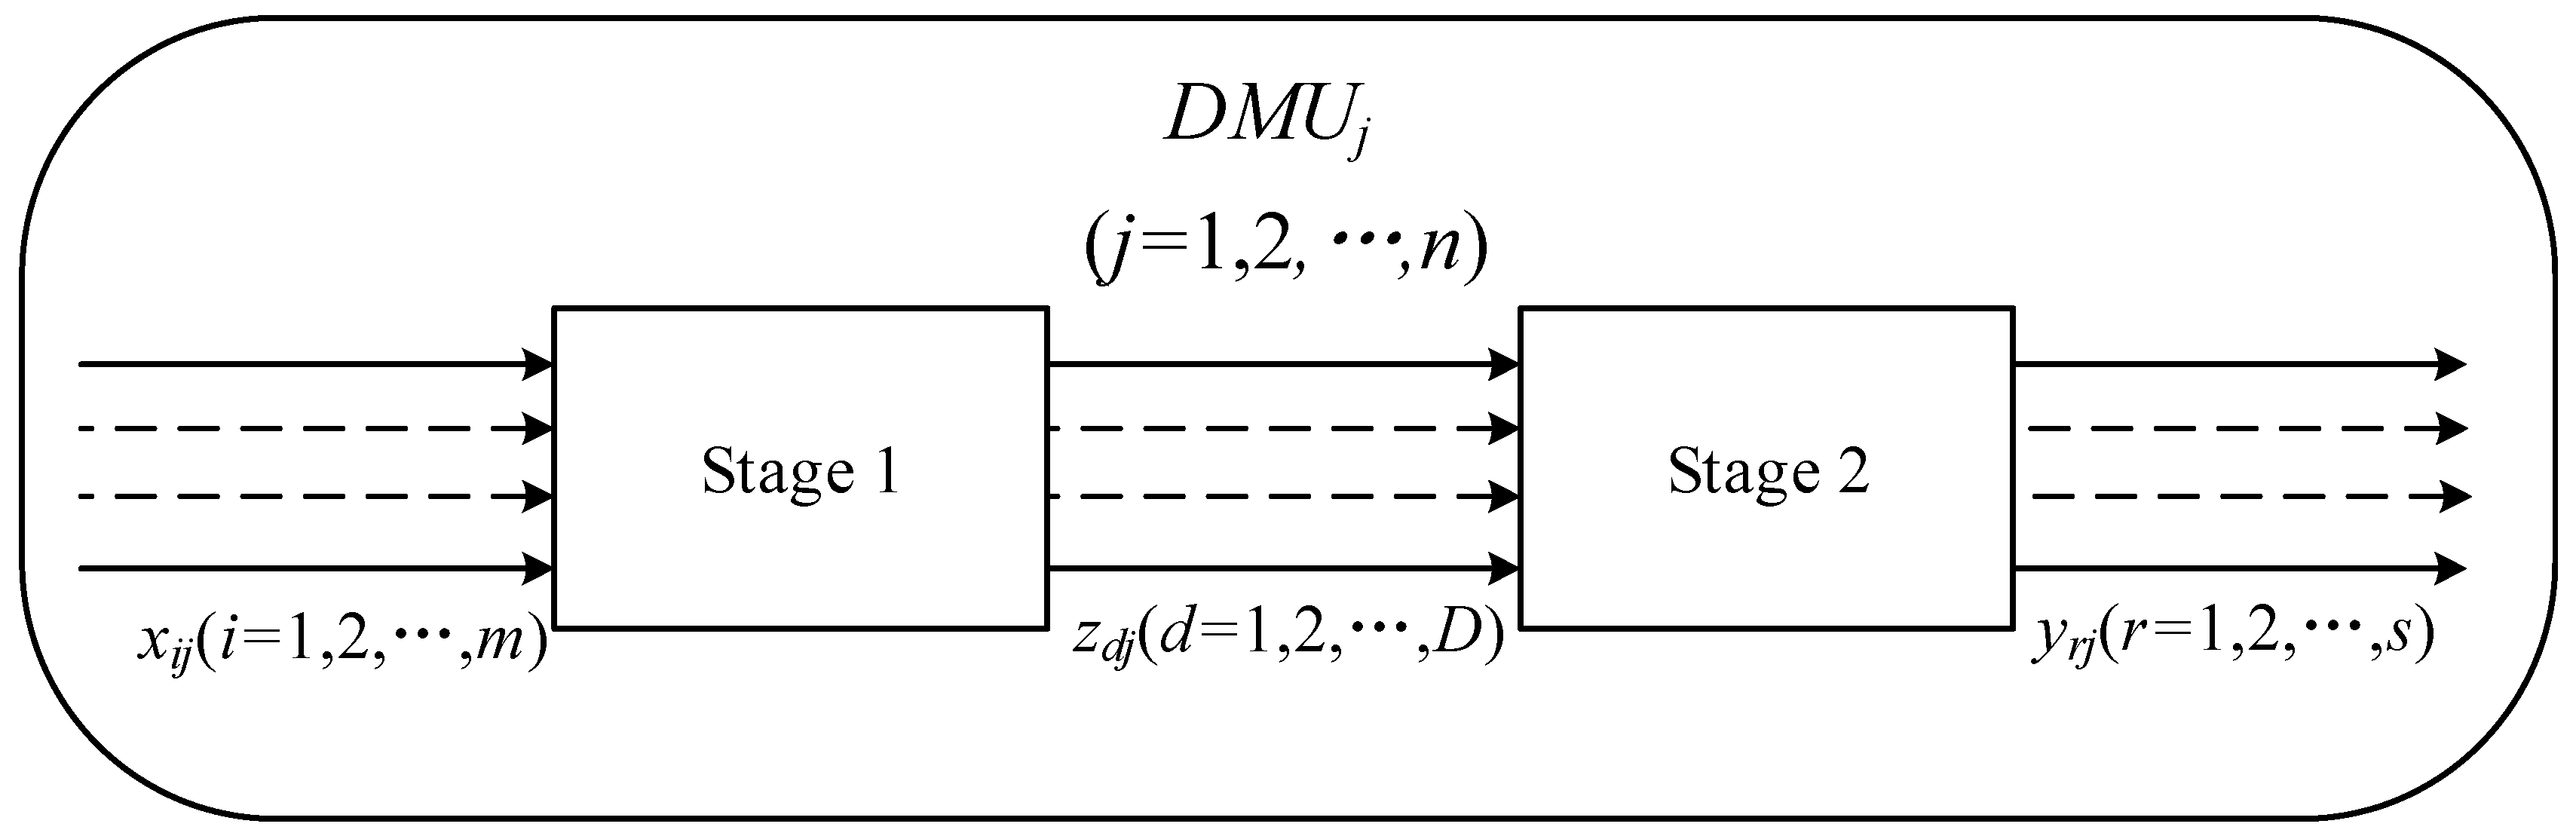
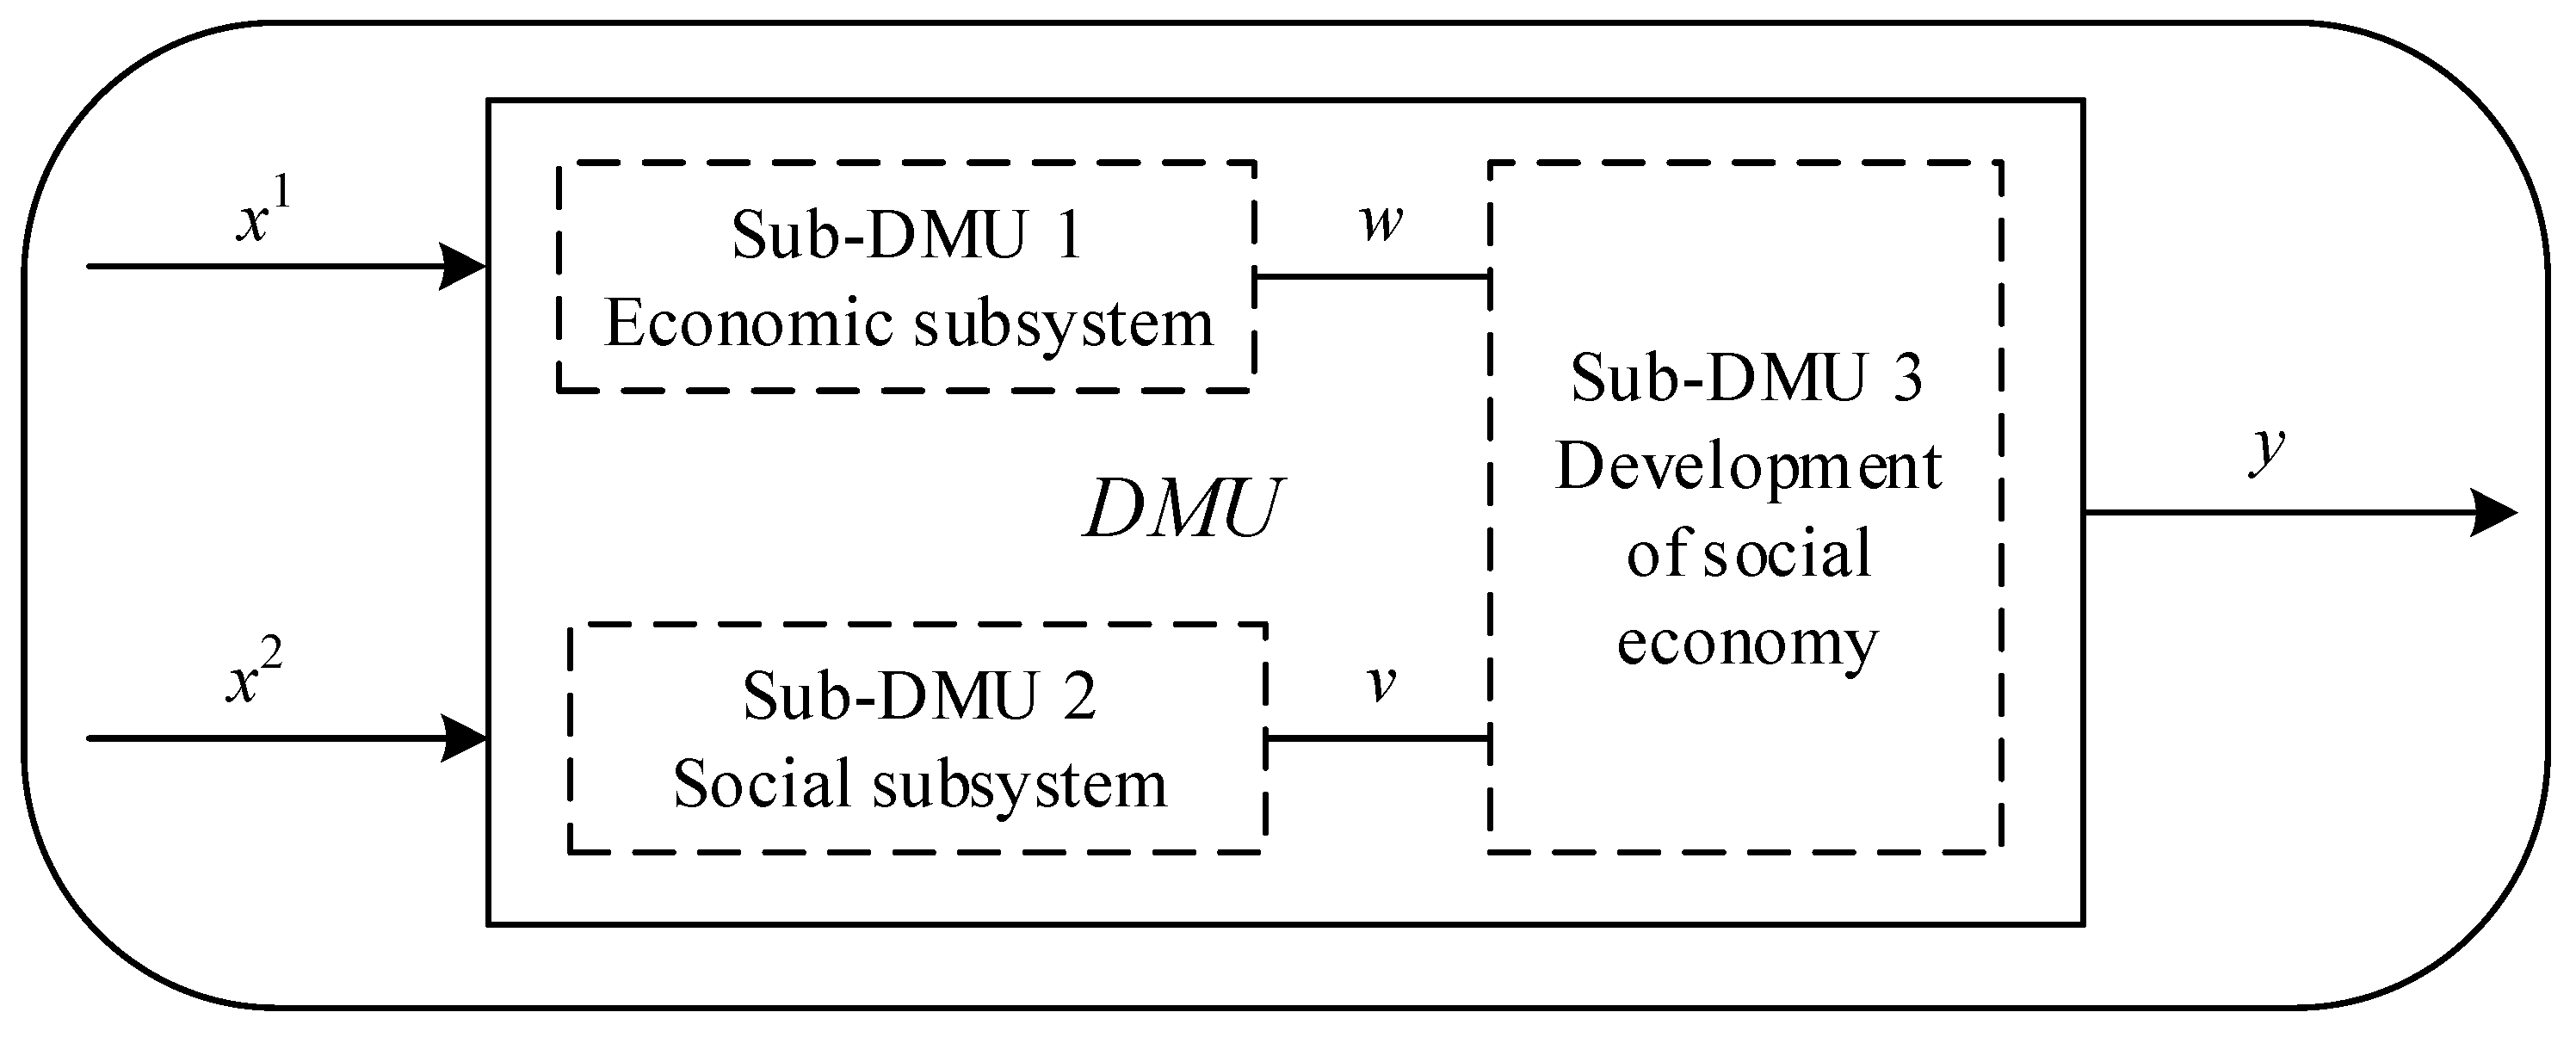
2.2. Two-Stage Data Envelopment Analysis (DEA) Model
2.3. Two-Stage DEA Model Based on Water Resource Use Efficiency (WRUE) Physical Model
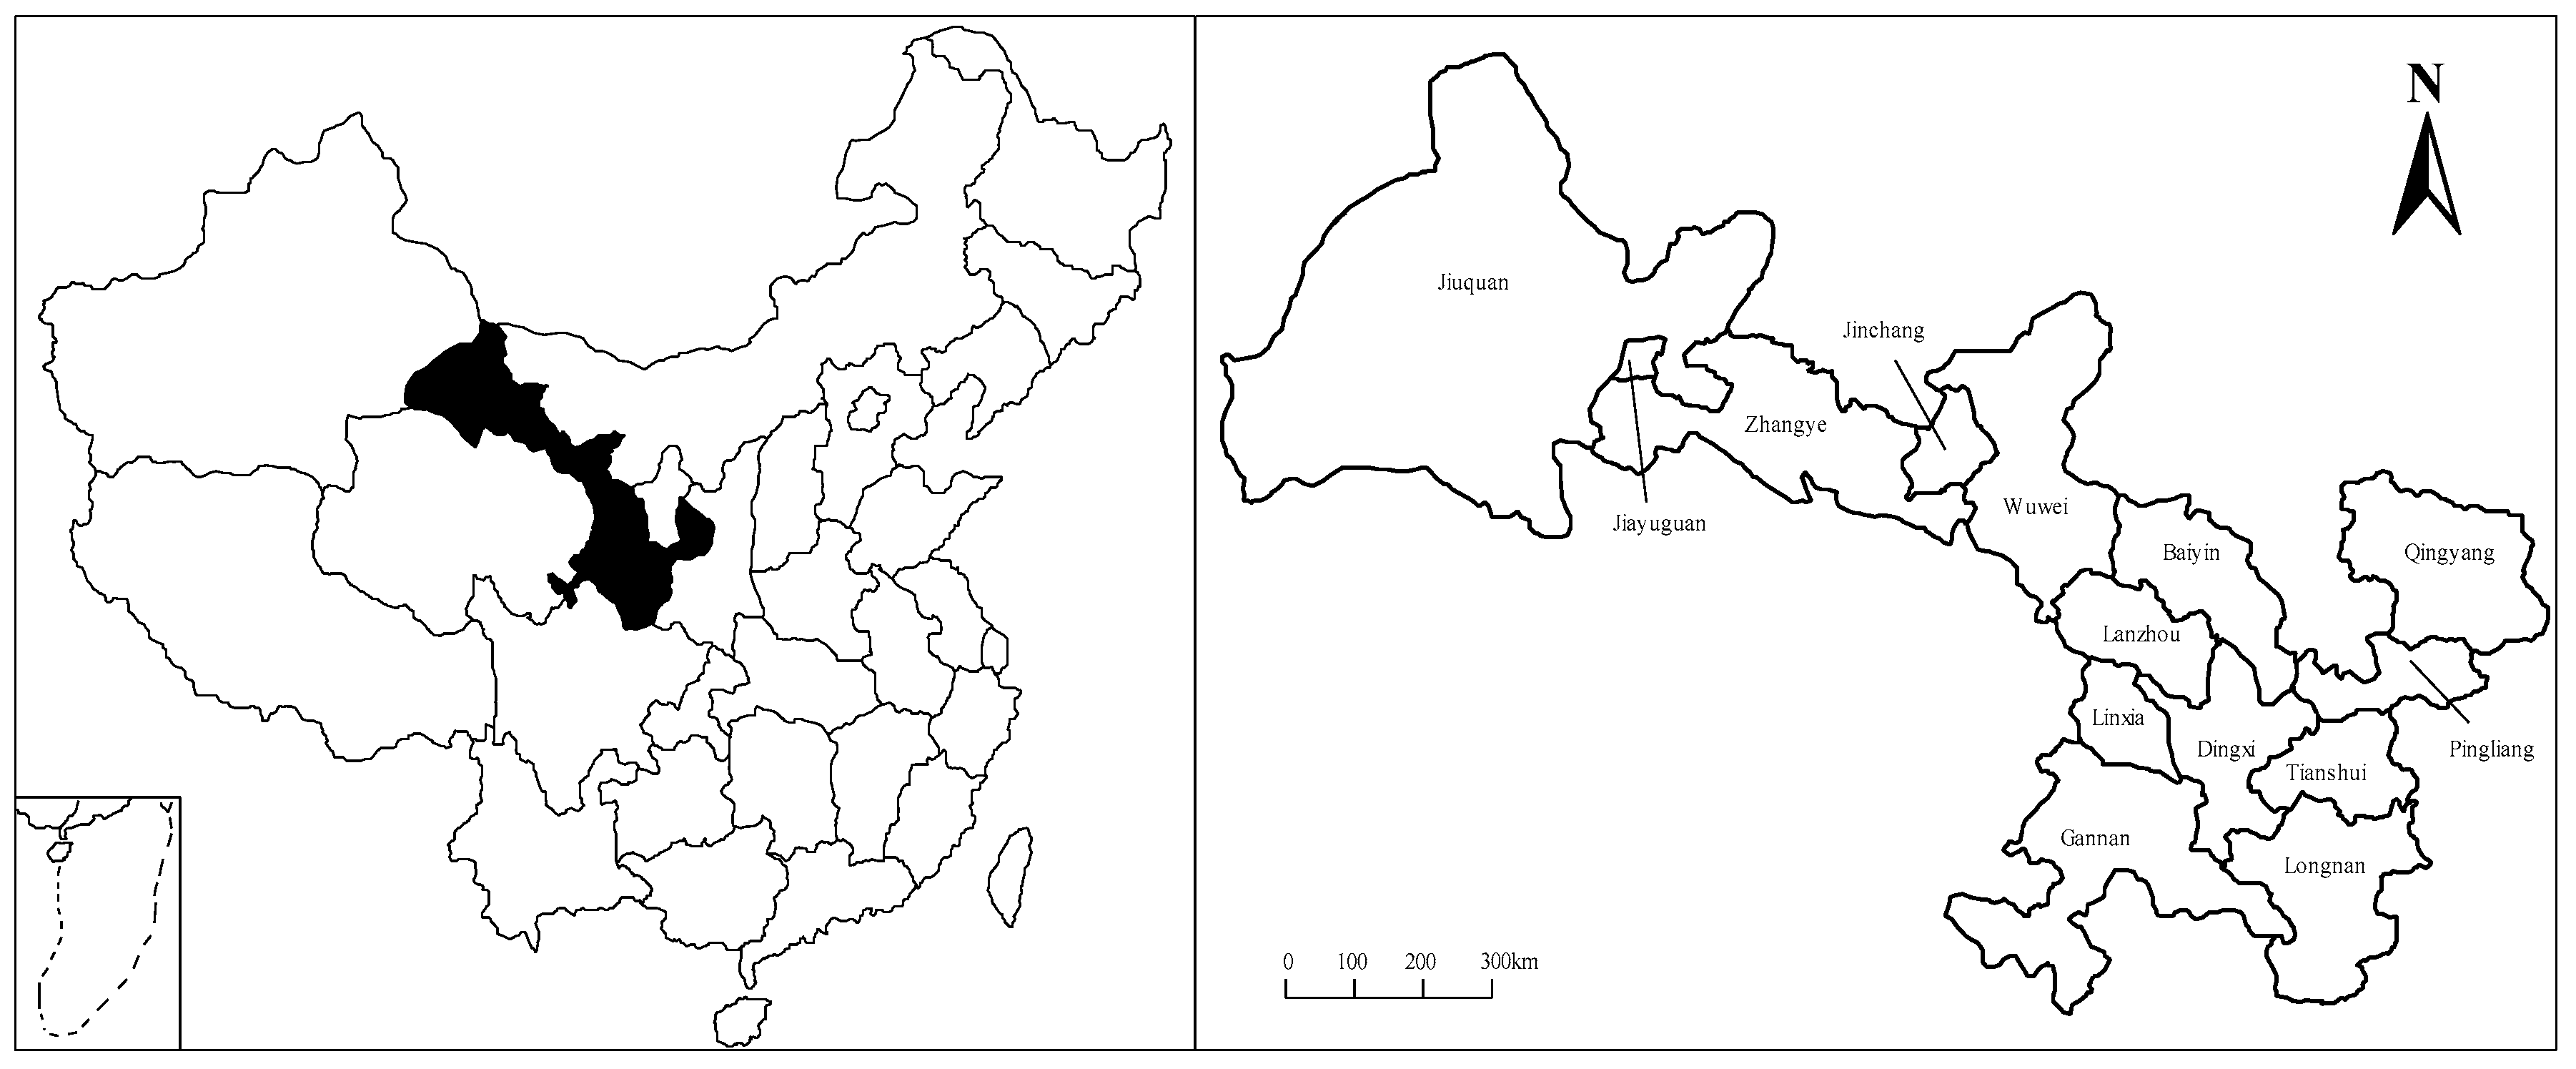
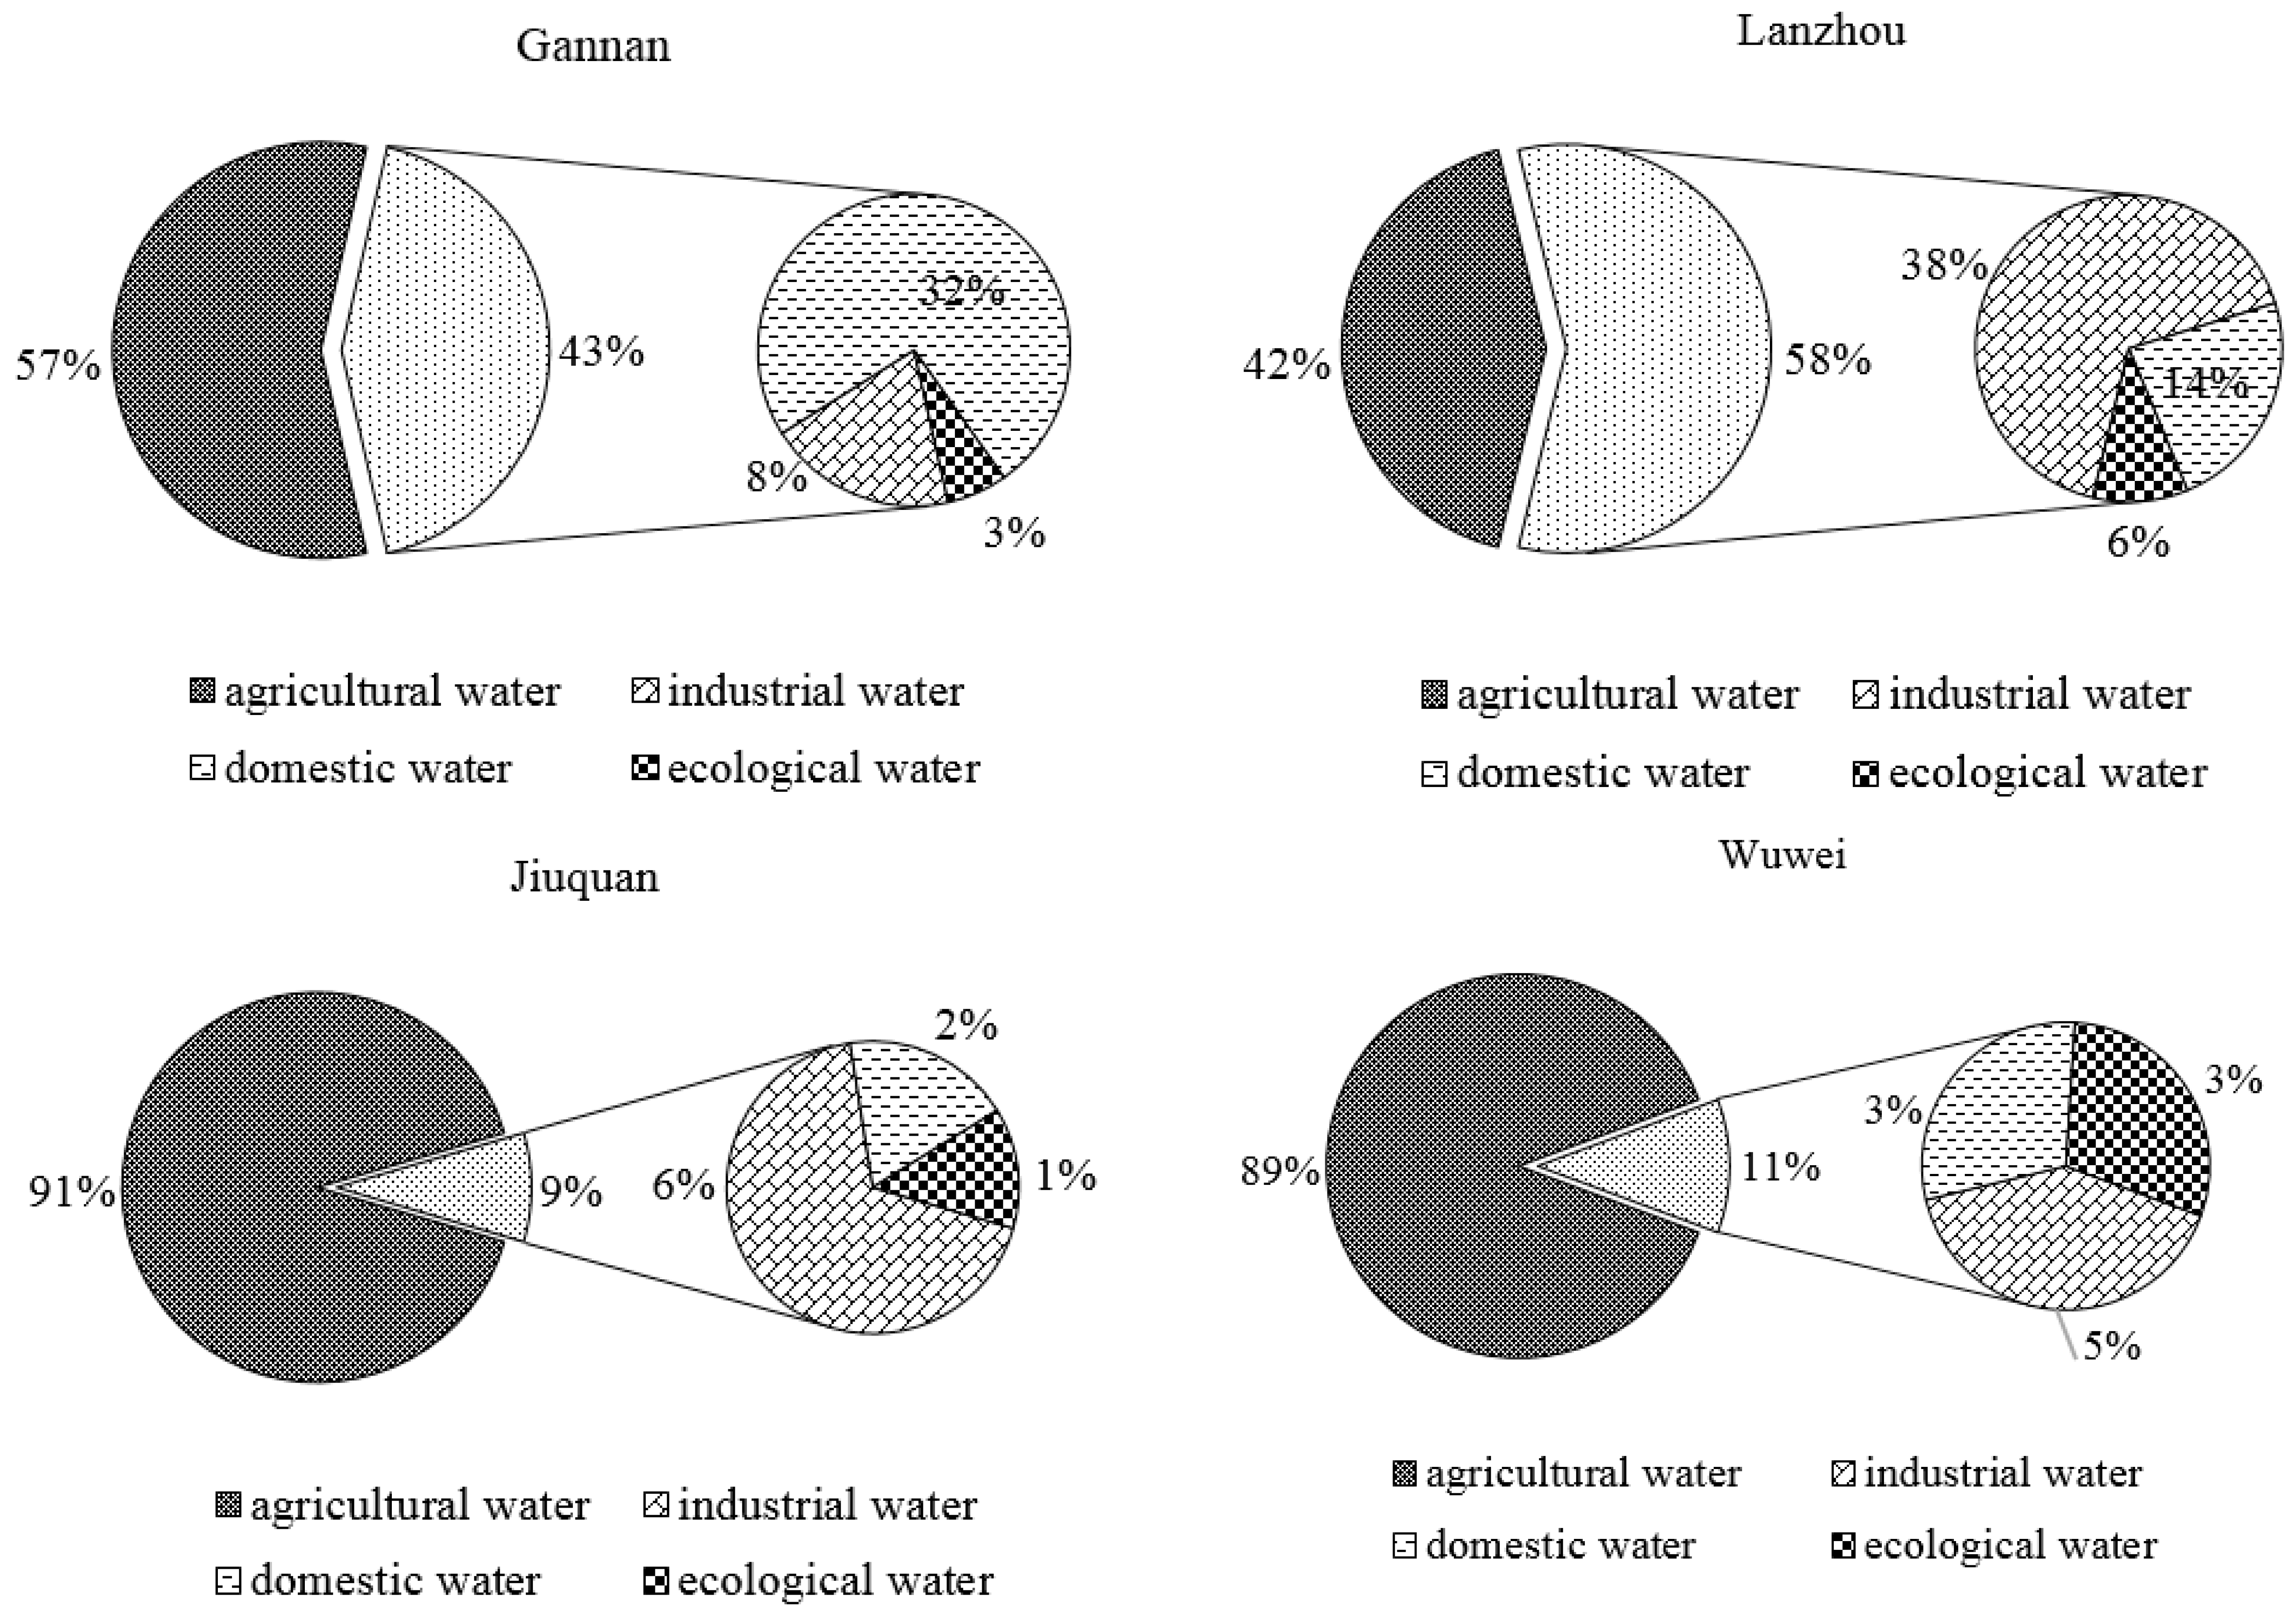
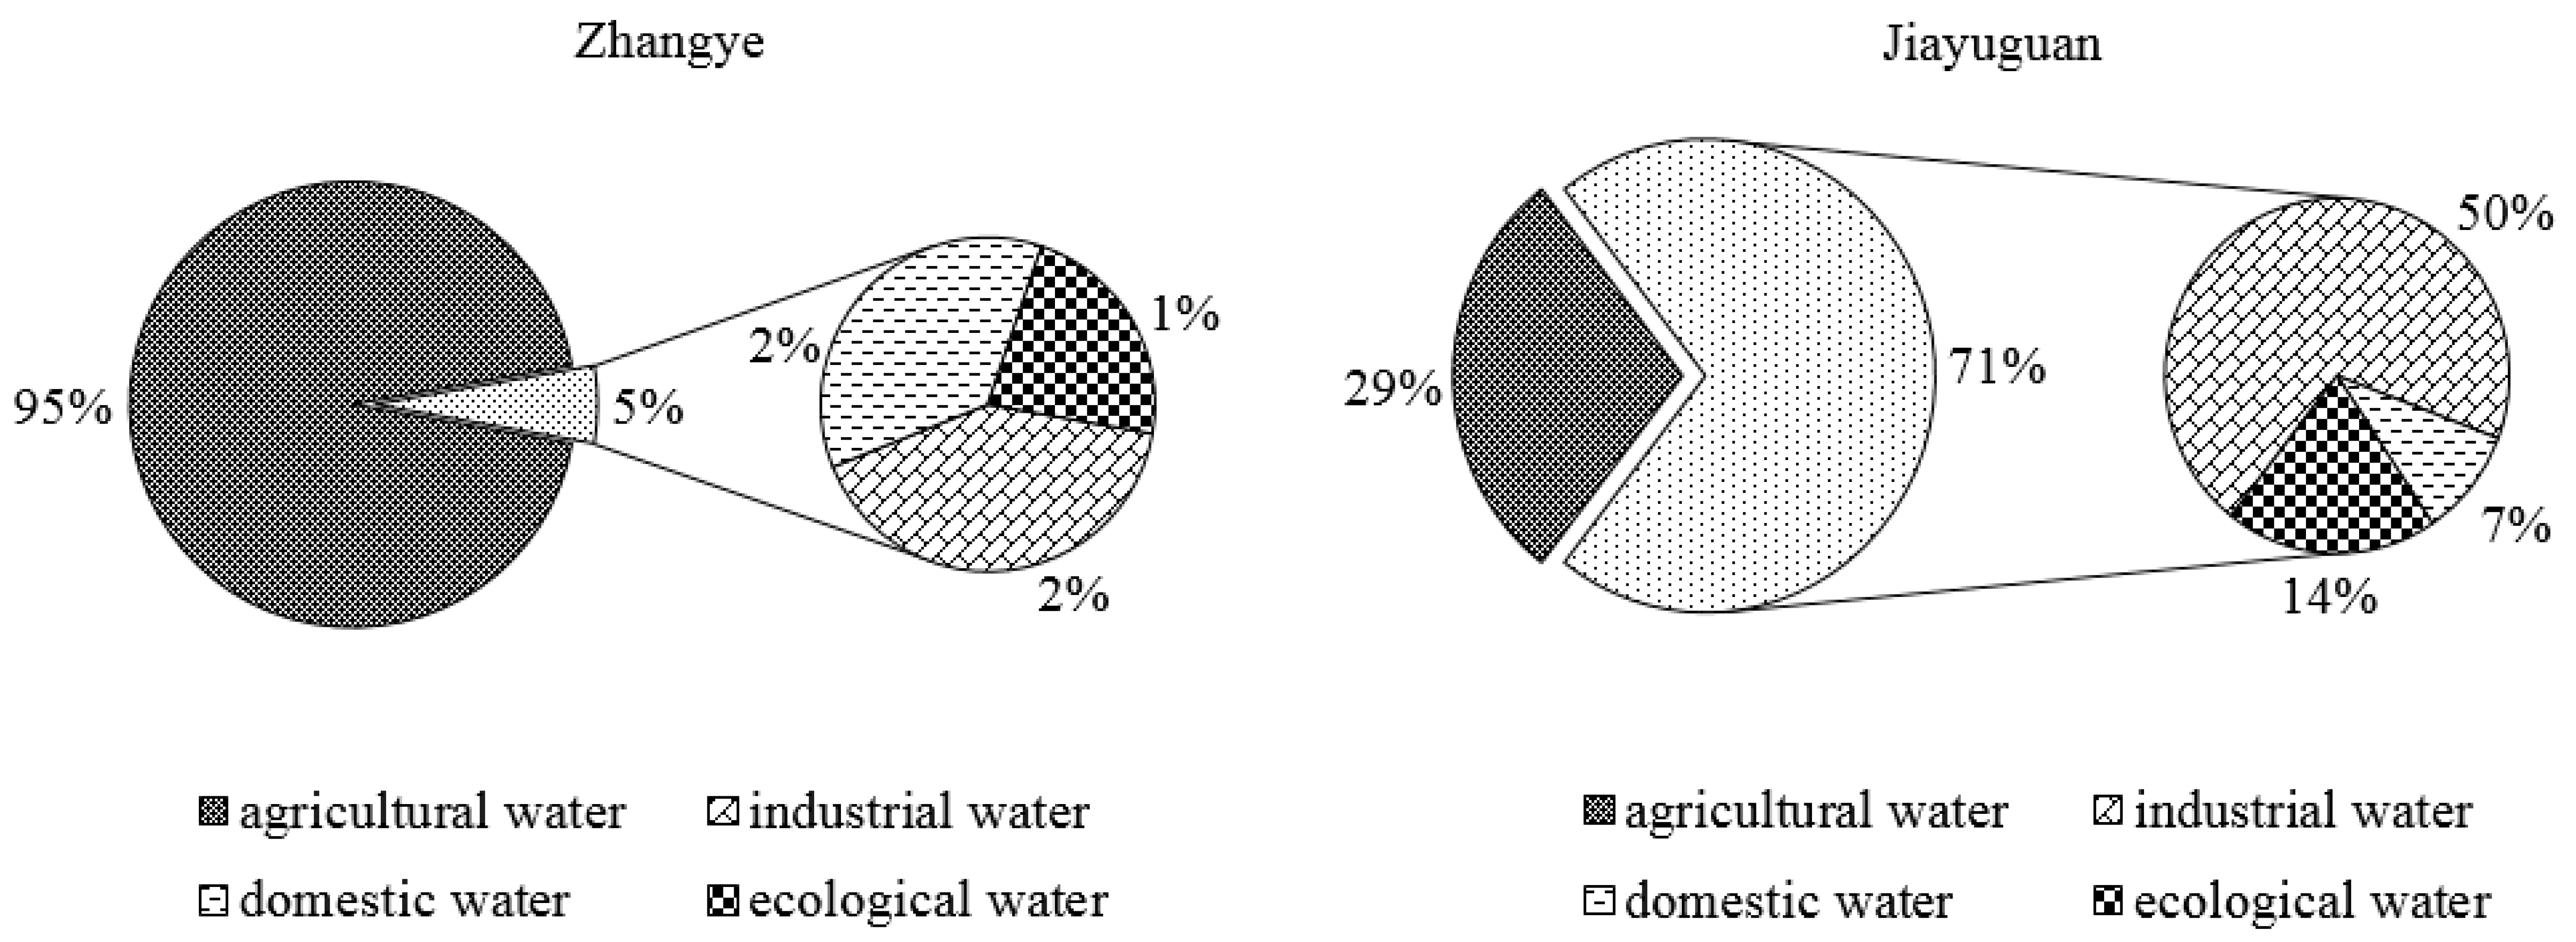
3. Case Study
4. Results and Discussion
5. Conclusions
Supplementary Materials
Acknowledgments
Author Contributions
Conflicts of Interest
References
- United Nations Education and Scientific and Cultural Organization. World Water Development Report; United Nations: Marseille, France, 2013. [Google Scholar]
- World Economic Forum. Global Risks Report, 9th ed.; World Economic Forum: Davos, Switzerland, 2014. [Google Scholar]
- Soltanjalili, M.; Bozorg-Haddad, O.; Marino, M.A. Operating water distribution networks during water shortage conditions using hedging and intermittent water supply concepts. J. Water Resour. Plan. Manag. 2013, 139, 644–659. [Google Scholar] [CrossRef]
- Han, M.; Ren, Q.; Wang, Y.; Du, J.; Hao, Z.; Sun, F.; Cheng, L.; Qi, S.; Li, D. Integrated approach to water allocation in river basins. J. Water Resour. Plan. Manag. 2013, 139, 159–165. [Google Scholar] [CrossRef]
- Medrano, H.; Tomas, M.; Martorell, S.; Escalona, J.; Pou, A.; Fuentes, S.; Flexas, J.; Bota, J. Improving water use efficiency of vineyards in semi-arid regions. A review. Agron. Sustain. Dev. 2015, 35, 499–517. [Google Scholar] [CrossRef]
- Ren, C.F.; Guo, P.; Yang, G.Q. Spatial and temporal analyses of water resources use efficiency based on data envelope analysis and Malmquist Index: Case study in Gansu province, China. J. Water Resour. Plan. Manag. 2016, 142, 04016066. [Google Scholar] [CrossRef]
- Tsakiris, G.; Spiliotis, M. Cropping pattern planning under water supply from multiple sources. Irrig. Drain. Syst. 2006, 20, 57–68. [Google Scholar] [CrossRef]
- Kilic, M.; Anac, S. Multi-Objective planning model for large scale irrigation systems: Method and application. Water Resour. Manag. 2010, 24, 3173–3194. [Google Scholar] [CrossRef]
- Chen, C.; Wei, C.; Liu, H.; Hsu, N. Application of neural networks and optimization model in conjunctive use of surface water and groundwater. Water Resour. Manag. 2014, 28, 2813–2832. [Google Scholar] [CrossRef]
- Davijani, M.H.; Banihabib, M.E.; Anvar, A.N.; Hashemi, S.R. Multi-Objective optimization model for the allocation of water resources in arid regions based on the maximization of socioeconomic efficiency. Water Resour. Manag. 2016, 30, 927–946. [Google Scholar] [CrossRef]
- Singh, A. Optimal allocation of resources for increasing farm revenue under hydrological uncertainty. Water Resour. Manag. 2016, 30, 2569–2580. [Google Scholar] [CrossRef]
- Mirajkar, A.B.; Patel, P.L. Multiobjective Two-Phase fuzzy optimization approaches in management of water resources. J. Water Resour. Plan. Manag. 2016, 142, 04016046. [Google Scholar] [CrossRef]
- Fasakhodi, A.A.; Nouri, S.H.; Amini, M. Water resources sustainability and optimal cropping pattern in farming systems; A Multi-Objective fractional goal programming approach. Water Resour. Manag. 2010, 24, 4639–4657. [Google Scholar] [CrossRef]
- Ren, C.F.; Guo, P.; Li, M.; Gu, J.J. Optimization of industrial structure considering the uncertainty of water resources. Water Resour. Manag. 2013, 27, 3885–3898. [Google Scholar] [CrossRef]
- Li, M.; Guo, P.; Ren, C.F. Water Resources Management Models Based on Two-Level Linear Fractional Programming Method under Uncertainty. J. Water Resour. Plan. Manag. 2015, 141, 5015001–5015009. [Google Scholar] [CrossRef]
- Ren, C.F.; Li, R.H.; Zhang, L.D.; Guo, P. Multiobjective stochastic fractional goal programming model for water resources optimal allocation among industries. J. Water Resour. Plan. Manag. 2016, 142, 04016036. [Google Scholar] [CrossRef]
- Mani, A.; Tsai, F.T.C.; Kao, S.; Naz, B.S.; Ashfaq, M.; Rastogi, D. Conjunctive management of surface and groundwater resources under projected future climate change scenarios. J. Hydrol. 2016, 540, 397–411. [Google Scholar] [CrossRef]
- Charnes, A.; Cooper, W.W.; Rhodes, E. Measuring efficiency of decision-making units. Eur. J. Oper. Res. 1978, 2, 429–444. [Google Scholar] [CrossRef]
- Alsharif, K.; Feroz, E.H.; Klemer, A.; Raab, R. Governance of water supply systems in the Palestinian Territories: A data envelopment analysis approach to the management of water resources. J. Environ. Manag. 2008, 87, 80–94. [Google Scholar] [CrossRef] [PubMed]
- Romano, G.; Guerrini, A. Measuring and comparing the efficiency of water utility companies: A data envelopment analysis approach. Util. Policy 2011, 19, 202–209. [Google Scholar] [CrossRef]
- Veettil, P.C.; Speelman, S.; Van, H.G. Estimating the impact of water pricing on water use efficiency in semi-arid cropping system: An application of probabilistically constrained nonparametric efficiency analysis. Water Resour. Manag. 2013, 27, 55–73. [Google Scholar] [CrossRef]
- Azad, M.A.S.; Ancev, T.; Hernandez-Sancho, F. Efficient water use for sustainable irrigation industry. Water Resour. Manag. 2015, 29, 1683–1696. [Google Scholar] [CrossRef]
- Ren, C.F.; Guo, P.; Li, M.; Li, R.H. An innovative method for water resources carrying capacity research—Metabolic theory of regional water resources. J. Environ. Manag. 2016, 167, 139–146. [Google Scholar] [CrossRef] [PubMed]
- Fare, R.; Grosskopf, S. Measuring output efficiency. Eur. J. Oper. Res. 1983, 13, 173–179. [Google Scholar] [CrossRef]
- Huppes, G.; Ishikawa, M. A Framework for Quantified Eco-efficiency Analysis. J. Ind. Ecol. 2005, 9, 25–41. [Google Scholar] [CrossRef]
- Ke, W.; Wei, H.; Jie, W.; Ying-Nan, L. Efficiency measures of the Chinese commercial banking system using an additive two-stage DEA. Omega 2014, 44, 5–20. [Google Scholar]
- Lewis, H.F.; Mallikarjun, S.; Sexton, T.R. Unoriented two-stage DEA: The case of the oscillating intermediate products. Eur. J. Oper. Res. 2013, 229, 529–539. [Google Scholar] [CrossRef]
- Chen, Y.; Liang, L.; Yang, F.; Zhu, J. Evaluation of information technology investment: A data envelopment analysis approach. Comput. Oper. Res. 2006, 33, 1368–1379. [Google Scholar] [CrossRef]
- Kao, C. Efficiency decomposition in network data envelopment analysis: A relational model. Eur. J. Oper. Res. 2009, 192, 949–962. [Google Scholar] [CrossRef]
- Chen, Y.; Zhu, J. Measuring information technology’s indirect impact on firm performance. Inf. Technol. Manag. 2004, 5, 9–22. [Google Scholar] [CrossRef]
- Chen, Y.; Lin, Y. Controlling the movement of crowds in computer graphics by using the mechanism of particle swarm optimization. Appl. Soft Comput. 2009, 9, 1170–1176. [Google Scholar] [CrossRef]
- Yang, Z.J. A two-stage DEA model to evaluate the overall performance of Canadian life and health insurance companies. Math. Comput. Model. 2006, 43, 910–919. [Google Scholar] [CrossRef]
- Chen, Y.; Cook, W.D.; Li, N.; Zhu, J. Additive efficiency decomposition in two-stage DEA. Eur. J. Oper. Res. 2009, 196, 1170–1176. [Google Scholar] [CrossRef]
- Johnson, A.L.; Kuosmanen, T. One-stage and two-stage DEA estimation of the effects of contextual variables. Eur. J. Oper. Res. 2012, 220, 559–570. [Google Scholar] [CrossRef]
- Cai, Z.; Shen, L.; Liu, J. Applying input-output analysis method for calculation of water footprint and virtual water trade in Gansu Province. Acta Ecol. Sin. 2012, 32, 6481–6488. [Google Scholar]
- Huang, Y.; Li, Y.P.; Chen, X.; Ma, Y.G. Optimization of the irrigation water resources for agricultural sustainability in Tarim River Basin, China. Agric. Water Manag. 2012, 107, 74–85. [Google Scholar] [CrossRef]
- Wang, G. The utilization of water resource and its influence on eco environment in the northwest arid area of china. J. Nat. Resour. 1999, 43, 121–131. [Google Scholar]


| Different Substages | Input/Output Indicators |
|---|---|
| Sub-stage 1.1 social subsystem inputs | Water resources (108 m3) |
| Sub-stage 1.2 economic subsystem inputs | Water resources (108 m3) |
| Intermediate measures (stage 1 outputs and stage2 inputs) | Population (104 p) |
| Urban population proportion (%) | |
| GDP (108 yuan) | |
| Proportion of secondary, tertiary industry (%) | |
| Stage 2 outputs | Growth rate of population (%) |
| Growth rate of urban population (%) | |
| Growth rate of GDP (%) | |
| Growth rate of secondary, tertiary industry (%) |
| 2004 | 2005 | 2006 | 2007 | 2008 | |||||||||||
| α | β | θ | α | β | θ | α | β | θ | α | β | θ | α | β | θ | |
| Baiyin | 0.6878 | 0.2331 | 1 | 0.4038 | 0.0899 | 1 | 0.2901 | 0.0768 | 1.0432 | 0.4917 | 0.1070 | 1 | 0.2545 | 0.0614 | 1.1258 |
| Dingxi | 0.4136 | 0.7198 | 1.5290 | 0.3611 | 0.0537 | 1.0011 | 0.6275 | 0.1482 | 1.3699 | 1 | 0.1101 | 1 | 0.3590 | 0.1350 | 1.5474 |
| Gannan | 1 | 1 | 1 | 1 | 1 | 1 | 1 | 1 | 1 | 1 | 1 | 1 | 1 | 1 | 1 |
| Jiayuguan | 1 | 0.5955 | 1 | 0.8125 | 0.2456 | 1 | 0.8750 | 0.3519 | 1 | 0.8750 | 0.3669 | 1 | 0.7778 | 0.3584 | 1 |
| Jinchang | 0.7005 | 0.2492 | 1 | 0.8125 | 0.0530 | 1.0180 | 0.8235 | 0.1125 | 1 | 0.6667 | 0.1706 | 1 | 0.6364 | 0.0825 | 1.0404 |
| Jiuquan | 0.3663 | 0.0528 | 1.1939 | 0.2496 | 0.0313 | 1 | 0.2295 | 0.0316 | 1.1801 | 0.2874 | 0.0375 | 1 | 0.2563 | 0.0355 | 1 |
| Lanzhou | 0.3789 | 1 | 1 | 0.2433 | 1 | 1 | 0.0749 | 0.0436 | 1.0039 | 1 | 1 | 1 | 0.0707 | 0.0380 | 1.0221 |
| Linxia | 0.3236 | 0.3262 | 1.4379 | 0.2889 | 0.0737 | 1 | 0.3523 | 0.2198 | 1.2151 | 0.5963 | 0.1138 | 1 | 0.2917 | 0.1699 | 1.2965 |
| Longnan | 0.2363 | 0.6063 | 1.4128 | 0.2889 | 0.1038 | 1 | 0.734 | 0.2299 | 1 | 0.7432 | 0.2324 | 1 | 0.5 | 0.3004 | 1.3973 |
| Pingliang | 0.2555 | 0.5628 | 1.2554 | 0.3286 | 0.1414 | 1 | 0.4498 | 0.2163 | 1.0607 | 0.5428 | 0.2292 | 1 | 0.2414 | 0.1356 | 1.0609 |
| Qingyang | 0.3649 | 0.9306 | 1.1467 | 0.2817 | 0.4040 | 1 | 0.6021 | 0.8450 | 1 | 0.6357 | 0.9603 | 1 | 0.5354 | 1 | 1 |
| Tianshui | 0.1362 | 0.5376 | 1.1356 | 1 | 0.1414 | 1 | 1 | 0.2418 | 1 | 1 | 0.1931 | 1 | 0.1474 | 0.1599 | 1.2152 |
| Wuwei | 0.8108 | 0.0913 | 1 | 0.1327 | 0.0127 | 1.0047 | 0.2922 | 0.0387 | 1.1503 | 0.2700 | 0.0392 | 1 | 0.1333 | 0.0274 | 1.2892 |
| Zhangye | 0.4129 | 0.0889 | 1.4024 | 0.2889 | 0.0118 | 1.0076 | 0.3617 | 0.0302 | 1.2744 | 0.4419 | 0.0266 | 1 | 0.2857 | 0.0241 | 1.3173 |
| Average | 0.6747 | 0.5029 | 1.0988 | 0.5471 | 0.3179 | 1.001 | 0.5796 | 0.2561 | 1.0662 | 0.6858 | 0.3336 | 1 | 0.4572 | 0.2602 | 1.0641 |
| 2009 | 2010 | 2011 | 2012 | 2013 | |||||||||||
| α | β | θ | α | β | θ | α | β | θ | α | β | θ | α | β | θ | |
| Baiyin | 0.2244 | 0.0799 | 1.023 | 0.5439 | 0.1737 | 1 | 0.2462 | 0.0861 | 1 | 0.2852 | 0.0847 | 1.0361 | 0.6950 | 0.1297 | 1 |
| Dingxi | 0.2228 | 0.1152 | 1.1519 | 0.6532 | 0.4352 | 1 | 0.2112 | 0.1985 | 1.2530 | 0.3112 | 0.1250 | 1 | 0.4580 | 0.2811 | 1.0832 |
| Gannan | 1 | 1 | 1 | 1 | 1 | 1 | 1 | 1 | 1 | 1 | 1 | 1 | 0.9310 | 1 | 1 |
| Jiayuguan | 1 | 0.7566 | 1 | 1 | 0.8537 | 1 | 1 | 0.7839 | 1 | 1 | 0.5111 | 1 | 1 | 0.4581 | 1 |
| Jinchang | 0.5455 | 0.1480 | 1.0477 | 0.6756 | 0.2015 | 1 | 0.6763 | 0.1686 | 1 | 0.6475 | 0.1160 | 1 | 0.8439 | 0.1165 | 1 |
| Jiuquan | 0.5733 | 0.0878 | 1 | 0.6384 | 0.1082 | 1 | 0.3023 | 0.0345 | 1.0942 | 0.5403 | 0.0300 | 1 | 0.4957 | 0.0578 | 1 |
| Lanzhou | 0.5360 | 1 | 1 | 1 | 1 | 1 | 1 | 1 | 1 | 1 | 1 | 1 | 1 | 1 | 1 |
| Linxia | 0.2690 | 0.2026 | 1.1261 | 0.3773 | 0.2179 | 1.0567 | 0.2500 | 0.3287 | 1.2485 | 0.3268 | 0.1314 | 1.0191 | 0.3744 | 0.1648 | 1.0165 |
| Longnan | 0.2326 | 0.2595 | 1.1047 | 0.6315 | 0.4874 | 1 | 1 | 0.4870 | 1 | 0.3268 | 0.3973 | 1.1727 | 0.3843 | 0.5596 | 1.0913 |
| Pingliang | 0.2351 | 0.2268 | 1.1091 | 0.6660 | 0.5517 | 1 | 0.2154 | 0.3591 | 1.2238 | 0.4398 | 0.2759 | 1.1025 | 0.2605 | 0.3622 | 1.1462 |
| Qingyang | 0.9381 | 1 | 1 | 0.8810 | 1 | 1 | 0.8914 | 1 | 1 | 0.8627 | 1 | 1 | 0.8554 | 1 | 1 |
| Tianshui | 1 | 0.4576 | 1 | 0.2938 | 0.5559 | 1 | 0.1167 | 0.3159 | 1.1598 | 0.1254 | 0.2724 | 1.0657 | 0.3253 | 0.2309 | 1 |
| Wuwei | 0.2072 | 0.0468 | 1.3364 | 0.6761 | 0.0880 | 1 | 0.2546 | 0.0456 | 1.1901 | 0.7934 | 0.0596 | 1 | 0.7426 | 0.0703 | 1 |
| Zhangye | 0.2899 | 0.0320 | 1.2812 | 0.6694 | 0.0536 | 1 | 0.2766 | 0.0452 | 1.3593 | 0.4608 | 0.0367 | 1.2557 | 0.5635 | 0.0438 | 1 |
| Average | 0.6300 | 0.3922 | 1.0607 | 0.7020 | 0.4788 | 1.0015 | 0.8561 | 0.4321 | 1.1092 | 0.6933 | 0.3723 | 1.0382 | 0.7129 | 0.4048 | 1.0241 |
| 2004–2005 | 2005–2006 | 2006–2007 | 2007–2008 | 2008–2009 | 2009–2010 | 2010–2011 | 2011–2012 | 2012–2013 | MEAN | |
|---|---|---|---|---|---|---|---|---|---|---|
| Baiyin | 1.291 | 1.159 | 1.178 | 1.228 | 1.0689 | 1.164 | 1.207 | 1.129 | 0.977 | 1.156 |
| Dingxi | 0.690 | 0.993 | 0.971 | 1.085 | 0.958 | 0.916 | 1.005 | 1.083 | 1.083 | 0.976 |
| Gannan | 2.098 | 1.025 | 1.041 | 0.868 | 0.956 | 1.068 | 1.107 | 0.938 | 0.754 | 1.095 |
| Jianyuguan | 0.935 | 1.011 | 1.022 | 0.936 | 1.054 | 1.042 | 1.171 | 1.022 | 0.928 | 1.013 |
| Jinchang | 1.031 | 1.371 | 1.331 | 0.952 | 1.071 | 1.071 | 1.109 | 0.971 | 0.915 | 1.091 |
| Jiuquan | 1.392 | 1.171 | 1.155 | 1.257 | 1.172 | 1.114 | 1.139 | 1.145 | 1.003 | 1.172 |
| Lanzhou | 1.082 | 1.010 | 1.152 | 1.139 | 1.142 | 1.184 | 1.233 | 1.243 | 1.282 | 1.163 |
| Linxia | 1.283 | 1.004 | 0.983 | 1.042 | 0.979 | 0.990 | 1.013 | 1.007 | 0.875 | 1.020 |
| Longnan | 1.141 | 0.967 | 0.981 | 1.323 | 0.827 | 0.977 | 1.004 | 0.968 | 1.303 | 1.055 |
| Pingliang | 1.069 | 1.023 | 1.020 | 1.069 | 1.005 | 1.067 | 1.139 | 0.975 | 1.395 | 1.085 |
| Qingyang | 2.037 | 1.118 | 1.070 | 1.120 | 0.678 | 0.998 | 1.308 | 1.432 | 1.113 | 1.208 |
| Tianshui | 0.924 | 0.979 | 1.009 | 1.00 | 0.978 | 1.047 | 1.066 | 0.957 | 1.155 | 1.013 |
| Wuwei | 1.159 | 1.244 | 1.164 | 1.209 | 0.956 | 1.258 | 1.197 | 1.163 | 1.128 | 1.164 |
| Zhangye | 0.906 | 1.074 | 1.140 | 1.146 | 1.093 | 1.120 | 1.215 | 1.095 | 1.129 | 1.102 |
© 2016 by the authors; licensee MDPI, Basel, Switzerland. This article is an open access article distributed under the terms and conditions of the Creative Commons Attribution (CC-BY) license (http://creativecommons.org/licenses/by/4.0/).
Share and Cite
Ren, C.; Li, R.; Guo, P. Two-Stage DEA Analysis of Water Resource Use Efficiency. Sustainability 2017, 9, 52. https://doi.org/10.3390/su9010052
Ren C, Li R, Guo P. Two-Stage DEA Analysis of Water Resource Use Efficiency. Sustainability. 2017; 9(1):52. https://doi.org/10.3390/su9010052
Chicago/Turabian StyleRen, Chongfeng, Ruihuan Li, and Ping Guo. 2017. "Two-Stage DEA Analysis of Water Resource Use Efficiency" Sustainability 9, no. 1: 52. https://doi.org/10.3390/su9010052
APA StyleRen, C., Li, R., & Guo, P. (2017). Two-Stage DEA Analysis of Water Resource Use Efficiency. Sustainability, 9(1), 52. https://doi.org/10.3390/su9010052