
Environmental Efficiency and Its Determinants for Manufacturing in China


Abstract
:1. Introduction
2. Methodology
2.1. SBM-DEA Model for Economic-Environment Efficiency
2.2. Tobit Model for Economic-Environment Efficiency Determinants
3. Empirical Analysis
3.1. Manufacturing Classification
3.2. Data Description
3.2.1. Environment Efficiency Measurement Data
3.2.2. Tobit Regression Data and Its Hypotheses
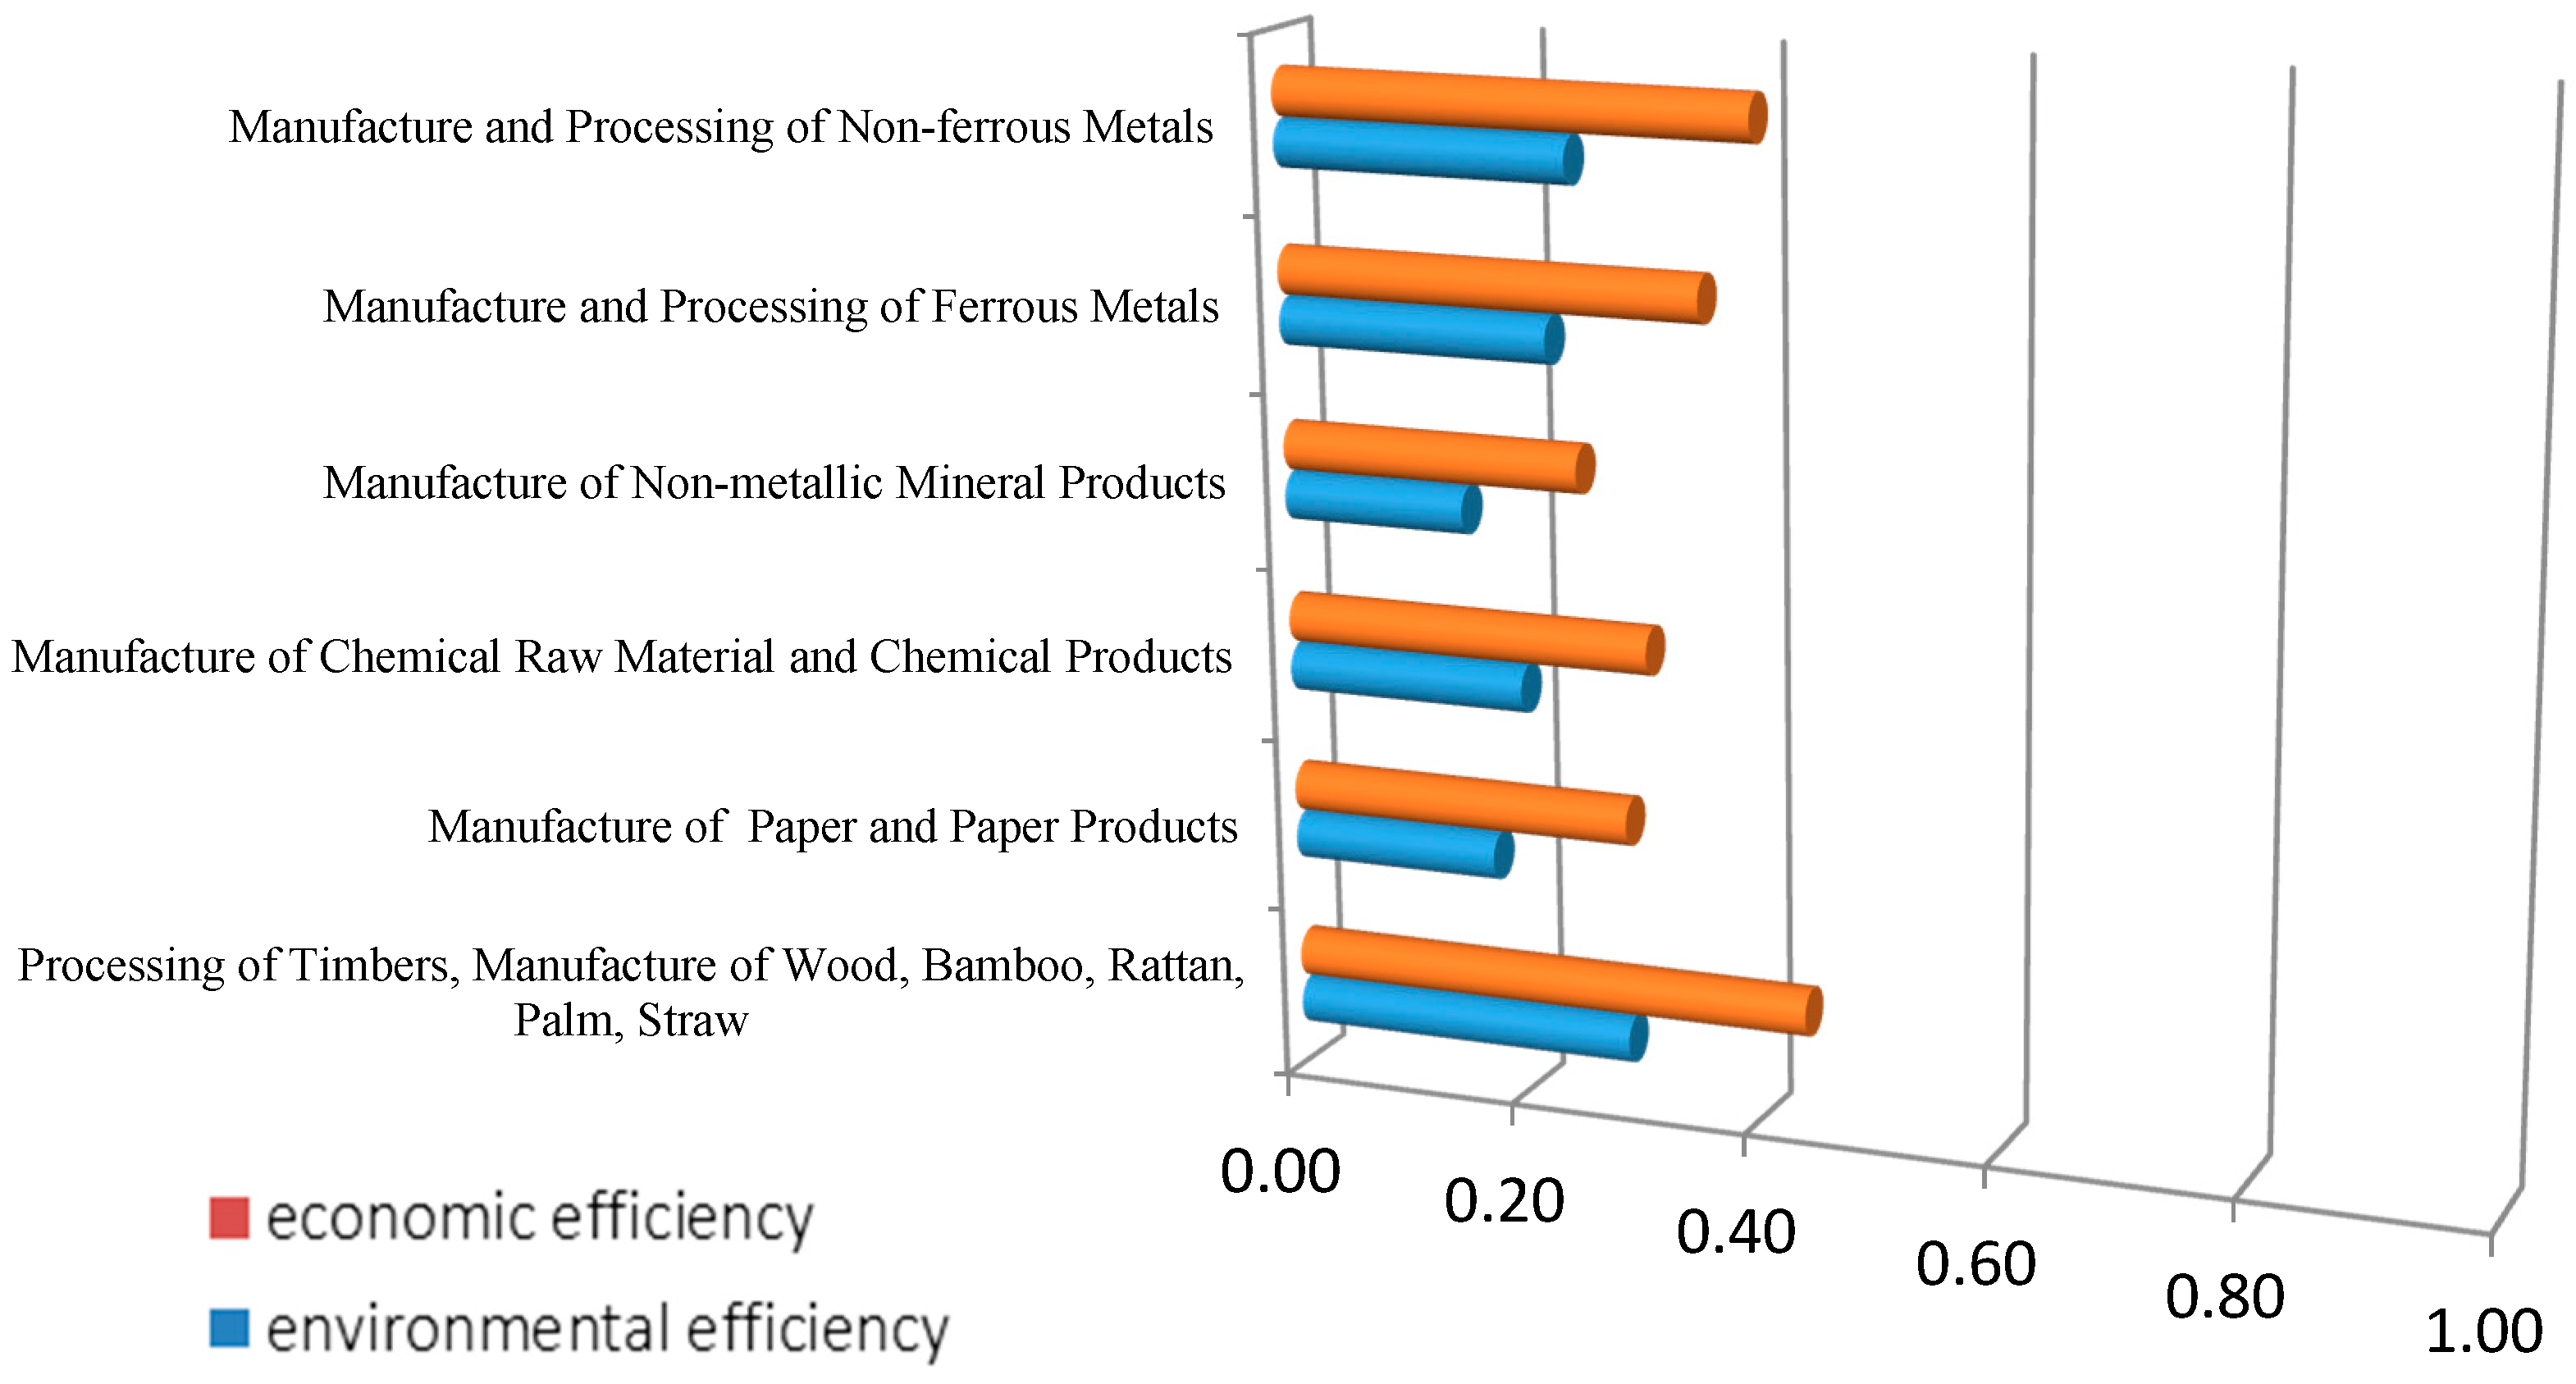
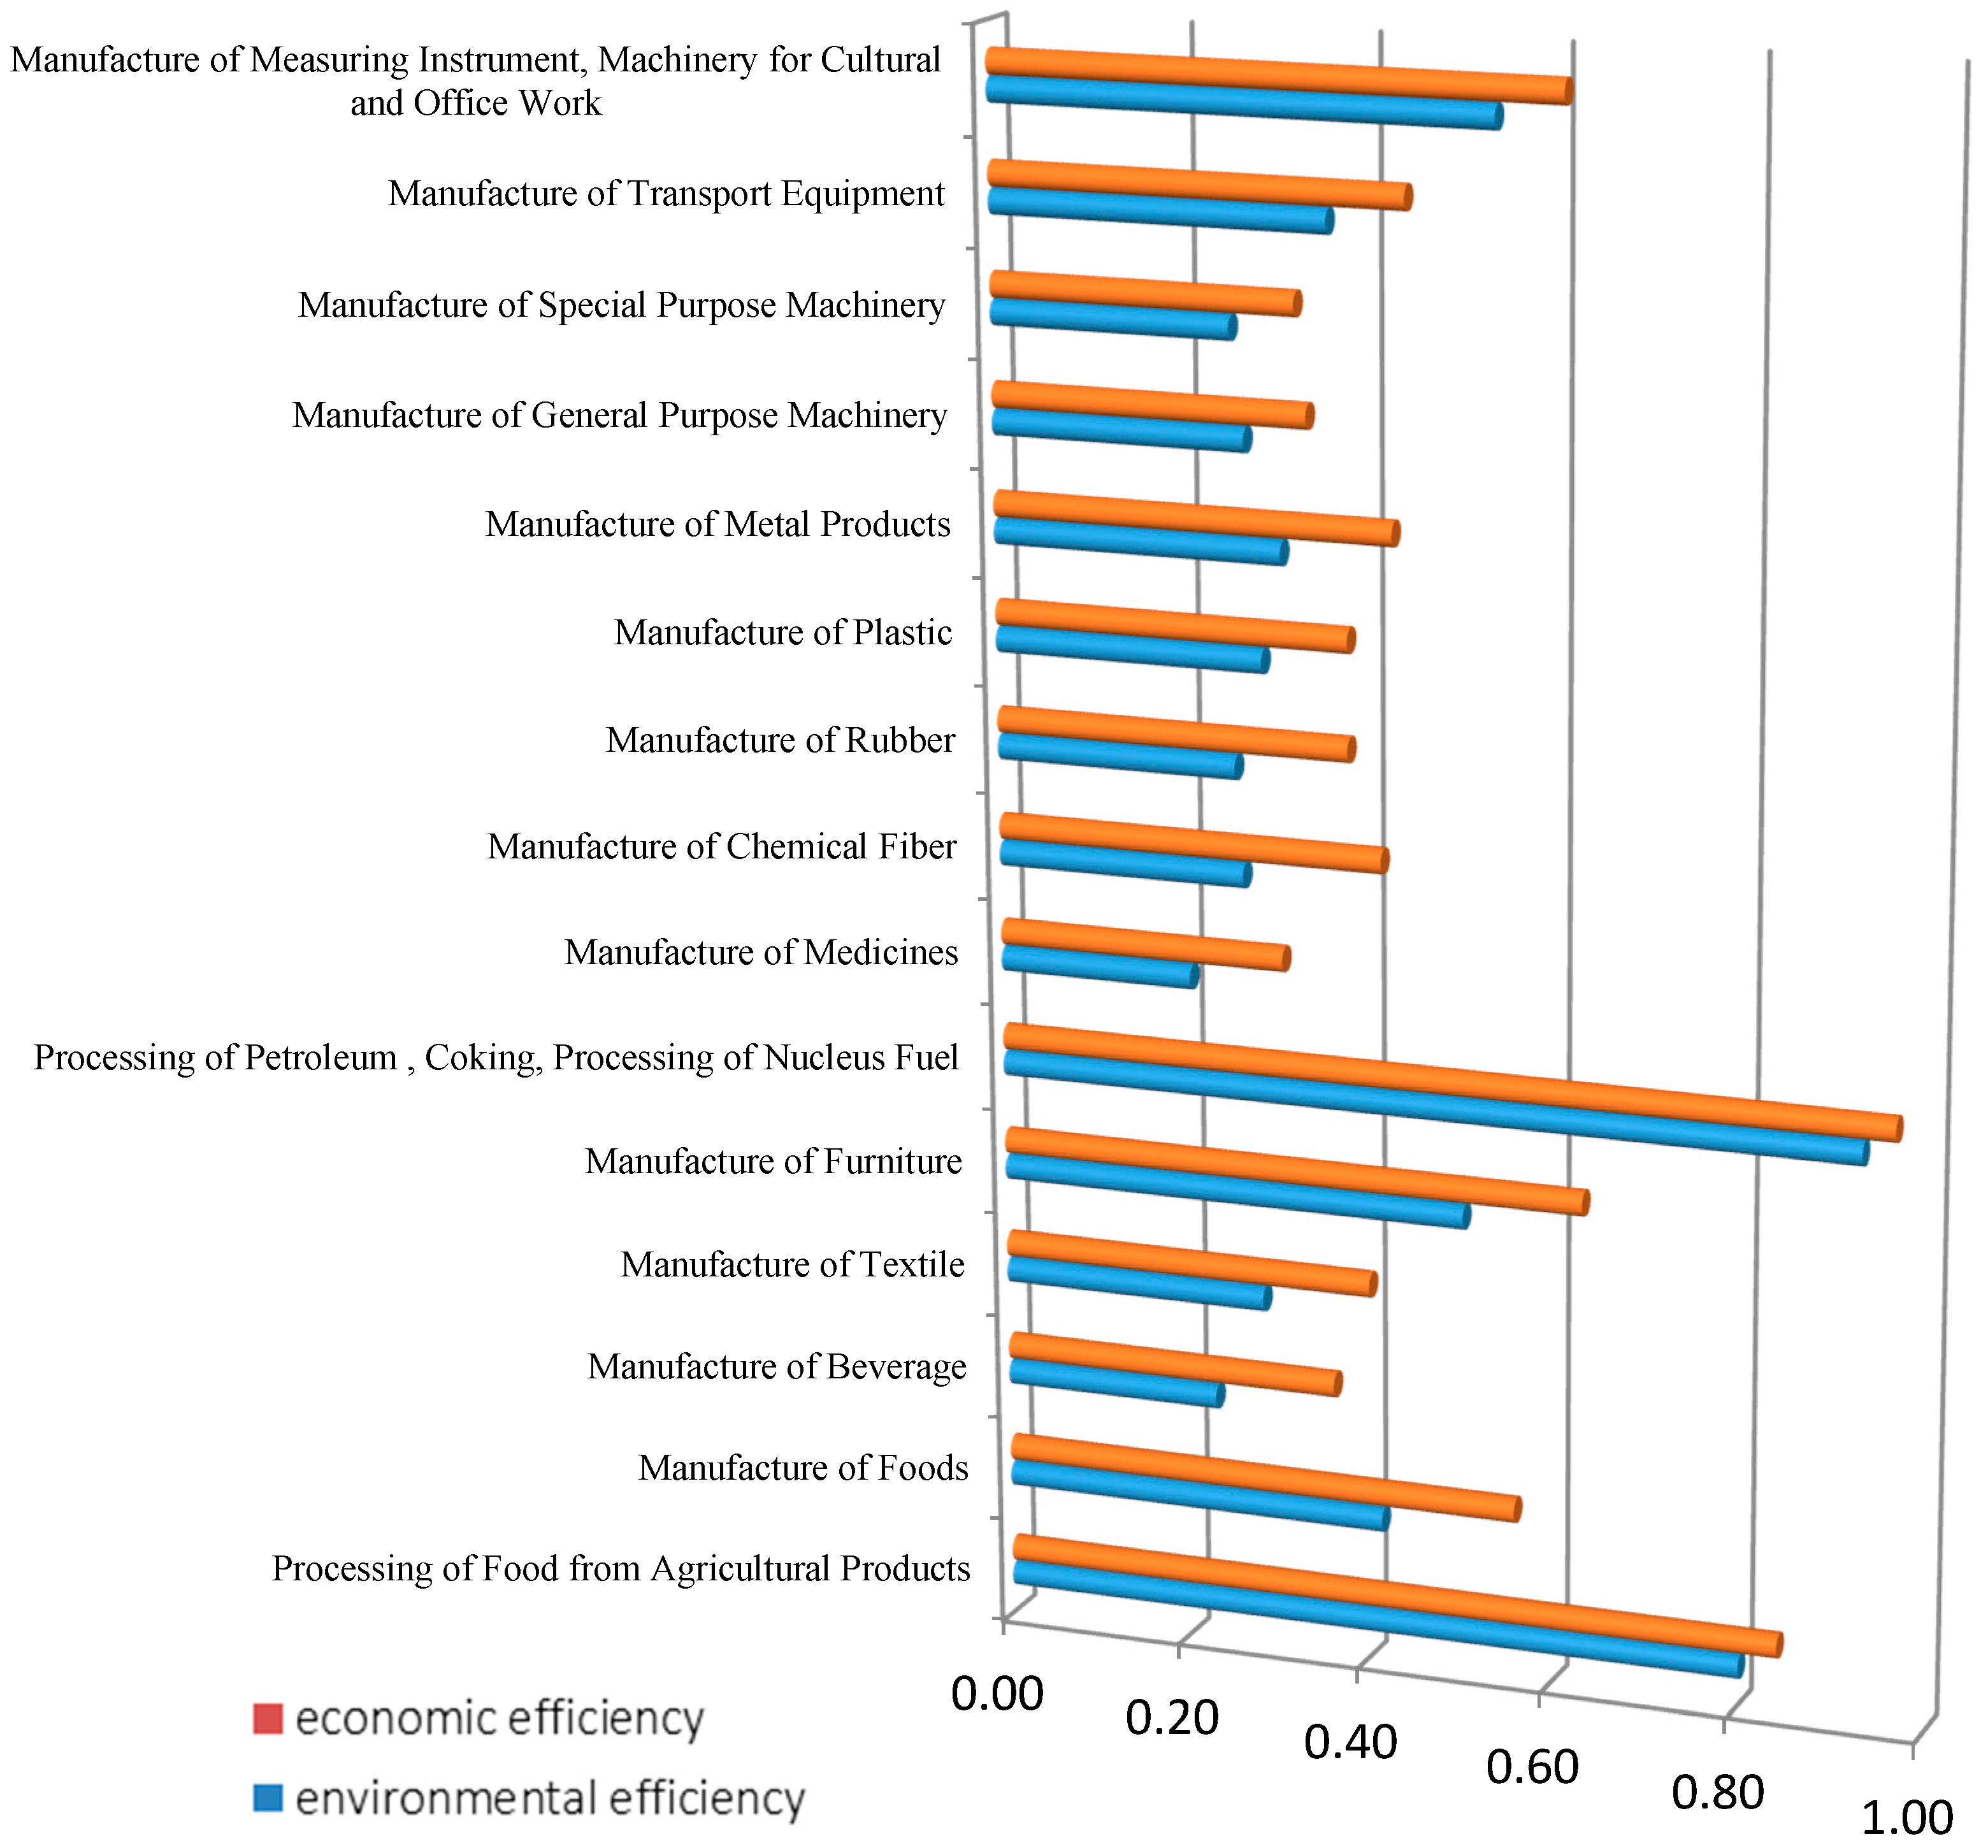
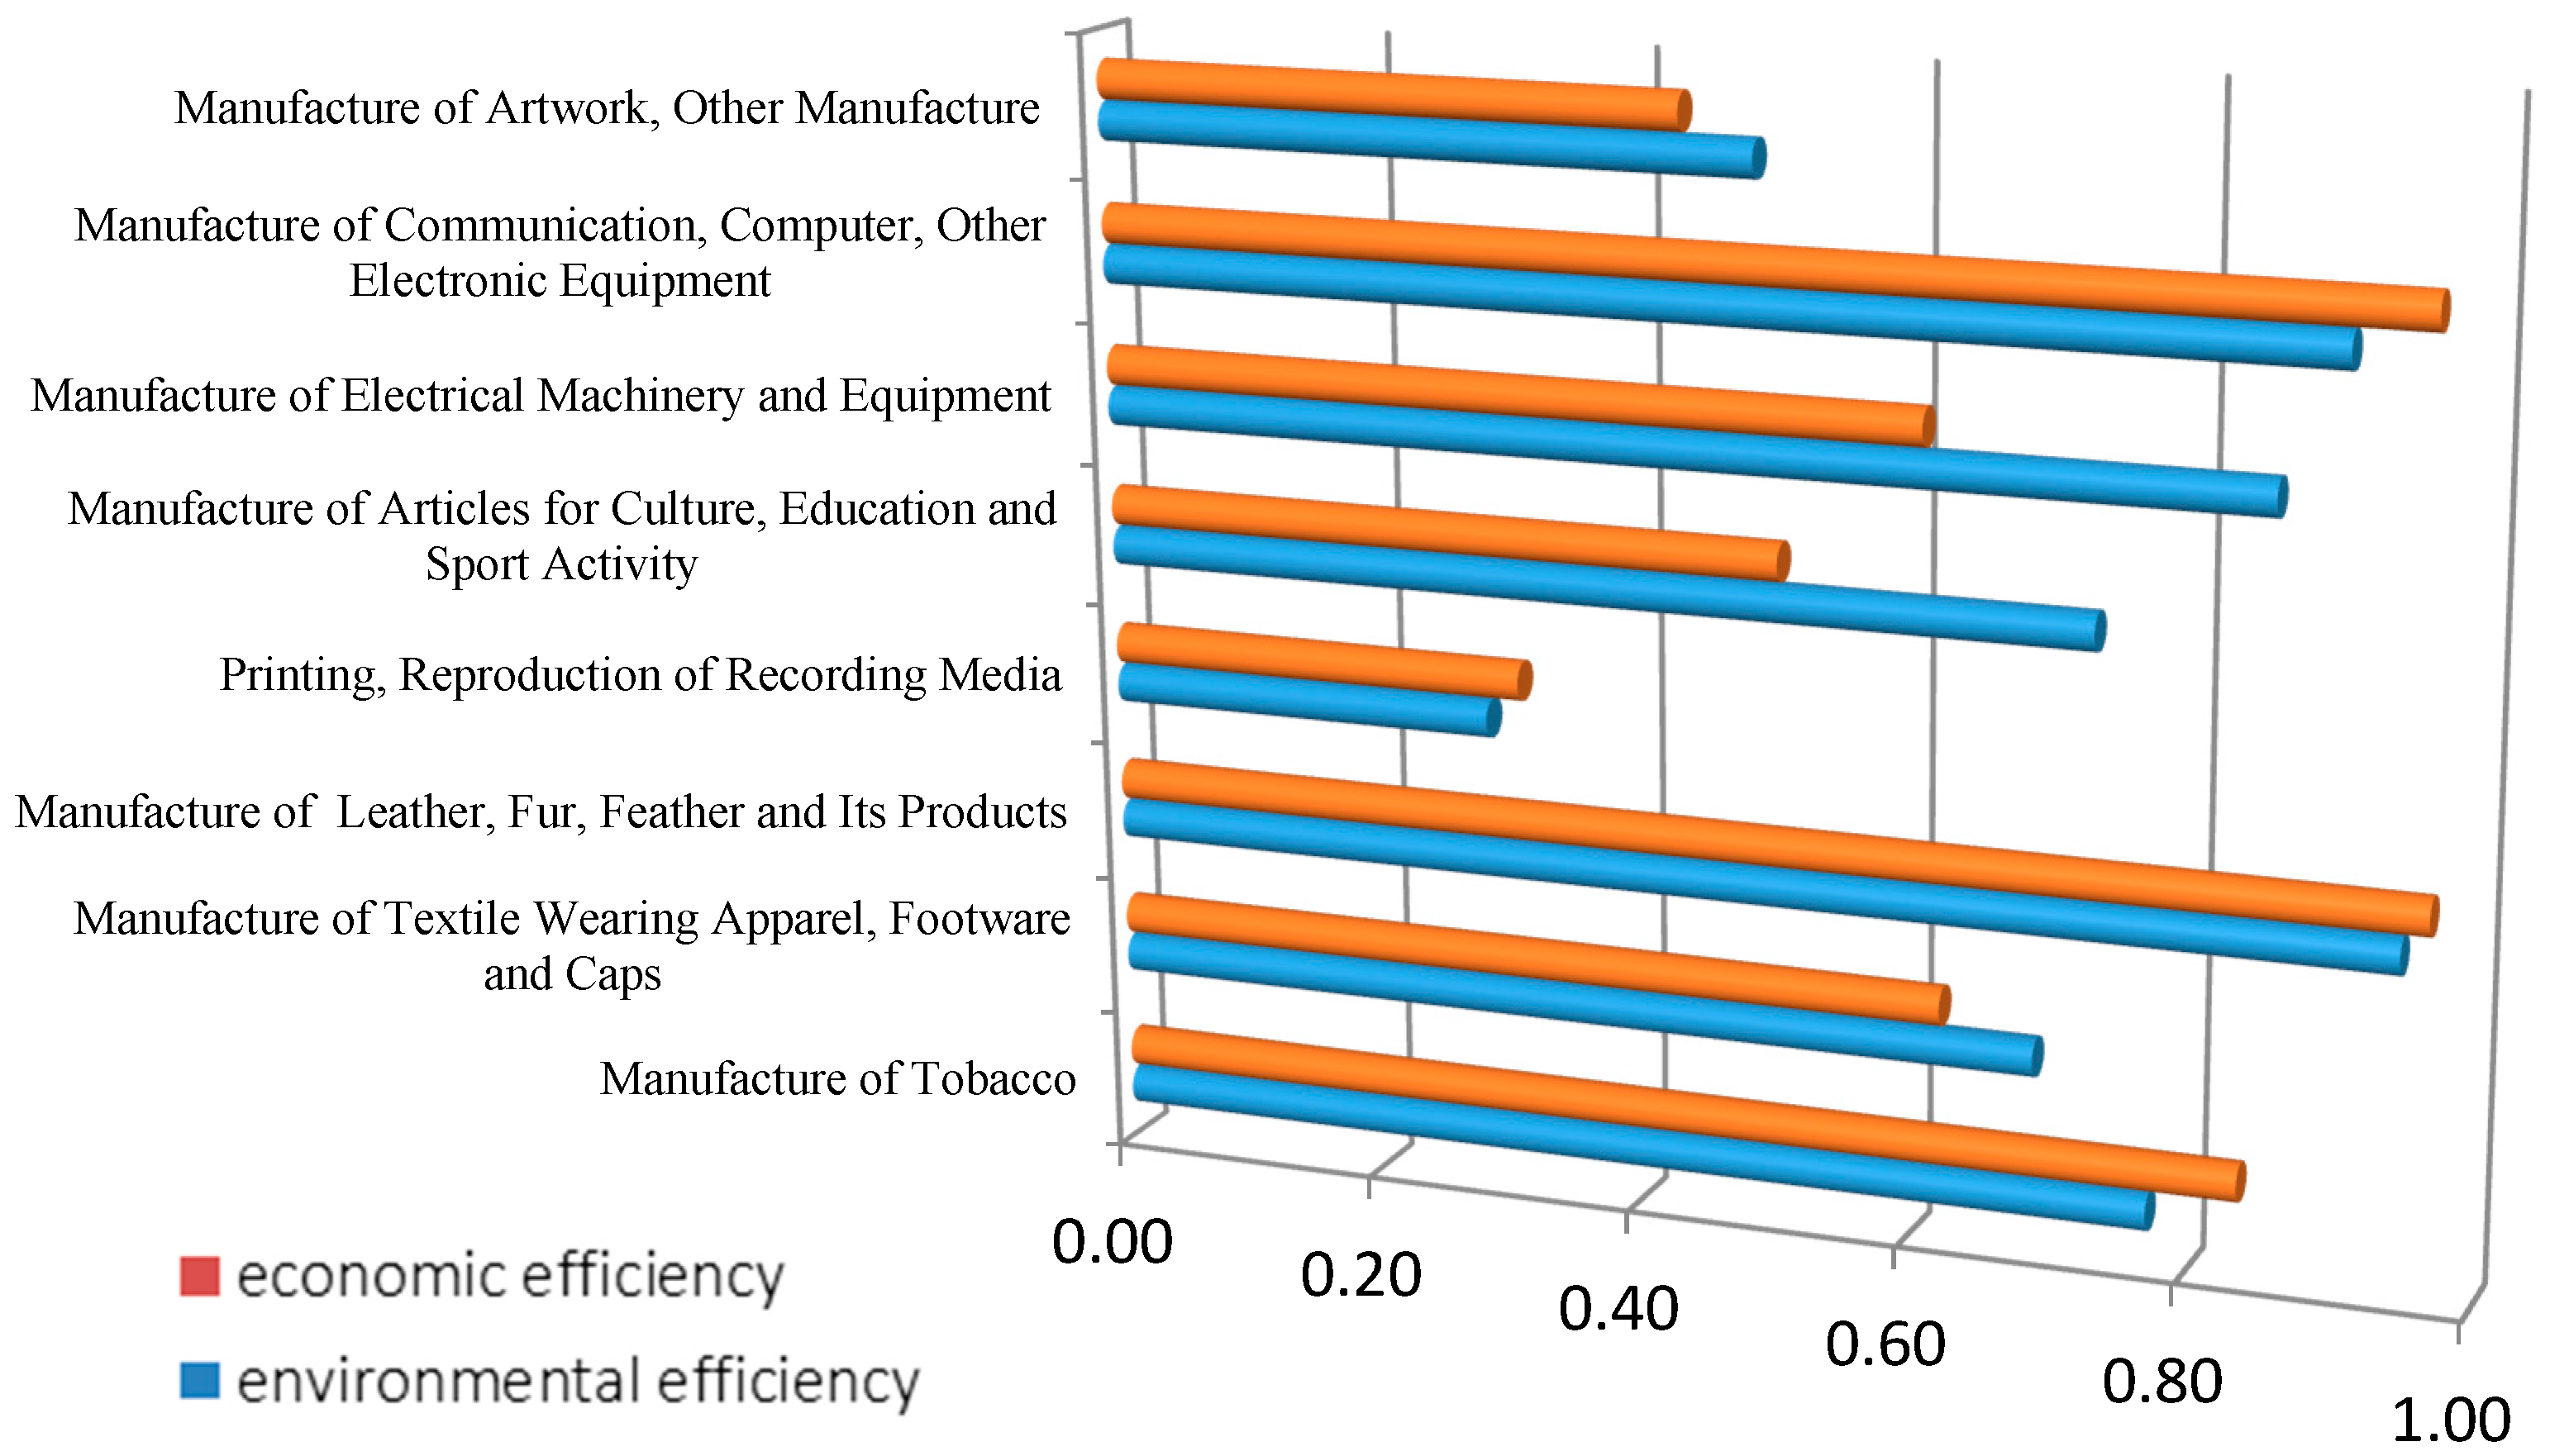
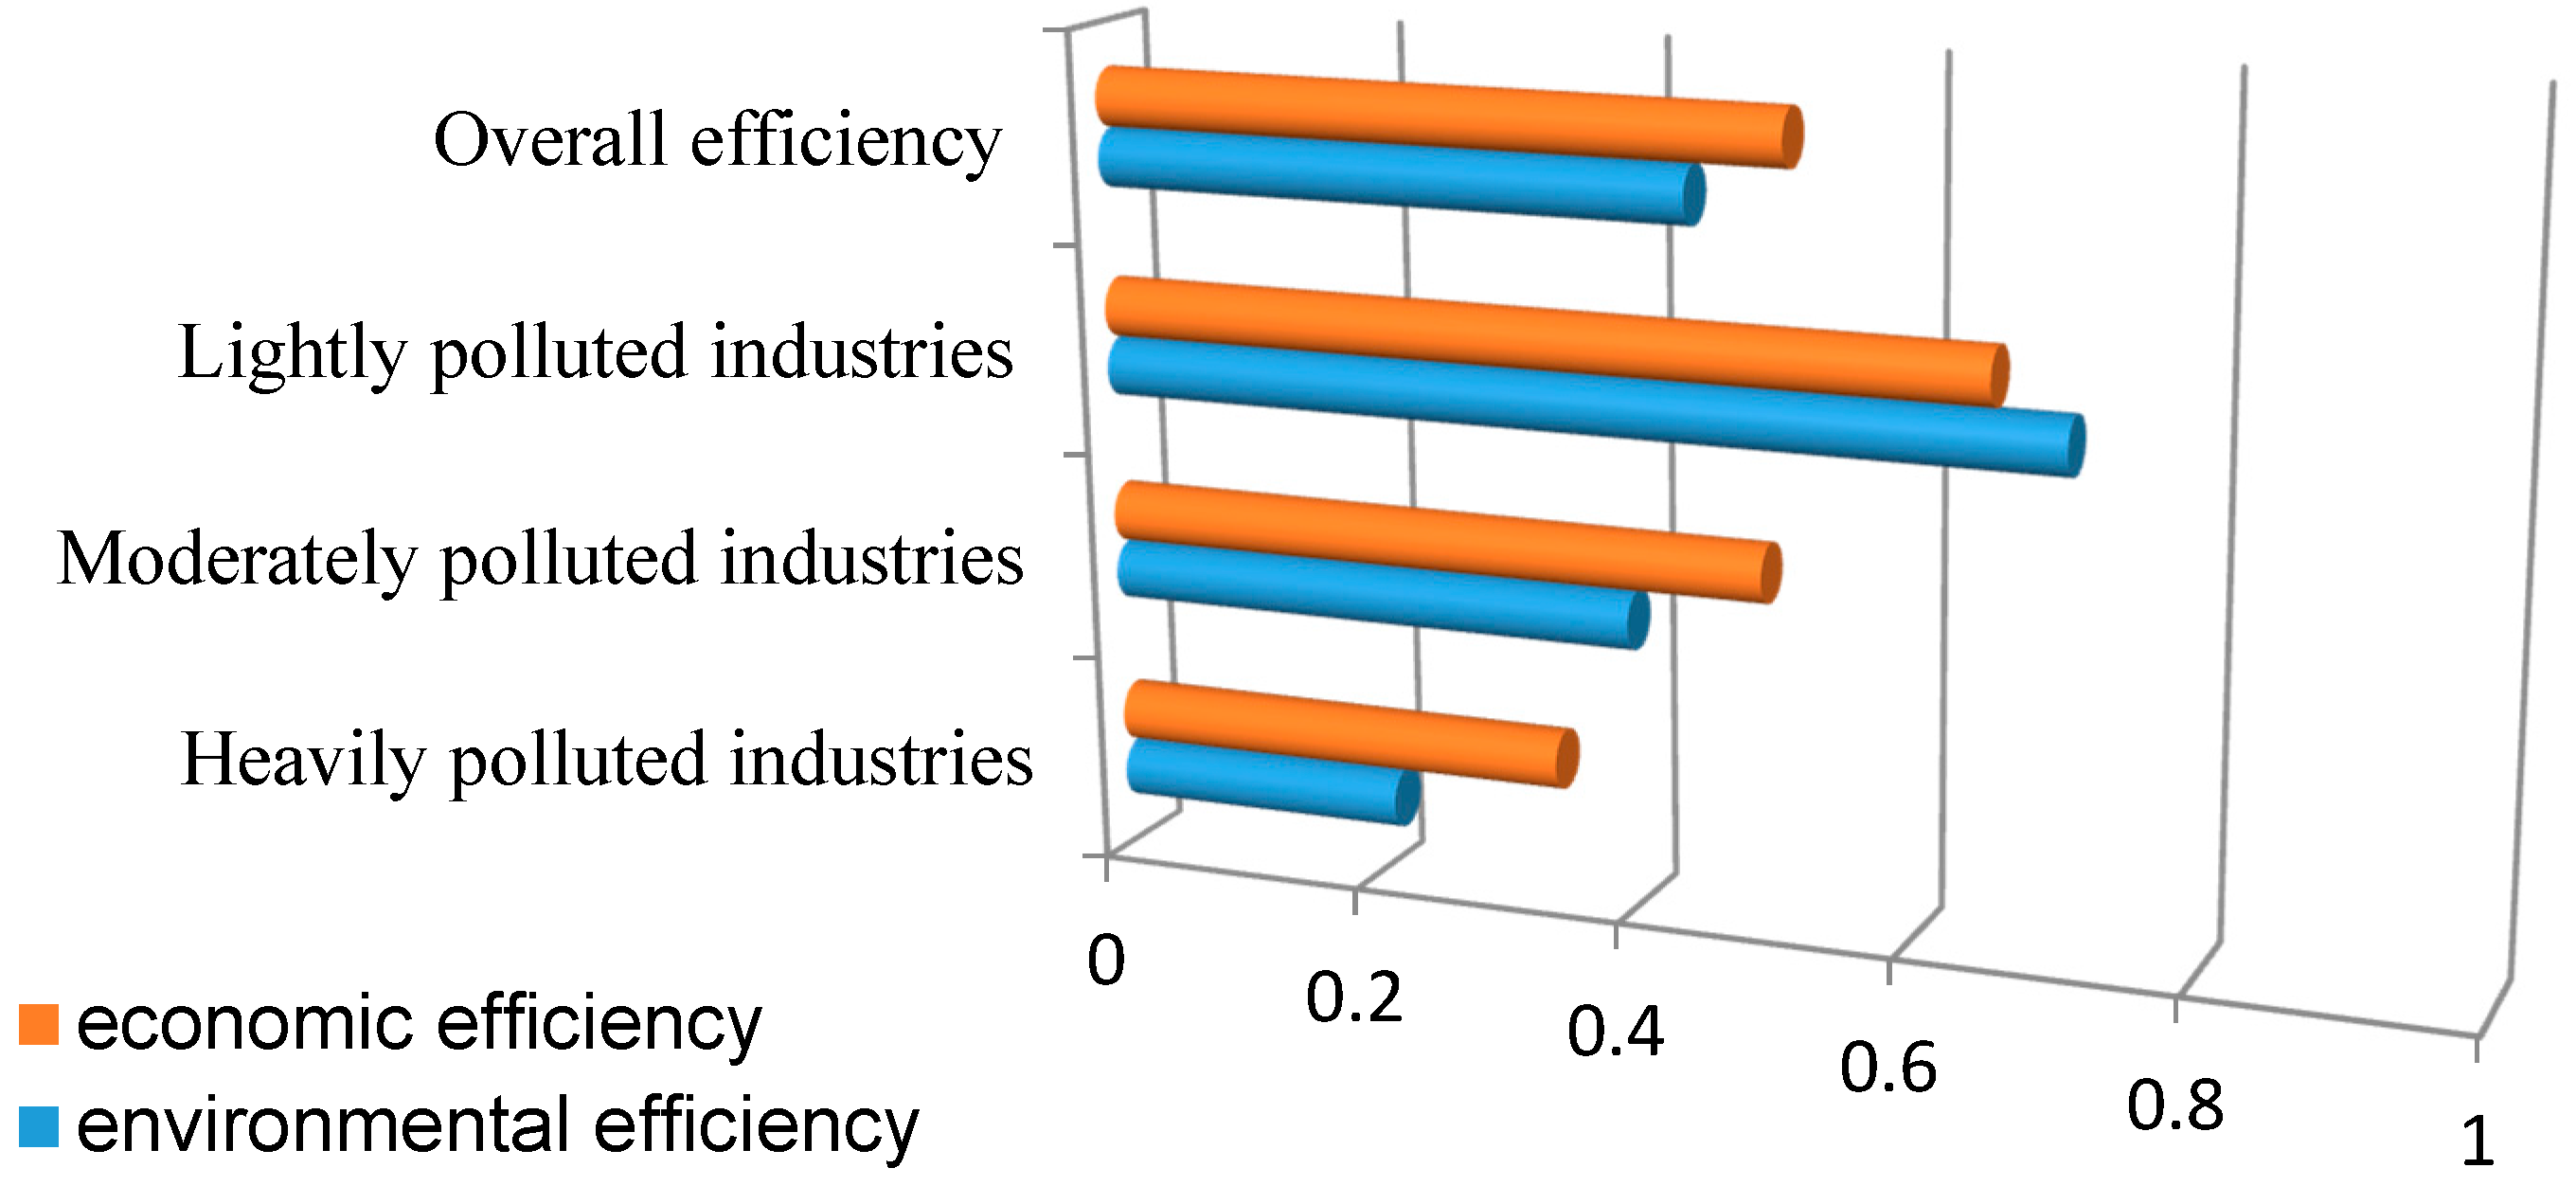
3.3. Environmental Efficiency Measurement of Manufacturing in China
3.4. Tobit Regressions Analysis
4. Conclusions
Acknowledgments
Author Contributions
Conflicts of Interest
References
- World Bank. Cost of Pollution in China; The World Bank: Washington, DC, USA, 2007. [Google Scholar]
- Shephard, R.W. Theory of Cost and Production Functions; Princeton University Press: Princeton, NJ, USA, 1970. [Google Scholar]
- Schmidheiny, S. Changing Course: A Global Business Perspective on Development and the Environment; MIT press: Cambridge, MA, USA, 1992; Volume 1. [Google Scholar]
- Jollands, N. An Ecological Economics of Eco-Efficiency: Theory, Interpretations and Applications to New Zealand. Ph.D. Thesis, Massey University, Palmerston North, New Zealand, 2003. [Google Scholar]
- Henriques, J.; Catarino, J. Sustainable value—An energy efficiency indicator in wastewater treatment plants. J. Clean. Prod. 2017, 142, 323–330. [Google Scholar] [CrossRef]
- Kortelainen, M. Dynamic environmental performance analysis: A Malmquist index approach. Ecol. Econ. 2008, 64, 701–715. [Google Scholar] [CrossRef]
- Reinhard, S.; Lovell, C.K.; Thijssen, G.J. Environmental efficiency with multiple environmentally detrimental variables; estimated with SFA and DEA. Eur. J. Oper. Res. 2000, 121, 287–303. [Google Scholar] [CrossRef]
- Mandal, S.K.; Madheswaran, S. Environmental efficiency of the Indian cement industry: An interstate analysis. Energy Policy 2010, 38, 1108–1118. [Google Scholar] [CrossRef]
- Diaz Mandal Diaz-Balteiro, L.; Romero, C. In search of a natural systems sustainability index. Ecol. Econ. 2004, 49, 401–405. [Google Scholar] [CrossRef]
- Fare, R.; Grosskopf, S. Modeling undesirable factors inefficiency evaluation: Comment. Eur. J. Oper. Res. 2004, 157, 242–245. [Google Scholar] [CrossRef]
- Zhang, B.; Bi, J.; Fan, Z.; Yuan, Z.W.; Ge, J.J. Eco-efficiency analysis of industrial system in China: A data envelopment analysis approach. Ecol. Econ. 2008, 68, 306–316. [Google Scholar] [CrossRef]
- Vachon, S. Technological capacity and environmental performance: A research note using country level data. J. Oper. Supply Chain Manag. 2012, 1, 21–28. [Google Scholar]
- Esty, D.C.; Levy, M.A.; Srebotniak, T.; de Sherbinin, A.; Kim, B.; Anderson, B. Pilot 2006 Environmental Performance Index; Yale Center for Environmental Law & Policy: New Haven, CT, USA, 2006. [Google Scholar]
- Miettinen, P.; Hamalainen, R.P. How to benefit from decision analysis in environmental life cycle assessment (LCA). Eur. J. Oper. Res. 1997, 102, 279–294. [Google Scholar] [CrossRef]
- Finnveden, G.; Ekvall, T. Life-cycle assessment as a decision-support tool—The case of recycling versus incineration of paper. Resour. Conserv. Recycl. 1998, 24, 235–256. [Google Scholar] [CrossRef]
- Ayalon, O.; Avnimelech, Y.; Shechter, M. Application of a comparative multidimensional life cycle analysis in solid waste management policy: The case of soft drink containers. Environ. Sci. Policy 2000, 3, 135–144. [Google Scholar] [CrossRef]
- Poeschl, M.; Ward, S.; Owende, P. Environmental impacts of biogas deployment–Part II: Life cycle assessment of multiple production and utilization pathways. J. Clean. Prod. 2012, 24, 184–201. [Google Scholar] [CrossRef]
- Carvalho, A.; Mimoso, A.F.; Mendes, A.N.; Matos, H.A. From a literature review to a framework for environmental process impact assessment index. J. Clean. Prod. 2014, 64, 36–62. [Google Scholar] [CrossRef]
- Kirkpatrick, N. Selecting a waste management option using a life-cycle analysis approach. Packag. Technol. Sci. 1993, 6, 159–172. [Google Scholar] [CrossRef]
- Cornelissen, R.L.; Hirs, G.G. The value of the exergetic life cycle assessment besides the LCA. Energy Convers. Manag. 2002, 43, 1417–1424. [Google Scholar] [CrossRef]
- Bohlmann, G.M. Biodegradable packaging life-cycle assessment. Environ. Prog. 2004, 23, 342–346. [Google Scholar] [CrossRef]
- Aigner, D.; Lovell, C.K.; Schmidt, P. Formulation and estimation of stochastic frontier production function models. J. Econ. 1977, 6, 21–37. [Google Scholar] [CrossRef]
- Dyson, R.G.; Shale, E.A. Data envelopment analysis, operational research and uncertainty. J. Oper. Res. Soc. 2010, 61, 25–34. [Google Scholar] [CrossRef]
- Chen, L.; Jia, G. Environmental efficiency analysis of China’s regional industry: A data envelopment analysis (DEA) based approach. J. Clean. Prod. 2017, 142, 846–853. [Google Scholar] [CrossRef]
- Charnes, A.; Cooper, W.W.; Rhodes, E. Measuring the efficiency of decision making units. Eur. J. Oper. Res. 1978, 2, 429–444. [Google Scholar] [CrossRef]
- Ramanathan, R. An analysis of energy consumption and carbon dioxide emissions in countries of the Middle East and North Africa. Energy 2005, 30, 2831–2842. [Google Scholar] [CrossRef]
- Zhou, P.; Ang, B.W.; Poh, K.L. Slacks-based efficiency measures for modeling environmental performance. Ecol. Econ. 2006, 60, 111–118. [Google Scholar] [CrossRef]
- Zhou, P.; Poh, K.L.; Ang, B.W. A non-radial DEA approach to measuring environmental performance. Eur. J. Oper. Res. 2007, 178, 1–9. [Google Scholar] [CrossRef]
- Bian, Y.; Yang, F. Resource and environment efficiency analysis of provinces in China: A DEA approach based on Shannon’s entropy. Energy Policy 2010, 38, 1909–1917. [Google Scholar] [CrossRef]
- Song, M.L.; Wang, S.H. DEA decomposition of China’s environmental efficiency based on search algorithm. Appl. Math. Comput. 2014, 247, 562–572. [Google Scholar] [CrossRef]
- Cooper, W.W.; Seiford, L.M.; Tone, K. Data Envelopment Analysis: A Comprehensive Text with Models, Applications, References and DEA-Solver Software, 2nd ed.; Kluwer Academic Publishers: Boston, MA, USA, 2007. [Google Scholar]
- Tone, K. Dealing with Undesirable Outputs in DEA: A Slacks-based Measure (SBM) Approach. Available online: https://grips.repo.nii.ac.jp/?action=repository_uri&item_id=955&file_id=20&file_no=1 (accessed on 29 December 2016).
- Tone, K. A slacks-based measure of efficiency in data envelopment analysis. Eur. J. Oper. Res. 2001, 130, 498–509. [Google Scholar] [CrossRef]
- Tobin, J. Estimation of relationships for limited dependent variables. Econometrica 1958, 26, 24–36. [Google Scholar] [CrossRef]
- Goldberger, A.S. Econometric Theory; Wiley: New York, NY, USA, 1964. [Google Scholar]
- Kirjavainen, T.; Loikkanent, H.A. Efficiency differences of Finnish senior secondary schools: An application of DEA and Tobit analysis. Econ. Educ. Rev. 1998, 17, 377–394. [Google Scholar] [CrossRef]
- Zaim, O. Measuring environmental performance of state manufacturing through changes in pollution intensities: A DEA framework. Ecol. Econ. 2004, 48, 37–47. [Google Scholar] [CrossRef]
- Kheder, S.B.; Zugravu, N. The Pollution Haven Hypothesis: A Geographic Economy Model in a Comparative study; FEEM: Milan, Italy, 2008; Available online: https://halshs.archives-ouvertes.fr/halshs-00344845/document (accessed on 29 December 2016).
- Golany, B.; Roll, Y. An application procedure for DEA. Omega-Int. J. Manag. Sci. 1989, 17, 237–250. [Google Scholar] [CrossRef]
- Li, H.; Fang, K.; Yang, W.; Wang, D.; Hong, X. Regional environmental efficiency evaluation in China: Analysis based on the Super-SBM model with undesirable outputs. Math. Comput. Model. 2013, 58, 1018–1031. [Google Scholar] [CrossRef]
- Pan, H.; Zhang, H.; Zhang, X. China’s provincial industrial energy efficiency and its determinants. Math. Comput. Model. 2013, 58, 1032–1039. [Google Scholar] [CrossRef]
- Selden, T.M.; Song, D. Environmental quality and development: Is there a Kuznets curve for air pollution emissions? J. Environ. Econ. Manag. 1994, 27, 147–162. [Google Scholar] [CrossRef]
- Werner, A.; Brian, C.; Scott, T. Is free trade good for the environment. Am. Econ. Rev. 2001, 91, 877–908. [Google Scholar]
- Dean, J.M.; Lovely, M.E. Trade Growth, Production Fragmentation, and China’s Environment. In China’s Growing Role in World Trade; University of Chicago Press: Chicago, IL, USA, 2010; pp. 429–469. [Google Scholar]
- Burniaux, J.M.; Martin, J.P.; Nicoletti, G.; Martins, J.O. GREEN a Multi-Sector, Multi-Region General Equilibrium Model for Quantifying the Costs of Curbing CO2 Emissions. 1992. Available online: http://www.oecd-library.org/docserver/download/744101452772.pdf?expires=1482897609&id=id&accname=guest&checksum=9CCF8B8E2E7DFBE2FCE12A5094DAD90F (accessed on 29 December 2016).
- Mielnik, O.; Goldemberg, J. Foreign direct investment and decoupling between energy and gross domestic product in developing countries. Energy Policy 2002, 30, 87–89. [Google Scholar] [CrossRef]
- Welsch, H.; Ochsen, C. The determinants of aggregate energy use in West Germany: Factor substitution, technological change, and trade. Energy Econ. 2005, 27, 93–111. [Google Scholar] [CrossRef]
- Hubler, M. Energy Saving Technology Diffusion via FDI and Trade: A CGE Model of China; Institute for the World Economy: Kiel, Germany, 2009. [Google Scholar]
- Lai, M.; Xu, H.; Bao, Q. Export Trade and Economic Growth; Shanghai Sanlianc Book Store: Shanghai, China, 2003. [Google Scholar]
- Zhang, Q. Wages, Export Trade and Total Factor Productivity: From 1979 to 2009. J. Financ. Econ. 2011, 4, 26–36. [Google Scholar]
- Cole, A.M.; Elliott, R.J.; Wu, S. Industrial activity and the environment in China: An industry-level analysis. China Econ. Rev. 2008, 19, 393–408. [Google Scholar] [CrossRef]
- Shao, S.; Yang, L.L.; Cao, J.H. Study on Influencing Factors of CO2 Emissions from Industrial Energy Consumption: An Empirical Analysis Based on STIRPAT Model and Industrial Sectors’ Dynamic Panel Data in Shanghai. J. Financ. Econ. 2010, 11, 16–27. [Google Scholar]
- Wang, S.; Qu, X. Research on Total Factor Energy Efficiency Change of China Manufacturing Industry Considering Environmental Effects: Based on DEA-Malmquist Index Empirical Study. China Popul. Resour. Environ. 2011, 8, 130–137. [Google Scholar]
- Zhu, J. Data envelopment analysis with preference structure. J. Oper. Res. Soc. 1996, 47, 136–150. [Google Scholar] [CrossRef]
- Russo, M.V.; Fouts, P.A. A resource-based perspective on corporate environmental performance and profitability. Acad. Manag. J. 1997, 40, 534–559. [Google Scholar] [CrossRef]
- Copeland, B.R.; Taylor, M.S. Trade, growth, and the environment. J. Econ. Lit. 2004, 42, 7–71. [Google Scholar] [CrossRef]
- Li, L.; Tao, F. Slection of optimal environmental regulation intensity for Chinese manufacturing industry-based on the green TFP perspective. China Ind. Econ. 2012, 290, 70–82. [Google Scholar]
- Fogler, H.R.; Nutt, F. A note on social responsibility and stock valuation. Acad. Manag. J. 1975, 18, 155–160. [Google Scholar] [CrossRef]
- Rockhess, J.; Schlachter, P.; Rockness, H.O. Hazardous waste disposal, corporate disclosure, and financial performance in the chemical industry. In Advances in Public Interest Accounting; Neimark, M., Ed.; JAI Press: Greenwich, UK, 1986; Volume 1, pp. 167–191. [Google Scholar]

| Standard | PIIq ≥ 0.1 | 0.01 ≤ PIIq < 0.1 | PIIq < 0.01 |
|---|---|---|---|
| Classification | Heavily polluted industries | Moderately polluted industries | Lightly polluted industries |
| Variables | Definition and Unit of Variable | Abbreviation | Hypothesis |
|---|---|---|---|
| Openness degree | Percentage of industrial export value (%) | EV | Positive |
| Industry scale | Percentage of industrial investment in fixed assets (%) | IFA | Positive |
| Energy structure | Percentage of industrial coal consumption (%) | CC | Negative |
| Technology development level | Percentage of industrial invention patents (%) | IP | Positive |
| Profitability | Ratio of total profits to revenue from principle business (%) | PTR | Positive |
| Classification | Industry | 2006 | 2007 | 2008 | 2009 | 2010 | 2011 |
|---|---|---|---|---|---|---|---|
| Heavily Polluted Industries | Processing of Timbers, Manufacture of Wood, Bamboo, Rattan, Palm, Straw | 0.21 | 0.23 | 0.24 | 0.29 | 0.36 | 0.41 |
| Manufacture of Paper and Paper Products | 0.16 | 0.18 | 0.18 | 0.17 | 0.18 | 0.18 | |
| Manufacture of Chemical Raw Material and Chemical Products | 0.18 | 0.19 | 0.20 | 0.19 | 0.21 | 0.24 | |
| Manufacture of Non-metallic Mineral Products | 0.13 | 0.15 | 0.15 | 0.15 | 0.17 | 0.18 | |
| Manufacture and Processing of Ferrous Metals | 0.19 | 0.21 | 0.25 | 0.22 | 0.24 | 0.26 | |
| Manufacture and Processing of Non-ferrous Metals | 0.24 | 0.26 | 0.24 | 0.21 | 0.24 | 0.29 | |
| Moderately Polluted Industries | Processing of Food from Agricultural Products | 0.55 | 0.61 | 0.89 | 0.83 | 0.93 | 1.00 |
| Manufacture of Foods | 0.31 | 0.35 | 0.43 | 0.40 | 0.43 | 0.58 | |
| Manufacture of Beverage | 0.20 | 0.21 | 0.22 | 0.24 | 0.24 | 0.29 | |
| Manufacture of Textile | 0.23 | 0.24 | 0.26 | 0.25 | 0.32 | 0.42 | |
| Manufacture of Furniture | 0.37 | 0.35 | 0.43 | 0.51 | 0.71 | 0.66 | |
| Processing of Petroleum, Coking, Processing of Nucleus Fuel | 1.00 | 0.93 | 0.91 | 0.72 | 1.00 | 1.00 | |
| Manufacture of Medicines | 0.17 | 0.19 | 0.21 | 0.22 | 0.23 | 0.24 | |
| Manufacture of Chemical Fiber | 0.24 | 0.28 | 0.25 | 0.22 | 0.26 | 0.36 | |
| Manufacture of Rubber | 0.21 | 0.23 | 0.23 | 0.26 | 0.30 | 0.33 | |
| Manufacture of Plastic | 0.23 | 0.26 | 0.26 | 0.28 | 0.31 | 0.40 | |
| Manufacture of Metal Products | 0.31 | 0.31 | 0.34 | 0.28 | 0.34 | 0.30 | |
| Manufacture of General Purpose Machinery | 0.24 | 0.26 | 0.25 | 0.24 | 0.26 | 0.38 | |
| Manufacture of Special Purpose Machinery | 0.23 | 0.27 | 0.32 | 0.21 | 0.26 | 0.27 | |
| Manufacture of Transport Equipment | 0.28 | 0.30 | 0.32 | 0.39 | 0.46 | 0.43 | |
| Manufacture of Measuring Instrument, Machinery for Cultural and Office Work | 0.48 | 0.50 | 0.46 | 0.38 | 0.42 | 1.00 | |
| Lightly Polluted Industries | Manufacture of Tobacco | 0.46 | 0.55 | 0.62 | 1.00 | 1.00 | 1.00 |
| Manufacture of Textile Wearing Apparel, Footware and Caps | 0.50 | 0.67 | 0.59 | 0.69 | 1.00 | 0.69 | |
| Manufacture of Leather, Fur, Feather and Its Products | 1.00 | 1.00 | 1.00 | 0.67 | 1.00 | 1.00 | |
| Printing, Reproduction of Recording Media | 0.40 | 0.28 | 0.27 | 0.25 | 0.28 | 0.24 | |
| Manufacture of Articles for Culture, Education and Sport Activity | 1.00 | 0.80 | 1.00 | 0.44 | 0.68 | 0.46 | |
| Manufacture of Electrical Machinery and Equipment | 0.74 | 0.83 | 0.81 | 0.80 | 1.00 | 0.94 | |
| Manufacture of Communication, Computer, Other Electronic Equipment | 0.93 | 1.00 | 1.00 | 0.79 | 0.68 | 1.00 | |
| Manufacture of Artwork, Other Manufacture | 0.26 | 0.37 | 0.52 | 0.55 | 0.67 | 0.56 |
| Classification | Industry | 2006 | 2007 | 2008 | 2009 | 2010 | 2011 |
|---|---|---|---|---|---|---|---|
| Heavily Polluted Industries | Processing of Timbers, Manufacture of Wood, Bamboo, Rattan, Palm, Straw | 0.34 | 0.38 | 0.38 | 0.44 | 0.51 | 0.60 |
| Manufacture of Paper and Paper Products | 0.27 | 0.30 | 0.29 | 0.28 | 0.30 | 0.31 | |
| Manufacture of Chemical Raw Material and Chemical Products | 0.26 | 0.28 | 0.30 | 0.29 | 0.34 | 0.38 | |
| Manufacture of Non-metallic Mineral Products | 0.21 | 0.24 | 0.24 | 0.25 | 0.27 | 0.30 | |
| Manufacture and Processing of Ferrous Metals | 0.29 | 0.32 | 0.38 | 0.34 | 0.37 | 0.42 | |
| Manufacture and Processing of Non-ferrous Metals | 0.38 | 0.41 | 0.39 | 0.35 | 0.40 | 0.46 | |
| Moderately Polluted Industries | Processing of Food from Agricultural Products | 0.63 | 0.71 | 0.88 | 0.87 | 0.97 | 1.00 |
| Manufacture of Foods | 0.44 | 0.48 | 0.58 | 0.58 | 0.61 | 0.67 | |
| Manufacture of Beverage | 0.32 | 0.34 | 0.34 | 0.37 | 0.38 | 0.43 | |
| Manufacture of Textile | 0.36 | 0.37 | 0.37 | 0.37 | 0.43 | 0.52 | |
| Manufacture of Furniture | 0.56 | 0.52 | 0.60 | 0.58 | 0.74 | 0.81 | |
| Processing of Petroleum , Coking, Processing of Nucleus Fuel | 1.00 | 0.98 | 0.93 | 0.87 | 1.00 | 1.00 | |
| Manufacture of Medicines | 0.25 | 0.28 | 0.31 | 0.32 | 0.33 | 0.36 | |
| Manufacture of Chemical Fiber | 0.39 | 0.43 | 0.40 | 0.37 | 0.41 | 0.51 | |
| Manufacture of Rubber | 0.33 | 0.34 | 0.34 | 0.38 | 0.41 | 0.50 | |
| Manufacture of Plastic | 0.33 | 0.39 | 0.37 | 0.37 | 0.39 | 0.44 | |
| Manufacture of Metal Products | 0.41 | 0.43 | 0.45 | 0.39 | 0.43 | 0.47 | |
| Manufacture of General Purpose Machinery | 0.32 | 0.33 | 0.34 | 0.32 | 0.35 | 0.37 | |
| Manufacture of Special Purpose Machinery | 0.30 | 0.30 | 0.32 | 0.32 | 0.35 | 0.37 | |
| Manufacture of Transport Equipment | 0.38 | 0.41 | 0.42 | 0.45 | 0.50 | 0.51 | |
| Manufacture of Measuring Instrument, Machinery for Cultural and Office Work | 0.69 | 0.72 | 0.66 | 0.52 | 0.54 | 0.54 | |
| Lightly Polluted Industries | Manufacture of Tobacco | 0.58 | 0.68 | 0.75 | 1.00 | 1.00 | 1.00 |
| Manufacture of Textile Wearing Apparel, Footware and Caps | 0.51 | 0.59 | 0.60 | 0.63 | 0.64 | 0.77 | |
| Manufacture of Leather, Fur, Feather and Its Products | 1.00 | 0.99 | 1.00 | 0.86 | 0.93 | 1.00 | |
| Printing, Reproduction of Recording Media | 0.32 | 0.30 | 0.31 | 0.31 | 0.31 | 0.33 | |
| Manufacture of Articles for Culture, Education and Sport Activity | 0.48 | 0.50 | 0.49 | 0.45 | 0.53 | 0.59 | |
| Manufacture of Electrical Machinery and Equipment | 0.53 | 0.62 | 0.65 | 0.60 | 0.62 | 0.62 | |
| Manufacture of Communication, Computer, Other Electronic Equipment | 0.97 | 1.00 | 1.00 | 0.90 | 0.89 | 1.00 | |
| Manufacture of Artwork, Other Manufacture | 0.33 | 0.37 | 0.43 | 0.42 | 0.48 | 0.57 |
| Variables | All | Lightly Polluted Industries | Moderately Polluted Industries | Heavily Polluted Industries | ||||
|---|---|---|---|---|---|---|---|---|
| Cons | 0.51 *** (16.69) | 0.56 *** (9.32) | 0.68 *** (12.03) | 0.66 *** (6.79) | 0.34 *** (9.85) | 0.36 *** (6.87) | 0.25 *** (15.07) | 0.27 *** (7.89) |
| EV | 1.52 *** (6.20) | 1.91 * (2.04) | 0.14 (0.40) | 0.54 (0.47) | −0.16 (−0.10) | 0.31 (0.20) | 2.37 ** (2.19) | 1.43 (1.13) |
| IFA | −3.59 *** (−4.70) | −3.60 *** (−4.07) | 4.60 ** (1.78) | 4.97 * (1.80) | 0.11 (0.09) | 1.65 (1.20) | −0.78 *** (−2.02) | −1.28 ** (−2.49) |
| CC | 0.56 * (1.81) | 0.39 (1.18) | −49.99 * (−1.84) | −51.10 * (−1.87) | 2.35 *** (7.29) | 2.15 *** (6.59) | −0.22 (−1.48) | −0.14 (−0.90) |
| IP | −0.52 (−0.55) | −0.44 (−0.36) | −2.70 ** (−2.24) | 1.19 (1.33) | ||||
| PTR | −0.80 (−1.14) | 0.20 (0.21) | −0.34 (−0.57) | −0.28 (−0.68) | ||||
| N | 174 | 174 | 48 | 48 | 90 | 90 | 36 | 36 |
| Group | 29 | 29 | 8 | 8 | 15 | 15 | 6 | 6 |
© 2016 by the authors; licensee MDPI, Basel, Switzerland. This article is an open access article distributed under the terms and conditions of the Creative Commons Attribution (CC-BY) license (http://creativecommons.org/licenses/by/4.0/).
Share and Cite
Wang, X.; Han, L.; Yin, L. Environmental Efficiency and Its Determinants for Manufacturing in China. Sustainability 2017, 9, 47. https://doi.org/10.3390/su9010047
Wang X, Han L, Yin L. Environmental Efficiency and Its Determinants for Manufacturing in China. Sustainability. 2017; 9(1):47. https://doi.org/10.3390/su9010047
Chicago/Turabian StyleWang, Xu, Liyan Han, and Libo Yin. 2017. "Environmental Efficiency and Its Determinants for Manufacturing in China" Sustainability 9, no. 1: 47. https://doi.org/10.3390/su9010047
APA StyleWang, X., Han, L., & Yin, L. (2017). Environmental Efficiency and Its Determinants for Manufacturing in China. Sustainability, 9(1), 47. https://doi.org/10.3390/su9010047