Article

Spatial Configuration of Energy Consumption and Carbon Emissions of Shanghai, and Our Policy Suggestions

1
Fudan University Energy Research Center, School of Social Development and Public Policy, Fudan University, Shanghai 200433, China
2
Shanghai Academy of Fine Arts, Shanghai University, Shanghai 200444, China
3
School of Architecture, Tsinghua University, Beijing 100084, China
*
Authors to whom correspondence should be addressed.
These authors contributed equally to this work.
Sustainability 2017, 9(1), 104; https://doi.org/10.3390/su9010104
Submission received: 30 November 2016 / Revised: 28 December 2016 / Accepted: 4 January 2017 / Published: 12 January 2017
(This article belongs to the Special Issue Urban Sustainability and Planning Support Systems)

Abstract

:
This research constructs a 1 km × 1 km Shanghai energy consumption and carbon emission spatial grid through a bottom-up approach. First, we locate all energy consumption locations in Shanghai via GIS. Second, we calculate energy consumption and associated CO2 emissions by energy type, by usage type, and by facilities. Finally, we use a spatial grid to represent the energy consumption and CO2 emissions. The grid shows CO2 emissions in Shanghai are highly spatially correlated with energy types and volumes of consumption. This research also finds out that high energy consumption and carbon emission locations in Shanghai display significant spatial aggregation. In 7209 spatial energy consumption cells, the top 10 grids of emissions account for 52.8% of total CO2 emissions in Shanghai; the top 20 grids account for 64.5% and the top 50 grids account for 76.5%. The most critical point emission sources are coal-fired power plants and iron and steel plants. The most important line emission sources are the Yan’an Road and Inner Ring viaducts. The area emission sources that account for the most future-projected growth are commercial and residential natural gas. After this spatial analysis, this paper makes policy suggestions and solutions to conserve energy consumption and mitigate carbon emissions in Shanghai.

1. Introduction

Energy-related CO2 emissions account for 91% of the global anthropogenic CO2 emissions [1,2]. Urban areas take up 3% of the Earth’s land surface, but sustain over 50% of the world’s population (which will sustainably grow to 66% by 2050) [3] and 75% of energy-related CO2 emissions [4]. Thus, it seems extremely significant and urgent to constantly improve the accuracy of estimating energy consumption and related CO2 emissions in urban areas.
This research constructs a 1 km × 1 km high resolution Shanghai energy consumption and carbon emission spatial grid data product, based on the previous greenhouse gas emission inventory compilation, mainly aiming at probing into the scientific interests and policy implications for establishing high-resolution energy and carbon emission data system in megacities [4]. On the one hand, high-resolution energy-related CO2 emission grid data constitute a priori information for scientifically estimating carbon fluxes in a certain area, and thus plays an important role in the accuracy of carbon flux estimation [5]. Currently, there are many studies in the international community trying to analyze and simulate carbon cycle at global and regional scales, however, given that the global carbon cycle is easily influenced by the source and sink of carbon emissions from marine, terrestrial and other earth’s ecosystems, the work of measurement, reporting and verifying (MRV) of true emissions is very difficult [6]. Carbon cycle study at a smaller scale (urban scale) may be easier to reveal the correlation between anthropogenic carbon emissions and the climate change [7]. Urban areas constitute the most concentrated area for anthropogenic CO2 emissions. So, estimating carbon fluxes in urban areas can minimize the effects of the source and sink of carbon emissions in the Earth’s ecosystems on the regional carbon cycle. On the other hand, urban areas are the leaders and drivers in human society to reduce anthropogenic CO2 emissions [8]. Now many cities have made energy-saving and emission-reducing policies, such as establishing the C40 cities climate leadership group to promote CO2 emission reduction in urban areas [9]. Among the others, how to scientifically and independently evaluate the effects of policies on emission-reducing becomes the most important challenge for policy-makers [6]. Therefore, it is of great significance to provide more detailed urban carbon emission data with independent MRV process, for those policy makers to evaluate the carbon emission reductions resulted from policy implementation.
Now there are plenty of researches trying to establish high-resolution carbon emission data on the scale of urban level [10]. A typical example is the Hestia Project conducted in the US, which aims at quantifying energy-related CO2 emissions at the building and street scales [11]. Currently, high-resolution carbon emission data have been established in four cities, namely Indianapolis, IN [7], Los Angeles, CA [12], Salt Lake City, UT [5] and Baltimore, MD. Other cities, like Paris, France, have established high-resolution CO2 emission data [13]. Such studies indicate that regional CO2 emission concentration trends can be more accurately predicted, by combining the bottom-up high-resolution energy-related CO2 data with atmospheric retrieval method.
After a rapid rise in 2000–2010 with an annual average growth rate (AAGR) of 7.6%, the total Shanghai energy consumption entered a stationary phase, with AAGR of 0.3% in 2010–2015. But AAGR by energy type in the same period presents comparatively obvious distinctions, e.g., petroleum 0.5%, natural gas 11.8%, imported electricity 9.8%, and primary electricity 27.7%. As for coal consumption, it peaked in 2011 at 61.42 million tons (Mt) and dropped to 47.28 Mt in 2015, with AAGR −4.9% in the five years. Thereafter, Shanghai energy consumption and carbon emissions step into a controllable stage. In order to enhance the comparability and make policy performance clear, we take 2010 as the benchmark year and initial year, and construct a 1 km × 1 km Shanghai energy consumption and carbon emission spatial grid database.
Many researchers have studied Shanghai energy-related CO2 emissions issues from various perspectives [14,15,16], but most of these studies estimate the energy-related CO2 emissions based on energy statistic data, which are too ambiguous and lack any spatial information. Cai et al. established high-resolution spatial distribution data of Shanghai CO2 emissions based on the general pollutant investigation data [17]. However, considering that the energy data contained in the general pollutant investigation are rather limited, and population distribution data are widely used as a proxy system to disaggregate emissions, the spatial distribution status of Shanghai energy-related CO2 emissions thus cannot be well reflected.
This research selects Shanghai as a case study mainly for four reasons. First, Shanghai constitutes one of the uppermost megacities, occupying 6340 square kilometers and accommodating 24.26 million populations (in 2015), with great influence and representativeness. Second, compared to the frequently questioned national energy statistic data [18,19,20,21,22], Shanghai energy statistic data are deemed to have better continuity, accuracy and transparency, which guarantees the higher data quality when taking Shanghai as an analysis case for energy and carbon emission spatial configuration in megacities. Third, Shanghai intends to build into a global city and specifically put forward its goal for carbon emissions control in the Shanghai City Master Plan (2016–2040) [23], in which carbon emissions of the whole city and per capita will peak around 2025 and then total carbon emission will mitigate around 15% compared to the peak by 2040. Under such circumstance, high-resolution carbon emission data facilitates policy makers to set targeted energy-reducing policies. Last, China is now establishing a space-air-ground integrative monitor system for CO2 concentration [24]. Combining high-resolution energy-related CO2 emission data with the atmospheric transmission mode and satellite monitoring data constitutes a key method of verifying CO2 flux in the future. While high-resolution CO2 emission data constitutes key a priori information for a space-air-ground CO2 monitor system.
This paper includes the following three parts. The first part is about research method and data gridding, briefing the estimation method for energy-related CO2 emission and the basic data source, systematically elaborating the gridding method for 2010 Shanghai energy consumption and carbon emission data as well as the achievement. The second part analyzes Shanghai energy consumption and CO2 emission spatial configuration, by energy type, by usage type, and by facilities. The last part is to pointedly propose the policy suggestions and solutions, and to prospect the priorities and output during the next step work.

2. Materials and Methods

2.1. Estimation Method for Energy Related CO2 Emissions

Estimation method for energy-related CO2 emissions is mainly derived from the classical material balance method, i.e., to estimate CO2 emissions based on activity data of various energy and carbon emission factors, which is particularly expressed as:
E = g A D i , j , g × E F i , j , g × R
where E is CO2 emissions; AD represents activity data; i represents energy of various types; j represents various facilities using various energy types; g represents various grids; EF represents carbon emission factors; and R represents carbon oxidation rate, which is set as 1 in this research.
In the estimation, the energy types (i) mainly include four types: coal, oil, natural gas and imported electricity. On the basis of various facilities (j), coal can be further divided into eight types: coal for electricity, coal for heating, coking coal, pulverized coal used for injection (PCI), feed coal, lump coal, steam coal used in other industries, and coke; oil divided into seven types: gasoline, diesel, fuel oil, kerosene, liquid petroleum gas (LPG), refinery gas, and other petroleum products; and natural gas divided into two types: natural gas for electricity and natural gas for other uses. The heating values and carbon emission factors are different even for the same type of energy used in various facilities. See Table 1 for more details.
Energy activity data mainly come from Shanghai Statistical Yearbook on Energy [25], energy management agencies such as Shanghai municipal Development and Reform Commission (SDRC), Shanghai Municipal Commission of Economy and Information technology (SEIT), and Fudan University Energy Flow and Potential Carbon Emission Factor Database [27]. Given that the uncertainty of oil and natural gas emission factors is very small, the default value recommended by the Intergovernmental Panel on Climate Change (IPCC) shall be applied herein. However, since the uncertainty of coal-related carbon emission factors are relatively large, this research adopts coal-related carbon emission factors that are calculated based on data of inner-core coal quality such as whole moisture (Mt), ash content of dry coal (Ad) and carbon content of dry and ash-free coal (Cdaf) that conform more to the coal utilization features in China [27,28].

2.2. Method of Gridding of Energy Consumption and Carbon Emissions Data

We develop a 1 km × 1 km Shanghai energy consumption and carbon emissions spatial grid database through a bottom-up approach. First of all, it locates all energy consumption facilities’ locations in Shanghai by means of GIS. It then calculates energy consumption and associated CO2 emissions by energy type, by usage, and by facilities. As last, grids are generated based on energy consumption and associated CO2 emissions. Spatial configuration mainly contains three elements, which are point emission sources, line emission sources and diffusion emission sources. See Figure 1 for more details.

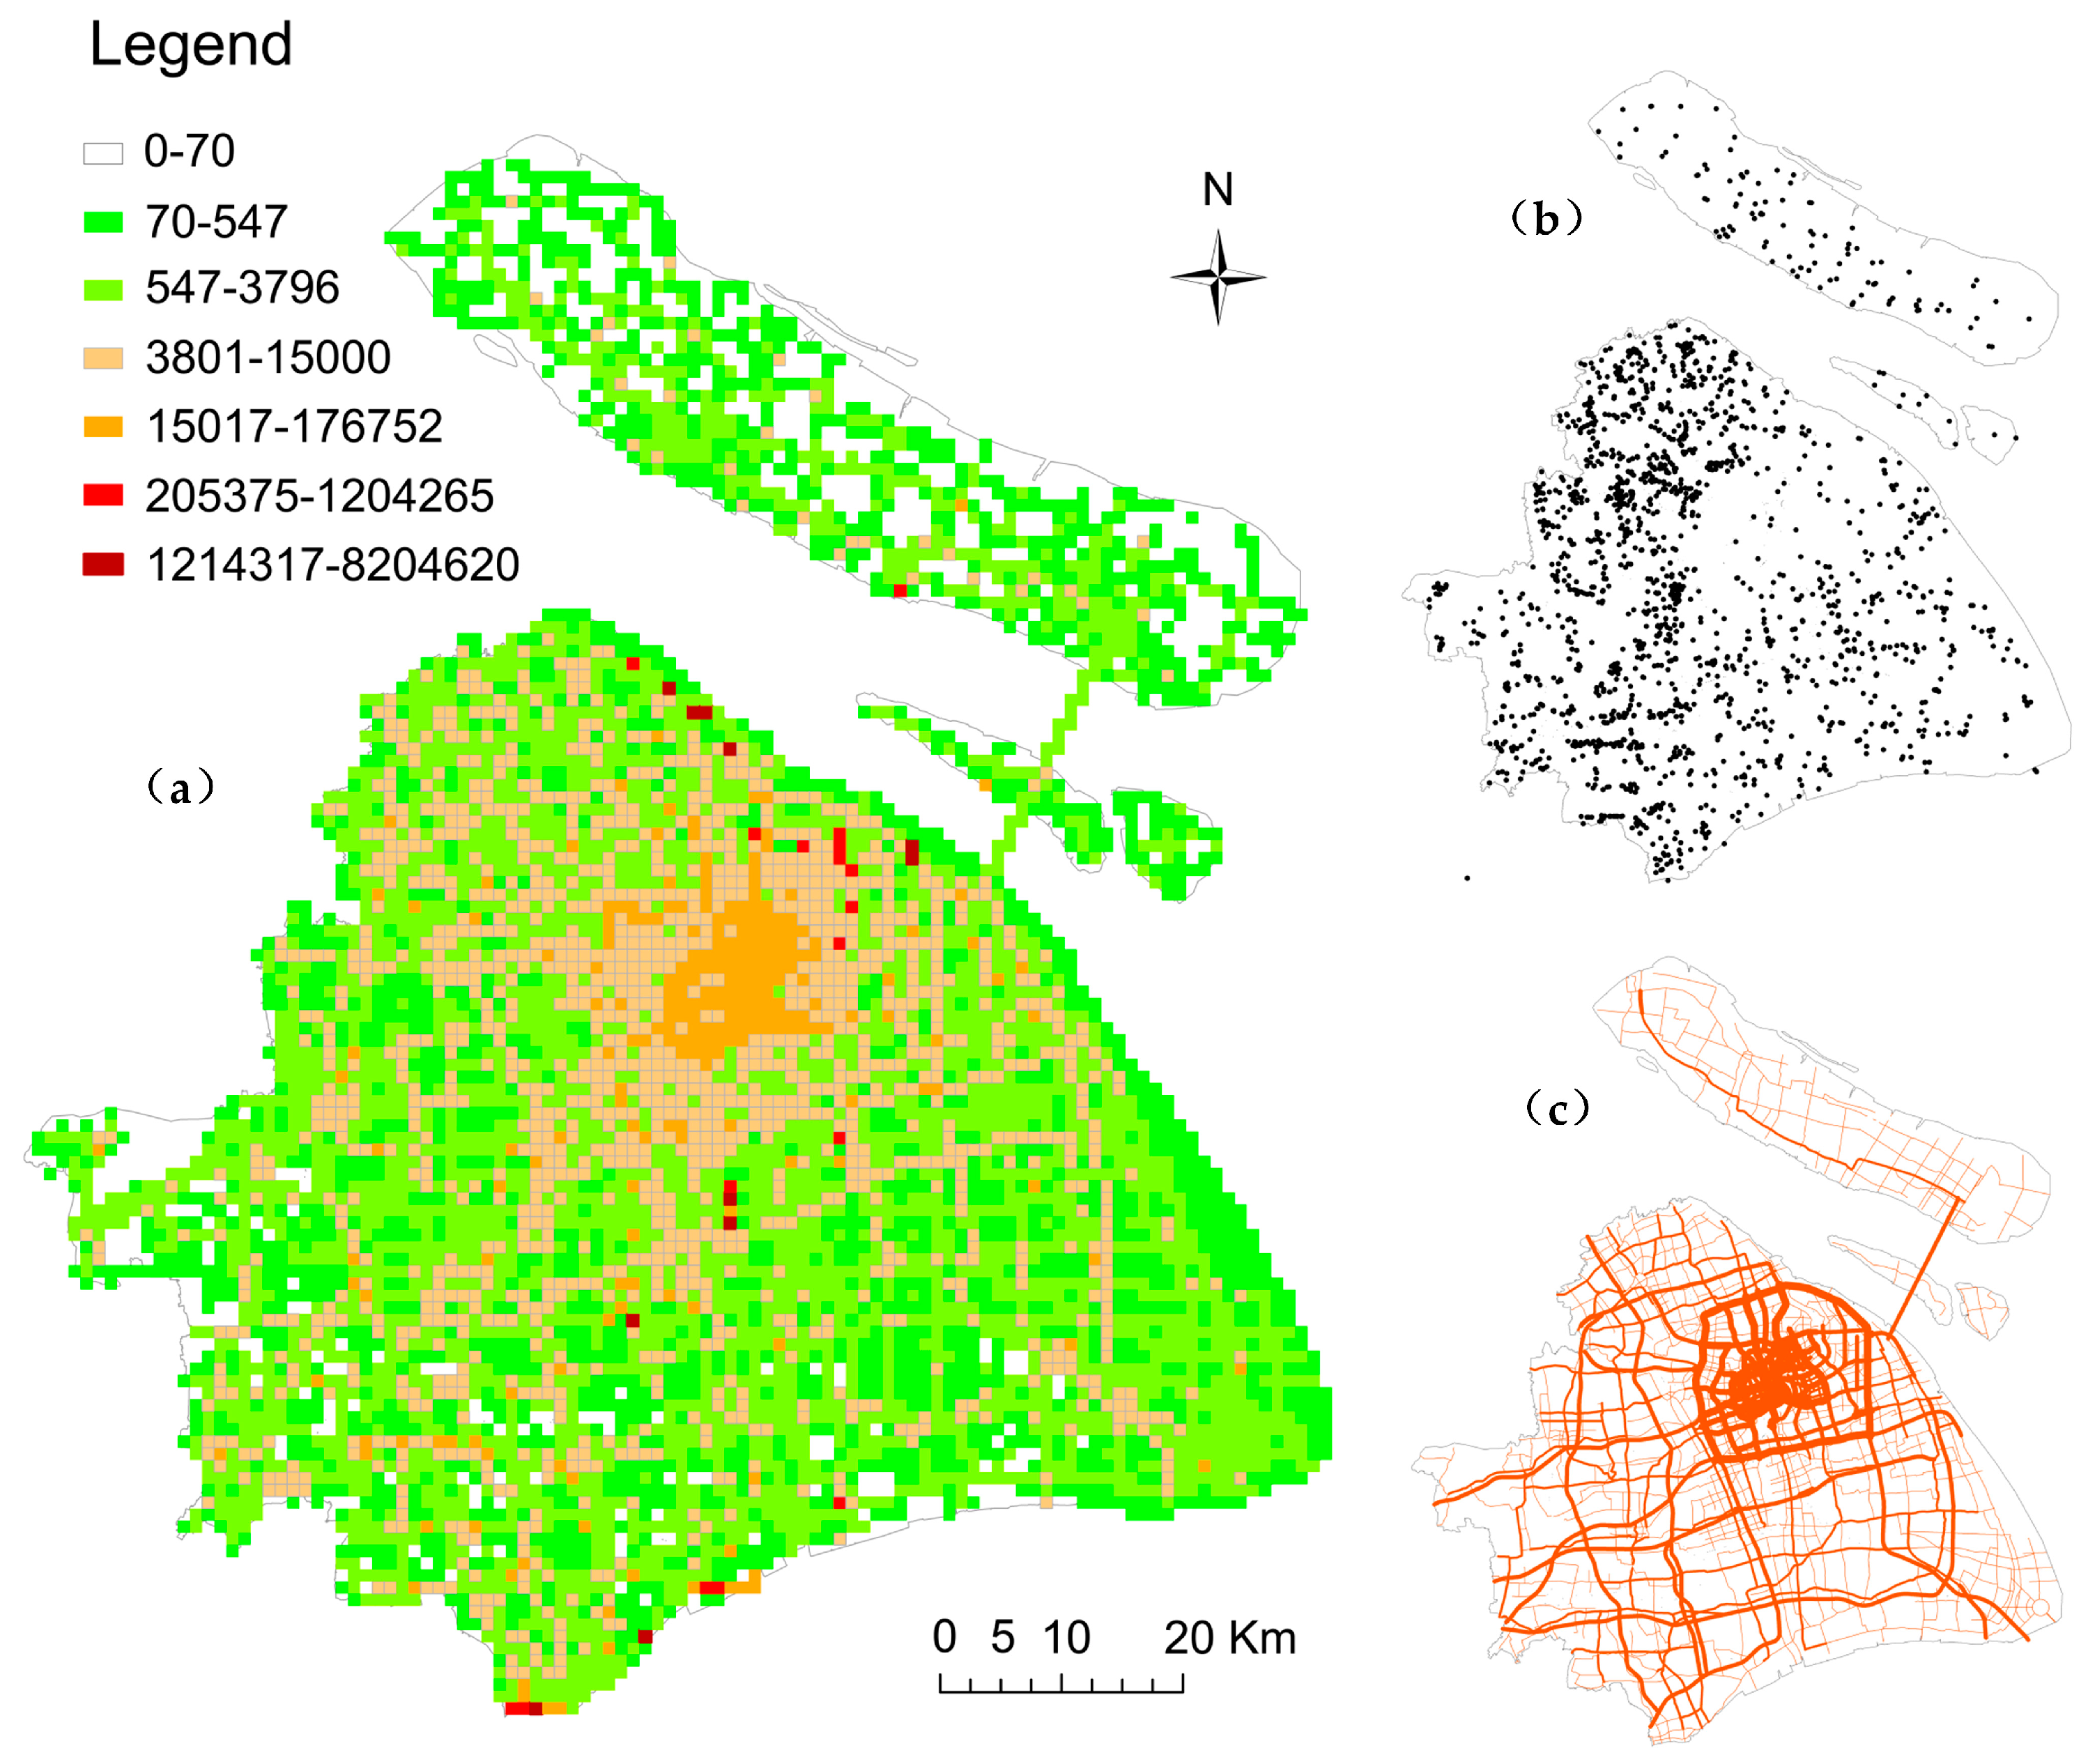
2.2.1. Point Emission Sources

Point source data means energy consumption and carbon emissions with specific longitude and latitude locations within Shanghai. In 2010, Shanghai point sources for energy consumption and carbon emissions cover 26 power plants, which are further divided into 20 coal-fired power plants, four gas-fired power plants and two oil-fired power plants; eight centralized heating enterprises; four iron and steel production sets; seven chemical enterprises and chemical industry parks; three gas plants and over 3000 middle and small coal-fired boilers. In addition to the above point sources, other energy and emission data that specific locations cannot be identified will be disaggregated in the area source data.

2.2.2. Line Sources

Line source data means traffic line emission sources bearing traffic oil consumption and associated CO2 emissions, including on-road transportation, waterway transportation and air transportation. This research mainly focuses on oil consumed by on-road transportation and associated CO2 emissions. Other relevant data related to waterway transportation and air transportation is excluded.
Methods of estimating on-road transportation related oil consumption and associated CO2 emissions are usually divided into “bottom-up” and “top-down” approaches. The “bottom-up” approach estimates based mainly on the parameters of vehicle types, volume, driving distance and fuel economy of vehicles. The “top-down” approach estimates based mainly on the oil consumption of transportation sector and the follow-up subdivision according to various vehicles with various oil consumption. Currently, the data of driving distance and fuel economy of various vehicles in Shanghai possesses higher uncertainty, while the oil consumption statistic data is relatively more accurate and reliable, with lower uncertainty. Hence, we apply the “top-down” approach to estimate on-road transportation related energy consumption and total associated CO2 emissions. Then we distribute the on-road traffic energy consumption and related CO2 emissions into each grid with the consideration of traffic flow by road types in different urban regions. Specific estimating methods are shown below:
(1) To re-calculate and obtain the on-road transportation oil consumption in accordance with Shanghai energy statistic data and the division method of oil consumption sector. Shanghai energy statistic data counts oil consumption based on legal entities, instead of ultimate utilization. Hence, in Shanghai Statistical Yearbook on Energy, oil consumed by the “traffic, transportation and storage” sector only include oil consumed by the public transportation sector, excluding oil consumed by the private traffic sector. To reveal the actual traffic oil consumption, oil consumed by other sectors will be disassembled and incorporated into the transport sector. Given the China oil statistical system and Shanghai’s oil consumption features, and considering pertinent literature and empirical data from statisticians, oil consumed by on-road transportation is disassembled in the following methods and principles: (a) all of the oil consumed by the transportation, storage and mail industries are subsumed into oil consumption of the transport sector; (b) all of the oil consumed by the residents is subsumed into oil consumption of the transport sector; (c) all of the gasoline and half of the diesel consumed by the wholesale, retail, accommodation and catering industries are subsumed into oil consumption of the transport sector; (d) half of the gasoline and diesel consumed by the industry sector is subsumed into the oil consumption of the transport sector; (e) all of the oil consumed by the primary industry is subsumed into the oil consumption of the transport sector; (f) oil consumed by the transport sector is further disassembled into on-road traffic, waterway traffic, and air traffic, based on the features of petroleum products. The kerosene consumed by the transport sector is subsumed into the air traffic oil consumption. Fuel oil and 10% of diesel consumed by the transport sector is subsumed into the waterway traffic oil consumption; all of the rest oil consumed by the transport sector is subsumed into the on-road traffic oil consumption.
(2) To identify Shanghai’s daily turnover volume of vehicles in terms of regions and road types according to the data of Shanghai daily turnover of motor vehicles by regions, motor vehicle volumes and traffic capacity by road types, developed by Shanghai City Comprehensive Transportation Planning Institution (CCTPI), and then to disassemble the traffic oil consumption by regions and by road types according to such weights.
Among these, in the light of the Shanghai spatial configuration, the urban regions are divided into five regions, which are Puxi inside the Inner Ring viaduct (Pxii), Pudong inside the Inner Ring viaduct (Pdii), Puxi between the Inner Ring viaduct and the Outer Ring viaduct (Pxio), Pudong between the Inner Ring viaduct and the Outer Ring (Pdio), and areas outside Outer Ring viaduct (Aoo). Road types are divided into four grades, namely fast roads (including expressway), main roads, secondary main roads and local roads. See Table 2 for more detailed and ultimate confirmed proportions of Shanghai daily turnover volume of motor vehicles by various regions and by various road types.
(3) To count the length of roads of various types via GIS, and then to calculate the corresponding oil consumption based on oil consumption intensity and length of roads by various regions and various types.
(4) To add up all of the length of roads of various types in each grid, and then to calculate oil consumption of various oil types in each grid.
(5) To estimate associated CO2 emissions of on-road transportation in various grids according to the oil consumption of various oil types in each grid.

2.2.3. Area Sources

Area source data means energy consumption whose geo-spatial locations cannot be identified. Such energy consumption is usually characterized by “low-quantity and wide-area diffused”, such as energy consumed by the commercial sector, residential sector and industrial enterprises below a designated size. We make use of usage characteristics of various energy types in each area source data, taking socioeconomic data that can reflect such characteristics as a proxy system, so as to indirectly obtain the gridded energy consumption and associated CO2 emission data. The mentioned proxy system is mainly the GDP grouped by regions and by industries, Shanghai population distribution by streets, and Shanghai industrial concentration data. GDP data grouped by regions and by industries is collected from Shanghai regional annual statistical bulletins 2011 [30], population distribution by streets is from China’s sixth nationwide census data [31], and industrial concentration trend is represented by the concentration of middle and small sized boilers in each grid (see Figure 1b). See Table 3 for more detailed corresponding relationship between energy consumption and reference system.

3. Spatial Configuration Characteristics and Trends Analysis
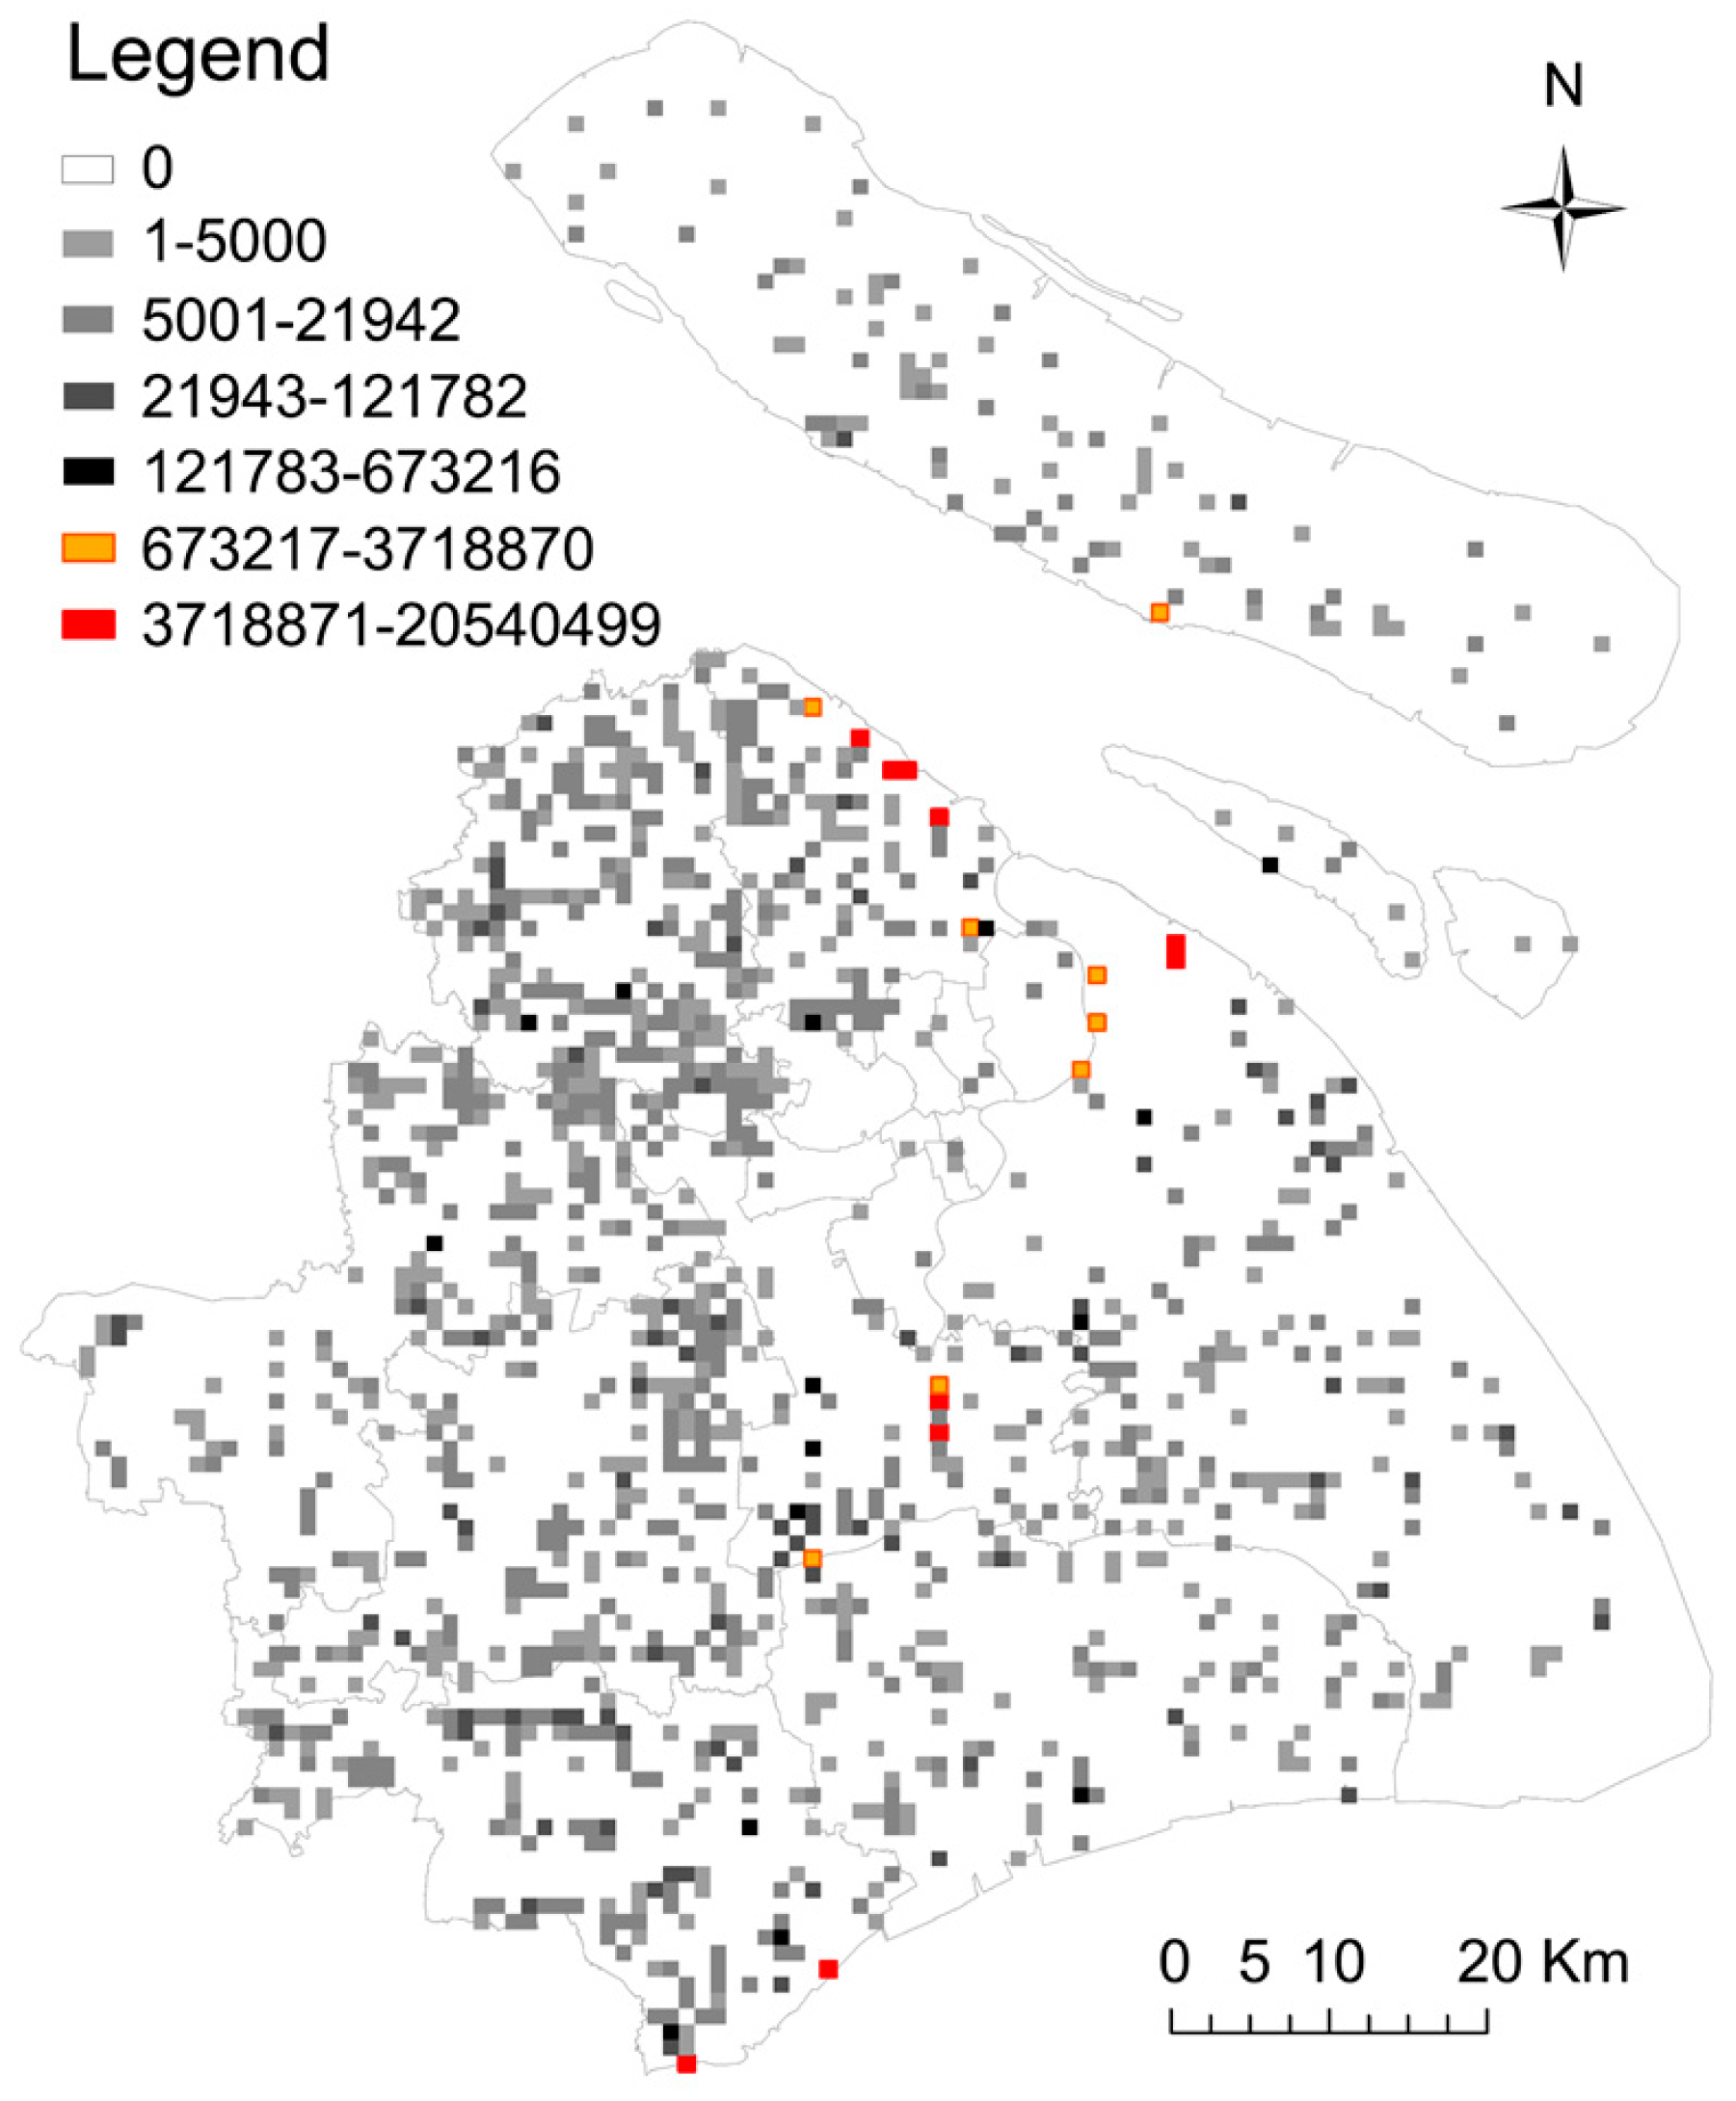
3.1. Coal

3.1.1. Main Characteristics and Coping Strategy

2010 Shanghai gridded energy consumption and carbon emission products show (Figure 1a and Figure 2) that pointed coal consumption account 93.85% of all coal consumption in Shanghai. Coal consumption is distributed in 1183 grids, accounting for 16.41% of the total grids (Figure 1b). In the gridded coal consumption data, accumulated coal consumption in the top 10 grids amount to 49.15 (Mt), accounting for 76.4% of the total coal consumption, and accumulated coal consumption in the top 20 grids amounts to 52.58 Mt, accounting for 89.5% of the total consumption. This indicates that coal consumption has very strong spatial aggregation characteristics.
By further disassembling the composition of the grid data, it reveals that the top 20 grids of coal consumption are mainly grids centralized with coal-fired power plants, and iron and steel mills. Although middle and small sized boilers have very large quantities and wide coverage, the ratio of coal use to total coal consumption is small. Therefore, the key to determine coal consumption control level in Shanghai is the coal use in coal-fired power plants, and iron and steel mills. Considering the reality of the cross-regionality of Chinese administrative jurisdictions and large enterprises, the responsibility of reducing coal use shall be assumed by the Shanghai municipal energy management departments and related central enterprises and state owned enterprises.
Comparatively speaking, county governments have larger territorial jurisdiction over those enterprises with middle-and-small-sized boilers, and thus should bear principal responsibility for the tasks of reducing coal use by middle-and-small-sized boilers.
In recent years, the control of Shanghai coal consumption mainly focuses on the shutdown or substitution of middle-and-small-sized boilers. It is anticipated that all middle-and-small-sized boilers will be shut down or replaced by clean energy by 2017 [32]. Then Shanghai coal consumption will be more highly concentrated in power plants, and iron and steel mills, which makes the spatial configuration of coal consumption more aggregated, and accordingly, the object of coal-reducing policies will be more targeted at power plants, and iron and steel mills. For example, to absolutely forbid building new coal-fired power plants, to transform and upgrade middle-and-small-sized coal-fired power plants, to enhance the external migration of large iron and steel mills, and coal chemical enterprises.

3.1.2. Trends of Shanghai Coal Consumption
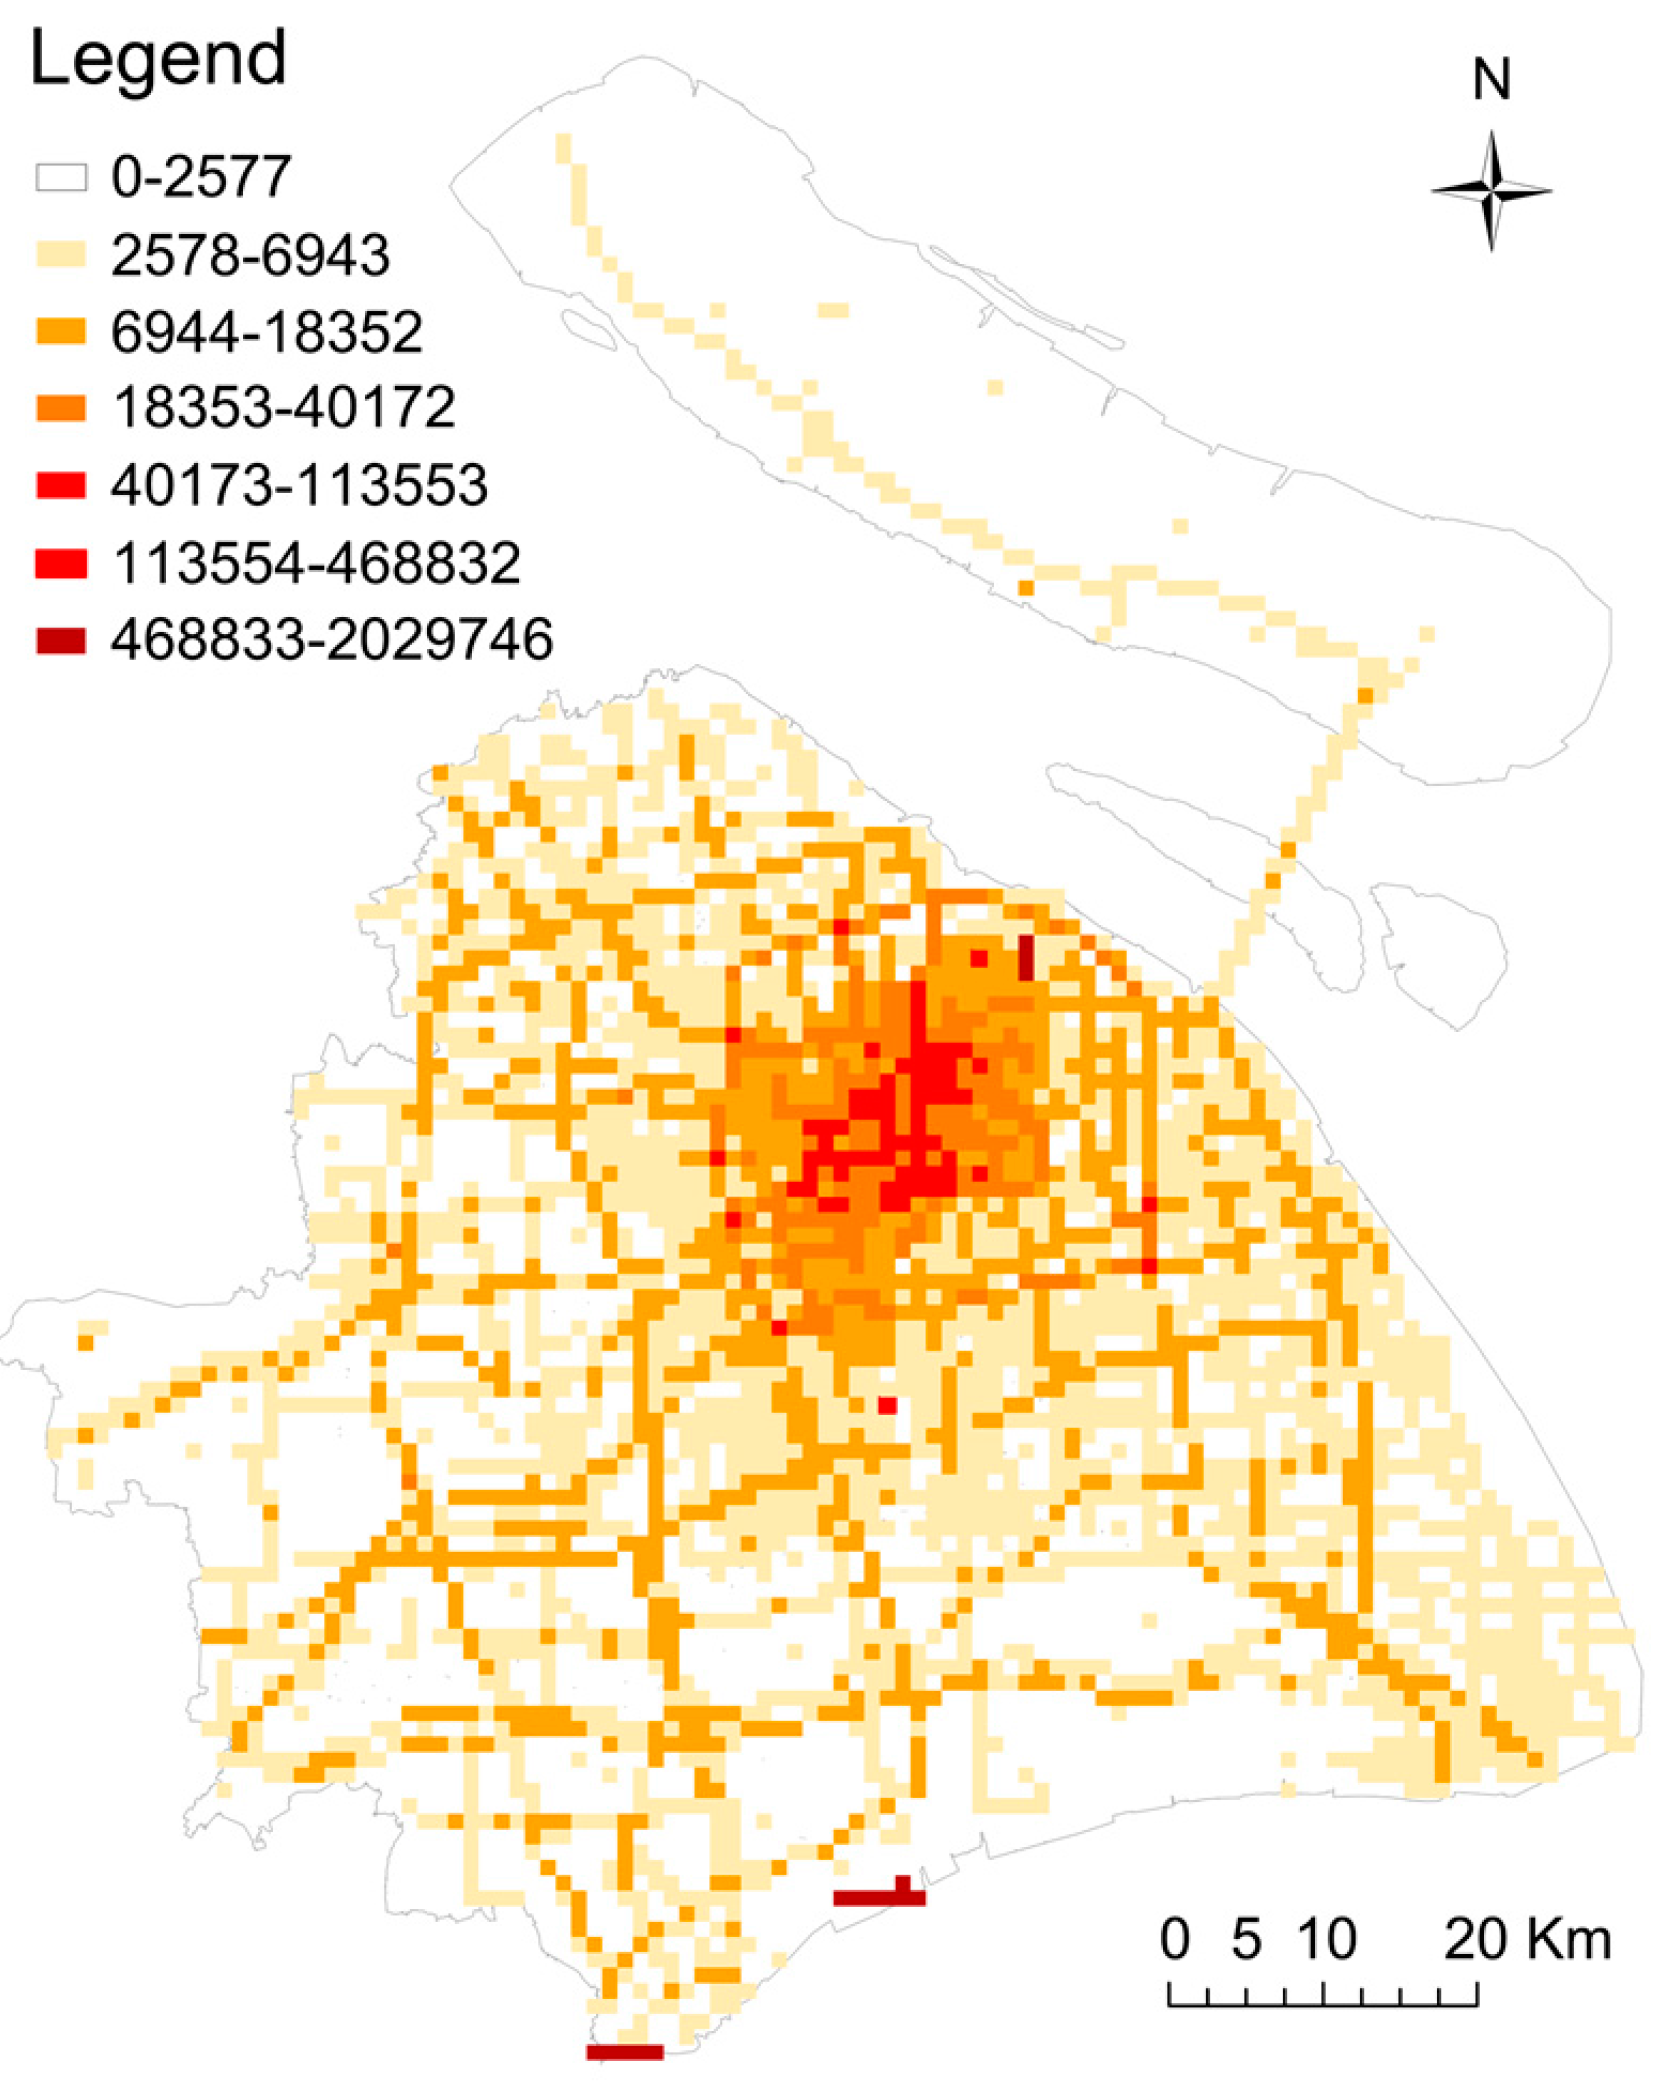
Shanghai coal consumption peaked in 2011, and then reduced gradually year by year to 47.28 Mt in 2015, with 23.1% less than the peak value, under the combined actions of the continuing slowdown of economic growth, the massive increase in imported electricity, and the well-aligned work of the shutdown and replacement of middle and small sized boilers. Among the other sectors, coal used for electricity generation reduced by 9.23 Mt, accounting for 65.2% of total coal mitigation, coal used by middle-and-small-sized boilers reduced by 2.05 Mt, accounting for 14.5% of total coal mitigation, and coking coal reduced by 1.62 Mt, accounting for 11.5% of total coal mitigation. See Table 4 for more details.
With regard to the contribution of coal to Shanghai’s total energy consumption control and CO2 emission reduction, one is the decrease of total consumption, and the other is the transformation of utilization methods. In the near future, the primary mission is to reduce coal consumed by middle-and-small-sized boilers. In the medium term, the government may focus on reducing the coal consumed by combined heat and power generation facilities, which is characterized with low efficiency and high pollution. Then for the long term, the government may implement policies to fundamentally reduce the connection between coal combustion and carbon emissions, and to completely realize coal cleaning and low-carbon utilization, while improving coal quality and enhancing coal utilization efficiency, by means of upgrading power generation technology and smelting technology. We projected the total coal consumption will decrease to 46.5 Mt by 2020 and 40.5 Mt by 2030 [32].

3.2. Oil

3.2.1. Main Characteristics of Spatial Configuration

In 2010, 34.0% of oil was consumed by waterway and air transport sector. However, so far only statistical data relating to sales volume is available, the data of oil consumed within the Shanghai domain is not yet accessible. As such, in order to decrease the uncertainty of data gridding, we do not proceed with the data gridding of oil consumed by waterway and air transport sectors. After subtracting oil used in waterway transport and aviation, Shanghai oil consumption is 21.53 Mt, in which oil consumed by industrial sector occupy the largest proportion, accounting for 55.8%, oil consumed by on-road transportation have a proportion of 34.4%, and oil consumed by commercial, residential and agricultural sectors add up to 9.8%.
(1) Key Point Sources of Shanghai Oil Consumption
Oil consumption accumulated in the top 10 grids amount to 8.52 Mt, accounting for 39.6% of oil consumption in all grids. Oil consumption accumulated in the top 20 grids amount to 8.94 Mt, accounting for 41.5% of oil consumption in all grids. Shanghai Gaoqiao Petrochemical plant, Shanghai Jinshan Petrochemical Plant, and Shanghai Chemical Industry Park constitute the key point emission sources of oil consumption in Shanghai industrial sector, adding up to 9.83 Mt of oil consumption, accounting for 81.9% of oil consumption in industrial sector. It should be noted that most of the oil consumed in the three petrochemical parks is “other petroleum products”, which is mainly used as feedstock in refining process. In this study we calculated the potential CO2 emissions emitted from refining process based on the carbon content of other petroleum products.
(2) Key Line Sources of Road Traffic Oil Consumption
The average oil consumption intensity of Shanghai on-road is 0.265 t/m, with great distinction of oil consumption intensity among different roads. The oil consumption intensity of the Puxi fast roads inside the Inner Ring viaduct in the central urban area is the highest at 8.21 t/m. As a whole, the most important line emission sources are Yan’an Road and Inner Ring viaducts. The oil consumption intensity of Puxi roads is higher than that of Pudong roads, and Puxi areas inside the Inner Ring viaduct have the maximum oil consumption intensity in Shanghai road traffic. For more details see Table 5 and Figure 1c and Figure 3.

3.2.2. Trends of Shanghai Oil Consumption
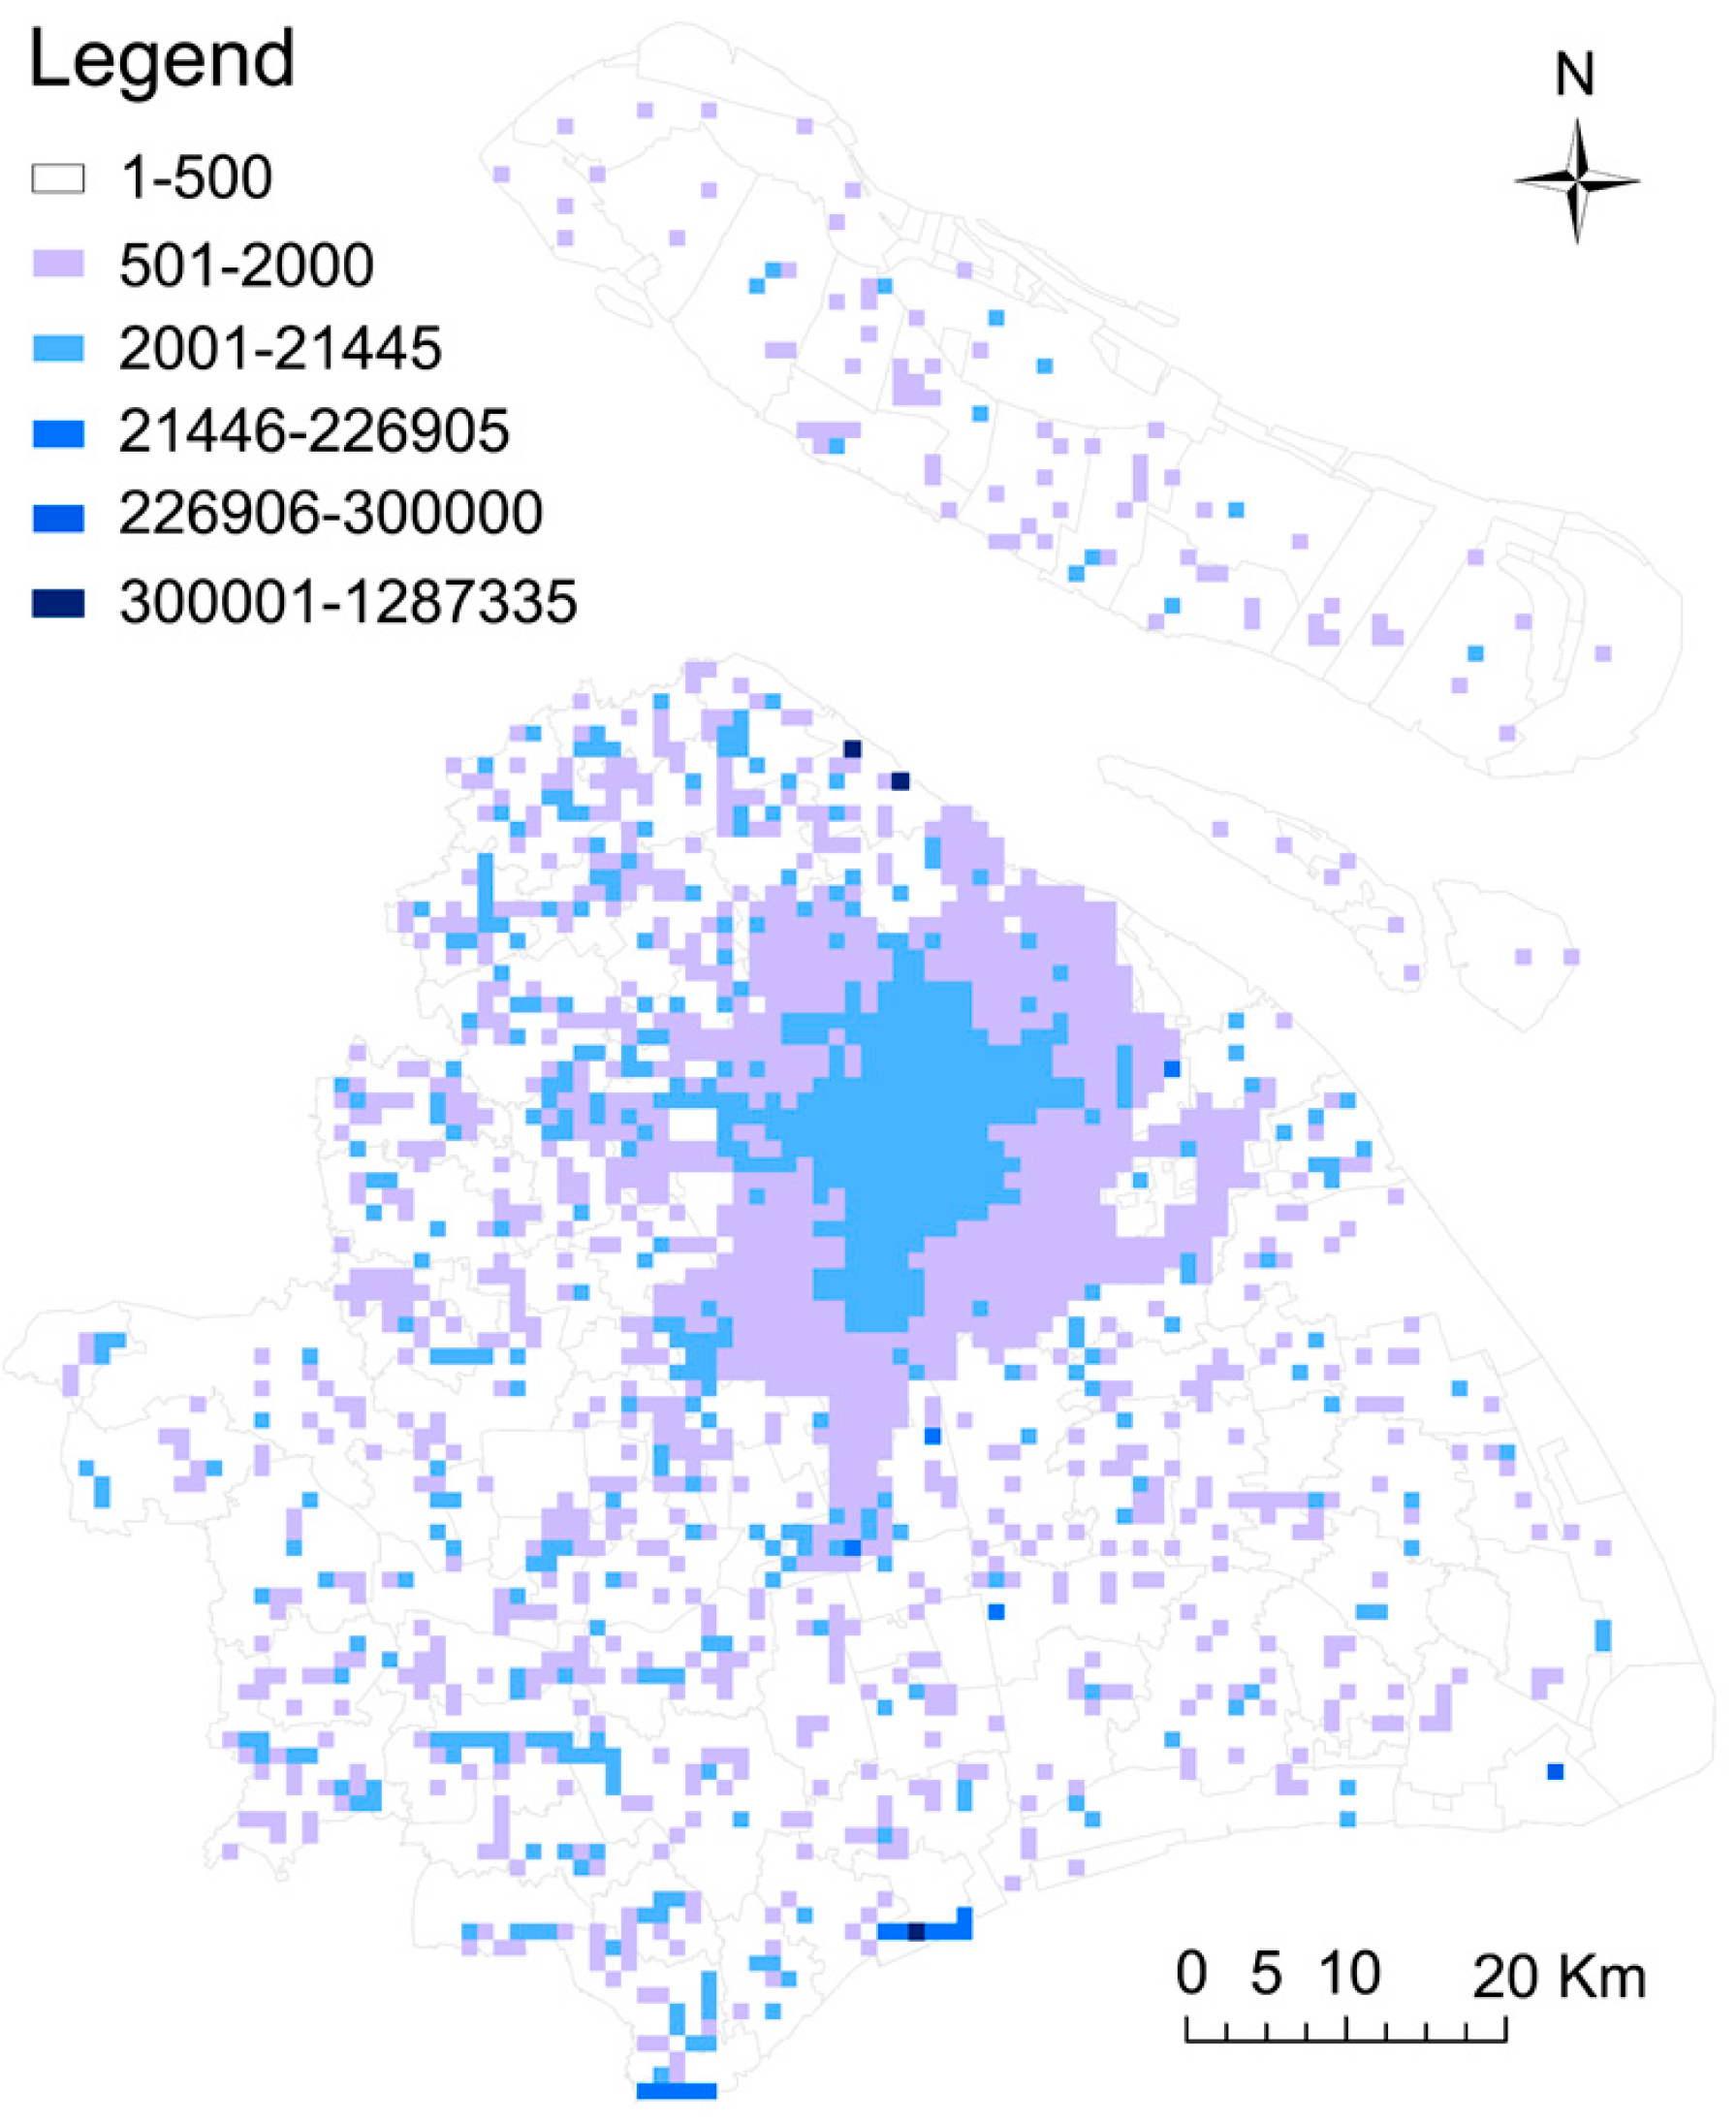
As one of the most important oil refining bases, air harbors and shipping ports, Shanghai takes on a pattern of large inflows and outflows of oil. Oil consumption is affected by many factors. The total oil consumption increased rapidly from 12.31 Mt in 2000 to 34.29 Mt in 2015, and then enters the stage with low-speed growth, probably reaching 39.70 Mt by 2020 and 39.10 Mt by 2030, respectively. During the process of advancing the Sinopec Shannghai Gaoqiao Petrochemica Co., Ltd., Caojing Refining and Chemical Integration Project, the oil refining capacity of Shanghai arises to 35 Mt, increasing the consumption of other oil products directly. We anticipate that other petroleum product consumption in Shanghai will rise to 13 Mt by 2020. Refining gas and LPG consumption will grow along with the increase of petroleum refinery distillation capacity. Aviation kerosene will also grow along with the construction of Shanghai airline center. In 2015, passenger numbers in Shanghai Pudong Airport and Shanghai Hongqiao Airport reached 99 million. It is anticipated that such numbers will arrive at 120 million by 2020 and 160 million by 2030 [33], when kerosene consumption in Shanghai will reach 6 Mt by 2020 and 7.50 Mt by 2030. Diesel and fuel oil consumption is stable with a slight decline. Gasoline consumption will peak around 2020 and then decrease due to the increase of public transit, improved fuel efficiency and development of new energy vehicles. Gasoline consumption will reach 7.50 Mt by 2020 and 6.50 Mt by 2030.

3.3. Natural Gas

3.3.1. Main Characteristics of Spatial Configuration

The total consumption of Natural gas in Shanghai in 2010 is 4.5 billion cubic meters (Bcm) [25], in which natural gas for the industrial sector accounts for 51.8%, for electricity generation accounts for 22.1%, and for commercial and in residential sector accounts for 26.1%. Point sources of Shanghai natural gas consumption mainly include four natural gas power plants, Baosteel, Shanghai Chemical Industrial Park, Jinshan petrochemical, etc. The total natural gas consumption from point sources covered in the gridded database established in this research account for 52.03% of the total natural gas consumption for the year.
Figure 4 presents the spatial distribution of natural gas related CO2 emissions for Shanghai. In all of the grids, natural gas consumption accumulated in the largest 10 grids amount to 2.41 Bcm, accounting for 53.4% of total natural gas consumption. Natural gas consumption accumulated in the largest 20 grids amount to 2.49 Bcm, accounting for 55.4% of total natural gas consumption. It indicates that the degree of natural gas’s concentration is much lower than that of coal and oil, which is mainly due to the facts that the proportion of natural gas consumed by residential sector to all natural gas consumption is largely higher than that of coal and oil consumption in the residential sector to all coal and oil consumption.

3.3.2. Trends of Shanghai Natural Gas Consumption

Shanghai natural gas consumption has experienced swift growth since 2000, particularly after the completion of West-to-East Gas Pipeline Project, growing from 0.50 Bcm in 2003 to 77.21 Bcm in 2015, with AAGR of 25.68%. We anticipate that Shanghai natural gas consumption will reach 12 Bcm by 2020 and 20.50 Bcm by 2030, respectively.

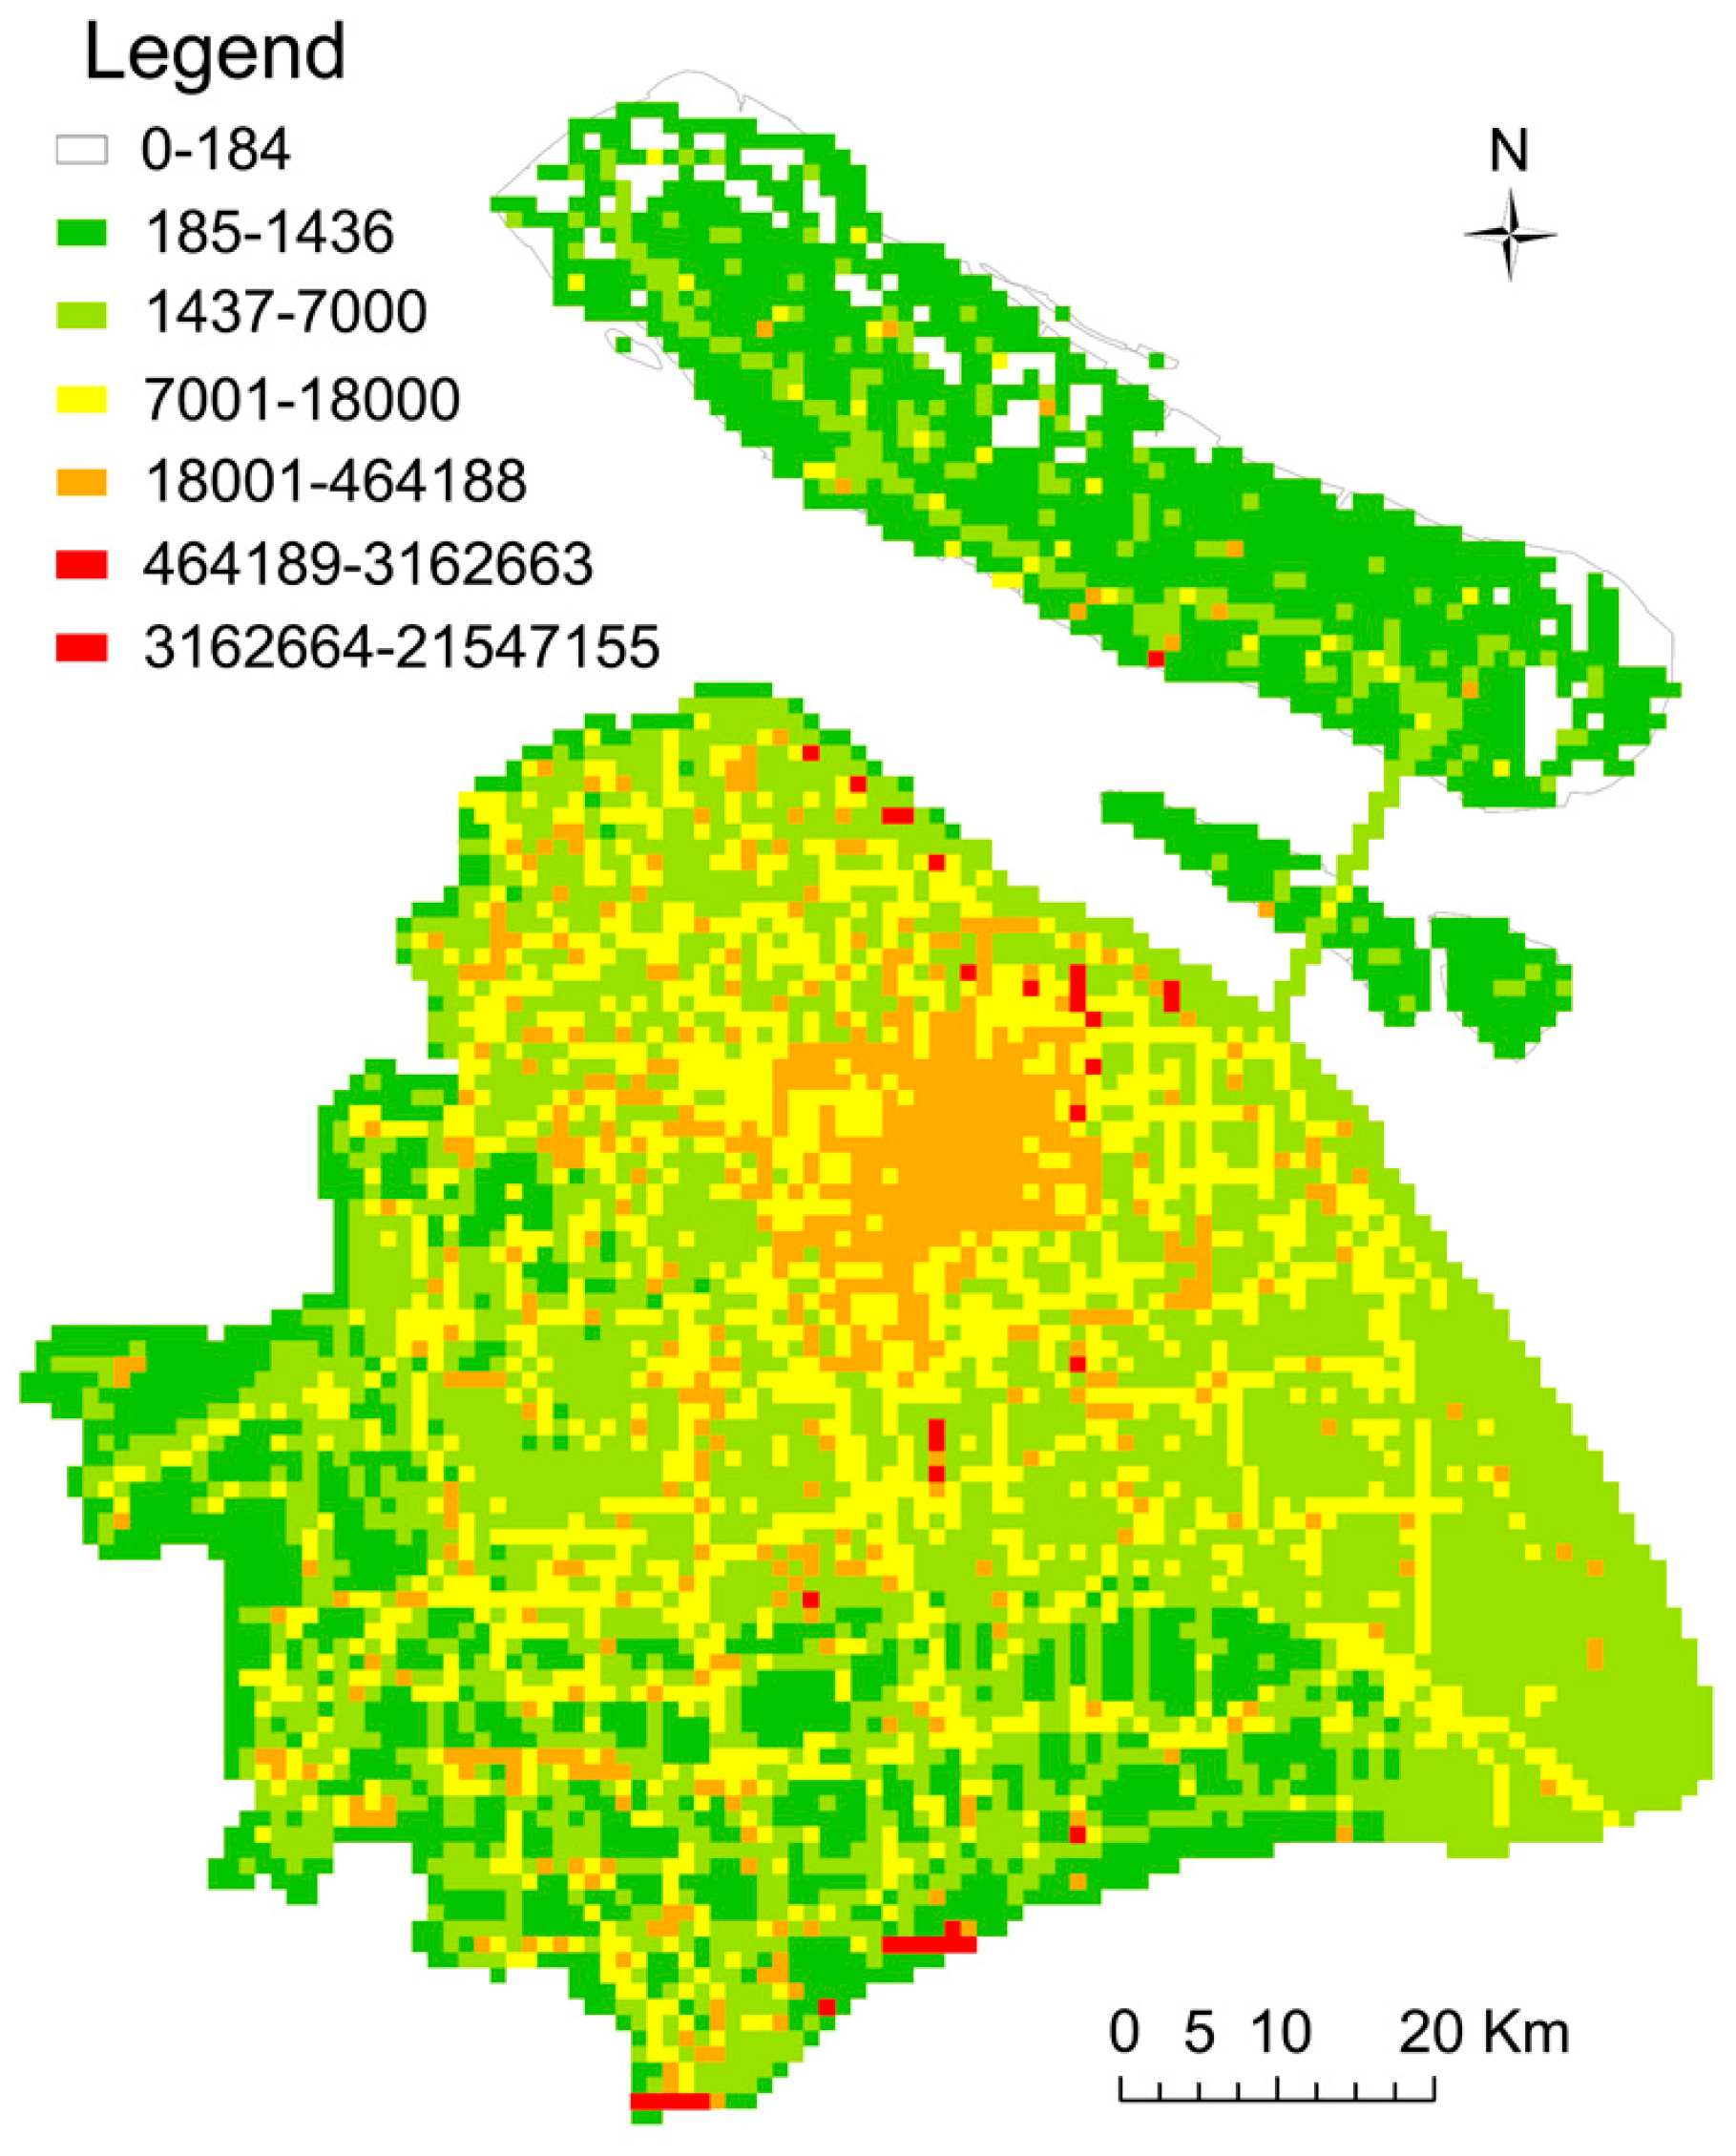
3.4. Spatial Distribution of Shanghai Total Energy Consumption and Carbon Emission

3.4.1. Main Characteristics of Spatial Configuration

Based on Shanghai Statistical Yearbook on Energy, when estimating fossil fuel CO2 emissions via “top-down” approach, the obtained Shanghai energy-related CO2 emissions in 2010 are 251.8 Mt. When estimating via a “bottom-up” approach, by point sources, by line sources and by block sources, the total energy-related CO2 emissions emitted from point sources, line sources and area sources are 204.0 Mt. The difference between the two approaches accounts for 17.1% of total emissions. There are two reasons for such a difference. First, oil consumed by waterway and air traffic is not included in the bottom-up approach, which accounts for 14.1% of total CO2 emissions estimated from top-down approach. Second, CO2 emitted from imported power are not included in Shanghai local emissions based on the principle of territory, which accounts for 3.0% of total CO2 emissions estimated from top-down approach. It should be noted that in 2010, 75.7% of electricity transferred from other provinces to Shanghai is generated by hydroelectric plants, which is considered as zero CO2 emission. See Table 6 for more details.
As shown in Figure 5, the spatial configuration of Shanghai energy-related CO2 emissions (Figure 5) highly conforms with its configuration of energy consumption (Figure 1a), mainly depending on the spatial configuration of industrial facility. The largest four coal-fired power base, three chemical industry parks and Baosteel Group constitute the major sources for Shanghai energy-related CO2 emissions. Shanghai Wujing Industry Park and Gaoqiao Chemical Industry Park are relatively close to the Shanghai central area, while other industry parks are mostly along the river or coast, far away from the city center area with large population aggregation. With the gradual adjustment of configuration of the Shanghai industrial bases, the spatial configuration of Shanghai energy-related CO2 emissions will concentrate more in the southern coastline and northern coastline.

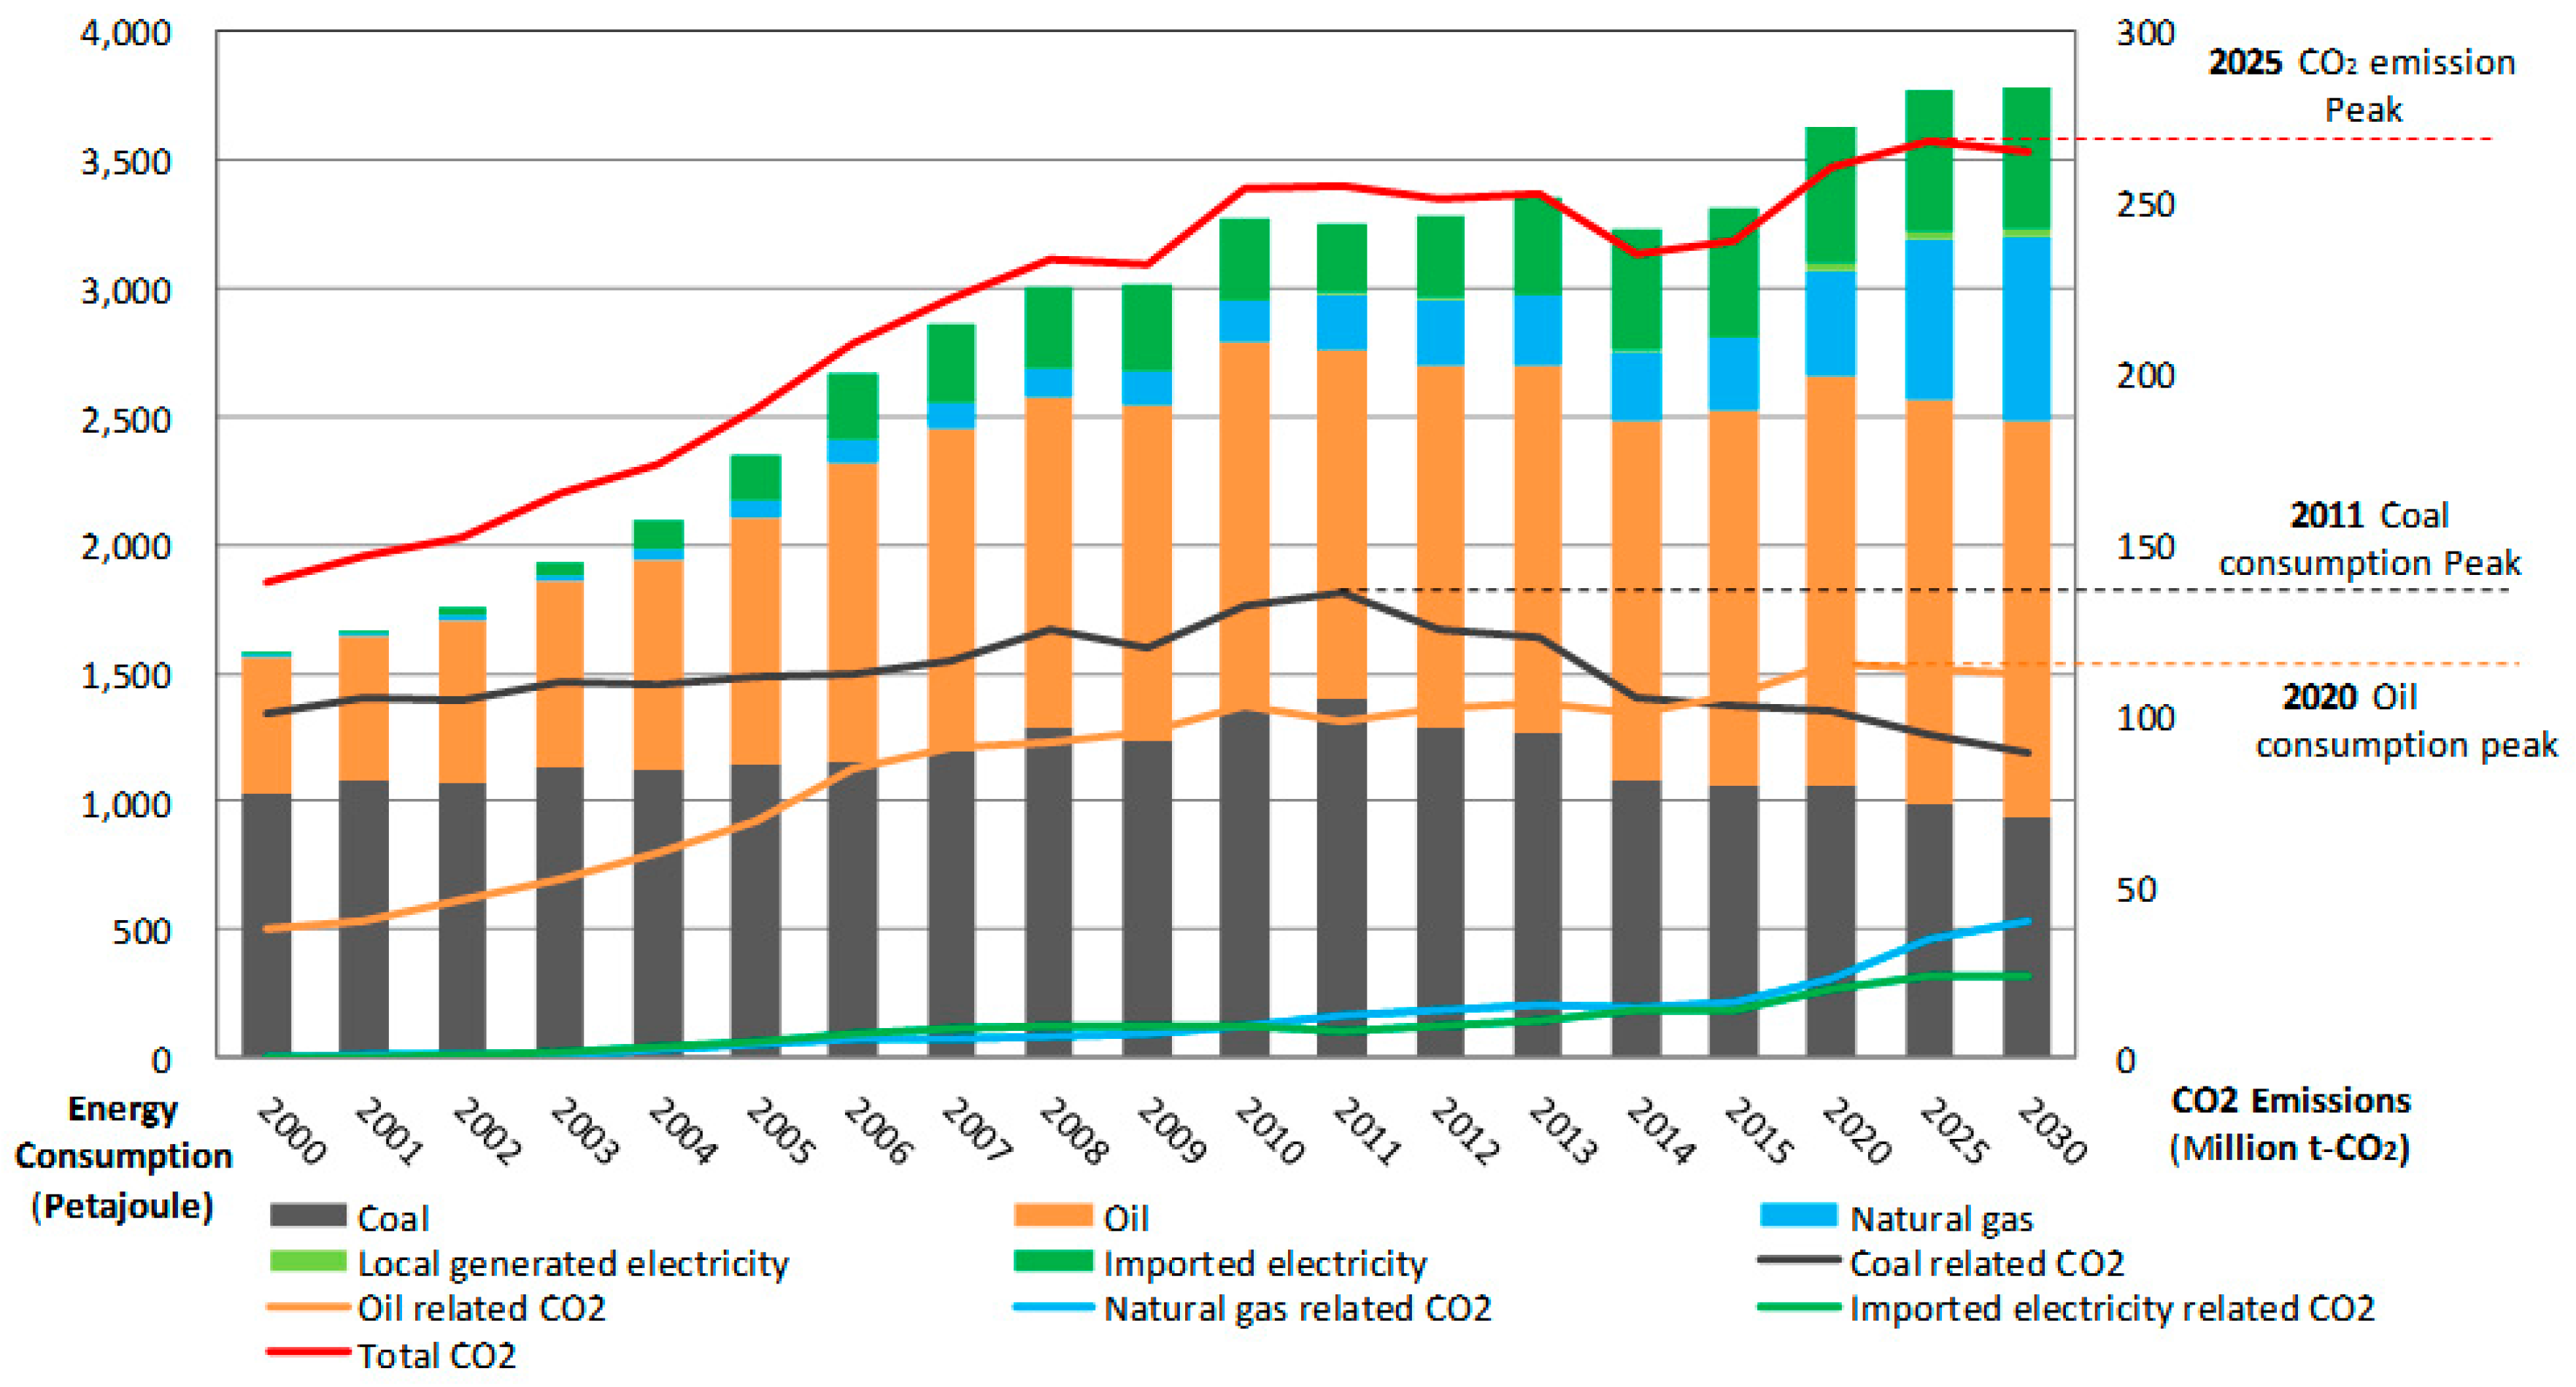
3.4.2. Trends of Shanghai Energy Consumption

Since 2000, the trends of Shanghai total energy consumption present three distinctly different developing periods. During 2000–2008, total energy consumption grows rapidly with AAGR of 8.4%. Since 2008, the growing rate experiences a small concussion and a negative growth appears in 2014, with a growing rate of 2.7% in 2015. After that, it enters a stage of low-speed growth.
In terms of the structure of energy consumption, the coal proportion has been falling, from 65.9% by 2000 to 32.0% by 2015; the oil proportion is pretty steady around 43%, and natural gas and imported electricity proportion increase rapidly and substantially. The imported electricity proportion grows from less than 0.1% in 2000 to 14.9% in 2015, and the natural gas proportion grows from 1% in 2000 to 8.6% in 2015.
With the adjustment of industrial structure and accelerating control of coal consumption, Shanghai total energy consumption will keep a low-speed growth in the long term. Total coal consumption and its proportion will continue to decline, but considering the safety of the Shanghai electric power system and stability of Baosteel production, as well as the constraints of the scale of renewable energy and price of natural gas, the further reduction space of Shanghai coal consumption is very limited.

3.4.3. Trends of Shanghai Energy-Related CO2 Emissions

Before 2012, the trends of Shanghai energy-related CO2 emissions is highly consistent with the change of energy consumption. However, with the rapid and substantial growth of imported clean electricity, Shanghai local coal consumed by power plants declines accordingly, which makes the downtrend of CO2 emissions faster than the downtrend of energy consumption. Shanghai energy-related CO2 emissions will reach the peak around 2025 in advance of energy consumption [23], earlier than the national target that China CO2 emissions reach peak around 2030. See Figure 6 for the trends of Shanghai energy consumption and associated CO2 emissions.

4. Conclusions and Policy Suggestions

Cities are the most concentrated areas for human manufacturing and living, as well as for energy consumption and anthropogenic CO2 emissions. It will enhance the focalization of energy-saving and emission-reducing in entire society by locating urban anthropogenic CO2 emission sources scientifically. This research constructs a Shanghai 1 km × 1 km high resolution energy consumption and carbon emissions spatial grid data product via a “bottom-up” approach for the year of 2010, based on the detailed energy data, population distribution data and GDP data. Such gridded data can reveal the spatial configuration of Shanghai energy consumption and carbon emission by usage type and energy type, and provide decision-making basis and data foundation so as to estimate Shanghai energy-related CO2 emission more accurately and to set out a reasonable plan of urban sustainable development. The conclusions of this research are listed as below:
(1) Shanghai energy consumption and energy-related CO2 emissions are characterized by high spatial aggregation. In the total 7209 grids, CO2 emissions accumulated from the top 10 grids account for 52.8% of the total gridded energy-related CO2 emissions in Shanghai; CO2 emissions accumulated from the top 20 grids account for 64.5% of the total gridded energy-related CO2 emissions in Shanghai; and CO2 emissions accumulated from the top 50 grids account for 76.5% of the total gridded energy-related CO2 emissions in Shanghai. As such, policy-makers should implement strategies based on emission resources when making energy and carbon emission related policies. In other words, they should implement delicacy management on energy consumption in the key grids, in order to achieve the maximum effects of policy with the least administrative cost.
(2) The Shanghai industrial sector constitutes the major sector of CO2 emissions while carbon emissions in resident sector have relatively low ratio. Energy-related CO2 emissions in the industry sector account for 63.45% of total emissions, while energy used in resident sector only accounts for 3.36%. According to the development plan for the future industry sector, we anticipated that Shanghai CO2 emission spatial configuration in the future will aggregate more in the southern coastline and northern coastline. The gridded energy consumption and carbon emissions data product can provide a strong tool in Shanghai planning decision making system to support urban planning in a sustainable way.
(3) Emission intensity of on-road traffic ranks highest in the central area. CO2 emissions emitted from Shanghai on-road traffic account for 8.96% of Shanghai total emissions. The carbon emission intensity of roads in Shanghai central area is 4.63 times that of roads in rural areas. Roads in the central area assume 48.5% of Shanghai traffic volumes, but the length of such roads account for only 21.9% of the total length of roads in shanghai. Given such, more attention shall be paid to the road planning in the central area, particularly for road planning inside the Inner Ring viaduct. In addition, underground rail traffic shall be promoted so as to mitigate road traffic demand in the central area.
(4) The grid constructed by this research realizes high-resolution identification and location to key point sources of coal-related CO2 emissions, key line sources of road traffic related CO2 emissions and natural gas related CO2 emissions for the year of 2010. There are some improvements that can be done in the future. First, re-disaggregate gas consumption consumed by commercial and resident sector by gas type, based on the house based natural gas consumption data, so as to enhance the accuracy of the emission spatial distribution. Currently, the gas consumed by resident and commercial sector is allocated according to the populations and GDP of the tertiary industry, which cannot accurately reflect the natural gas consumption difference among population with different income and the internal difference of the tertiary industry among various districts. Second, with regard to oil consumption, aviation CO2 emissions emitted inside Shanghai will be estimated and the spatial configuration coverage of carbon emissions will be expanded in the future, based on parameters such as the aviation flight flow and the average take-off distance at the airport, in order to provide more detailed essential data for monitoring and verifying the Shanghai carbon flux.

Acknowledgments

The authors would like to acknowledge the funding supports from the School of Social Development and Public Policy at Fudan University, from MOE (Ministry of Education of the People’s Republic of China) Liberal arts and Social Sciences Foundation under the project of “Study on the quality of living space assessment and evolution of living pattern in the Community of Metropolitan based on spatial statistics approach: a case Study of Pudong District in Shanghai” (Grant No. 16YJA840007). Special thanks is given to Professor Haixiao Pan from Tongji University, Shanghai, China for help in transport data collection and Ms. Xudong Chen from Fudan University, Shanghai, China for data preparation.

Author Contributions

Kexi Pan proposed this research and wrote the main part of the manuscript. Hanxiong Zhu analyzed energy-related data and wrote some part of the manuscript. Yongfu Li and Anrong Dang transferred all data into GIS and analyzed the data.

Conflicts of Interest

The authors declare no conflict of interest.

References

  1. CDIAC. Global Carbon Budget 2016. Available online: http://cdiac.ornl.gov/GCP/ (accessed on 20 November 2016).
  2. Collins, M.; Knutti, R. Long-term climate change: Projections, commitments and irreversibility. In Climate Change 2013: The Physical Science Basis; Contribution of Working Group I to the Fifth Assessment Report of the Intergovernmental Panel on Climate Change; Stocker, T., Qin, D., Plattner, G., Eds.; Cambridge University Press: Cambridge, UK, 2014; pp. 1029–1136. [Google Scholar]
  3. United Nations, Department of Economic and Social Affairs, Population Division (2014). World Urbanization Prospects: The 2014 Revision, Highlights (ST/ESA/SER.A/352); United Nations Publications: New York, NY, USA, 2014; Available online: http://www.indiaenvironmentportal.org.in/files/file/urbanization%202014.pdf (accessed on 5 November 2016).
  4. Seto, K.C.; Guneralp, B.; Hutyra, L.R. Global forecasts of urban expansion to 2030 and direct impacts on biodiversity and carbon pools. Proc. Natl. Acad. Sci. USA 2012, 109, 16083–16088. [Google Scholar] [CrossRef] [PubMed]
  5. Patarasuk, R.; Gurney, K.R.; O’Keeffe, D.; Song, Y.; Huang, J.; Rao, P.; Buchert, M.; Lin, J.C.; Mendoza, D.; Ehleringer, J.R. Urban high-resolution fossil fuel CO2 emissions quantification and exploration of emission drivers for potential policy applications. Urban Ecosyst. 2016, 19, 1013–1039. [Google Scholar] [CrossRef]
  6. Kort, E.A.; Frankenberg, C.; Miller, C.E.; Oda, T. Space-based observations of megacity carbon dioxide. Geophys. Res. Lett. 2012, 39, 26–33. [Google Scholar] [CrossRef]
  7. Gurney, K.R.; Razlivanov, I.; Song, Y.; Zhou, Y.; Benes, B.; Abdul-Massih, M. Quantification of fossil fuel CO2 emissions on the building/street scale for a large U.S. city. Environ. Sci. Technol. 2012, 46, 12194–12202. [Google Scholar] [CrossRef] [PubMed]
  8. Grimm, N.B.; Faeth, S.H.; Golubiewski, N.E.; Redman, C.L.; Wu, J.; Bai, X.; Briggs, J.M. Global change and the ecology of cities. Science 2008, 319, 756–760. [Google Scholar] [CrossRef] [PubMed]
  9. C40 Cities. Available online: http://www.c40.org/about (accessed on 15 November 2016).
  10. Gurney, K.R. Recent research quantifying anthropogenic CO2 emissions at the street scale within urban domain. Carbon Manag. 2014, 5, 309–320. [Google Scholar] [CrossRef]
  11. The Hestia Project. Available online: http://hestia.project.asu.edu/index.shtml (accessed on 15 November 2016).
  12. Feng, S.; Lauvaux, T.; Newman, S.; Rao, P.; Ahmadov, R.; Deng, A.; Díaz-Isaac, L.I.; Duren, R.M.; Fischer, M.L.; Gerbig, C.; et al. Los Angeles megacity: A high-resolution land–atmosphere modelling system for urban CO2 emissions. Atmos. Chem. Phys. 2016, 16, 9019–9045. [Google Scholar] [CrossRef]
  13. Bréon, F.M.; Broquet, G.; Puygrenier, V.; Chevallier, F.; Xueref-Remy, I.; Ramonet, M.; Dieudonné, E.; Lopez, M.; Schmidt, M.; Perrussel, O.; et al. An attempt at estimating Paris area CO2 emissions from atmospheric concentration measurements. Atmos. Chem. Phys. 2015, 15, 1707–1724. [Google Scholar] [CrossRef]
  14. Liu, Z.; Geng, Y.; Xue, B. Inventorying energy-related CO2 for city: Shanghai study. Energy Procedia 2011, 5, 2303–2307. [Google Scholar] [CrossRef]
  15. Wang, H.; Zhang, R.; Liu, M.; Bi, J. The carbon emissions of Chinese cities. Atmos. Chem. Phys. 2012, 12, 6197–6206. [Google Scholar] [CrossRef]
  16. Dajian, C.W.Z. Decomposition of energy-related CO2 emissions from Shanghai’s industries and policy implications. China Popul. Resour. Environ. 2012, 10, 40–46. [Google Scholar]
  17. Cai, B.; Zhang, L. Study on the spatial characteristics of urban CO2 emissions in Shanghai. Adv. Clim. Chang. Res. 2014, 6, 417–426. (In Chinese) [Google Scholar]
  18. Sinton, J.E. Accuracy and reliability of China’s energy statistics. China Econ. Rev. 2001, 12, 373–383. [Google Scholar] [CrossRef]
  19. Zhao, Y.; Nielsen, C.P.; McElroy, M.B.; Zhang, L.; Zhang, J. CO emissions in China: Uncertainties and implications of improved energy efficiency and emission control. Atmos. Environ. 2012, 49, 103–113. [Google Scholar] [CrossRef]
  20. Teng, F.; Zhu, S. Which estimation is more accurate? Technical comments on Nature Paper by Liu et al on overestimation of China’s emission. Sci. Technol. Rev. 2015, 22, 112–116. (In Chinese) [Google Scholar]
  21. Liu, Z.; Guan, D.; Wei, W.; Davis, S.J.; Ciais, P.; Bai, J.; Peng, S.; Zhang, Q.; Hubacek, K.; Marland, G.; et al. Reduced carbon emission estimates from fossil fuel combustion and cement production in China. Nature 2015, 524, 335–338. [Google Scholar] [CrossRef] [PubMed]
  22. Hong, C.; Zhang, Q.; He, K.; Guan, D.; Li, M.; Liu, F.; Zheng, B. Variations of China’s emission estimates response to uncertainties in energy statistics. Atmos. Chem. Phys. Discuss. 2016. [Google Scholar] [CrossRef]
  23. Shanghai Master Plan (2016–2040). Available online: http://www.supdri.com/2040/public/images/gongshi/3.pdf (accessed on 15 November 2016).
  24. Wei, W.; Ren, X.; Cai, Z.; Hou, Q.; Liu, Y.; Li, Q. Research on China’s Greenhouse gas emission—Progress on emission inventory from the CAS strategic priority research program. Bull. Chin. Acad. Sci. 2015, 6, 839–847. (In Chinese) [Google Scholar]
  25. Shanghai Statistical Bureau. Shanghai Statistical Yearbook on Energy, 2011; Shanghai Press: Shanghai, China, 2011. (In Chinese)
  26. IPCC (Intergovernmental Panel on Climate Change). IPCC Guidelines for National Greenhouse Gas Inventories; United Kingdom Meteorological Office: Bracknell, UK, 2006.
  27. Fudan University Energy Flow and Potential Carbon Emission Factor Database. Available online: http://dvn.fudan.edu.cn/dvn/dv/FDED (accessed on 10 November 2016).
  28. Pan, K.; Zhu, H.; Chang, Z.; Wu, K.; Shan, Y.; Liu, Z. Estimation of coal-related CO2 emissions: The case of China. Energy Environ. 2013, 24, 1309–1321. [Google Scholar]
  29. Shanghai City Comprehensive Transportation Planning Institute. Annual report on Shanghai comprehensive transportation (2011). Traffic Transp. 2011, 27, 11–13. (In Chinese) [Google Scholar]
  30. Shanghai Statistical Bureau. Shanghai Regional Annual Statistical Bulletin 2011. Available online: http://www.stats-sh.gov.cn/tohtml/toWorkContact.xhtml (accessed on 2 November 2016). (In Chinese)
  31. National Bureau of Statistics of China. Tabulation on the 2010 Population Census of the People’s Republic of China. Available online: http://www.stats.gov.cn/english/Statisticaldata/CensusData/rkpc2010/indexch.htm (accessed on 8 October 2016).
  32. Zhu, H.; Pan, K.; Liu, Z. Coal flow diagrams and its total consumption control line for Shanghai. Power Energy 2014, 3, 237–242. (In Chinese) [Google Scholar]
  33. Shanghai Government. Shanghai 13th Five Year Plan of Comprehensive Transportation. Available online: http://wap.sh.gov.cn/nw2/nw2314/nw2319/nw12344/u26aw50326.html (accessed on 12 November 2016).
Figure 1. Spatial distribution of Shanghai’s energy consumption. (a) presents the spatial distribution of total energy consumption in Shanghai, 2010 (Unit: t-CO2); (b) presents point distribution of coal facilities in Shanghai, 2010; and (c) presents annual on-road oil consumption for Shanghai, 2010.
Sustainability 09 00104 g001
Figure 2. Spatial distribution of coal related CO2 emissions for Shanghai, 2010 (Unit: t-CO2).
Sustainability 09 00104 g002
Figure 3. Spatial distribution of oil related CO2 emissions for Shanghai, 2010 (Unit: t-CO2).
Sustainability 09 00104 g003
Figure 4. Spatial distribution of natural gas related CO2 emissions for Shanghai, 2010 (Unit: t-CO2).
Sustainability 09 00104 g004
Figure 5. Spatial distribution of energy-related CO2 emissions for Shanghai, 2010. (Unit: t-CO2).
Sustainability 09 00104 g005
Figure 6. Trends of Shanghai energy consumption and energy-related CO2 emissions from 2000 to 2030.
Sustainability 09 00104 g006
Table 1. Net heat value and related carbon emission factors of various energy types.
Fuel TypesNet Heat Values MJ/kg, MJ/m3Emission Factors kg-C/MJ
CoalCoal for electricity21.4126.78
Coal for heating20.5426.78
Coking coal27.7125.21
PCI26.1427.39
Lump coal25.6826.86
Feed coal24.8926.29
Steam coal used in other industries21.7426.29
Coke28.4329.20
OilGasoline43.0718.92
Diesel43.5120.22
Kerosene43.0719.12
Fuel oil41.8221.12
LPG50.1817.22
Refinery gas46.0015.72
Other oil products35.4320.02
Natural gasNatural gas used by power plants34.7115.32
Natural gas used by other sectors36.3015.32
Data source: net heat values of oil and natural gas are from [25]; and carbon emission factors of oil and natural gas are from [26]; coal related data are from the authors’ estimation. PCI: pulverized coal used for injection; LPG: liquid petroleum gas.
Table 2. Ratio of annual turnover volume of motor vehicles for Shanghai (by regions and road types).
Road TypesCity CentreSuburb
PxiiPdiiPxioPdioAoo
Fast road32.3%27.9%49.3%49.7%34.8%
Primary road36.1%39.7%26.1%23.5%35.4%
Secondary road17.0%21.7%11.4%13.2%17.5%
Local road14.6%10.7%13.1%13.7%12.2%
Sum100.0%100.0%100.0%100.0%100.0%
Data source: The Author estimated based on report from Shanghai City Comprehensive Transportation Planning Institution (CCTPI) [29].
Table 3. Proxies used for disaggregating energy and CO2 emissions to grids.
Fuel TypesSectorsProxy
Coalmiddle & small coal fired boilersIndustry concentration
Oilindustrial enterprises below designated sizeIndustry concentration
commercial sectorGDP of tertiary industry
Resident sectorPopulation
AgricultureGDP of agriculture
Natural gasindustrial enterprises below designated sizeIndustry concentration
commercial sectorGDP of tertiary industry
Resident sectorpopulation
Table 4. Coal consumption by usage for Shanghai (2010–2015) (Unit: Mt).
YearTotalPower GenerationHeatingMiddle and Small Sized BoilersGasCokingPCIChemical FeedUsed by Corex
201058.7634.2132.255.340.089.753.761.440.95
201161.4236.6832.405.070.079.923.621.371.45
201257.0333.9732.264.250.099.873.401.580.64
201356.8635.5931.024.550.048.383.481.720.0
201448.9628.1429.954.550.017.593.592.070.0
201547.2827.4529.573.030.08.313.482.050.0
Data source: [26].
Table 5. The annual average oil consumption density of various regions by road types for Shanghai, 2010 (Unit: t/m).
Road TypesCity CentreSuburb
PxiiPdiiPxiiPdiiPxii
Fast road8.2105.8658.0676.8991.899
Primary road6.9934.1813.4021.6831.415
Secondary road1.8231.5880.6810.6560.282
Local road0.1810.1150.1360.1100.048
Average1.1050.9170.8270.6310.265
Table 6. Differences between Shanghai energy-related CO2 emissions estimated from the top-down and bottom-up approaches (Unit: t).
Fuel TypesTop-Down ApproachBottom-Up ApproachDifferencesPercentage
Coal13,066.113,066.10.0
Coke259.7259.70.0
Oil9633.16162.53470.614.1%
Natural gas909.4909.40.0
Imported electricity736.40.0736.43.0%
Sum24,604.820,397.74207.117.1%

