Article

Progressive Time-Weighted Dynamic Energy Efficiency, Energy Decoupling Rate, and Decarbonization: An Empirical Study on G7 and BRICS

1
Department of Banking and Finance, Kainan University, No. 1 Kainan Rd., Luchu, Taoyuan City 33857, Taiwan
2
Department of Marketing, Kainan University, No. 1 Kainan Rd., Luchu, Taoyuan City 33857, Taiwan
3
Department of Hotel Management, Taiwan Shoufu University, No. 168, Nanshi Li, Madou District, Tainan City 72153, Taiwan
*
Author to whom correspondence should be addressed.
Sustainability 2016, 8(9), 928; https://doi.org/10.3390/su8090928
Submission received: 27 July 2016 / Accepted: 7 September 2016 / Published: 11 September 2016

Abstract

:
Energy is a critical factor of economic growth, but the overuse of it results in global warming and climate change. Hence, energy efficiency improvement can help mitigate climate change and prevent economic losses or even ecological extinction. The data envelopment analysis (DEA) approach has been extensively applied for energy efficiency estimation, but past studies of this estimation employ a static mode that does not consider consecutive periods and the carry-over effect. This study estimates energy efficiency under a weight-restricted dynamic DEA (WrD-DEA) model, creates a weight-restricted dynamic energy efficiency (WrD-EE) indicator, and discusses issues concerning the energy decoupling rate and decarbonization. We utilize members in the Group of Seven (G7) and BRICS (Brazil, China, India, Russia, and South Africa) for our experimental observations. The main results herein are: (1) BRICS has larger room for improvement to achieve the standard ratio of the energy decoupling rate than the G7; (2) the G7 and BRICS do not converge to decarbonization; and (3) BRICS exhibits more rapid improvement on energy efficiency than the G7.

1. Introduction

It is well known that energy consumption and economic growth have a close correlation, with even India’s government announcing that it must increase energy consumption to help lift its population out of poverty [1]. In order to strengthen a country’s competitiveness and development, improving energy efficiency has been widely identified as one path for reducing production cost and fossil energy use. In the past, energy intensity has been taken as a proxy to measure energy efficiency, denoted as the single-factor energy efficiency indicator. Boyd and Pang [2] apply the data envelopment analysis (DEA) multiple-factor approach to explain energy efficiency through productivity differences. The total-factor energy efficiency (TFEE) indicator of Hu and Wang [3] not only employs a multiple-factor approach, but also considers the substitution effect among energy input and non-energy input factors. Han et al. [4] indicate that the energy efficiency indicator neglects the substitution effect of input factors, which may cause plausible results. Following the TFEE concept, many studies have analyzed energy efficiency on different levels by using the TFEE indicator. Hu and Kao [5] compare energy efficiency among Asia-Pacific Economic Cooperation (APEC) countries, while Zhang et al. [6] study developing countries. Wei et al. [7] note the energy efficiency in China’s iron and steel sector, while Munkherjee [8] presents a case for India’s manufacturing industry. Honma and Hu [9] focus on developed countries’ industry-level energy efficiency. Hu and Wang [3] and Honma and Hu [10] place attention on province-level energy efficiency in China and Japan, respectively.
The dynamic DEA model is different from the static DEA model as it takes a long-term viewpoint to emphasize the intertemporal activities of decision making units (DMUs) between two consecutive time periods by which we can estimate an individual period’s efficiency during the whole period. Färe and Grosskopf [11] are the first to contribute to a dynamic DEA model in which multi-outputs are considered, although their idea derives from Caves et al. [12] who originally present the Malmquist productivity estimation. The Malmquist productivity index is decomposed in order to estimate the effects of technical change and technical efficiency change [13]. Similarly, the static energy efficiency indicator is also derived for dynamic application, shown in the references of [14,15,16]. The late dynamic DEA model considers DMU’s carry-over activity, such as investment during consecutive periods. The study includes the slack-based dynamic DEA model by Tone and Tsutsui [17] and the radical-based dynamic DEA model by Kao [18].
The past literature states that variables with zero weights have no influence on the efficiency score, even if the variables are critical in the model, with wide-ranging results providing a motivation to discuss the meaning of weight in the field of economics. Farrell [19] presents the seminal contribution to the definition of efficiency, in which the calculation of the Farrell technical efficiency score does not connect to any index of efficiency that is estimated by a production frontier and input-output data. Charnes et al. [20] measure the efficiency score by using the weighted outputs over weighted inputs and use the weights as the reference of efficiency score adjustment. Førsund [21] investigates the economic implication of the weights by using the Lagrangian method in which the weights exhibit critical economic implications, including the marginal rate of transformation on the production frontier, the marginal rate of technical substitution for any two output factors, and the marginal rate of substitution for any two input factors. His approach not only endows the weights with economic implications, but also indirectly imposes restrictions on the weights.
Allen et al. [22] mention that the weight restrictions could enhance the discrimination ability among DMUs’ efficiency scores since the restrictions have a function of efficiency score judgement. Podinovski [23] provides the viewpoint that the absolute weight bounds result in a side effect in DEA models. Oikonomou et al. [24] assert that the complete flexibility on the DEA model’s weights may result in unreasonable low or high values to the model’s multipliers, which result in a biased efficiency score. Hence, they utilize the investigation weight restrictions to estimate the efficiency of Greece’s rural health care system. Podinovski and Bouzdine-Chameeva [25] argue that an improper technology definition causes the negative inputs to be based on a target DMU. To solve the questionable issue, they set up a DEA model with weight restrictions in which the efficient targets must locate on the boundary of the production technology.
The classic DEA model with completely flexible weights may cause undesirable consequences in which unreasonably low or high weight values attempt to make the DMU’s efficiency value be as high as possible [26]. The weight-restricted DEA model often imposes additional constraints on the weights of the input and/or output variables, which are used to judge the overall efficiency, and enhances the discrimination of efficiency ranking [27]. Thompson et al. [28] provide an early weight-restricted DEA model, referred to as the Assurance Region (AR) DEA methodology, in which the weights are limited in an appropriate area. Cook and Zhu [29] modify the AR-DEA model into the Current Assurance Region (CAR) DEA model in which the efficiency estimation could accurately capture the DMU’s circumstances. Podinovski and Bouzdine-Chameeva [25] contribute a single-stage DEA model with weight restrictions in order to reach a maximized efficiency score and minimized slacks at the same time.
After the industrial revolution, humans have used a lot of coal, oil, natural gas, and other fossil fuels, which has significantly increased the atmospheric concentration of carbon dioxide (CO2) and caused the greenhouse effect and climate change. In recent years, global warming is worsening and extreme climates have become the biggest environmental challenges worldwide. How to live in harmony with nature, maintain sustainable development of Earth’s ecosystems and human civilization, and monitor global energy use efficiency have all become imperative. Brazil, Russia, India, China, and South Africa (hereafter BRICS) are the stars of worldwide economic growth and the driving forces of global economic development. They not only consume a lot of energy, but also emit a lot of CO2 emissions, and they are representative of developing countries. The representatives of developed countries with high energy efficiency and advanced technology, i.e., Canada, France, Germany, Italy, Japan, the United Kingdom, and the United States (hereafter G7), can be the standard for BRICS accounts. This is also the reason why the G7 and BRICS have been selected as the study samples in this study.
Fossil energy is one of the production factors that produce not only desirable outputs, but also undesirable outputs such as CO2 emissions [30]. Hence, the estimation of energy efficiency is necessary to consider undesirable output in a production framework. Zhou and Ang [31] argue that neglecting an undesirable output in the estimation process may result in biased energy efficiency scores. Mandal [32] takes India’s cement industry as an example to estimate energy efficiency under a framework of desirable and undesirable outputs and shows that the biased energy efficiency result may be caused by neglecting undesirable outputs in a production process. As such, our study includes the undesirable outputs into the production process for unbiased energy efficiency estimation.
Based on our best knowledge, past research on weight-restricted DEA does not investigate the dynamic situation, and hence our study creates a weight-restricted dynamic radical DEA model to estimate energy efficiency, which we call weight-restricted dynamic energy efficiency (WrD-EE). In addition, this study also involves the idea of progressive time weighted in the DEA model since previous DEA papers do not consider a change in DMUs’ behavior, meaning that the previous papers always set the same weight on each period’s data. This study asserts that the DMUs’ behaviors will change over time, and hence there will be a higher weight on the current data and lesser weight on the early data. Moreover, this study changes the previous DEA model for each data period as being independent in the latest DEA idea, whereby each independent data period is connected by an input factor in the dynamic DEA model. Tone and Tsutsui [17] note that the dynamic DEA model with carry-over factors between two consecutive terms can consider the time change effect and the long-term optimization. In the empirical analysis, this paper targets energy efficiency in emerging countries since their economic growth rates are stronger and their gas emissions cause the global warming, which relates to climate change as a concern of developed countries. BRICS represents emerging countries and the G7 represents advanced countries; hence, the five members of BRICS and the seven of G7 are selected as the study samples in this paper.
This study takes capital formation (K) as a carry-over input factor. Song et al. [33] also chooses the capital formation rate as the input factor in their study. The remaining input factors in our study include labor (L) and energy consumption (E), the desirable output factor is gross domestic production (GDP), and the undesirable output factor is carbon dioxide (CO2). The choice of variables is similar to that in Wu et al. [34], who investigate industrial energy efficiency in China under the static mode. Hence, they choose the static variable, i.e., capital stock, instead of the dynamic variable, i.e., capital formation.
The remainder of the paper is organized as follows. Section 2 is the methodology, Section 3 is the empirical analysis, and Section 4 is the policy implications. Section 5 is the conclusions.

2. Methodology

Most related energy efficiency studies adopt a non-parametric approach such as DEA. Fewer studies use the parametric approach to evaluate energy efficiency by the stochastic frontier approach (SFA) such as Zhou et al. [35]. To the best of our knowledge, DEA versus SFA has two main advantages: (1) DEA is more flexible than SFA, which cannot assume the functional form of the production function or distance function such as the Cobb–Douglas form or Translog while evaluating efficiency scores; and (2) the DEA methodology can consider multiple outputs and inputs in the analysis, especially when considering undesirable output such as CO2 emissions in the model. More detailed comparative discussions on the advantages and disadvantages between SFA and DEA can been seen in Coelli et al. [36]. Evaluating energy efficiency without considering undesirable outputs such as CO2 emissions in the modeling framework may lead to biased energy efficiency values [31,32]. Within a joint production framework of multiple outputs, evaluating energy efficiency by the DEA approach is more adequate.
Under the DEA approach, this study develops the dynamic model proposed by Kao [18] as the dynamic energy efficiency model (DEEM) in order to measure energy efficiency in the G7 and BRICS. We then extend the dynamic energy efficiency model as the progressive time weighted dynamic energy efficiency model (PTW-DEEM) by considering the progressive time weight on the input and output data. Section 2.1 presents the introduction of the dynamic energy efficiency model. Section 2.2 develops the progressive time weighted dynamic energy efficiency model and discusses energy efficiency change. Section 2.3 offers a discussion of group energy efficiency and a measurement of the decoupling rate for energy use.

2.1. Dynamic Energy Efficiency Model

In order to measure the DMU’s energy efficiency, we assume that N decision-making units are observed over T periods, and each DMU employs a kinds of common inputs (x), b kinds of energy inputs (e), and c kinds of carry-over inputs (z) to produce f kinds of desirable outputs (y) and g kinds of undesirable outputs (u). The carry-over inputs play a critical role in the dynamic DEA model, which considers consecutive time periods by a linkage of carry-over inputs.
Figure 1 defines xtih as the amount of ith common inputs used by DMU h at period t, where t = 1, 2, …, T, i = 1, 2, …, a, and h = 1, 2, …, n, ..., N; defines etjh as the amount of jth energy inputs used by DMU h at period t, where j = 1, 2, …, b; defines ztkh as the amount of kth carry-over inputs used by DMU h at period t, where k = 1, 2, …, c; defines ytrh as the amount of rth desirable outputs produced by DMU h at period t, where r = 1, 2, …, f; and then defines utsh as the amount of sth undesirable outputs produced by DMU h at period t, where s = 1, 2, …, g. This paper applies the dynamic DEA model of Kao [18] and the energy efficiency estimation model such as in Wang et al. [37] to establish the dynamic energy efficiency model as:
min ϕtn
s . t . t = 1 T h = 1 N λ t h x t i h x t i n , i = 1 , 2 , , a t = 1 T h = 1 N λ t h e t j h φ t n e t j n , j = 1 , 2 , , b t = 1 T h = 1 N λ t h ( z t k h z t 1 k h ) + z 0 k h z T k n , k = 1 , 2 , , c t = 1 T h = 1 N λ t h y t r h y t r n , r = 1 , 2 , , f t = 1 T h = 1 N λ t h u t s h = u t s n , s = 1 , 2 , , g λ t h 0 ,   x t i n 0 ,   e t j n 0 ,   z T k n 0 ,   y t r n 0 ,   u t s n 0 ,   t = 1 ,   2 ,   ,   T ,   and   h = 1 ,   2 ,   ,   n ,   ,   N .
Model (1) takes DMU n as an example, and its energy efficiency score can be obtained by a calculation of objective function ϕtn for DMU n at period t, where ϕtn [0, 1]. Here, λth is the weight of the DMU h at period t used for connecting the inputs and outputs by a linear combination of each DMU. The constraints in Model (1) mean that if fewer energy inputs can create a large amount of outputs, given the amounts of undesirable outputs, then the DMU will have a high energy efficiency score. The undesirable output, such as environmental pollution, is treated by utilizing the reciprocal of the undesirable output as a positive environmental variable u. Model (1) is a dynamic energy efficiency model; the difference between Model (1) and Kao [18] is that Model (1) is an input-oriented dynamic energy efficiency model, but Kao [18] employs an output-oriented dynamic DEA model.

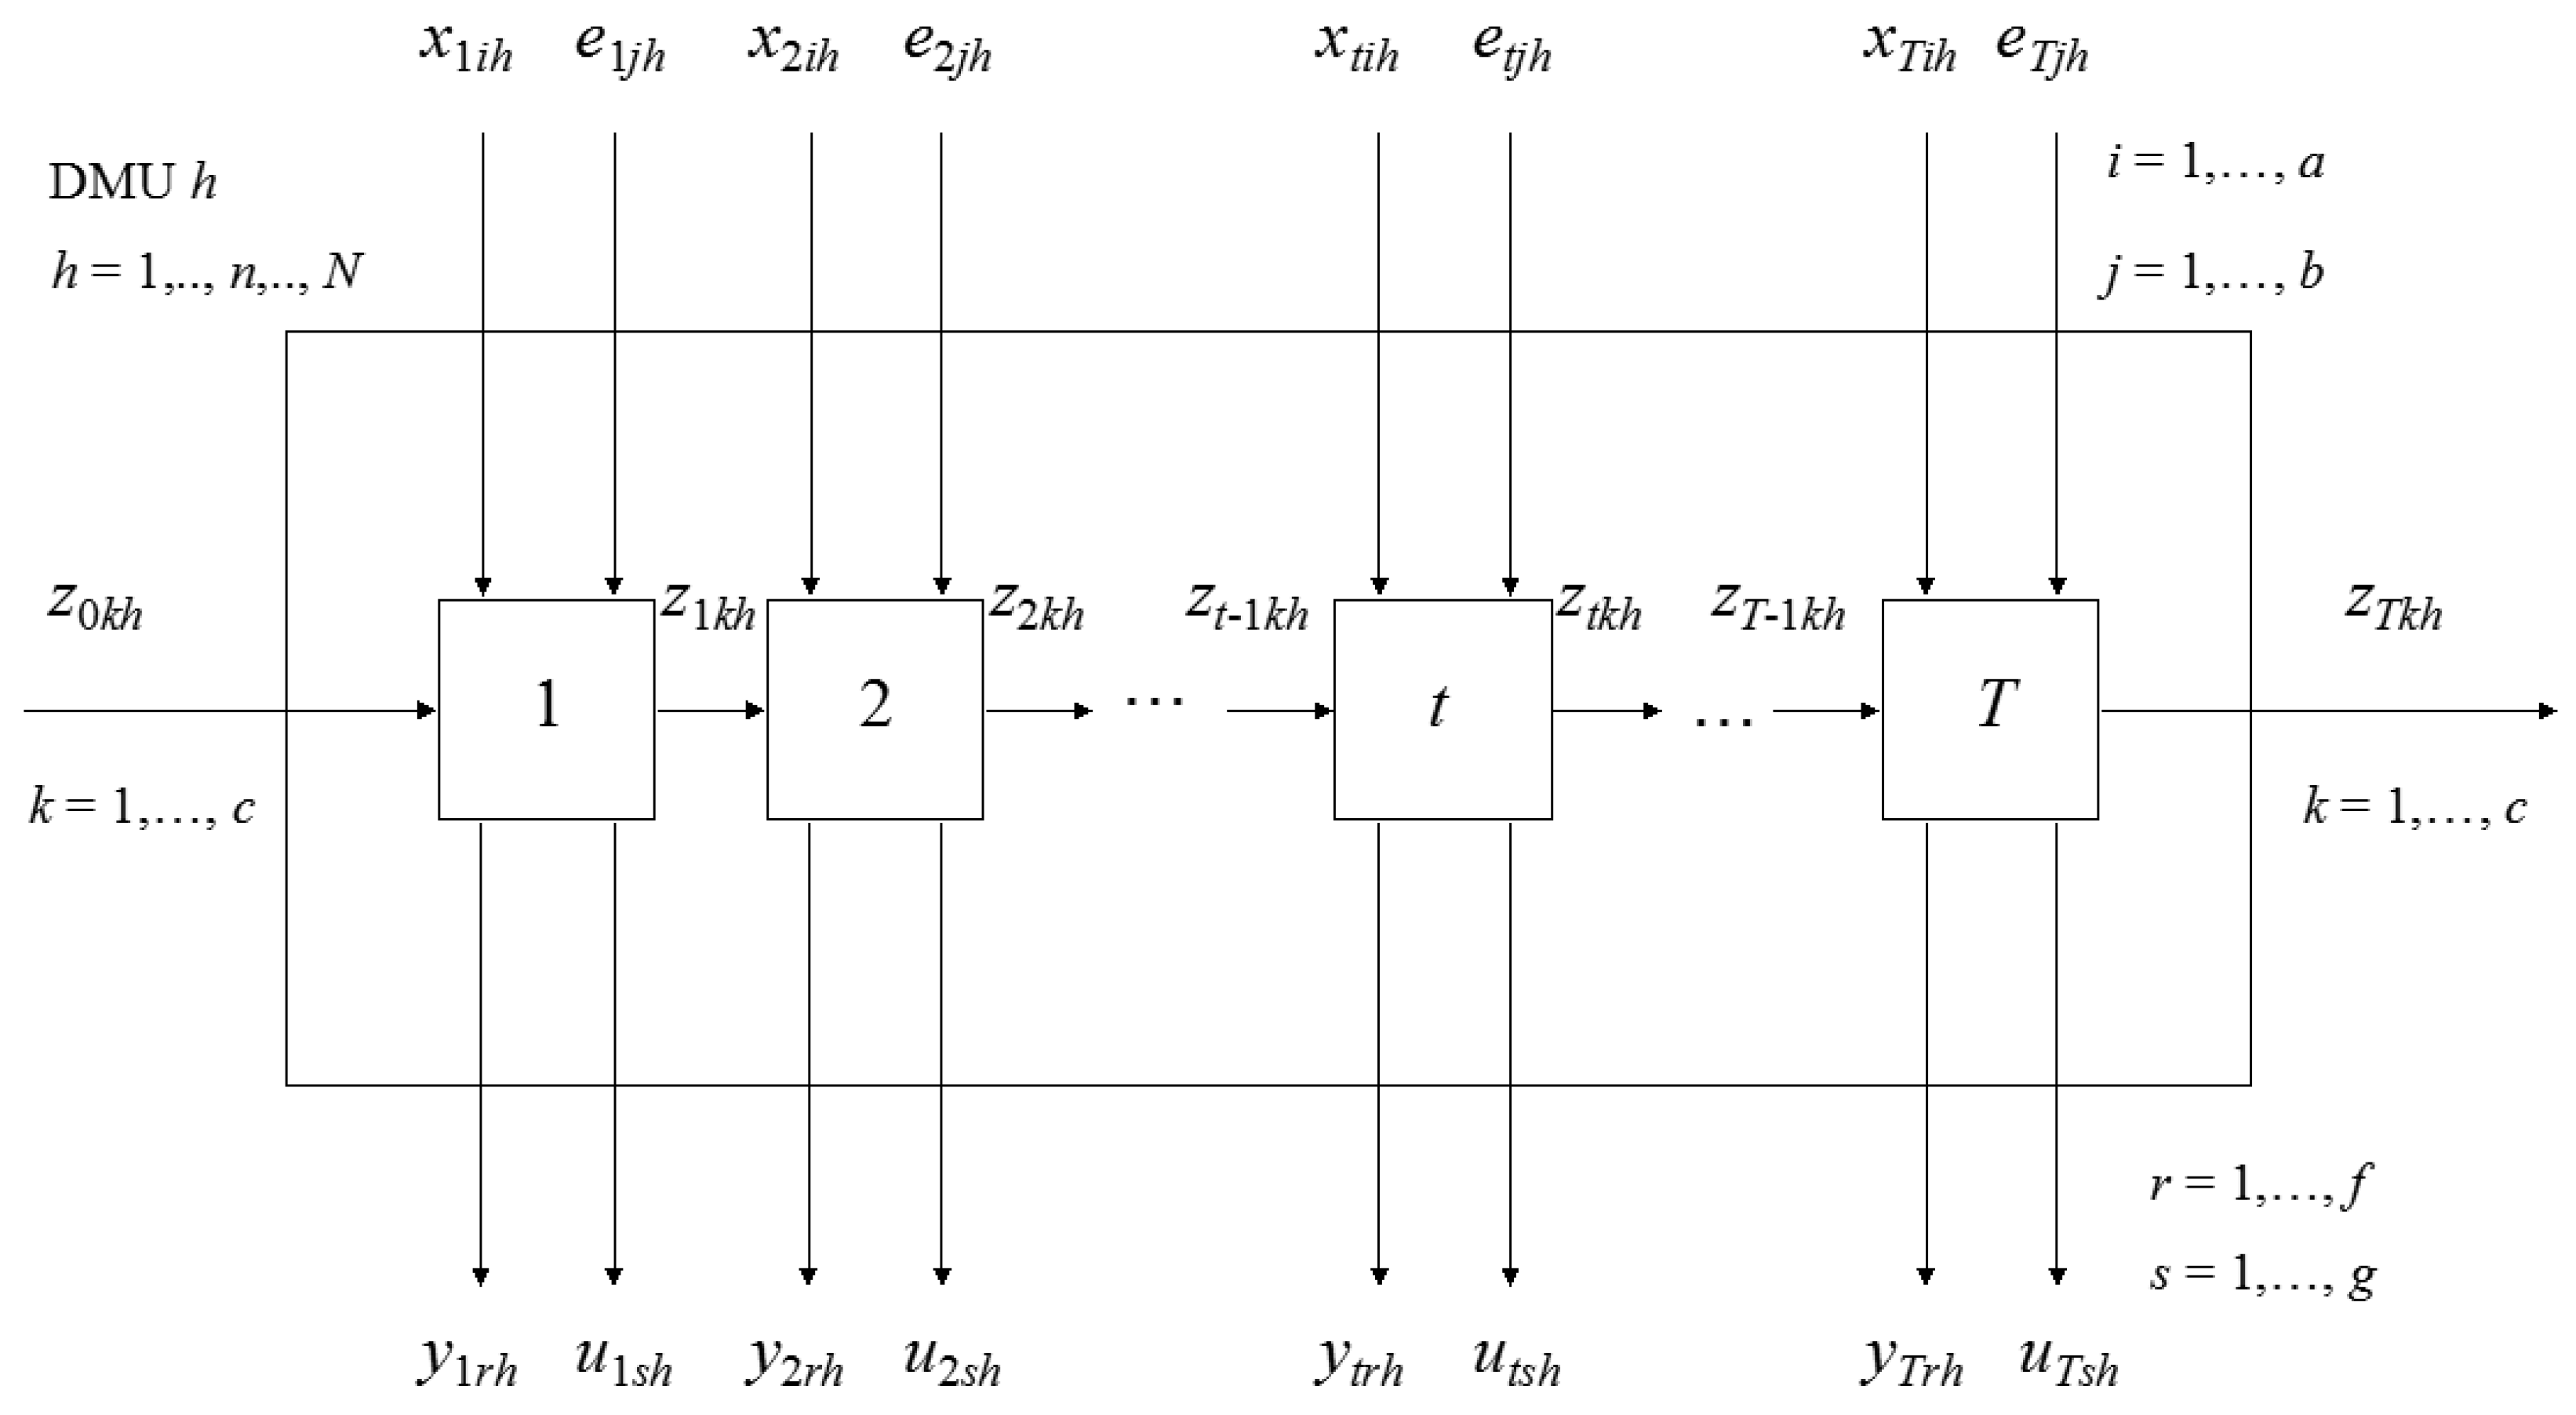
2.2. Progressive Time-Weighted Dynamic Energy Efficiency Model

This study further develops Model (1) by using the progressive time-weighted mean approach in which recent data are highlighted to reflect the new information, and the old data only have a light weight to reflect the out-of-date information [38]. Hence, Model (1) can be modified to create the new model, which is the progressive time-weighted dynamic energy efficiency model as follows:
min ϕtn
s . t . t = 1 T h = 1 N λ t h ( w t x t i h ) w t x t i n , i = 1 , 2 , , a t = 1 T h = 1 N λ t h ( w t e t j h ) φ t n w t e t j n , j = 1 , 2 , , b t = 1 T h = 1 N λ t h ( w t z t k h w t 1 z t 1 k h ) + w 0 z 0 k h w T z T k n , k = 1 , 2 , , c   t = 1 T h = 1 N λ t h ( w t y t r h ) w t y t r n , r = 1 , 2 , , f t = 1 T h = 1 N λ t h ( w t u t s h ) = w t u t s n , s = 1 , 2 , , g 0 λ t n   1 , t = 0 T w t = 1 , x t i n   0 , e t j n   0 , z T k n   0 , y t r n   0 , u t s n   0 , t =   1 ,   2 ,   , T ,   and h = 1 , 2 , , n , ... , N ,
where wt = 2t/(T2 + T). This paper utilizes the result in Model (2) to estimate energy efficiency change (EEC) from period t to period t + 1 as follows:
EEC = ϕt+1n/ϕtn.
If EEC is greater than, equal to, or less than 1, then the time-revealed energy efficiency shows progress, no change, or regression from period t to period t + 1. The energy efficiency change represents that the inefficient DMUs are getting closer to the best frontier, i.e., the catching up effect, when the EEC score is greater than 1 or farther from the best frontier, i.e., the fall behind effect, when the EEC score is less than 1 or no change position, when the EEC score is 1.

2.3. Group Energy Efficiency and Decoupling Rate for Energy Use

Based on the result in Model (2), we obtain the optimal energy use for DMU n and jth energy at time t as follows:
e*tjn = ϕtn × etjn.
This study estimates the group energy efficiency based on the panel data of the G7 and BRICS, and each member country’s optimal energy use for jth energy at period t is e*tjn. Hence, the group energy efficiencies of G7 and BRICS are estimated by:
Group   energy   efficiency = n G 7   or   BRICS e t j n * / n G 7   or   BRICS e t j n
In order to estimate the DMU’s relationship between economic driving forces, i.e., desirable output, and environmental pressures, i.e., undesirable output, OECD [39] creates the index of the decoupling factor. Our paper sets up the index of the energy decoupling rate (EDR) to estimate energy use as follows:
Energy   decoupling   rate = 1 e t + 1 j n e t j n >   0   when e t + 1 j n < e t j n , = 0   when e t + 1 j n e t j n .
The maximum value of the decoupling rate is 1 in which energy use at period t + 1 is zero, i.e., et+1jn = 0; when the value of the decoupling rate is between 1 and zero, it means that the energy use is partially decoupling; when the value of the decoupling rate is zero, it shows that the decoupling is absent in the energy use. Mudgal et al. [40] point out that decoupling energy use from economic growth, i.e., low energy intensity, is one of the EU’s resource strategies, and targeting low energy intensity is also common around the world. Hence, we combine Equations (4) and (6) to find the target energy decoupling rate (TEDR) as follows:
Target   energy   decoupling   rate = 1 e t + 1 j n * e t j n >   0   when e * t + 1 j n < e t j n , = 0   when e * t + 1 j n e t j n .
The group energy decoupling rate (GEDR) and group target energy decoupling rate (GTEDR) are estimated by the following equations:
Group   energy   decoupling   rate   =   1 n G 7 or BRICS e t + 1 j n n G 7 or BRICS e t j n   0 ,
Group   target   energy   decoupling   rate   =   1 n G 7 or BRICS e t + 1 j n * n G 7 or BRICS e t j n   0.
In order to estimate the achievement standard ratio of the energy decoupling rate (ASREDR), we set the index as follows:
Achievement standard ratio of the energy decoupling rate = (EDR + ε)/(TEDR + ε),
where ε is a very small number so as to avoid a meaningless value of ASREDR, and the value of ASREDR is between 0 and 1.

3. Empirical Analysis

The study takes data on the G7 and BRICS from 2000 to 2011 as an example to investigate their energy efficiency and energy efficiency change under PTW-DEEM. We transfer all data into real variables based on the price level in 2010. Additively, this section also discusses the energy decoupling rate, the achievement standard ratio of the energy decoupling rate, and decarbonization for the G7 and BRICS.

3.1. Data Description

The dataset for members of the G7 and BRICS includes the amount of real GDP as a desirable output and the amount of CO2 emissions as an undesirable output; three input factors are real capital formation, the amount of labor, and the amount of energy use, where real capital formation is a carry-over factor herein since it shows a characteristic of time continuity. Previous studies related to the environment and energy issue such as [30,34,41] and Chang [42] also use a similar combination of input and output variables. The data source is the website of the World Bank, and the data period is from 2000 to 2011. Table 1 lists the descriptive statistics of data containing the 12 countries of the G7 and BRICS.
The information from the standard deviations of the input and output factors shows that the members of G7 and BRICS exhibit the smallest data variance in real capital formation; however, they have larger data variance in energy use. This implies that it is meaningful to conduct energy efficiency with respect to the G7 and BRICS.

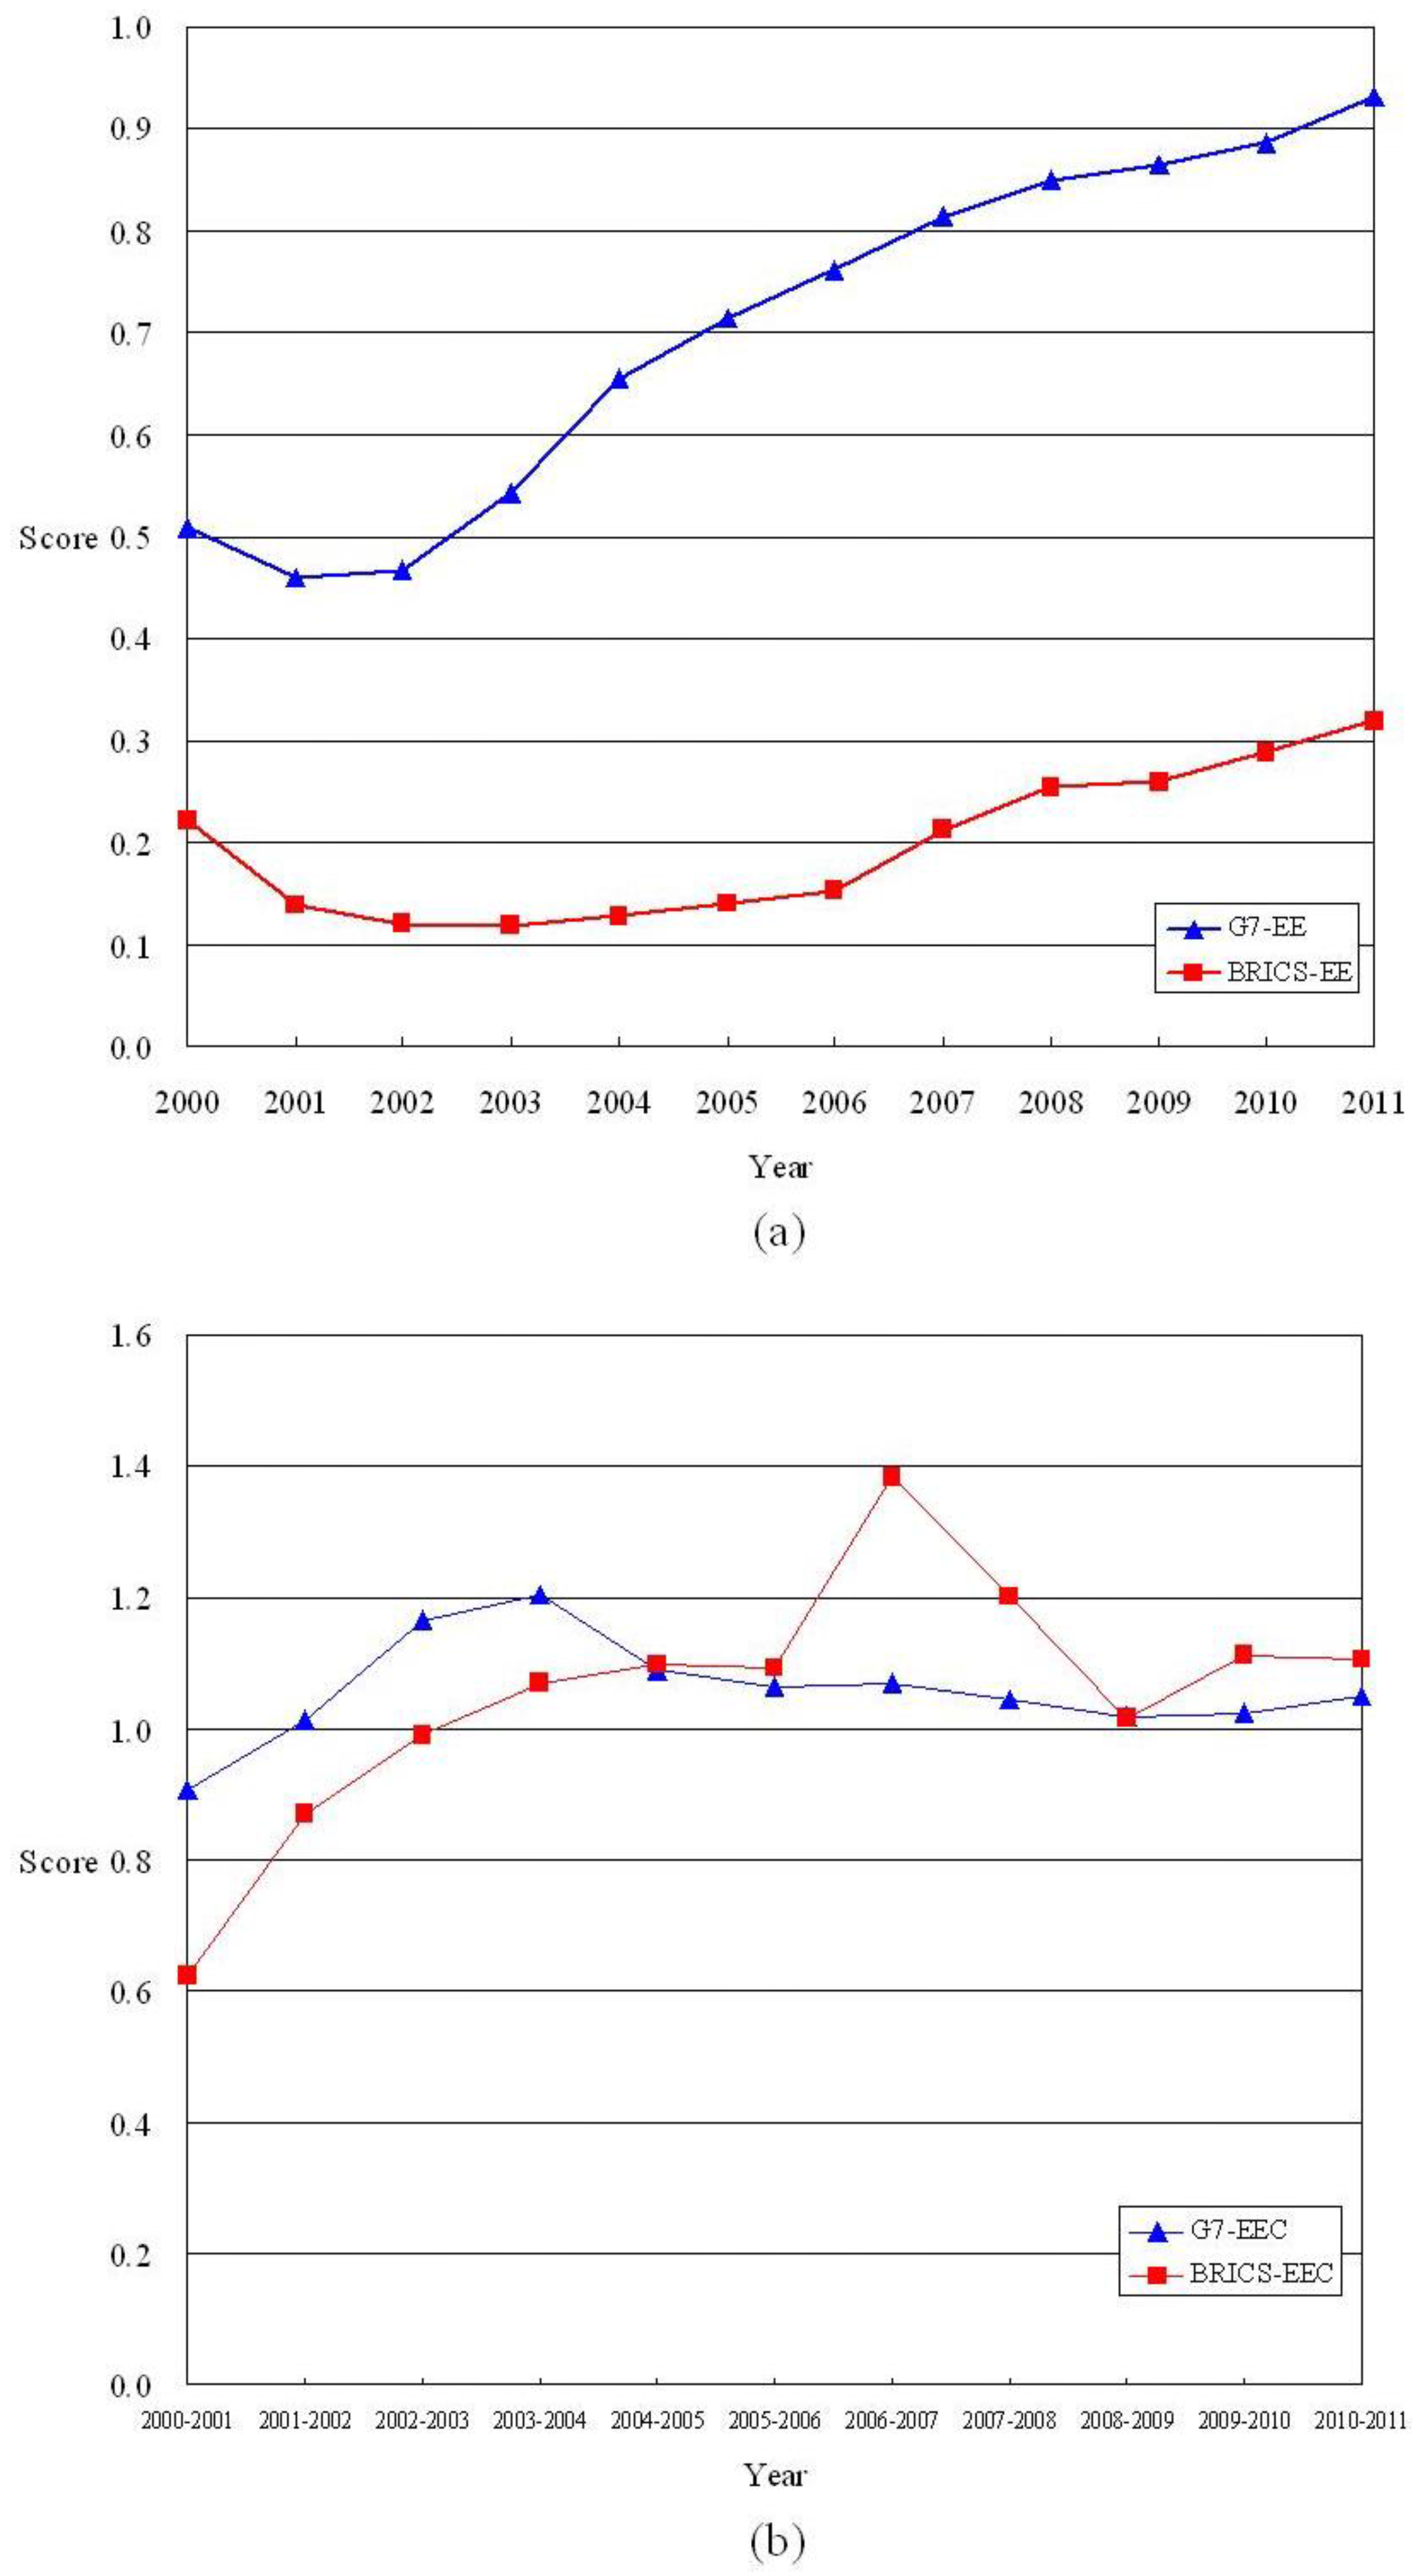
3.2. Energy Efficiency and Energy Efficiency Change

Table 2 arranges the energy efficiency scores of the 12 countries from 2000 to 2011. During the whole data period, the countries with the best energy efficiency score are Italy, Japan, and the USA in the G7, and only South Africa in BRICS. Typically, countries in the G7 have a better energy efficiency score than those in BRICS. The energy efficiency scores of the U.S. continuously improve during the data period, while China also has a similar situation, except for a slight deterioration in 2001. Hence, applying the progressive time weight could show the DMU’s behavior change on energy use.
South Africa always has a low energy efficiency score, except for 2000, when its energy efficiency score was 1. Its lowest energy efficiency score is 0.145, which appeared in 2009. The result seems to match South Africa’s GDP growth rate since it had a negative GDP growth rate (−1.5%) for the financial crisis year of 2009, while it had a decent GDP growth rate (4.2%) in 2000. The United Kingdom and Brazil have the best energy efficiency in the G7 and BRICS, respectively. Song et al. [33] also conclude that Brazil has the best energy efficiency in BRICS. De Castro Camioto et al. [43] point out that the reason for Brazil’s good energy efficiency ranking is that Brazil’s government implemented national energy programs for many decades, and they are still in operation, such as the National Program for Energy Conservation since 1985, the National Program for the Rational Use of Oil Products and Natural Gas since 1991, and mandatory energy efficiency programs. In addition, the energy efficiency scores in these two groups show a large difference, because energy use in the primary data has the largest variance of all variables.
Table 3 presents the energy efficiency change. During the observation period, the USA always exhibits energy efficiency progress, which also shows up in Table 2, where energy efficiency in the USA continuously improves. China also has the same situation as the USA in that its energy efficiency continuously progresses except for 2000–2001. This outcome implies that the energy efficiencies in the USA and China are closer and closer to the best frontier and present the catching up effect. After 2002, the 12 countries of the G7 and BRICS exhibited the catching up effect, since many of them showed energy efficiency progress. However, the 2008 financial crisis resulted in energy efficiency regression for many countries. Hence, the economic situation has an influence on energy efficiency and energy efficiency change since higher (lower) economic development creates more (less) GDP to improve (deteriorate) energy efficiency under a low demand elasticity of energy. The 1997 Kyoto Protocol focuses on the issue of climate change mitigation by reducing greenhouse gases (GHG), but the protocol also indirectly caused energy efficiency improvement. In Table 3, many countries showed energy efficiency progress when the Kyoto Protocol came into force in 2005.

3.3. Group Energy Efficiency and Group Energy Efficiency Change

This study depicts the trends of energy efficiency and energy efficiency change for the two groups in Figure 2a,b, respectively. The result in Figure 2a shows that the energy efficiency of the G7 group is always superior to the BRICS group. This result is the same as that in Chang [42], in which the room for improvement of energy intensity for BRICS is always larger than that in the G7. Although there is an energy efficiency gap between the G7 and BRICS, both of their energy efficiency trends are the same, except 2001–2002. The energy efficiencies for the two groups increase fast after 2005, when the Kyoto Protocol came into force. The 2008 financial crisis had a larger influence on BRICS than the G7, and hence the energy efficiency improvement in the BRICS group slowed down more than that in the G7 group. The result illustrates that both climate regulation (Kyoto Protocol) and an economic shock (the 2008 financial crisis) had an influence on energy efficiency. The former is a positive power to improve energy efficiency, while the latter is a negative power to make energy efficiency deteriorate.
Although the energy efficiency of BRICS always falls behind the G7, there is a surprise result in Figure 2b, in which the energy efficiency progress in BRICS is greater than that in the G7 after 2004–2005, except for the financial crisis of 2008–2009, when the two economic blocs have similar energy efficiency change. Figure 2a illustrates that the 2008 financial crisis reduced the energy efficiency of BRICS more than that of the G7; Figure 2b also shows that the 2008 financial crisis made BRICS exhibit smaller energy efficiency progress than the G7. The result implies that the 2008 financial crisis had a larger shock on the developing countries in BRICS versus the developed countries in the G7. Chang [42] also points out that the room for improvement of energy intensity in the BRICS group suddenly rocketed during the 2008 financial crisis.

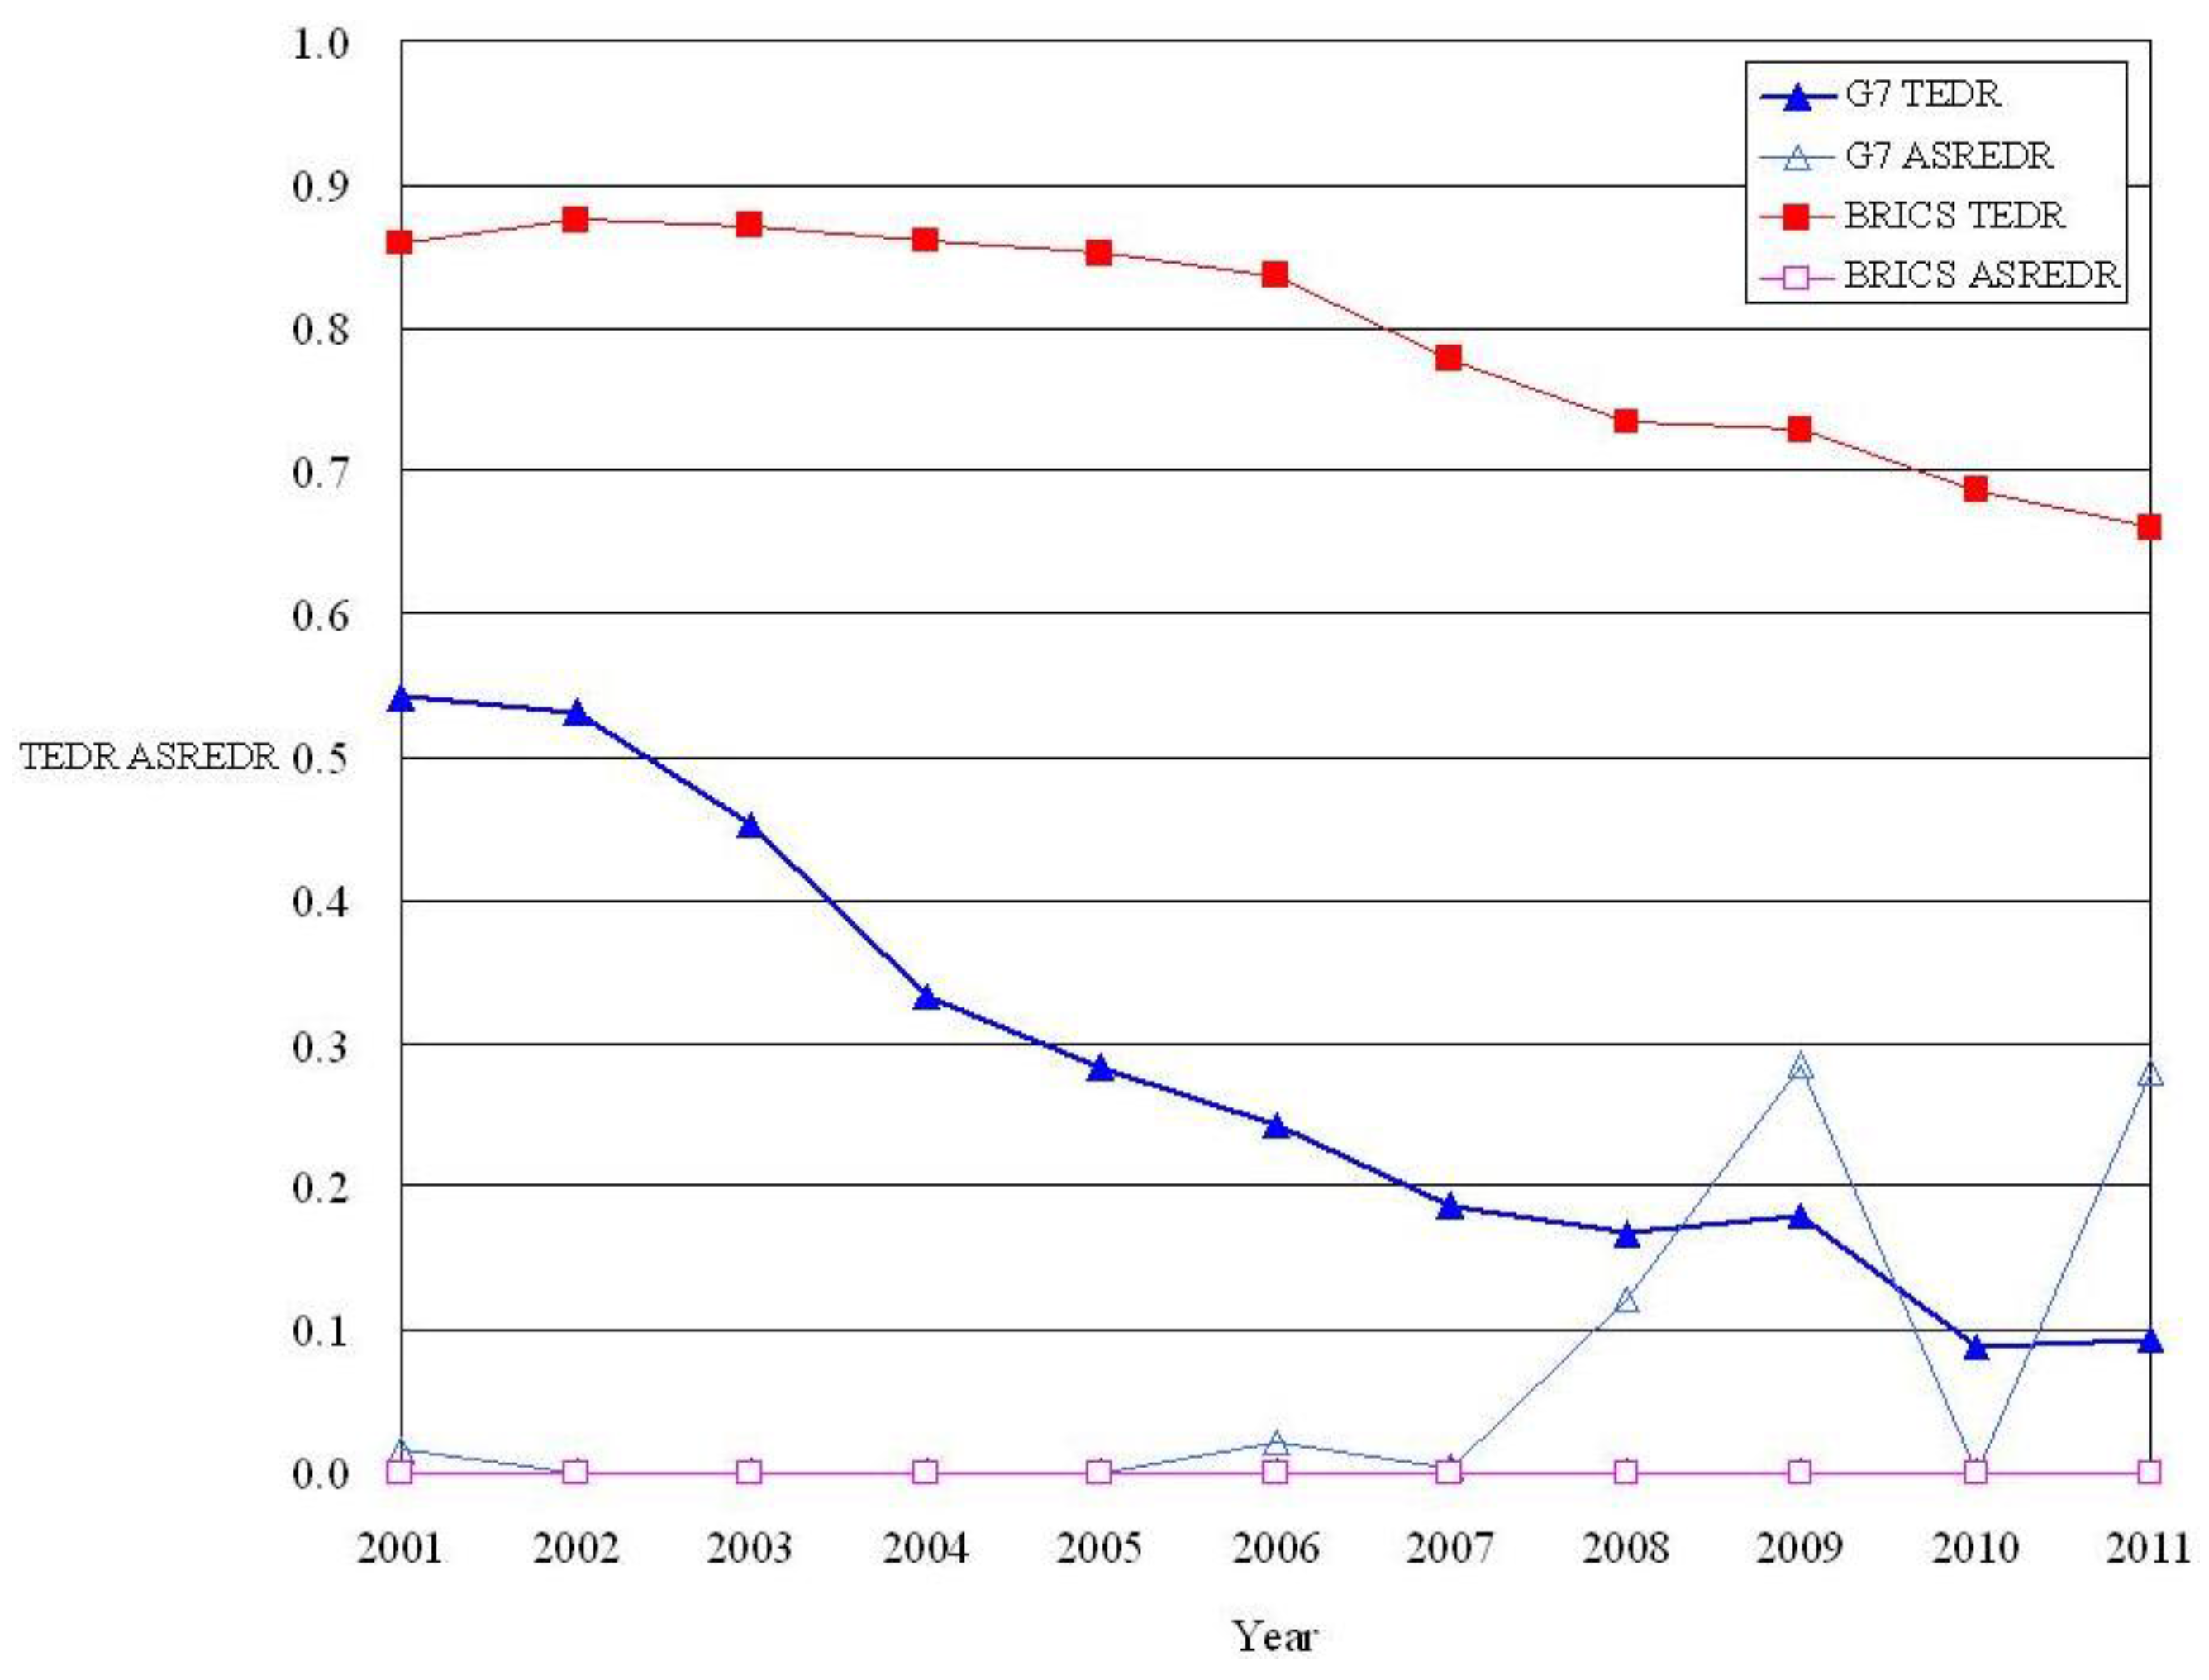
3.4. Energy Decoupling Rate and the Achievement Standard Ratio of the Energy Decoupling Rate

Table 4 estimates the energy decoupling rate, the target energy decoupling rate, and the achievement standard ratio of the energy decoupling rate for the 12 countries in the G7 and BRICS by Equations (6), (7), and (10). Generally speaking, the energy decoupling rates in many BRICS members are far lower than their target energy decoupling rates, and the phenomenon of a big gap between the energy decoupling rate and the target energy decoupling rate is more obvious in BRICS members than in G7 members. The achievement standard ratios of the energy decoupling rate for China and India are always 0% during the data period. The countries with a 100% achievement standard ratio of the energy decoupling rate are all in the G7: Italy in 2008, Japan in 2011, the United Kingdom in 2007, and the USA in 2011. Countries in BRICS with a small positive achievement standard ratio of the energy decoupling rate include Brazil in 2009, Russia in 2002 and 2009, and South Africa in 2002, 2006, 2009, and 2011.
For the case of a country with a 100% achievement standard ratio of the energy decoupling rate, Japan has the highest energy decoupling rate at 7% in 2011. Hence, Japan is a good case to explain what causes it to have the highest energy decoupling rate of 7% and a 100% achievement standard ratio of the energy decoupling rate in 2011. On 11 March 2011, Fukushima Nuclear Power Plant in Japan suffered major damage from the tsunami caused by the magnitude 9.0 earthquake. After the Fukushima event, only 11 of the 54 nuclear plants in Japan operated normally, with the remainder of them having stopped operations and shut down for 13 months due to regulatory requirements and protective maintenance. At the same time, the Japan government announced a plan to increase renewable energy supply from the current less than 10% level to 20% by the 2020s. During the 13 months after the Fukushima event, the nation’s main power sources came from both solar and wind power. This active development on renewable energy reduced dependence on conventional energy.
Figure 3 illustrates the target energy decoupling rate and the achievement standard ratio of the energy decoupling rate for the G7 and BRICS groups. The target energy decoupling rate for the BRICS group is always higher than that for the G7, which means that the BRICS group should put a lot more effort than the G7 into achieving energy decoupling on energy use. In 2011, the target energy decoupling rate for the G7 group is less than 10%, but the target energy decoupling rate for the BRICS group is near 70%, which means that the G7 has a lower threshold than BRICS to reach optimal energy use. The decreasing trends of the target energy decoupling rate for the two groups mean that the G7 and BRICS easily reach optimal energy use. The target of the energy decoupling rates for the G7 continuously goes down except for slight increments in 2009 and 2011. The G7 has a positive achievement standard ratio of the energy decoupling rate at 2%, 2%, 12%, 28%, and 28% for 2001, 2006, 2008, 2009, and 2011, respectively. The target energy decoupling rate for BRICS is higher than that for the G7, and the achievement standard ratio of the energy decoupling rate for BRICS is always 0% during the whole data period. The result shows that BRICS has larger room for improvement on the achievement standard ratio of the energy decoupling rate versus the G7.

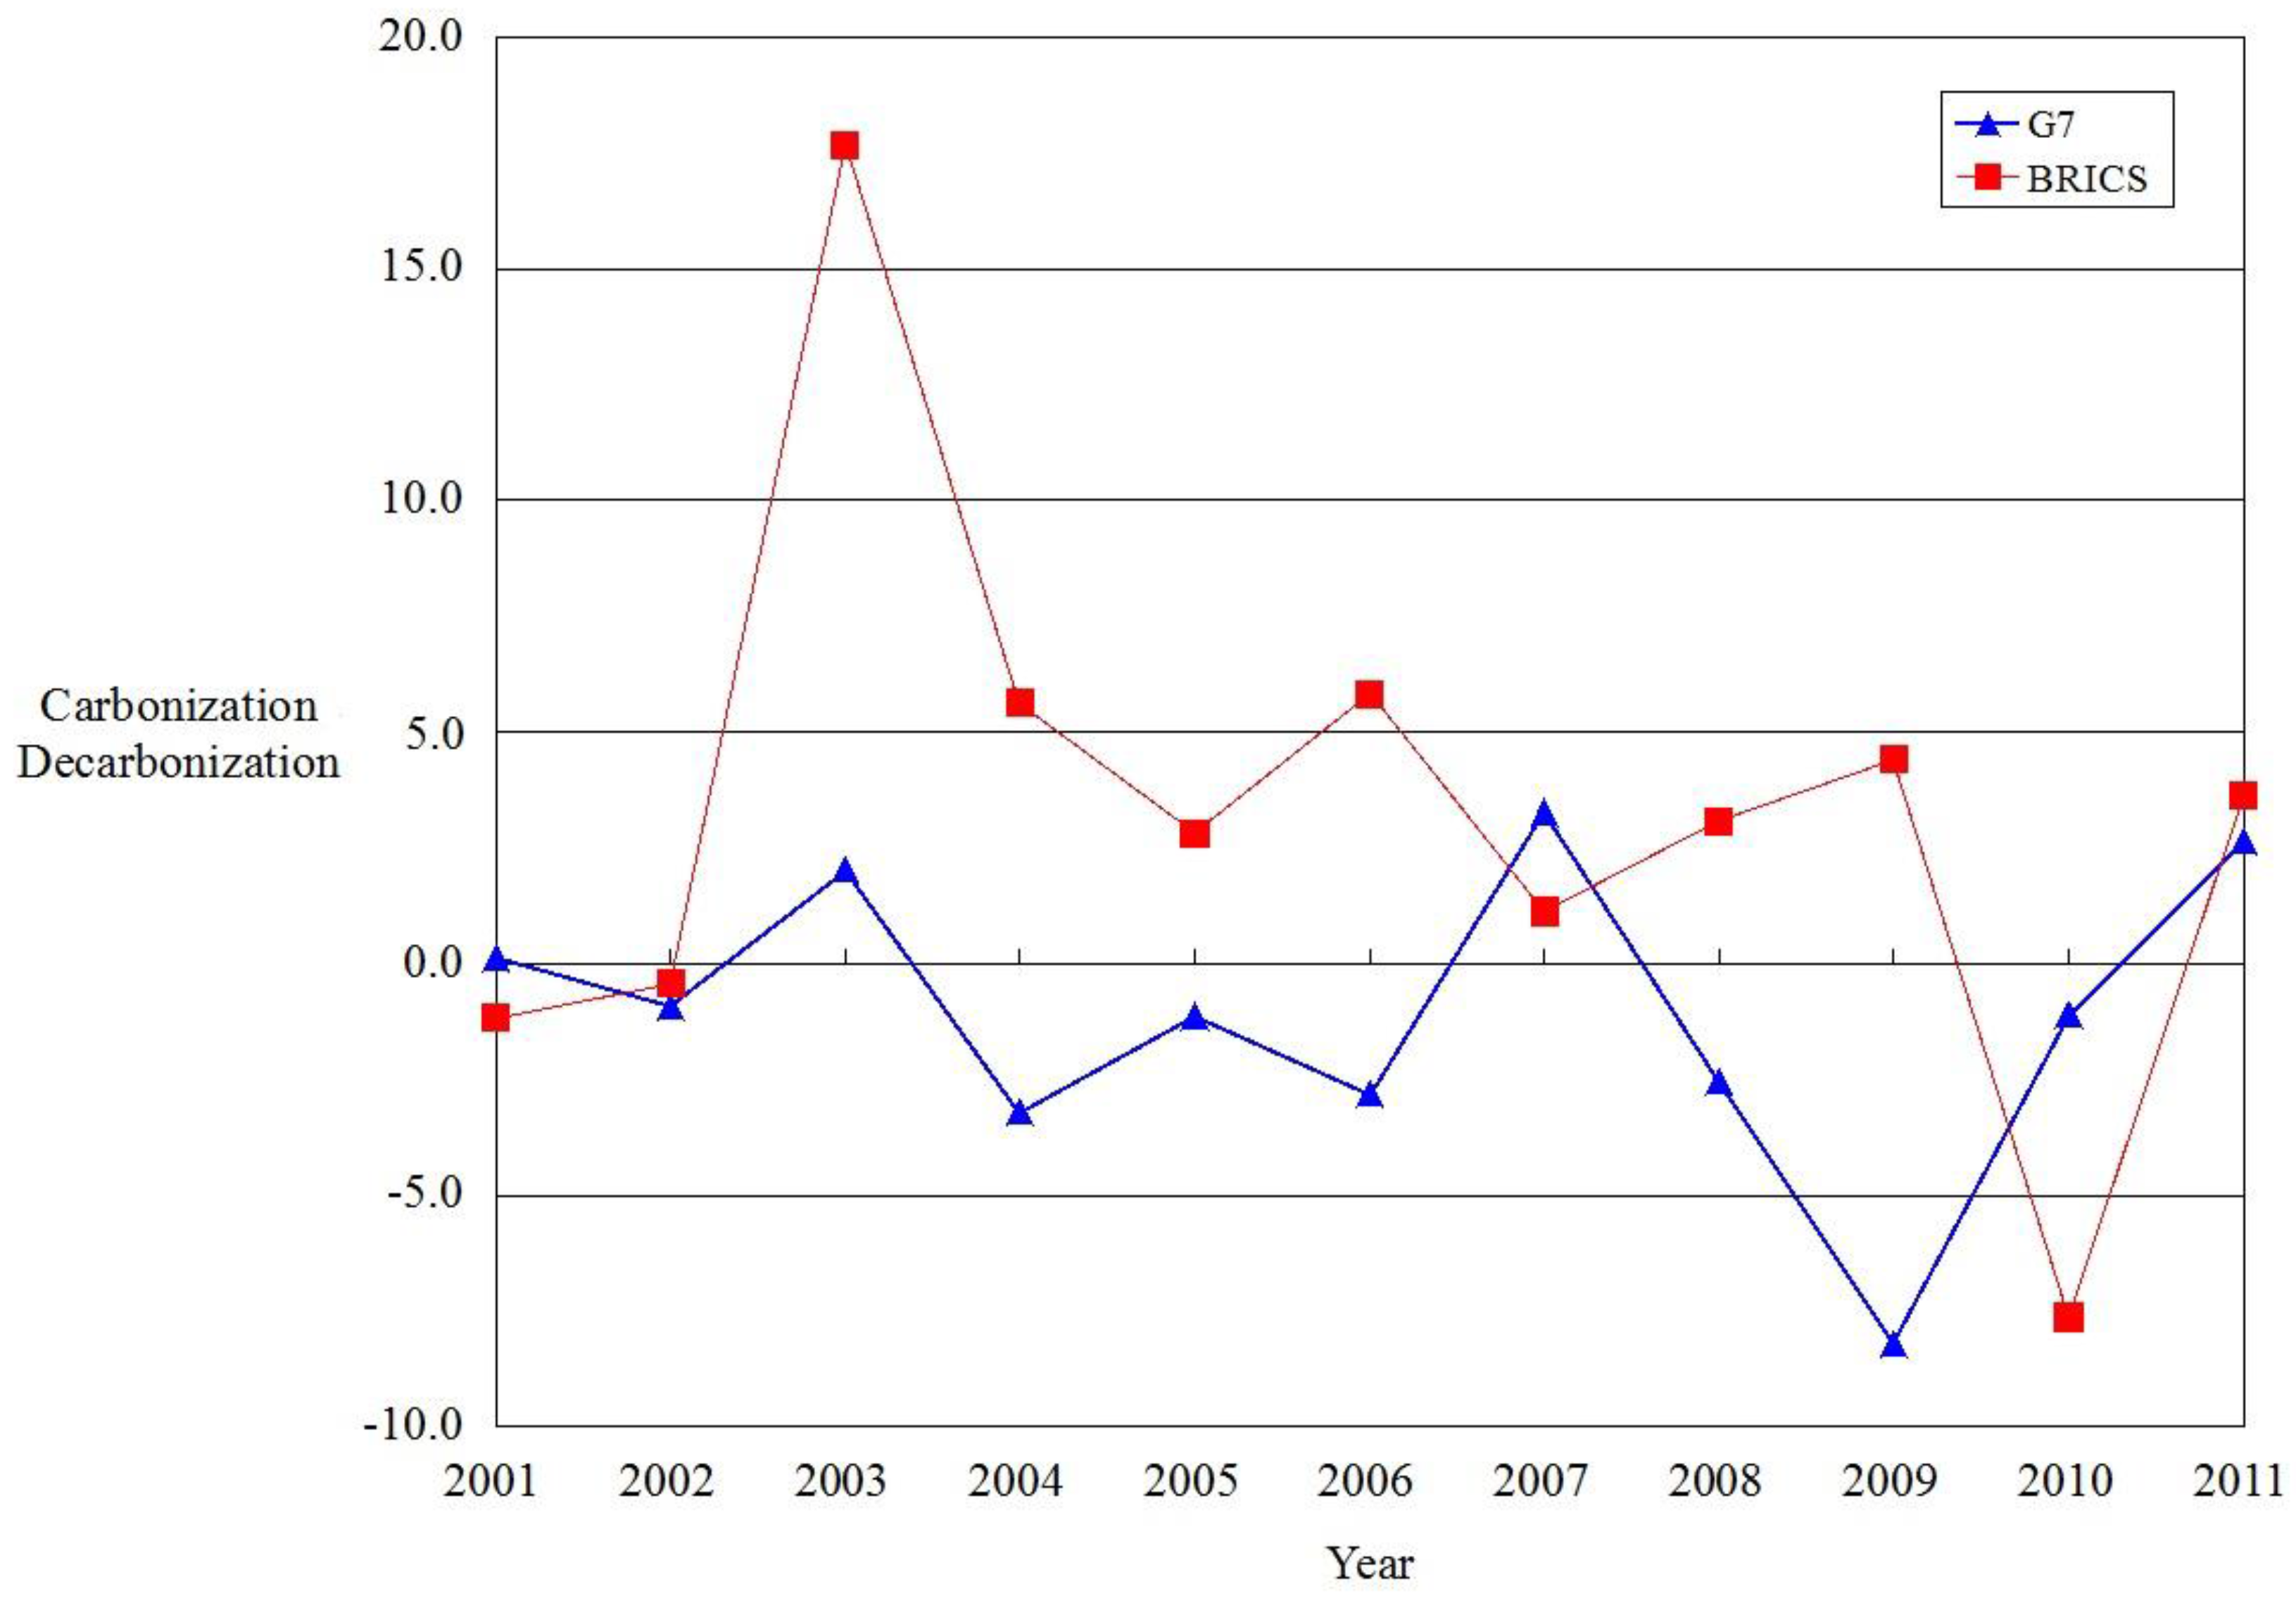
3.5. Decarbonization or Carbonization for the Two Groups of Countries

Decarbonization means decoupling CO2 emissions from energy use, and carbonization means that CO2 emissions are still correlated to energy use. This study tests for decarbonization and carbonization by using the method in Mielnik and Goldemberg [44], whereby the change in the carbonization index over the carbonization index is an estimation index, and the carbonization index is defined as CO2 emissions over energy use, i.e., CO2 emissions/energy use (CO2/E). Hence, the estimation index of decarbonization and carbonization can be represented as τ = Δ(CO2/E)/(CO2/E), where Δ(CO2/E) means the change in the carbonization index. Here, τ < 0 implies that decarbonization of the economy occurs, and the economy switches away from high carbon; τ > 0 implies that carbonization of the economy occurs, and the economy switches to high carbon; τ = 0 implies that both decarbonization and carbonization of the economy do not occur, and the economy remains constant over time.
The estimation results of decarbonization and carbonization with respect to the G7 and BRICS groups appear in Figure 4, in which most of the time the G7 is in a decarbonization situation, while most of the time BRICS exists under carbonization. This phenomenon is likely to satisfy the environmental Kuznets Curve (EKC) assumption that environmental quality deteriorates when a country is in the beginning of economic development until a critical income; after the critical income, environmental quality improves through an increase in income. Figure 4 shows that the G7, which has high income, exhibits better environmental quality (decarbonization) than BRICS, which has low income.
The Kyoto Protocol came into force in 2005, and the 2008 financial crisis had a great financial impact on the world. These two events prompted the G7 group to go into decarbonization, but made the BRICS group move toward carbonization since the developed countries in the G7 have a heavier duty to implement CO2 emissions reduction than the developing countries in BRICS under the Kyoto Protocol framework. The 2008 financial crisis brought about a depressed economy with fewer CO2 emissions and lower energy use, hence promoting decarbonization in the G7. However, the G7 and BRICS groups do not converge to decarbonization.

4. Policy Implication

Energy efficiency improvement is one available way to reduce CO2 emissions. Hence, energy consumption reduction and energy efficiency improvement can be seen as short-term targets, while CO2 emissions reduction and climate change mitigation can be seen as long-term targets. The results show that BRICS has larger room for improvement on the energy decoupling rate than does the G7, but BRICS exhibits more rapid improvement on energy efficiency than the G7. Furthermore, the carbonization index test shows that G7 and BRICS do not converge to decarbonization in the long term.
The reason that BRICS has larger room for improvement on the energy decoupling rate than the G7 is caused by its traditional industry structure of high energy consumption and high emissions. A useful improvement method is to optimize the industry construction by increasing investments in energy and environmental technology to upgrade the technical level and also developing renewable energy technology. In BRICS, Brazil has exhibited good performance on energy efficiency. Brazil has insisted on renewable energy development after it experienced a severe electricity supply crisis in 2011. In addition, energy efficiency in China has been continuously increasing from 2000 to 2011. Song et al. [33] indicate that China has recently started to emphasize energy savings, energy technological innovation, industrial structure optimization, and new energy research and development. Some policies by Brazil and China may be the reason that BRICS exhibits more rapid energy efficiency improvement than the G7.
EKC asserts that environmental quality and economic growth show an inverted-U shaped relation in which environmental quality will deteriorate as the economy grows. After a critical point, environmental quality will then improve as the economy continuously grows. The empirical result of the paper finds that the economy development process for G7 and BRICS similarly satisfies the EKC shape. Based on the EKC viewpoint, economic growth is helpful for the improvement of environmental quality. A developed country’s energy or environmental technology enables the transfer of it to developing countries through the Clean Development Mechanism (CDM), which is defined in Article 10 of the Kyoto Protocol. The advanced technology to reduce production cost can indirectly increase a country’s wealth and further improve environmental quality. Freitas et al. [45] find that CDM has shown the effects of national diffusion and technological scope difference, such that Brazil hosts many CDM projects on biomass energy and hydropower technologies, China does so on hydropower and wind technologies, India on biomass and wind energy technologies, and Russia on energy efficiency technologies. The energy policy for G7 is a leader in the energy direction of BRICS, after Dechezleprêtre et al. [46] point out that the origin of CDM equipment mainly comes from European suppliers, including Germany, Spain, and Denmark, and non-European suppliers like the USA and Japan. Most CDM equipment suppliers are from the G7.

5. Conclusions

Energy use brings economic development to a country, but CO2 emissions are the byproduct of energy use and contribute to global warming and climate change, which affect economic development and environmental ecology. Improving energy use efficiency is one of the more effective ways to reduce energy use and mitigate global warming and climate change. Past studies about energy efficiency do not care about a country’s behavioral change over energy use. Thus, this study employs a progressive time weight to estimate a country’s energy efficiency in response to its change in energy use over a long period of time. We also look into the issues of energy decoupling and decarbonization, which derive from energy use. The G7 group and BRICS group make up our research observations. The results show that energy efficiency for the G7 is always above BRICS, and that their energy efficiencies are quite different. After 2003, both groups of countries show improvement on energy efficiency; after 2004, the improvement amount of energy efficiency for BRICS surpassed that for the G7, except for the year 2008 covering the financial crisis.
Based on the energy decoupling rate and the target energy decoupling rate, this study estimates the achievement standard ratio of the energy decoupling rate for countries in the G7 and BRICS. During the data period, Italy, Japan, the United Kingdom, and the USA had a rate of 100%; however, this did not occur for the members of BRICS. Even so, Brazil, Russia, and South Africa have a small positive rate versus the standard during the data period. The target energy decoupling rates for the G7 and BRICS are slowly going down, implying that the two groups find it easier to achieve the threshold of energy decoupling; however, the curve of the target energy decoupling rate of BRICS is always higher than that of the G7, which means that BRICS has larger room for improvement on the energy decoupling rate than does the G7.
CO2 emissions are the byproduct of energy use. This paper uses the carbonization index to examine decarbonization or carbonization in the G7 and BRICS. For most of the data years, the G7 group presents decarbonization, while for most of the data years the BRICS group exhibits carbonization. Two events in the world, the 2005 Kyoto Protocol coming into force and the 2008 financial crisis, resulted in different directions of decarbonization and carbonization between the two groups: the G7 moved toward decarbonization and BRICS went to carbonization. For the long-term trend, the G7 and BRICS both do not converge to decarbonization.
The countries in the G7 are good references for energy efficiency, energy decoupling rate, achievement standard ratio of the energy decoupling rate, and decarbonization, but the countries in BRICS show rapid improvement in energy efficiency. The index is critical for public policies related to energy efficiency improvement and decarbonization. Realizing economic growth by minimizing energy use and without harming the environment can bring much benefit to economic development and environmental protection. This study thus examines energy efficiency in the G7 and BRICS from a long-term viewpoint. A future study can compare differences in energy efficiency and energy policy in the long term and in the short term. A long-term analysis can apply the dynamic DEA model and a short-term analysis can use the static DEA model.

Author Contributions

Ming-Chung Chang contributed to the experiment performance, including the model design, data analysis, and paper writing. Chia-Jung Tu and Chiang-Ping Chen contributed to the data and literature collection as well as raw data treatment.

Conflicts of Interest

The authors declare no conflict of interest.

References

  1. Douglas, J. India Claims Its Emissions Cause No Harm to World’s Atmosphere. Available online: http://www.naturalnews.com/021335_global_warming_India.html (accessed on 21 December 2006).
  2. Boyd, G.A.; Pang, J.X. Estimating the linkage between energy efficiency and productivity. Energy Policy 2000, 28, 289–296. [Google Scholar] [CrossRef]
  3. Hu, J.L.; Wang, S.C. Total-factor energy efficiency of regions in China. Energy Policy 2006, 34, 3206–3217. [Google Scholar] [CrossRef]
  4. Han, Z.Y.; Fan, Y.; Jiao, J.L.; Yan, J.S.; Wei, Y.M. Energy structure, marginal efficiency and substitution rate: An empirical study of China. Energy 2007, 32, 935–942. [Google Scholar] [CrossRef]
  5. Hu, J.L.; Kao, C.H. Efficient energy-saving targets for APEC economies. Energy Policy 2007, 35, 373–382. [Google Scholar] [CrossRef]
  6. Zhang, X.P.; Cheng, X.M.; Yuan, J.H.; Gao, X.J. Total-factor energy efficiency in developing countries. Energy Policy 2011, 39, 644–650. [Google Scholar] [CrossRef]
  7. Wei, Y.M.; Liao, H.; Fan, Y. An empirical analysis of energy efficiency in China’s iron and steel sector. Energy 2007, 32, 2262–2270. [Google Scholar] [CrossRef]
  8. Munkherjee, K. Measuring energy efficiency in the context of an emerging economy: The case of Indian manufacturing. Eur. J. Oper. Res. 2010, 201, 933–941. [Google Scholar] [CrossRef]
  9. Honma, S.; Hu, J.L. Industry-level total-factor energy efficiency in developed countries: A Japan-centered analysis. Appl. Energy 2014, 119, 67–78. [Google Scholar] [CrossRef]
  10. Honma, S.; Hu, J.L. Total-factor energy efficiency of regions in Japan. Energy Policy 2008, 36, 821–833. [Google Scholar] [CrossRef]
  11. Färe, R.; Grosskopf, S. Intertemporal Production Frontiers: With Dynamic DEA; Kluwer Academic Publishers: Boston, MA, USA, 1996. [Google Scholar]
  12. Caves, D.W.; Christensen, L.R.; Diewert, W.E. The economic theory of index numbers and the measurement of input, output, and productivity. Econometrica 1982, 50, 1393–1414. [Google Scholar] [CrossRef]
  13. Färe, R.; Grosskopf, S.; Norris, M.; Zhang, Z. Productivity growth, technical progress, and efficiency change in industrialized countries. Am. Econ. Rev. 1994, 84, 66–83. [Google Scholar]
  14. Honma, S.; Hu, J.L. Total-factor energy productivity growth of regions in Japan. Energy Policy 2009, 37, 3941–3950. [Google Scholar] [CrossRef]
  15. Chang, T.P.; Hu, J.L. Total-factor energy productivity growth, technical progress, and efficiency change: An empirical study of China. Appl. Energy 2010, 87, 3262–3270. [Google Scholar] [CrossRef]
  16. Chang, M.C. Applying the energy productivity index that considers maximized energy reduction on SADC (Southern Africa Development Community) members. Energy 2016, 95, 313–323. [Google Scholar] [CrossRef]
  17. Tone, K.; Tsutsui, M. Dynamic DEA: A slacks-based measure approach. Omega 2010, 38, 145–156. [Google Scholar] [CrossRef]
  18. Kao, C. Dynamic data envelopment analysis: A relational analysis. Eur. J. Oper. Res. 2013, 227, 325–330. [Google Scholar] [CrossRef]
  19. Farrell, M.J. The measurement of productive efficiency. J. R. Stat. Soc. Ser. A (Gen.) 1957, 120, 253–290. [Google Scholar] [CrossRef]
  20. Charnes, A.; Cooper, W.W.; Rhodes, E. Measuring the efficiency of decision making units. Eur. J. Oper. Res. 1978, 2, 429–444. [Google Scholar] [CrossRef]
  21. Førsund, F.R. Weight restrictions in DEA: Misplaced emphasis? J. Prod. Anal. 2013, 40, 271–283. [Google Scholar] [CrossRef]
  22. Allen, R.; Athanassopoulos, A.; Dyson, R.G.; Thanassoulis, E. Weights restrictions and value judgements in data envelopment analysis: Evolution, development and future directions. Ann. Oper. Res. 1997, 73, 13–34. [Google Scholar] [CrossRef]
  23. Podinovski, V.V. Side effects of absolute weight bounds in DEA models. Eur. J. Oper. Res. 1999, 115, 583–595. [Google Scholar] [CrossRef]
  24. Oikonomou, N.; Tountas, Y.; Mariolis, A.; Souliotis, K.; Athanasakis, K.; Kyriopoulos, J. Measuring the efficiency of the Greek rural primary health care using a restricted DEA model; the case of southern and western Greece. Health Care Manag. Sci. 2015. [Google Scholar] [CrossRef] [PubMed]
  25. Podinovski, V.V.; Bouzdine-Chameeva, T. On single-stage DEA models with weight restrictions. Eur. J. Oper. Res. 2016, 248, 1044–1050. [Google Scholar] [CrossRef] [Green Version]
  26. Dyson, R.G.; Thanassoulis, E. Reducing weight flexibility in data envelopment analysis. J. Oper. Res. Soc. 1988, 39, 563–576. [Google Scholar] [CrossRef]
  27. Wong, Y.H.; Beasley, J.E. Restricting weight flexibility in data envelopment analysis. J. Oper. Res. Soc. 1990, 41, 829–835. [Google Scholar] [CrossRef]
  28. Thompson, R.G.; Langemeier, L.N.; Lee, C.T.; Lee, E.; Thrall, R.M. The role of multiplier bounds in efficiency analysis with application to Kansas farming. J. Econom. 1990, 46, 93–108. [Google Scholar] [CrossRef]
  29. Cook, W.D.; Zhu, J. CAR-DEA: Context-dependent assurance regions in DEA. Oper. Res. 2008, 56, 69–78. [Google Scholar] [CrossRef]
  30. Guo, X.D.; Zhu, L.; Fan, Y.; Xie, B.C. Evaluation of potential reductions in carbon emissions in Chinese provinces based on environmental DEA. Energy Policy 2011, 39, 2352–2360. [Google Scholar] [CrossRef]
  31. Zhou, P.; Ang, B.W. Linear programming models for measuring economy-wide energy efficiency performance. Energy Policy 2008, 38, 2911–2916. [Google Scholar] [CrossRef]
  32. Mandal, S.K. Do undesirable output and environmental regulation matter in energy efficiency analysis? Evidence from Indian cement industry. Energy Policy 2010, 38, 6076–6083. [Google Scholar] [CrossRef]
  33. Song, M.L.; Zhang, L.L.; Liu, W.; Fisher, R. Bootstrap-DEA analysis of BRICS’ energy efficiency based on small sample data. Appl. Energy 2013, 112, 1049–1055. [Google Scholar] [CrossRef]
  34. Wu, F.; Fan, L.W.; Zhou, P.; Zhou, D.Q. Industrial energy efficiency with CO2 emissions in China: A nonparametric analysis. Energy Policy 2012, 49, 164–172. [Google Scholar] [CrossRef]
  35. Zhou, P.; Ang, B.W.; Zhou, D.Q. Measuring economy-wide energy efficiency performance: A parametric frontier approach. Appl. Energy 2012, 90, 196–200. [Google Scholar] [CrossRef]
  36. Coelli, T.J.; Prasada Rao, D.S.; O’Donnell, C.J.; Battese, G.E. An Introduction to Efficiency and Productivity Analysis, 2nd ed.; Kluwer Academic Publishers: Boston, MA, USA, 2005. [Google Scholar]
  37. Wang, Z.; Feng, C.; Zhang, B. An empirical analysis of China’s energy efficiency from both static and dynamic perspectives. Energy 2014, 74, 322–330. [Google Scholar] [CrossRef]
  38. Kumar, M.; Vincent, C. Benchmarking Indian banks using DEA in post-reform period: A progressive time-weighted mean approach. Serv. Ind. J. 2011, 31, 2455–2485. [Google Scholar] [CrossRef]
  39. Organization for Economic Co-operation and Development (OECD). Indicators to Measure Decoupling of Environmental Pressure from Economic Growth; OECD: Paris, France, 2002. [Google Scholar]
  40. Mudgal, S.; Fischer-Kowalski, M.; Krausmann, F.; Chenot, B.; Lockwood, S.; Mitsios, A.; Schaffartzik, A.; Eisenmenger, N.; Cachia, F.; Steinberger, J.; et al. Preparatory Study for the Review of the Thematic Strategy on the Sustainable Use of Natural Resources; Contract 07.0307/2009/545482/ETU/G2; European Commission, DG Environment: Paris, France, 2010. [Google Scholar]
  41. Choi, Y.; Zhang, N.; Zhou, P. Efficiency and abatement costs of energy-related CO2 emissions in China: A slacks-based efficiency measure. Appl. Energy 2012, 98, 198–208. [Google Scholar] [CrossRef]
  42. Chang, M.C. Room for improvement in low carbon economies of G7 and BRICS countries based on the analysis of energy efficiency and environmental Kuznets curves. J. Clean Prod. 2015, 99, 140–151. [Google Scholar] [CrossRef]
  43. De Castro Camioto, F.; Moralles, H.F.; Mariano, E.B.; do Nascimento Rebelatto, D.A. Energy efficiency analysis of G7 and BRICS considering total-factor structure. J. Clean Prod. 2016, 122, 67–77. [Google Scholar] [CrossRef]
  44. Mielnik, O.; Goldemberg, J. Communication: The evolution of the “carbonization index” in developing countries. Energy Policy 1999, 27, 307–308. [Google Scholar] [CrossRef]
  45. Freitas, I.M.B.; Dantas, E.; Iizuka, M. The Kyoto mechanisms and the diffusion of renewable energy technologies in the BRICS. Energy Policy 2012, 42, 118–128. [Google Scholar] [CrossRef]
  46. Dechezleprêtre, A.; Glachant, M.; Ménière, Y. The Clean Development Mechanism and the international diffusion of technologies: An empirical study. Energy Policy 2008, 36, 1273–1283. [Google Scholar] [CrossRef] [Green Version]
Figure 1. Energy efficiency estimation in a dynamic system.
Sustainability 08 00928 g001
Figure 2. Group energy efficiency (a) and group energy efficiency change (b).
Sustainability 08 00928 g002
Figure 3. Target energy decoupling rate and achievement standard ratio of the energy decoupling rate.
Sustainability 08 00928 g003
Figure 4. Carbonization or decarbonization for the G7 and BRICS.
Sustainability 08 00928 g004
Table 1. Descriptive statistics of the data for the 12 countries in the G7 and BRICS.
InputOutput
Real Capital Formation (Million US$)Labors (Person)Energy Use (Kt of Oil Equivalent)Real GDP (Million US$)CO2 (Kt)
Average734,549.262182,550,885.166613,141,077.3403,111,505.9771,595,256.679
Max3,497,032.681929,306,700.7342,746,916,231.00015,225,673.4999,019,518.215
Min29,125.90618,113,710.997109,056,448.000178,928.298320,173.104
St. Dev.836,267.091277,526,531.327676,387,424.7273,595,787.1481,960,428.391
Table 2. Energy efficiency in PTW-DEEM of the 12 countries in the G7 and BRICS.
Country Name200020012002200320042005200620072008200920102011Average
Canada0.4950.2940.2580.2630.2830.3090.3370.3750.3880.3650.4180.4560.353
France0.8030.4870.4640.5250.5720.5770.6050.6880.7300.7020.6650.7560.631
Germany0.5610.4460.4620.5450.5950.5980.6180.7720.8380.8150.7770.8930.660
Italy1.0000.6380.6080.6750.7330.7280.7530.8471.0000.8770.8110.8870.796
Japan0.6290.5310.5080.5490.6070.6270.6120.6290.7300.8110.8541.0000.674
United Kingdom0.8400.6100.6310.6880.7950.8120.8611.0000.9500.8000.8160.9250.811
United States0.3730.4350.4550.5530.7090.8040.8760.9050.9240.9651.0001.0000.750
Brazil0.9920.4720.3350.2940.2960.3500.3970.4530.4900.4740.5430.6290.477
China0.0920.0910.0940.0970.1030.1130.1250.2000.2730.3050.3340.3730.183
India0.1880.1380.1270.1380.1450.1530.1550.1940.1740.1630.1790.1710.160
Russian Federation0.1240.0940.0870.0900.1100.1240.1450.1870.2120.1450.1620.1810.138
South Africa1.0000.3300.2050.1890.1910.2000.1970.1850.1470.1450.1750.1840.262
Table 3. Energy efficiency change of the 12 countries in the G7 and BRICS.
Country Name2000–20012001–20022002–20032003–20042004–20052005–20062006–20072007–20082008–20092009–20102010–2011
Canada0.5930.8791.0211.0761.0911.0911.1111.0360.9401.1451.092
France0.6060.9531.1311.0901.0091.0481.1381.0600.9610.9471.137
Germany0.7951.0351.1811.0921.0041.0331.2491.0860.9720.9531.150
Italy0.6380.9541.1091.0870.9931.0351.1241.1810.8770.9251.094
Japan0.8450.9561.0821.1051.0330.9751.0291.1601.1111.0531.171
United Kingdom0.7261.0341.0911.1561.0221.0601.1610.9500.8431.0201.133
United States1.1651.0481.2131.2821.1351.0891.0331.0211.0441.0371.000
Brazil0.4760.7100.8771.0091.1791.1361.1401.0830.9671.1451.159
China0.9941.0321.0301.0681.0941.1041.6041.3651.1161.0941.116
India0.7330.9241.0801.0511.0581.0121.2510.8970.9381.0970.959
Russian Federation0.7560.9271.0351.2211.1341.1671.2891.1350.6831.1151.119
South Africa0.3300.6230.9221.0081.0500.9830.9400.7930.9881.2021.056
Table 4. Energy decoupling rate, target energy decoupling rate, and achievement standard ratio of the energy decoupling rate of the 12 countries in the G7 and BRICS.
Country NameIcon20012002200320042005200620072008200920102011
CanadaEDR1%0%0%0%0%0%2%0%6%0%0%
TEDR71%74%72%71%69%66%63%61%66%58%54%
ASREDR2%0%0%0%0%0%4%1%9%0%0%
FranceEDR0%0%0%0%0%1%1%0%4%0%4%
TEDR50%54%47%42%42%40%32%27%33%31%27%
ASREDR0%0%0%0%0%4%4%0%13%0%13%
GermanyEDR0%2%1%0%1%0%5%0%6%0%5%
TEDR54%55%46%40%41%37%27%15%24%18%15%
ASREDR0%4%1%0%2%0%20%0%27%0%33%
ItalyEDR0%0%0%0%0%1%1%2%6%0%2%
TEDR36%39%30%26%26%26%16%2%18%16%13%
ASREDR0%0%0%0%0%4%8%100%35%0%14%
JapanEDR2%0%1%0%0%0%1%4%5%0%7%
TEDR48%49%46%37%38%39%38%30%23%10%7%
ASREDR3%0%2%0%1%0%2%13%20%0%100%
United KingdomEDR0%2%0%0%0%2%4%2%6%0%7%
TEDR39%38%30%21%18%15%4%7%24%16%14%
ASREDR0%6%0%1%0%11%100%27%23%0%51%
United StatesEDR2%0%0%0%0%1%0%3%5%0%1%
TEDR57%54%45%28%19%13%8%10%8%1%1%
ASREDR3%0%0%0%0%7%0%26%59%0%100%
BrazilEDR0%0%0%0%0%0%0%0%3%0%0%
TEDR52%66%70%69%64%59%52%48%54%40%36%
ASREDR0%0%0%0%0%0%0%0%6%0%0%
ChinaEDR0%0%0%0%0%0%0%0%0%0%0%
TEDR91%90%89%88%88%86%79%72%67%63%59%
ASREDR0%0%0%0%0%0%0%0%0%0%0%
IndiaEDR0%0%0%0%0%0%0%0%0%0%0%
TEDR86%87%86%85%84%84%79%82%82%81%82%
ASREDR0%0%0%0%0%0%0%0%0%0%0%
Russian FederationEDR0%0%0%0%0%0%0%0%6%0%0%
TEDR91%91%91%89%87%85%81%78%86%82%81%
ASREDR0%1%0%0%0%0%0%0%7%0%0%
South AfricaEDR0%2%0%0%0%1%0%0%3%0%1%
TEDR66%80%80%79%80%80%80%84%86%83%82%
ASREDR0%3%0%0%0%1%0%0%4%0%1%

