1. Introduction
The energy configuration and conditions of outdoor comfort in a city can be identified both for buildings and the spaces defined by those buildings. This urban morphology affects the local climate and inhabitants’ behavior, and its development leads to an increase in energy consumption. Its effect on outdoor comfort conditions is described by relatively simple laws derived from physics, and thermodynamics in particular.
One important consequence is the urban heat island (UHI) effect. Due to differences in the urban/rural energy balance, the ambient temperature in the city becomes significantly higher than the temperature in the surrounding rural areas due to human activities [
1]. This effect is particularly marked in the summer [
2], and living conditions in the city can become unbearable. Most studies addressing the UHI effect can roughly be categorized into numerical modeling and empirical analysis, where the latter is based on either air temperature records from weather stations or land surface temperatures from remote sensors. In recent decades, the factors causing the UHI effect given by Oke [
2] have been confirmed and further broadened through a variety of studies around the world. Compared to the non-built surroundings, built areas in cities differ considerably in albedo, thermal capacity, roughness, etc., which can significantly modify the surface energy budget [
3].
At the neighborhood scale, the heterogeneity of structures within the urban canopy (the layer between the ground and the tops of the buildings) exerts a strong influence on wind, the thermodynamic structure, and the urban boundary layer (UBL), thereby affecting air quality. Starting with this analysis, a new, transdisciplinary interpretation of the relationships between the different physical, environmental, and morphological components characterizing the city is presented with the goal of ensuring greater sustainability and sharing of the possible or planned transformations.
The worldwide spread of sustainable development has reignited the scientific debate on the form of the city. This development follows unprecedented acceptance by scholars in different disciplines who are working together on the urban form to achieve sustainability and the healthy functioning of settlements. In this respect, two prevailing settlement models—the compact city and the diffuse city—have been studied from different points of view.
From the ecological perspective, many arguments related to biodiversity conservation, for example, seem to support the compact city over the disperse city [
4,
5,
6]. However, from the point of view of transportation and energy fluxes, the scientific results are divided between the compact, high-density city, which most effectively maximizes energy efficiency [
7], and the disperse city, which most effectively increases the use of alternative energy sources [
8]. On the social level, research and experiments on the sustainable urban form have considered the quality of the built space through its ability to affect relationships between the place, its functions, and end users. In particular, investigations have been made regarding the density/proximity binomial [
9,
10] and the people/activity binomial [
11,
12,
13]. From a strictly economic point of view, many lines of research have been dedicated to evaluating the costs linked to the disperse city, with the conclusion that sprawl represents the most expensive form of residential development in terms of public and environmental costs and resource consumption. Subsequent studies in the United States have reached similar results [
14,
15]. In Europe, various studies have associated increases in energy consumption with the disperse settlement model in regard to both heating costs and transportation [
16,
17,
18].
For many years, various disciplines have also been working to measure urban sustainability in order to characterize various phenomena and build a system of knowledge. In contrast to a set of indicators that look mostly at individual aspects of the urban ecosystem (atmospheric pollution, mobility, building, ecological requalification of green spaces, or land-use containment), highly aggregate indicators or indices that consolidate multiple indicators have recently been identified in support of various urban policies. Examples include the Global Warming Potential (GWP; [
19]) and LEEDv4 [
20]. Other studies based on this perspective deal with city accounting [
21] and the selection of metrics to inform planning processes [
22,
23,
24]. However, all of this research has still only shown partial results that are unable to definitively confirm the sustainability or non-sustainability of the two alternative development models.
In the last decade, urban planning has promoted the compact city as the preferred model for sustainability [
25]. Two different lines of research reflect different ways of approaching the problem. One approach was taken by the CSTB (Centre Scientifique et Technique du Bâtiment, Paris, France) in 2006 [
26] and the second, from 2012, is the SUME (Sustainable Urban Metabolism for Europe) project, financed by the European Union [
27]. The CSTB project focuses only on the idea of a city’s good and bad compactness and the need to distinguish density from compactness. (The compactness of a constructed area or isolated urban area corresponds to the external surface area of the building (walls and roof) divided by the volume, or
A/
V.) However, the complexity of the urban system requires a systemic approach to study and analyze the city’s metabolism. Along these lines, the second project, SUME, analyzed urban development in different countries. They focused on energy flows regarding buildings and transportation in order to propose methods to reduce resource and energy consumption.
These single-aspect approaches highlight the need for new paradigms that allow relationships among the different physical, environmental, and morphological components to be interpreted in a particularly transdisciplinary manner [
28]. The research described here represents the first step in identifying development scenarios that not only most suitably respond to the needs and expectations of territories, but which are also sustainable from the environmental and energy points of view. A multi-objective parameterization optimization is made in order to consider the connections, mutual dynamic relationships, and adaptability between different attributes of the urban form. The attributes considered include standard morphological, geometrical, energetic, and thermal comfort indicators.
2. Methods
It is well known that the energy available at any location to heat the air or ground or to evaporate water depends on the radiation balance
where
HS and
L are the shortwave (from the sun) and longwave (or terrestrial) radiation fluxes and the arrows indicate whether the flow of energy is toward (↓) or away (↑) from the surface. The available energy also depends on the urban energy balance [
29]:
where
Q* is the net all-wave radiation flux
QH, and
QE are the turbulent sensible and latent heat fluxes, respectively.
QS is the net uptake or release of energy by sensible heat changes in the urban ground-canopy-air volume, Δ
QA is the net horizontal advective heat flux, and
QF is the anthropogenic heat flux from heat released by fuel combustion (e.g., traffic, building HVAC systems). This is an additional term particular to cities and is not present in other ecosystems.
Several parameters and their dependence on the urban fabric and geometry are considered in order to determine which terms may easily be modified to mitigate the UHI effect (
Table 1). Any possible interventions or applications depend on scale, may occur via city function and form, and must also consider the climate of the location.
Many recent building developments and design options have focused on reducing building energy use and the UHI effect in order to improve human comfort during the summer in temperate climates. However, these changes are often restricted by the morphology of the environment (building size and location, street width, and green areas), which is already well established. Efforts have therefore concentrated on changing the properties of the urban surface to modify its radiative (new surface coverings to reduce the radiative heat gain) and evaporative properties (
Table 2). Vegetation, for example, has been found to be very versatile in mitigating the local thermal environment. It can provide shade, thermal insulation, evaporative cooling, and it can also manage noise and air pollution.
Taken individually, such parameters have been shown to be widely insufficient in considering urban complexity and in proposing constant, cyclic elements of support with respect to strategic/structural and operational planning instruments. In contrast, the new approach presented here considers the connections, mutual dynamic relationships, and adaptability between different attributes of the urban form. The parameterization allows different hypothetical development scenarios identified for the urban form to be tested for sustainability. As a result, it allows those parameters to be selected that can best inform decision making, governance strategies, and policies for change indicated as objectives for each hypothetical development scenario.
2.1. Parameters
The UHI effect, the difference in temperature between urban and rural areas, is directly related to the urban morphology. Oke [
29] related this temperature difference to the height-to-width ratio (
H/
w) of the urban streets, which defines the sky view factor (SVF) and urban compacity:
According to Salat ans Morterol [
30], the non-dimensional parameter compacity,
N1 (Equation (4); [
31]), is an interesting descriptor of urban morphology. It describes the amount of exposed building envelope (
Aext) per unit volume (
V):
and determines the thermal losses of buildings in an urban environment. To focus on the form rather than the size, the ratio
A/
V2/3 is considered; the lower the ratio, the higher the compacity.
As mentioned above, urban density is the distribution of urban elements on the ground such as houses, streets, empty plots, vegetation, etc. In addition, the space between buildings (including streets) and the average building height also contribute to the urban density, which affects the local climate and the thermal comfort of the inhabitants. Compacity is sometimes called the “shape factor” because the higher the value, the less compact the building fabric is. This is advantageous during the summer since by reducing the building envelope exposed to the outside environment, the indoor-outdoor energy exchange during the summer and thus the energy consumed for cooling and ventilation is reduced [
32].
Other factors that influence the thermal state of the city include the solar radiation, Hs, the temperature difference between the average indoor (Ti) and outdoor temperatures, and the energy coefficient K, which is the ratio of the total energy needs of the building to the average external air temperature. Two external temperatures were considered: Ta is the ambient temperature and Tc is the sky temperature.
The collective behavior of these parameters was studied by considering three dimensionless numbers that are closely related to the urban morphology and the local climate conditions [
33,
34]:
N1 is the compacity of the building as described above (Equation (4)). On the building scale,
N2 is related to energy consumption and describes the ratio of the building’s energy loss to the solar energy gain.
N3 is another energy consumption parameter, but it expresses energy loss on a larger, citywide scale, between the built area and the sky;
N2 and
N3 differ in the temperature difference used.
N1,
N2, and
N3 represent thermodynamic energy system indicators for urban energy planning. Each of these aggregate parameters encompasses many variables in the built environment and can be used to define the built area, the extent of green space, and service areas. They also allow the quality of an urban area to be evaluated by referring to the analysis made on the current conditions [
34].
When evaluating the thermal environment, it is important to understand human responses to various thermal conditions as well as the diversity of human responses. Therefore, to determine thermal comfort, the predicted mean vote (PMV; [
35]) was used. This widely used (ISO 7730) index predicts the mean value of the subjective ratings of a large group of people on a seven-point thermal-sensation scale (+3 hot, +2 warm, +1 slightly warm, 0 neutral, −1 slightly cool, −2 cool, −3 cold). The predicted percent dissatisfied (PPD) is a related index that predicts the percentage of a large group of people likely to feel thermally uncomfortable.
To calculate PMV and PPD, the indications provided in technical standard ISO 7730 [
36] were followed:
with
and for the PPD:
where
| M | Metabolic rate | |
| W | Effective mechanical power | |
| Icl | Clothing insulation | |
| tr | Mean radiant temperature | ℃ |
| tcl | Clothing surface temperature | ℃ |
| ta | Air temperature | ℃ |
| fcl | Clothing surface-area factor | |
| var | Relative air velocity | |
| hc | Convective heat transfer coefficient | |
| pa | Water vapor partial pressure | Pa |
the minimum PPD is 5%, even when PMV is zero.
2.2. Optimization
The objective is therefore twofold: minimize urban compacity and energy consumption in order to limit heat exchange, and minimize the PPD index in order to achieve good outdoor thermal comfort. To examine a wide urban space and identify interesting relationships among the variables considered, the optimization process necessarily employs given constraints. These may be meteorological scenarios with high temperature and low winds, or morphological building parameters. It also uses custom (recursive) algorithms to generate the set of all non-dominated objective parameters and genetic algorithms (described below) to determine the optimal output. For example, by studying the height-to-width ratio of urban streets, the results can be used to manage housing units, for instance, by identifying the best building volume.
Optimization is the process of modifying the input to or characteristics of a device, that is, a mathematical process to obtain a minimum or maximum of the output. The input to the optimization process is the cost, objective, or fitness function and the output is the fitness function of the system. Optimization is a primary tool required to tackle exceptionally hard or unsolvable problems.
When the number of dimensions increases, the optimization process becomes more complex, so it is not possible to use standard optimization techniques such as gradient descent algorithms. Genetic algorithms can be applied to solve problems that are not well suited for standard optimization algorithms, including problems in which the objective function is discontinuous, non-differentiable, stochastic, or highly nonlinear. In addition, the problems are “constrained optimization problems”, so the variables have limited variability. In this case study within a city, for example, the range of variability of street width and building height is restricted to pre-established ranges. Therefore, for strongly constrained problems with many dimensions, other types of algorithms such as genetic algorithms are necessary.
To this end, parametric simulations were run using a commercial multi-objective optimization tool called modeFrontier, a multidisciplinary multi-objective platform that allows for statistical analysis and minimization. For robustness, i.e., the stability of an outcome against variations in the input parameters, modeFrontier uses a genetic algorithm to guide a search for multiple design permutations and, in contrast to stochastic searches, it learns from the ratings of previous permutations. Genetic algorithms (GA) [
37,
38] are used to solve both constrained and unconstrained optimization problems based on a natural selection process that mimics biological evolution. The algorithm modifies a population of individual solutions repeatedly. At each step, the genetic algorithm randomly selects individuals from the current population, which are used as parents to produce children for the next generation. Over many generations, the population “evolves” toward an optimal solution. In particular, this analysis employed the fast non-dominated sorting genetic algorithm, NSGA-II [
39], which is explained below. ModeFrontier begins with a random population of input parameters. Through generational growth, the results of each cycle are evaluated for optimality to ultimately reach a set of parameters that offer the best possible output based on the objectives. For each permutation, modeFrontier generates series of data that can be evaluated and compared with other permutations.
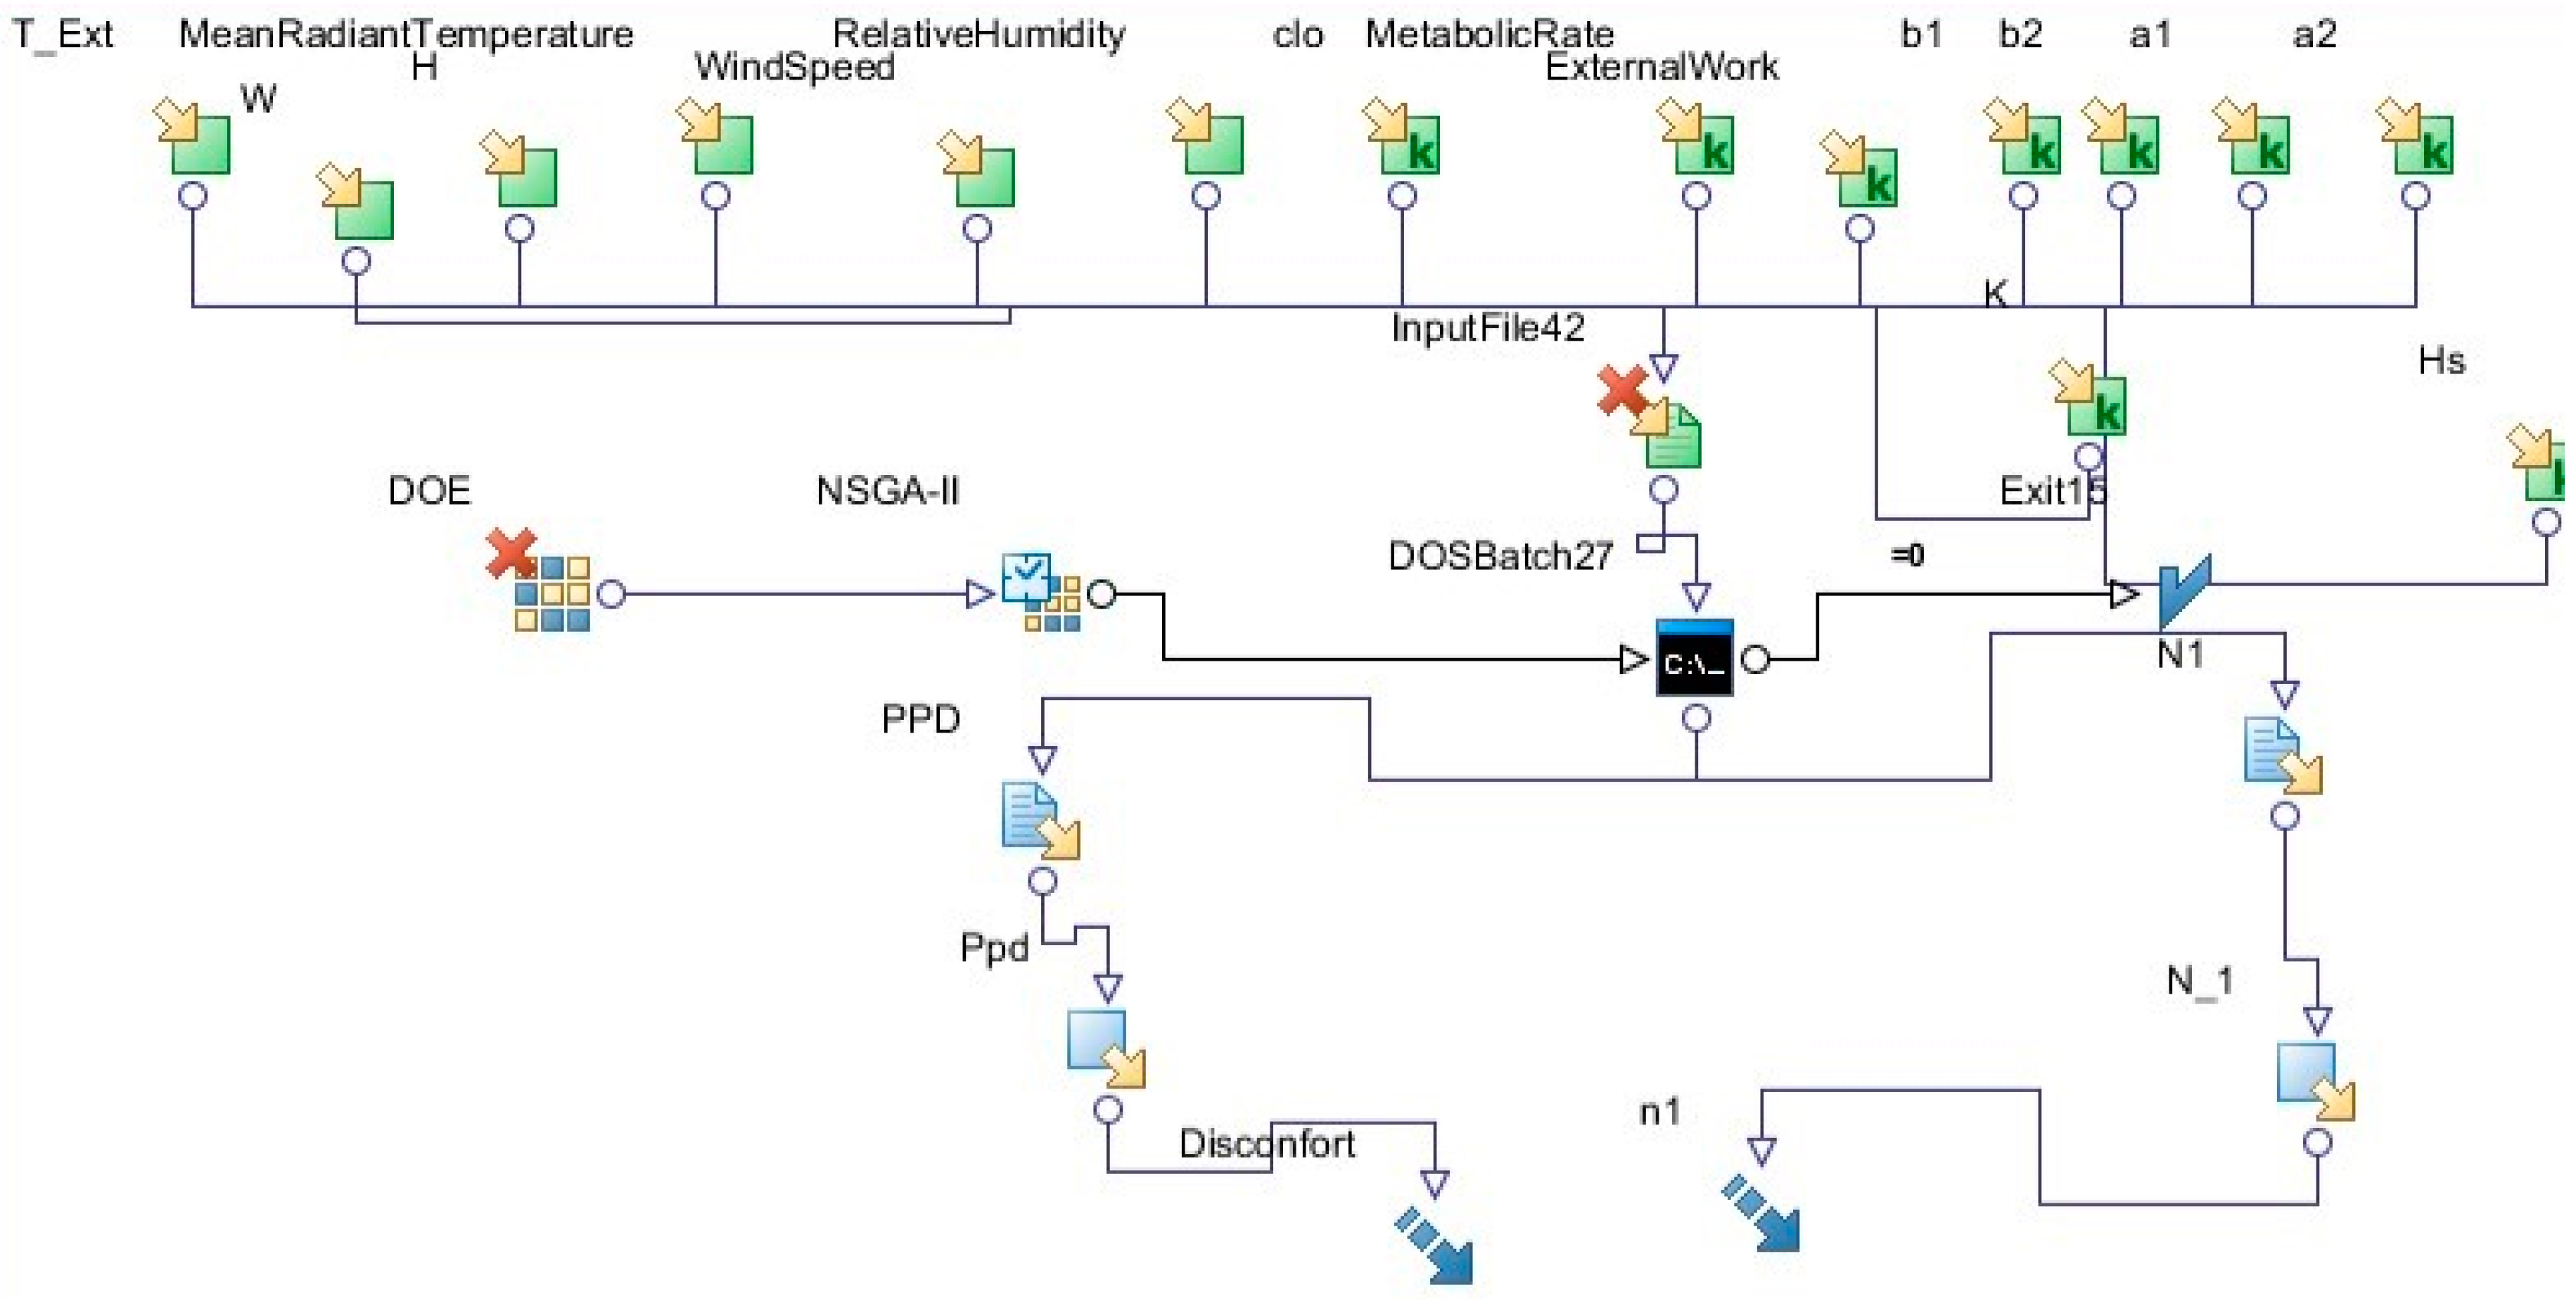
The goal of the analysis is encompassed in the objectives. Optimal output values are established for each run and include minimizing or maximizing global parameters, or achieving a specific target. When defining the relevant metrics, competing objectives may be produced, such as when the conditions favor the maximum performance of one objective and the reduced performance of another. Therefore, determining the objectives is as crucial as establishing the input. The user must clearly construct the metrics by which the input is evaluated. In this case, the objective function, i.e., discomfort and urban parameters, were minimized as shown in
Figure 1.
This analysis focused on thirteen tractable parameters believed to be influential for urban design and thermal comfort (see [
2,
31,
34,
35] among others). Input that influences thermal comfort includes external temperature, wind speed, clothing insulation, air temperature, median radiant temperature, air speed, and relative humidity. Input that influences geometry includes street width, building height, and four parameters that describe the local building geometry.
Guided by modeFRONTIER, the optimization process determines the climatic and spatial conditions that guarantee optimization of PMV and identifies the related PPD. Climate variables are easy to understand because they come from the ranking in the calculation of the representative day; spatial variables can be varied to effectively minimize discomfort and therefore optimize comfort.
In general, the optimization can be single- or multi-objective. The attempt to optimize a project or system in which a single objective is present usually means applying an algorithm to the gradient of a function to find the minimum or maximum according to the established objective. In contrast, multi-objective optimization algorithm consists in identifying solutions from a trade-off curve, better known as the Pareto frontier.
The Pareto frontier is defined as the set of best solutions that are not strictly dominated by other solutions. (Solution A dominates a solution B if A behaves better than B, all things considered.) Pareto optimization can be viewed as a concept that formalizes the trade-off between a given set of mutually contradicting objectives. A solution is Pareto optimal when it is not possible to bring Pareto improvements to the system, i.e., it is not possible to improve one objective without worsening at least one of the others. A set of Pareto optimal solutions constitutes the Pareto frontier and movement along the frontier represents a trade-off between the objectives.
In general, the set of solutions along the Pareto frontier can be composed of an infinite number of points, but a restricted set of objectives is generally chosen for optimization. Choosing the best solution is not always simple due to the trade-offs involved, and various techniques have been developed to select a number of representative points from along the frontier. One of the most common strategies, and the one used here, is the fast non-dominated sorting genetic algorithm (NSGA-II; [
39]).
The NSGA-II was developed as an improved version of the NSGA—one of the first multi-objective evolutionary algorithms—in order to resolve its major criticisms [
39]. These include its large computational complexity, the lack of elitism, and the need to specify a sharing parameter. The complexity is described by
O(
mN3), where
m is the number of objectives and
N is the population size, and the need to sort the population in every generation causes it to become very large. Elitism has been shown by recent results to significantly speed up the performance of the algorithm and also helps to prevent the loss of good solutions once they are found. Finally, a sharing parameter has traditionally been defined to ensure diversity in a population to obtain a variety of equivalent solutions; however, a parameter-less diversity-preservation mechanism is desirable.
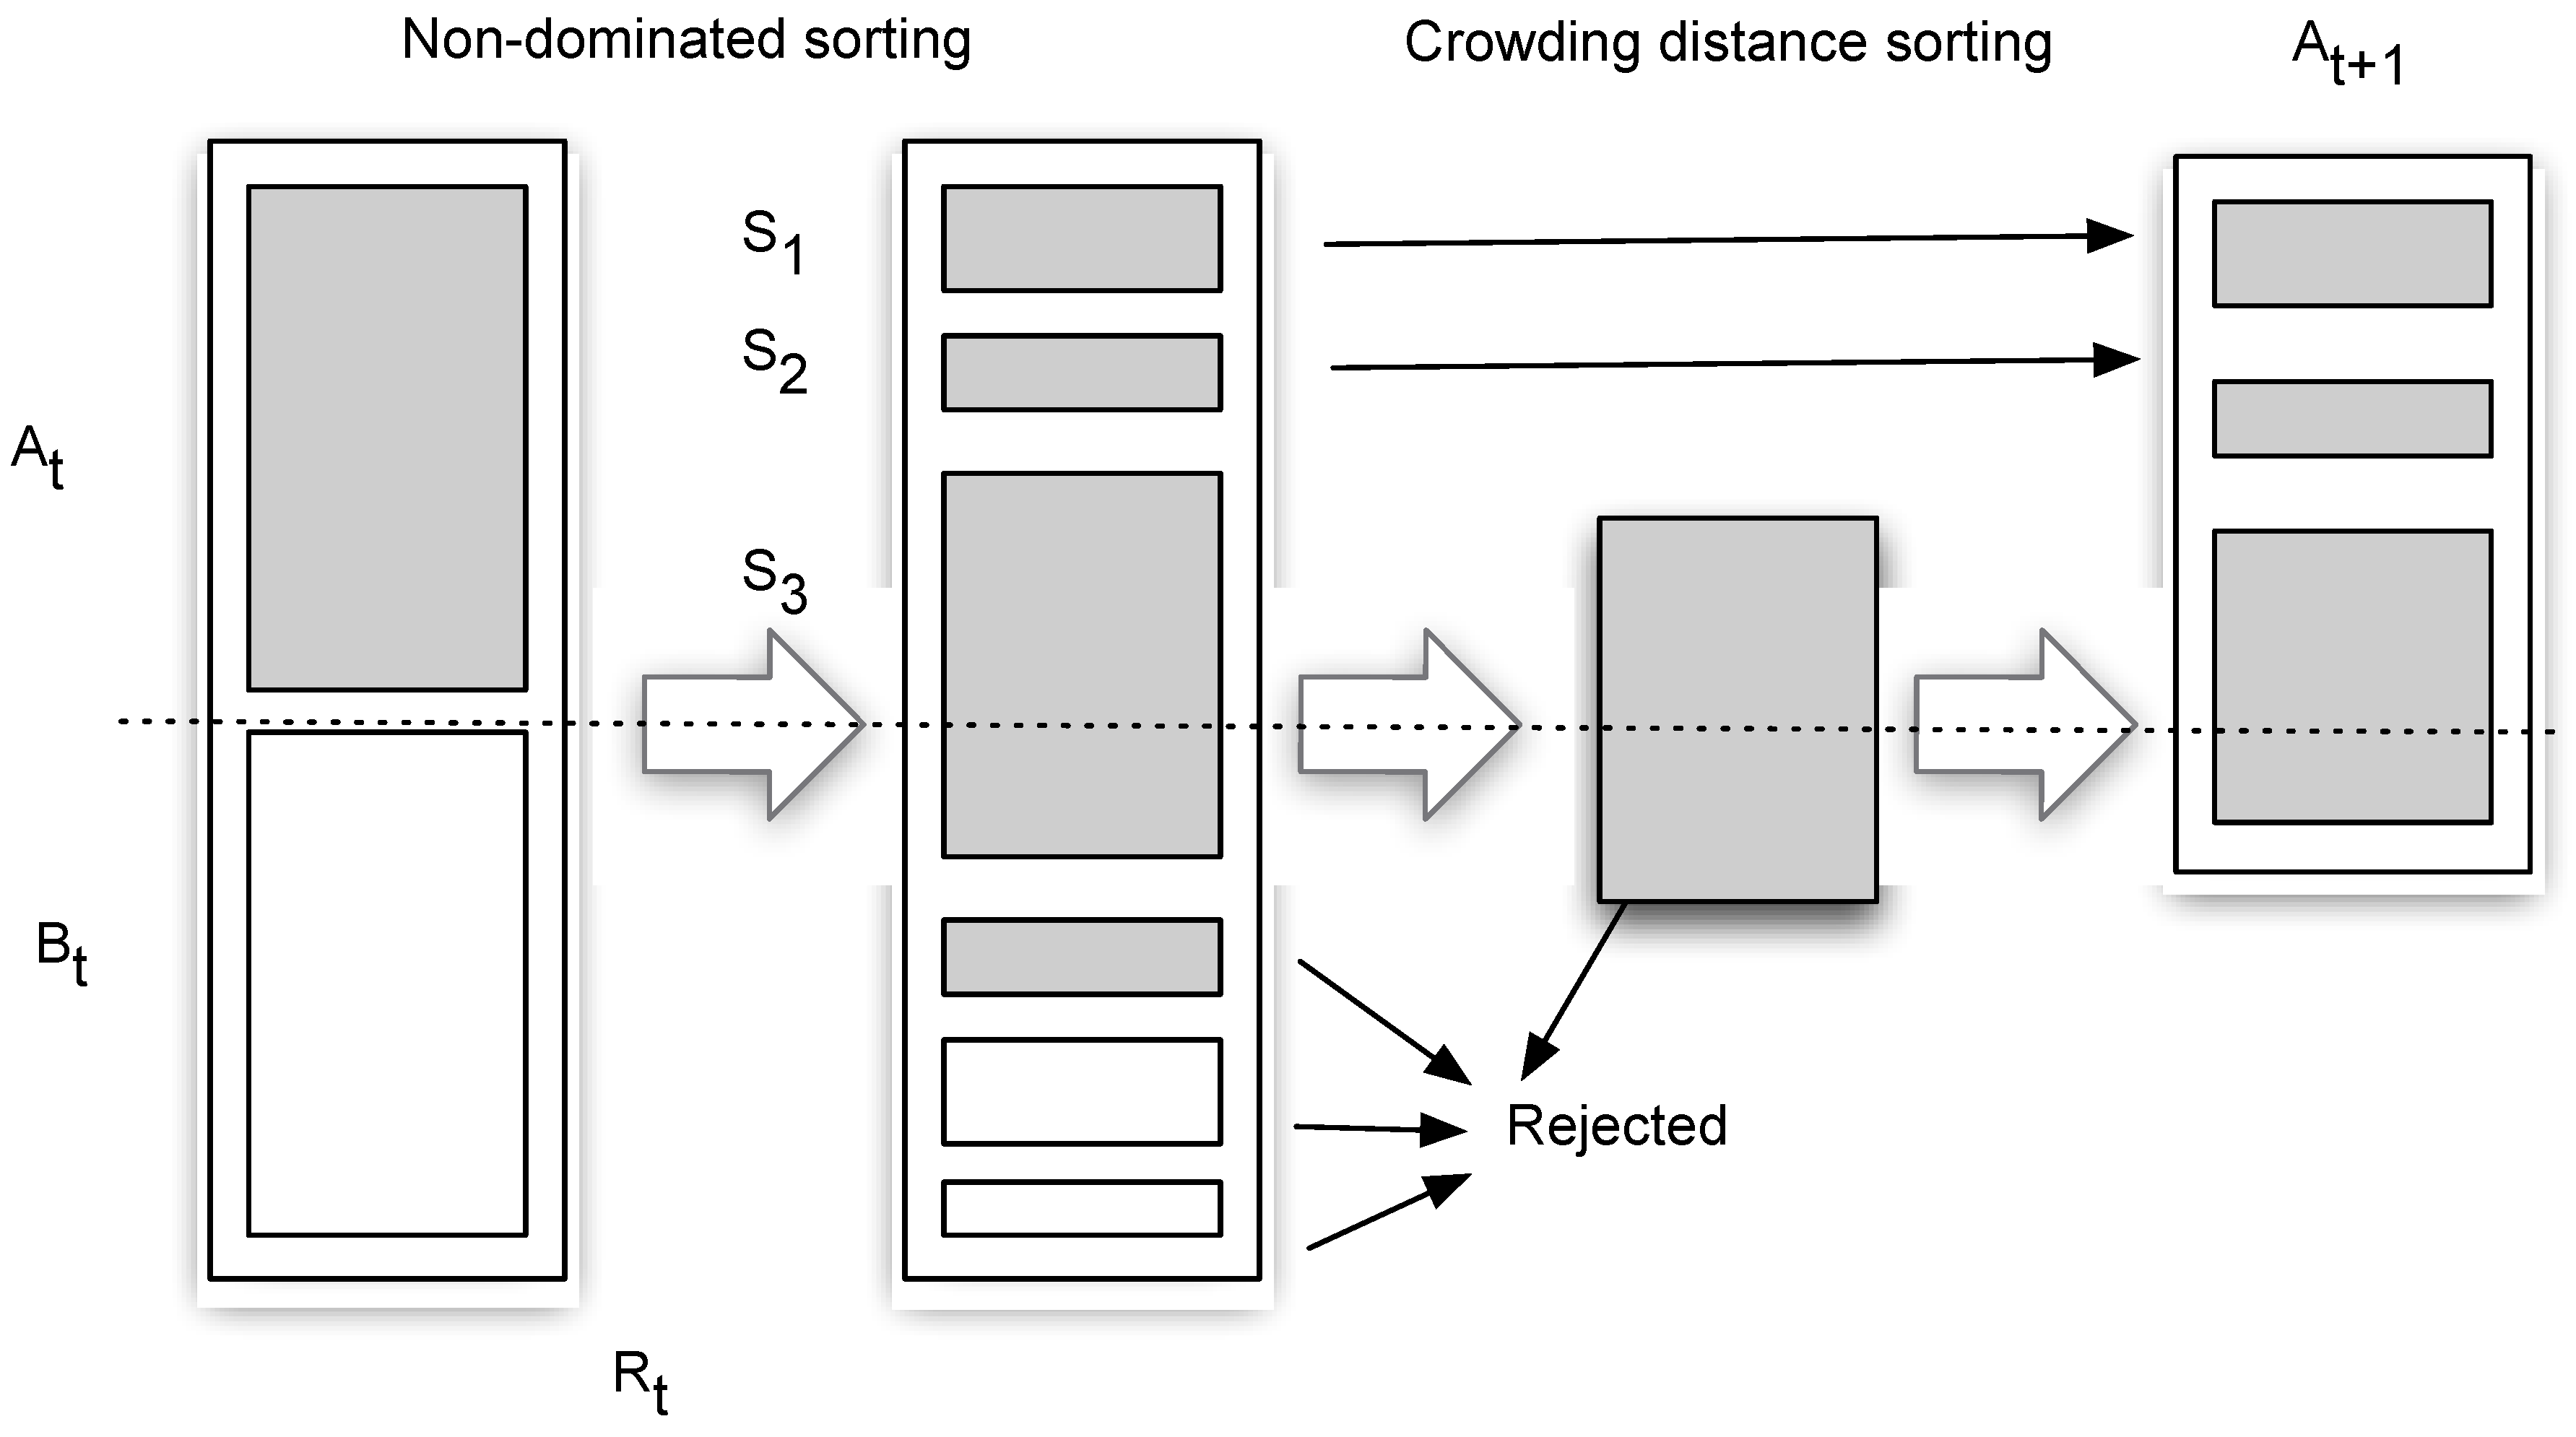
The NSGA-II, described in detail by Deb [
40], relies on non-dominated sorting and crowding distance (
Figure 2), which eliminate the above difficulties to some extent. Crowding distance is a parameter that allows diversity to be preserved among solutions in the same non-dominated front. Its computation requires the population to be sorted by increasing magnitude (non-dominated sorting) according to each objective function value. The NSGA-II also does not require any user-defined sharing parameters to maintain diversity among population members, and it results in a lower computational complexity,
O(
mN2).
2.3. The Case Study
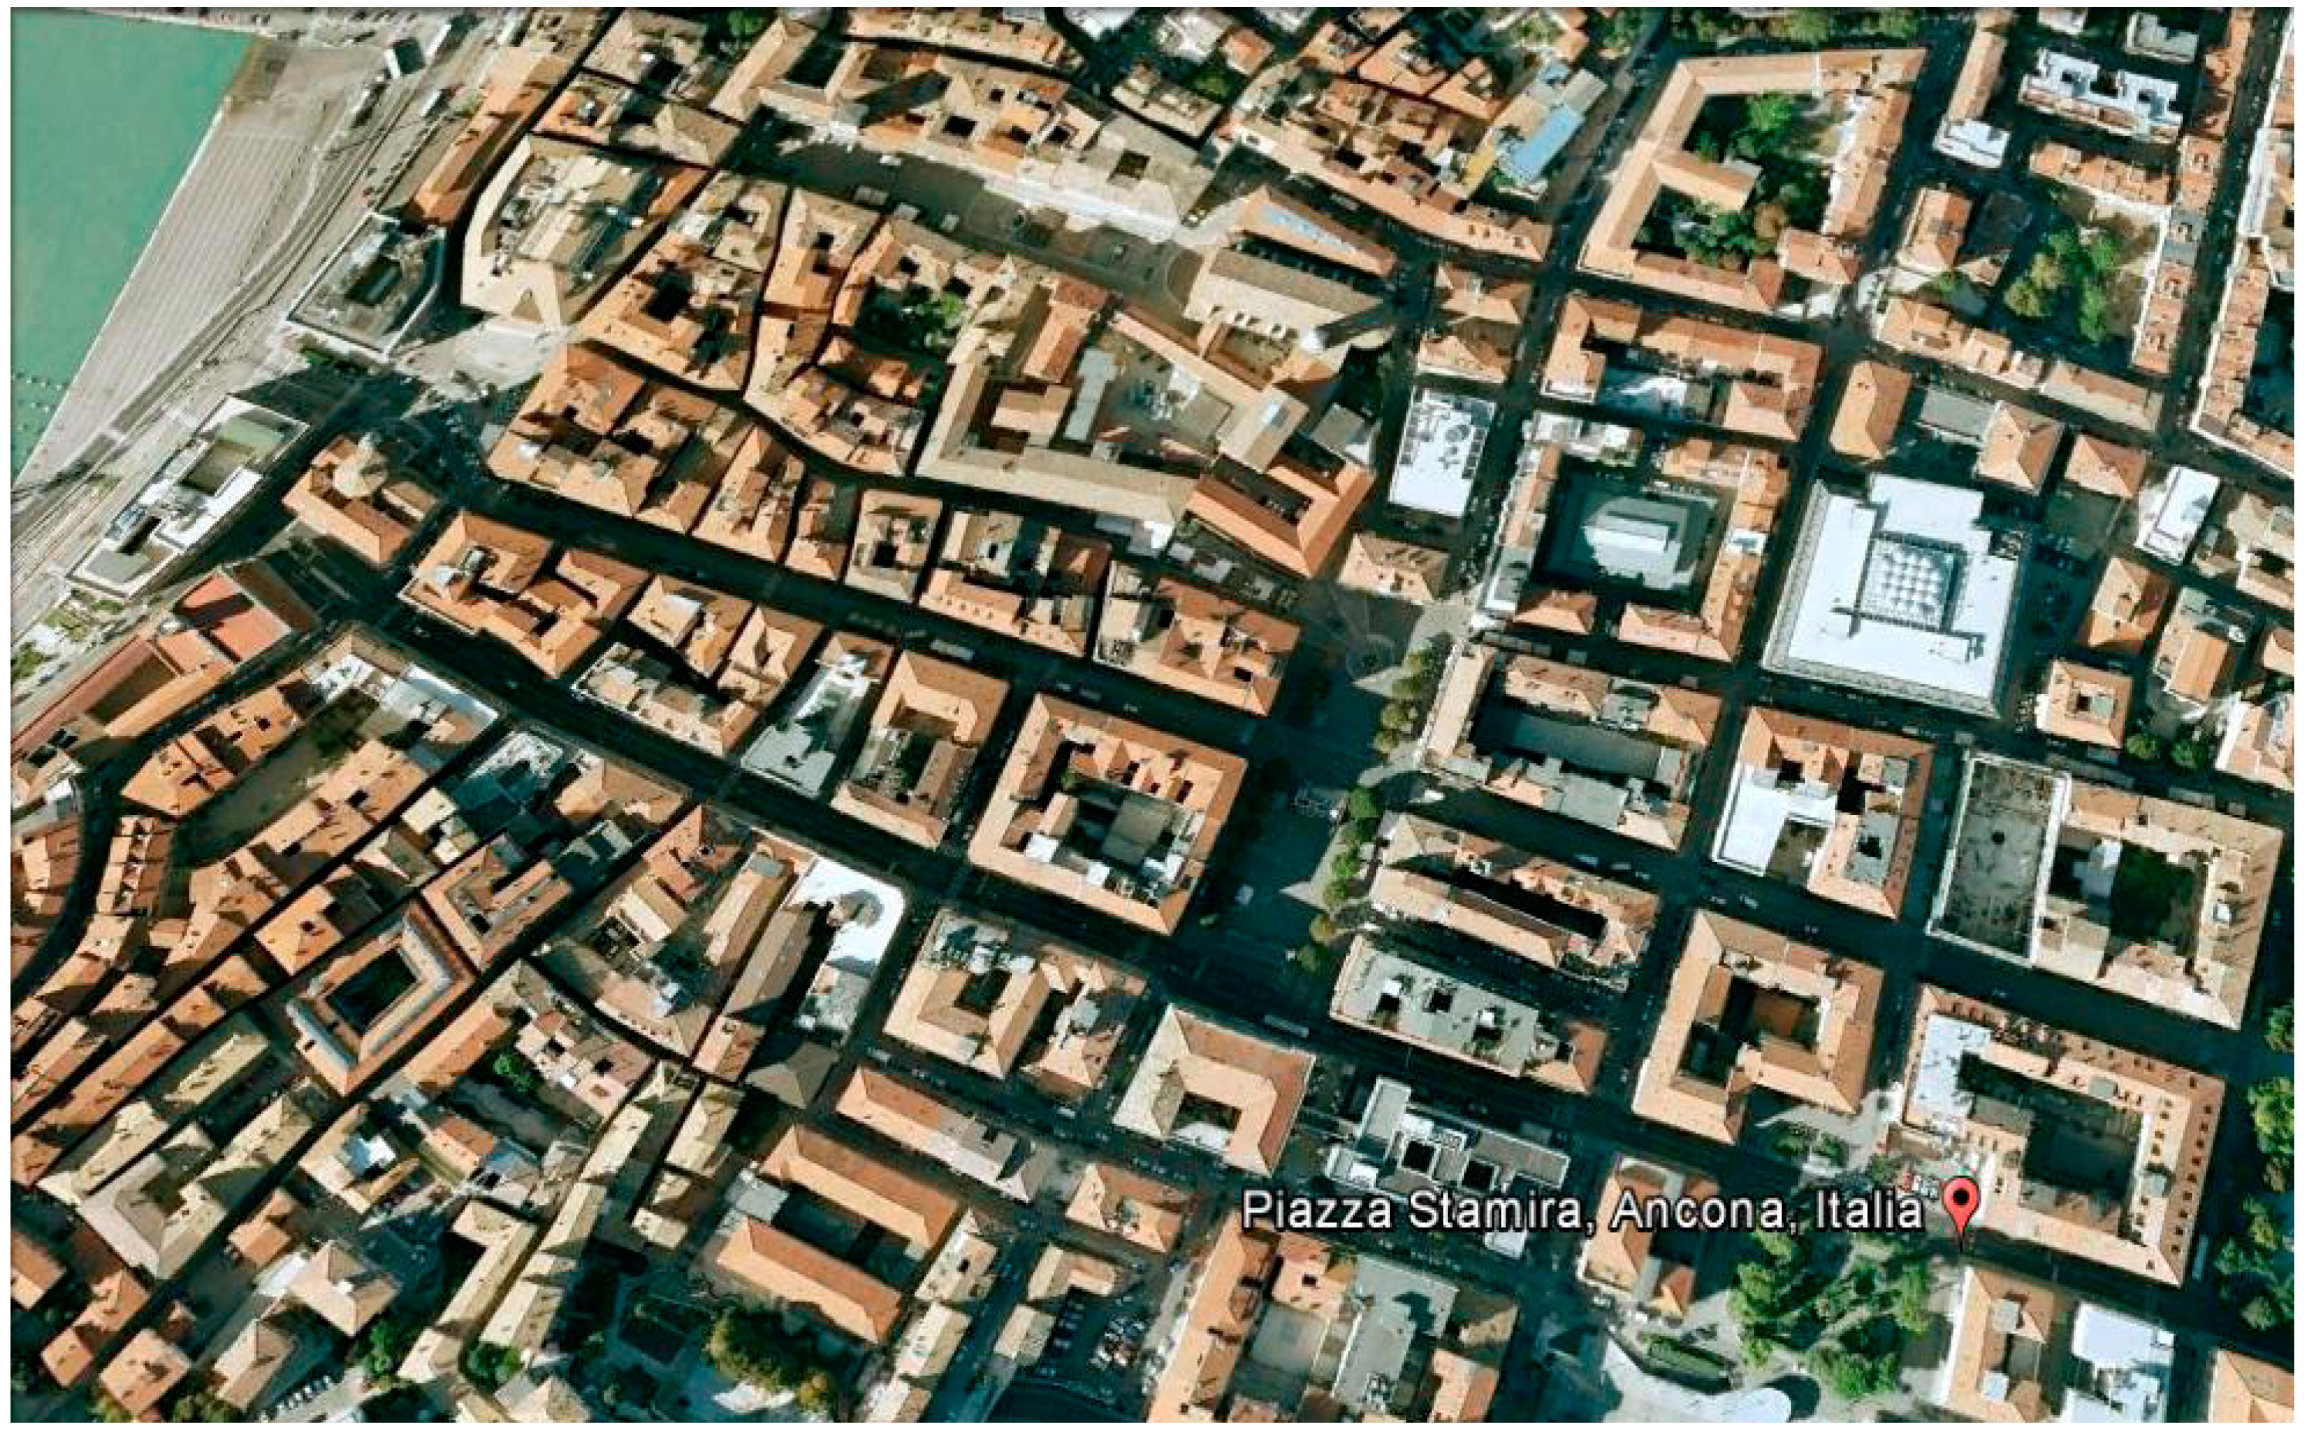
Analysis was carried out for the city of Ancona in the Marche Region in central Italy. Ancona is the largest city in the region, and has been intermittently destroyed in the past by earthquakes and war, enabling newer versions of the city to take shape. “Modern” Ancona is laid out in a grid pattern of wide streets fronted by modern commercial buildings interspersed with ancient buildings and monuments. The study area is the old city (
Figure 3), which is generally occupied by medium-scale buildings with internal courtyards.
The average building height in Ancona is about 4–5 floors. Most of the buildings are rather old, though a few modern buildings are being built. The height-to-width ratio of the urban canyons affects shading patterns and solar radiation, creating both positive and negative effects on the microclimate. Ancona’s climate can be categorized as Mediterranean: mild, with summers that are warm but refreshed by a generous sea breeze and winters with regular seasonal rains. During typical summer months (beginning in May and continuing through September), the air temperature can be very high and the daily variation relatively wide. Despite the statistical rarity of a heat wave, temperature records have been set repeatedly in recent years.
The parametric optimization program modeFrontier was used to minimize the compacity and PPD. Based on the urban fabric in an area of Ancona, simulations were run for both a winter and a summer scenario. However, the results presented here relate to the summer for its interest in combating the UHI effect. The urban fabric consisted of ten courtyard-type buildings in the shape of a parallelepiped with a square base; an additional eleven buildings had a rectangular base.
Five years of meteorological data were examined and evaluated using the representative day technique [
41] to obtain a representative summer meteorological scenario. The representative day is determined by actual data of the day in the period considered, when the sum of the mean-square differences between the monitored quantities averaged within each hour and the same quantities for all other days at the same hour are minimized. Mathematically, this can be expressed as
where
N is the number of days in the time period for which the representative day is calculated, and
cki is the meteorological data of the
ith day at the
kth hour.
Characteristics of the representative summer scenario are listed in
Table 3.
3. Results
In the multi-objective optimization, a search is made over two objectives in order to minimize the compacity and PPD for the urban fabric in an area of Ancona. The result is not a single solution, but rather a set of solutions that dominate the other possible solutions.
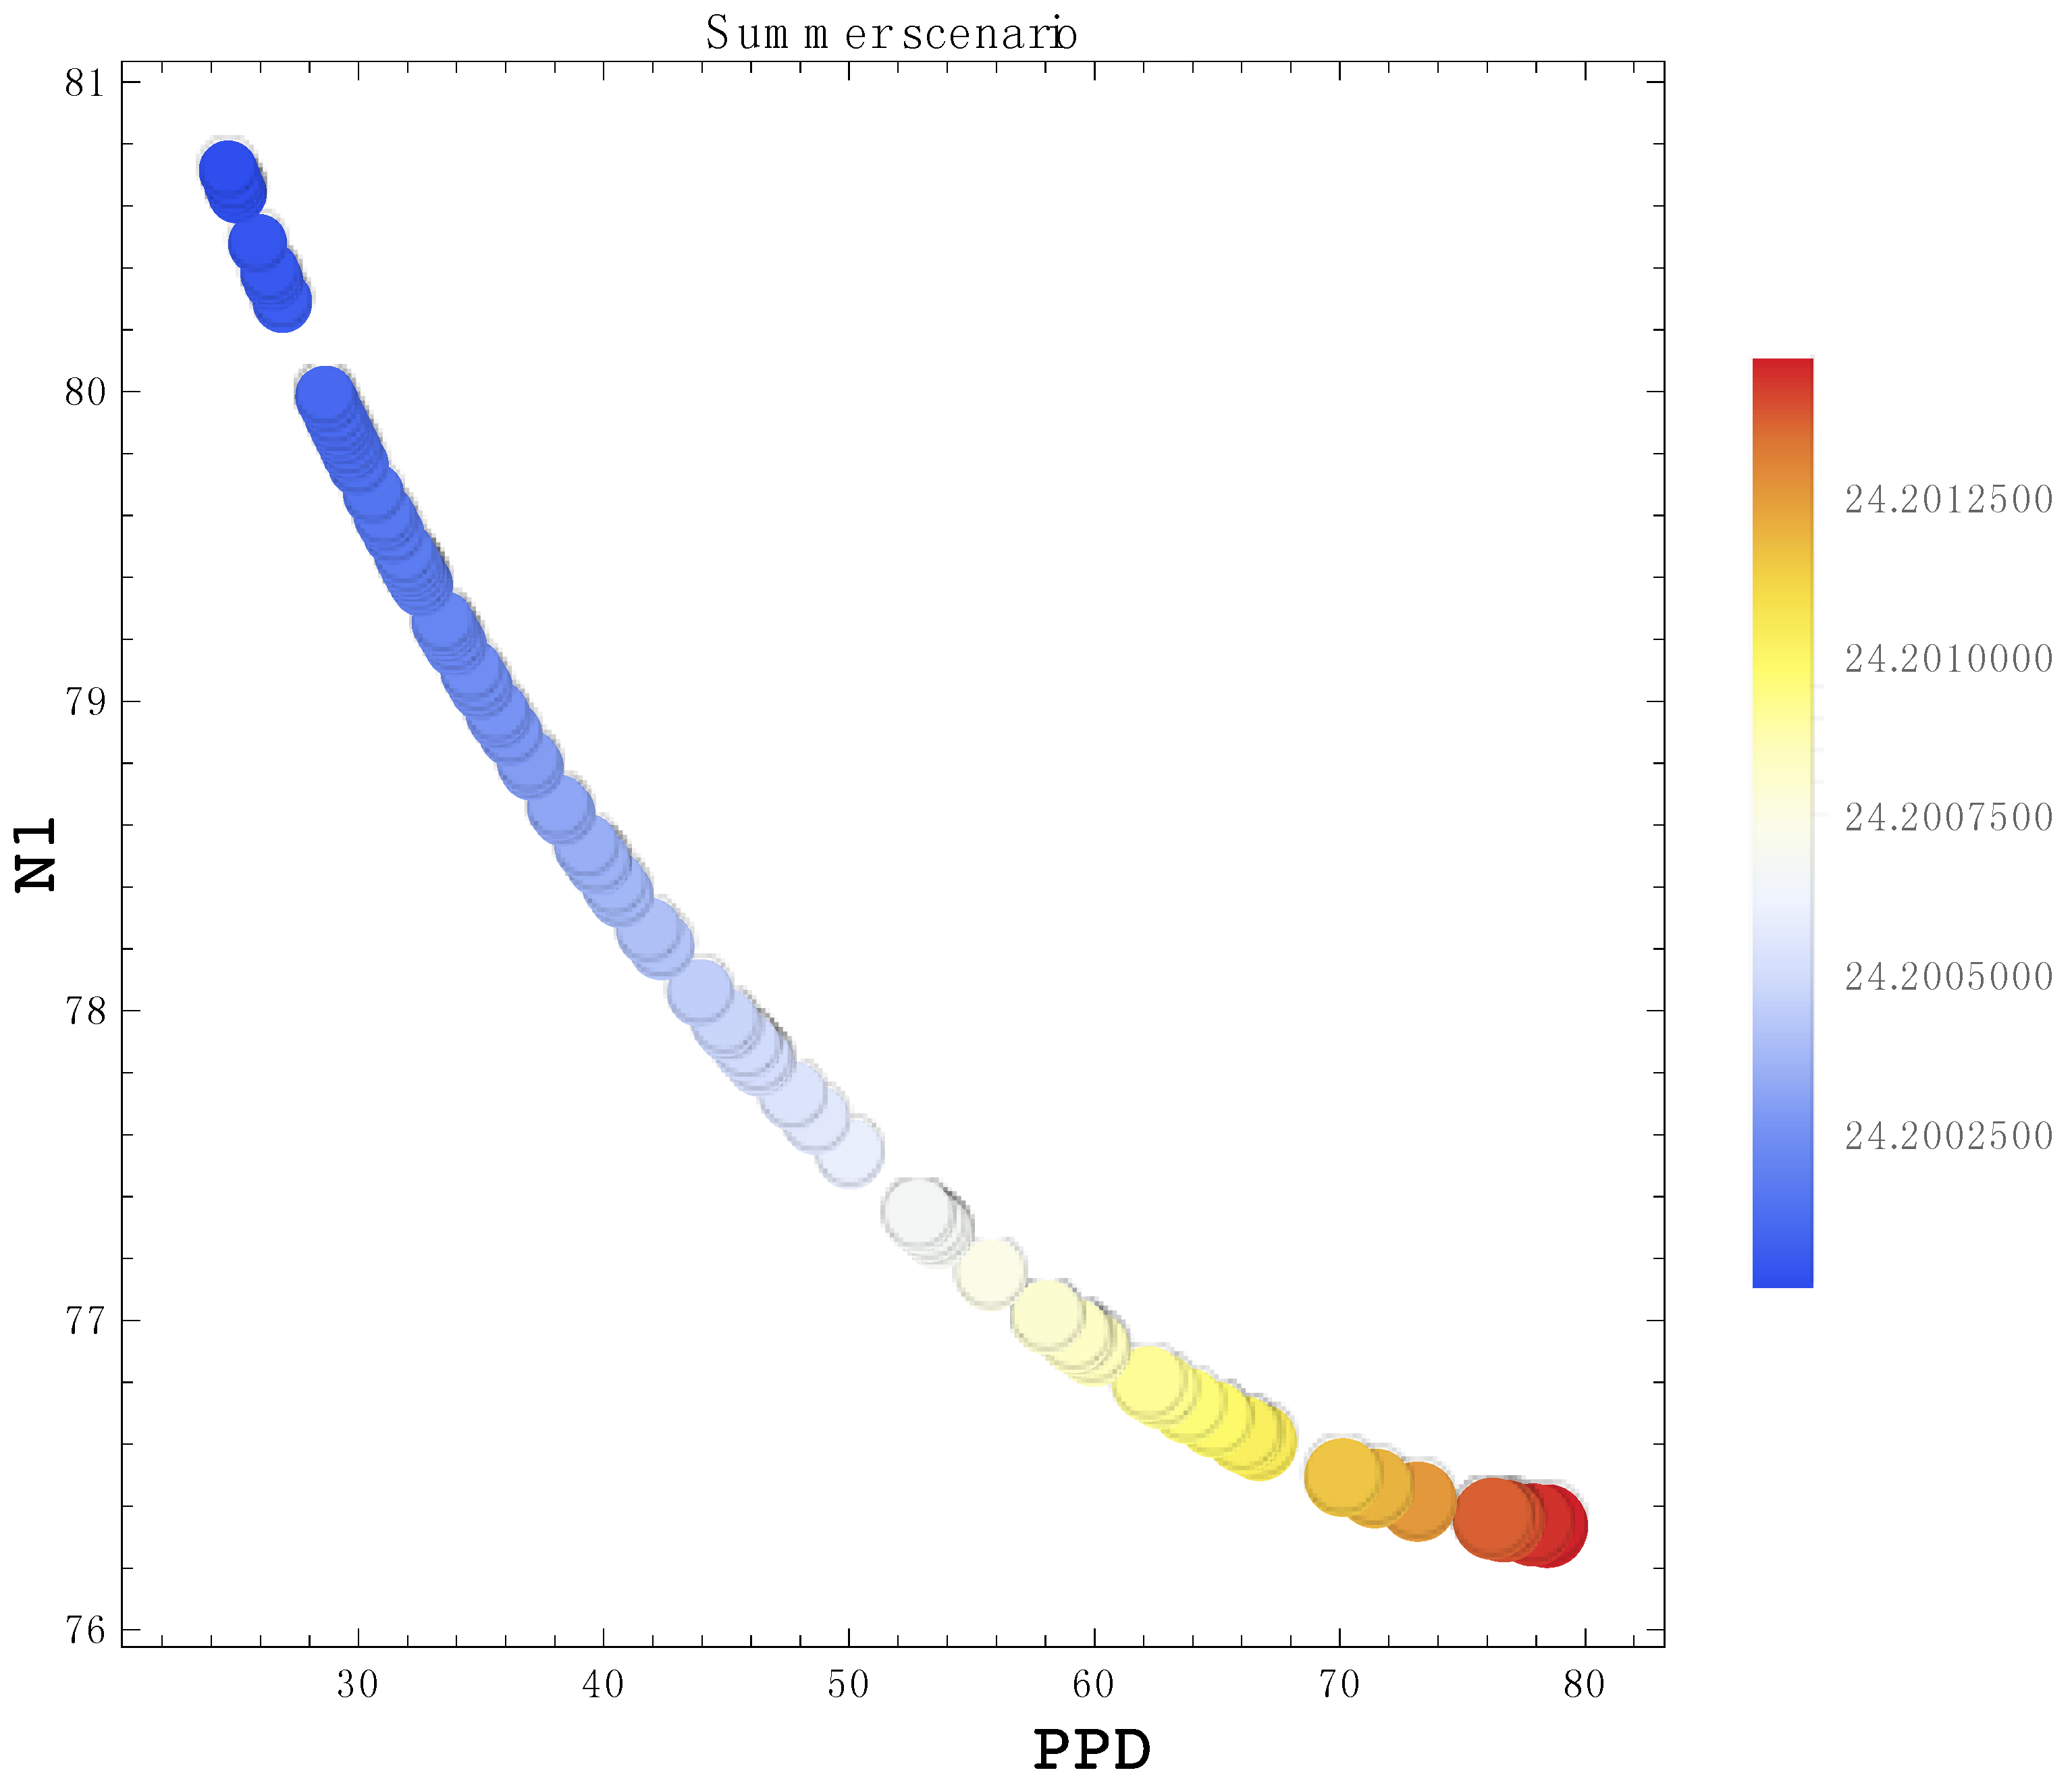
With input data particular to this case study as described above, a Pareto frontier to minimize both parameter
N1 and the PPD was formed for the summer meteorological scenario after 60,000 runs. The results are shown in the bubble chart in
Figure 4. Each data point is displayed as a bubble on a two-dimensional plot. The chart also has third and fourth (virtual) dimensions represented by bubble size and color. Bubble radius represents building height, so the larger the bubble, the taller the building; bubble color represents the temperature, where blue is colder and red is warmer.
As is clear, the plot of compacity (N1) vs. PPD for this summer scenario manages to denote a concave up Pareto frontier. A correlation thus exists between N1 and PPD, allowing the best values to be chosen from the non-dominated Pareto frontier that minimizes both quantities.
Different sets of magnitudes are shown in
Table 4. The values are representative of different planning situations and environments. For example, the values show that when the wind speed is lower there is a solution on the Pareto frontier for wide streets (
w = 8 m) and medium-height buildings (
H = 10–14 m). The values also show that comfort improves significantly (lower PPD) if the wind speed is higher. The analysis highlights the importance of some variables over others, rendering such a new technique flexible from both the planning and the territorial points of view.
Lower temperatures are obviously favored for comfort in the summer, and this is clearly expressed by the simulations (blue bubbles in the figures). Furthermore, it is worth noting that temperature is the most important factor in the model and can be considered the leading parameter. The average global temperature is steadily increasing due to climate change and the largest temperature changes are seen in cities. The United States National Oceanic and Atmospheric Association [
42] has recorded June 2016 as the hottest month in the 137 years since data taking began. The global average temperature was registered to be 0.9 °C above the twentieth-century average, and June was the fourteenth consecutive month with a record temperature. In the first six months of the year, the temperature measured 1.05 °C above average, passing the absolute temperature record set in the first half of 2015. It is therefore of fundamental importance to understand how the thermodynamic indices related to the building form and local climate, as well as the PMV, are connected to the increase in temperature.
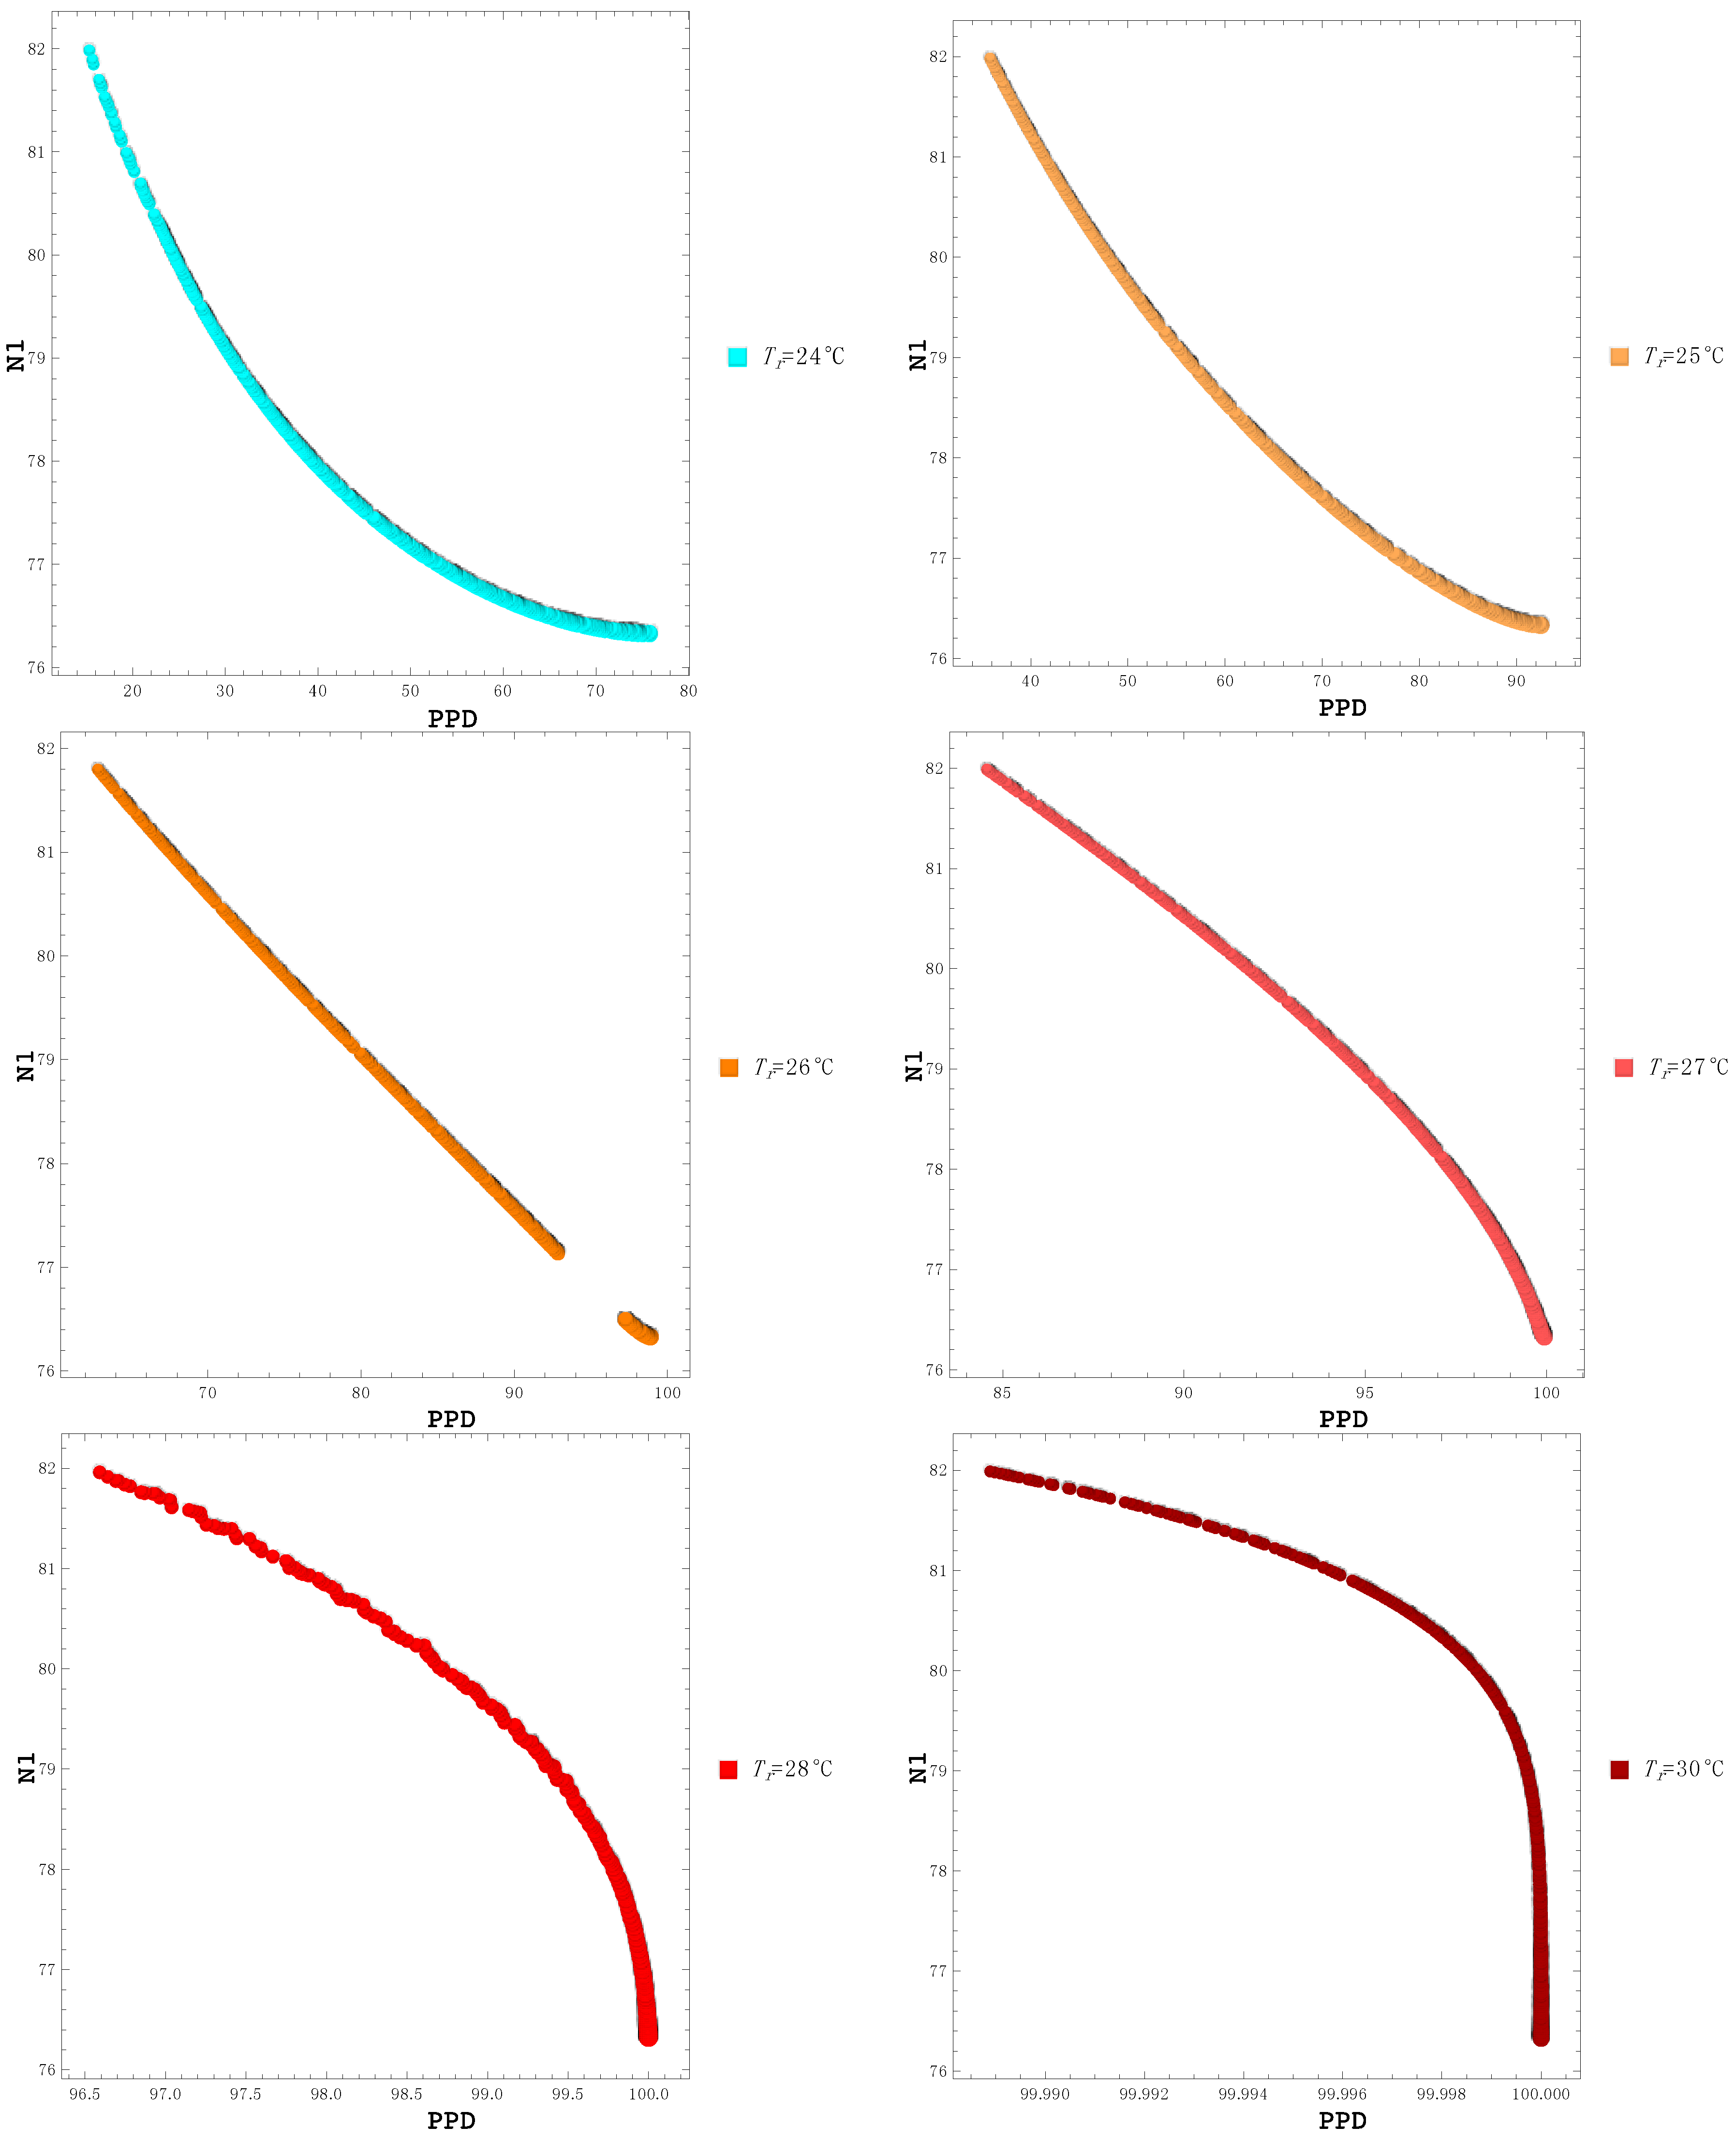
To demonstrate this, a sensitivity study was made by running a series of simulations where the outdoor temperature was fixed, but varied among the simulations from 25 to 35 °C. This temperature is the suburban temperature, and the temperature in the city thus increases according to Equation (3). As the panels in
Figure 5 show, the Pareto frontier changes from a concave up to a concave down shape as the temperature increases. Since the two parameters should be
minimized, a concave up shape is preferred; otherwise only one parameter or the other can be minimized, in effect by choosing a point at either end of the frontier.
Above 33 °C there is no Pareto frontier for our model, so solutions do not exist. Furthermore, while a Pareto frontier is possible for temperatures below 33 °C, temperatures above 29 °C do not in reality provide a solution since the scale of the horizontal axis extends over only one value: 100% dissatisfaction. This again reflects the fact that, for more comfort, lower temperatures are preferable in the summer. Therefore, temperature determines not only the number of solutions, but also if solutions exist or not.
As mentioned above, parameters
N2 and
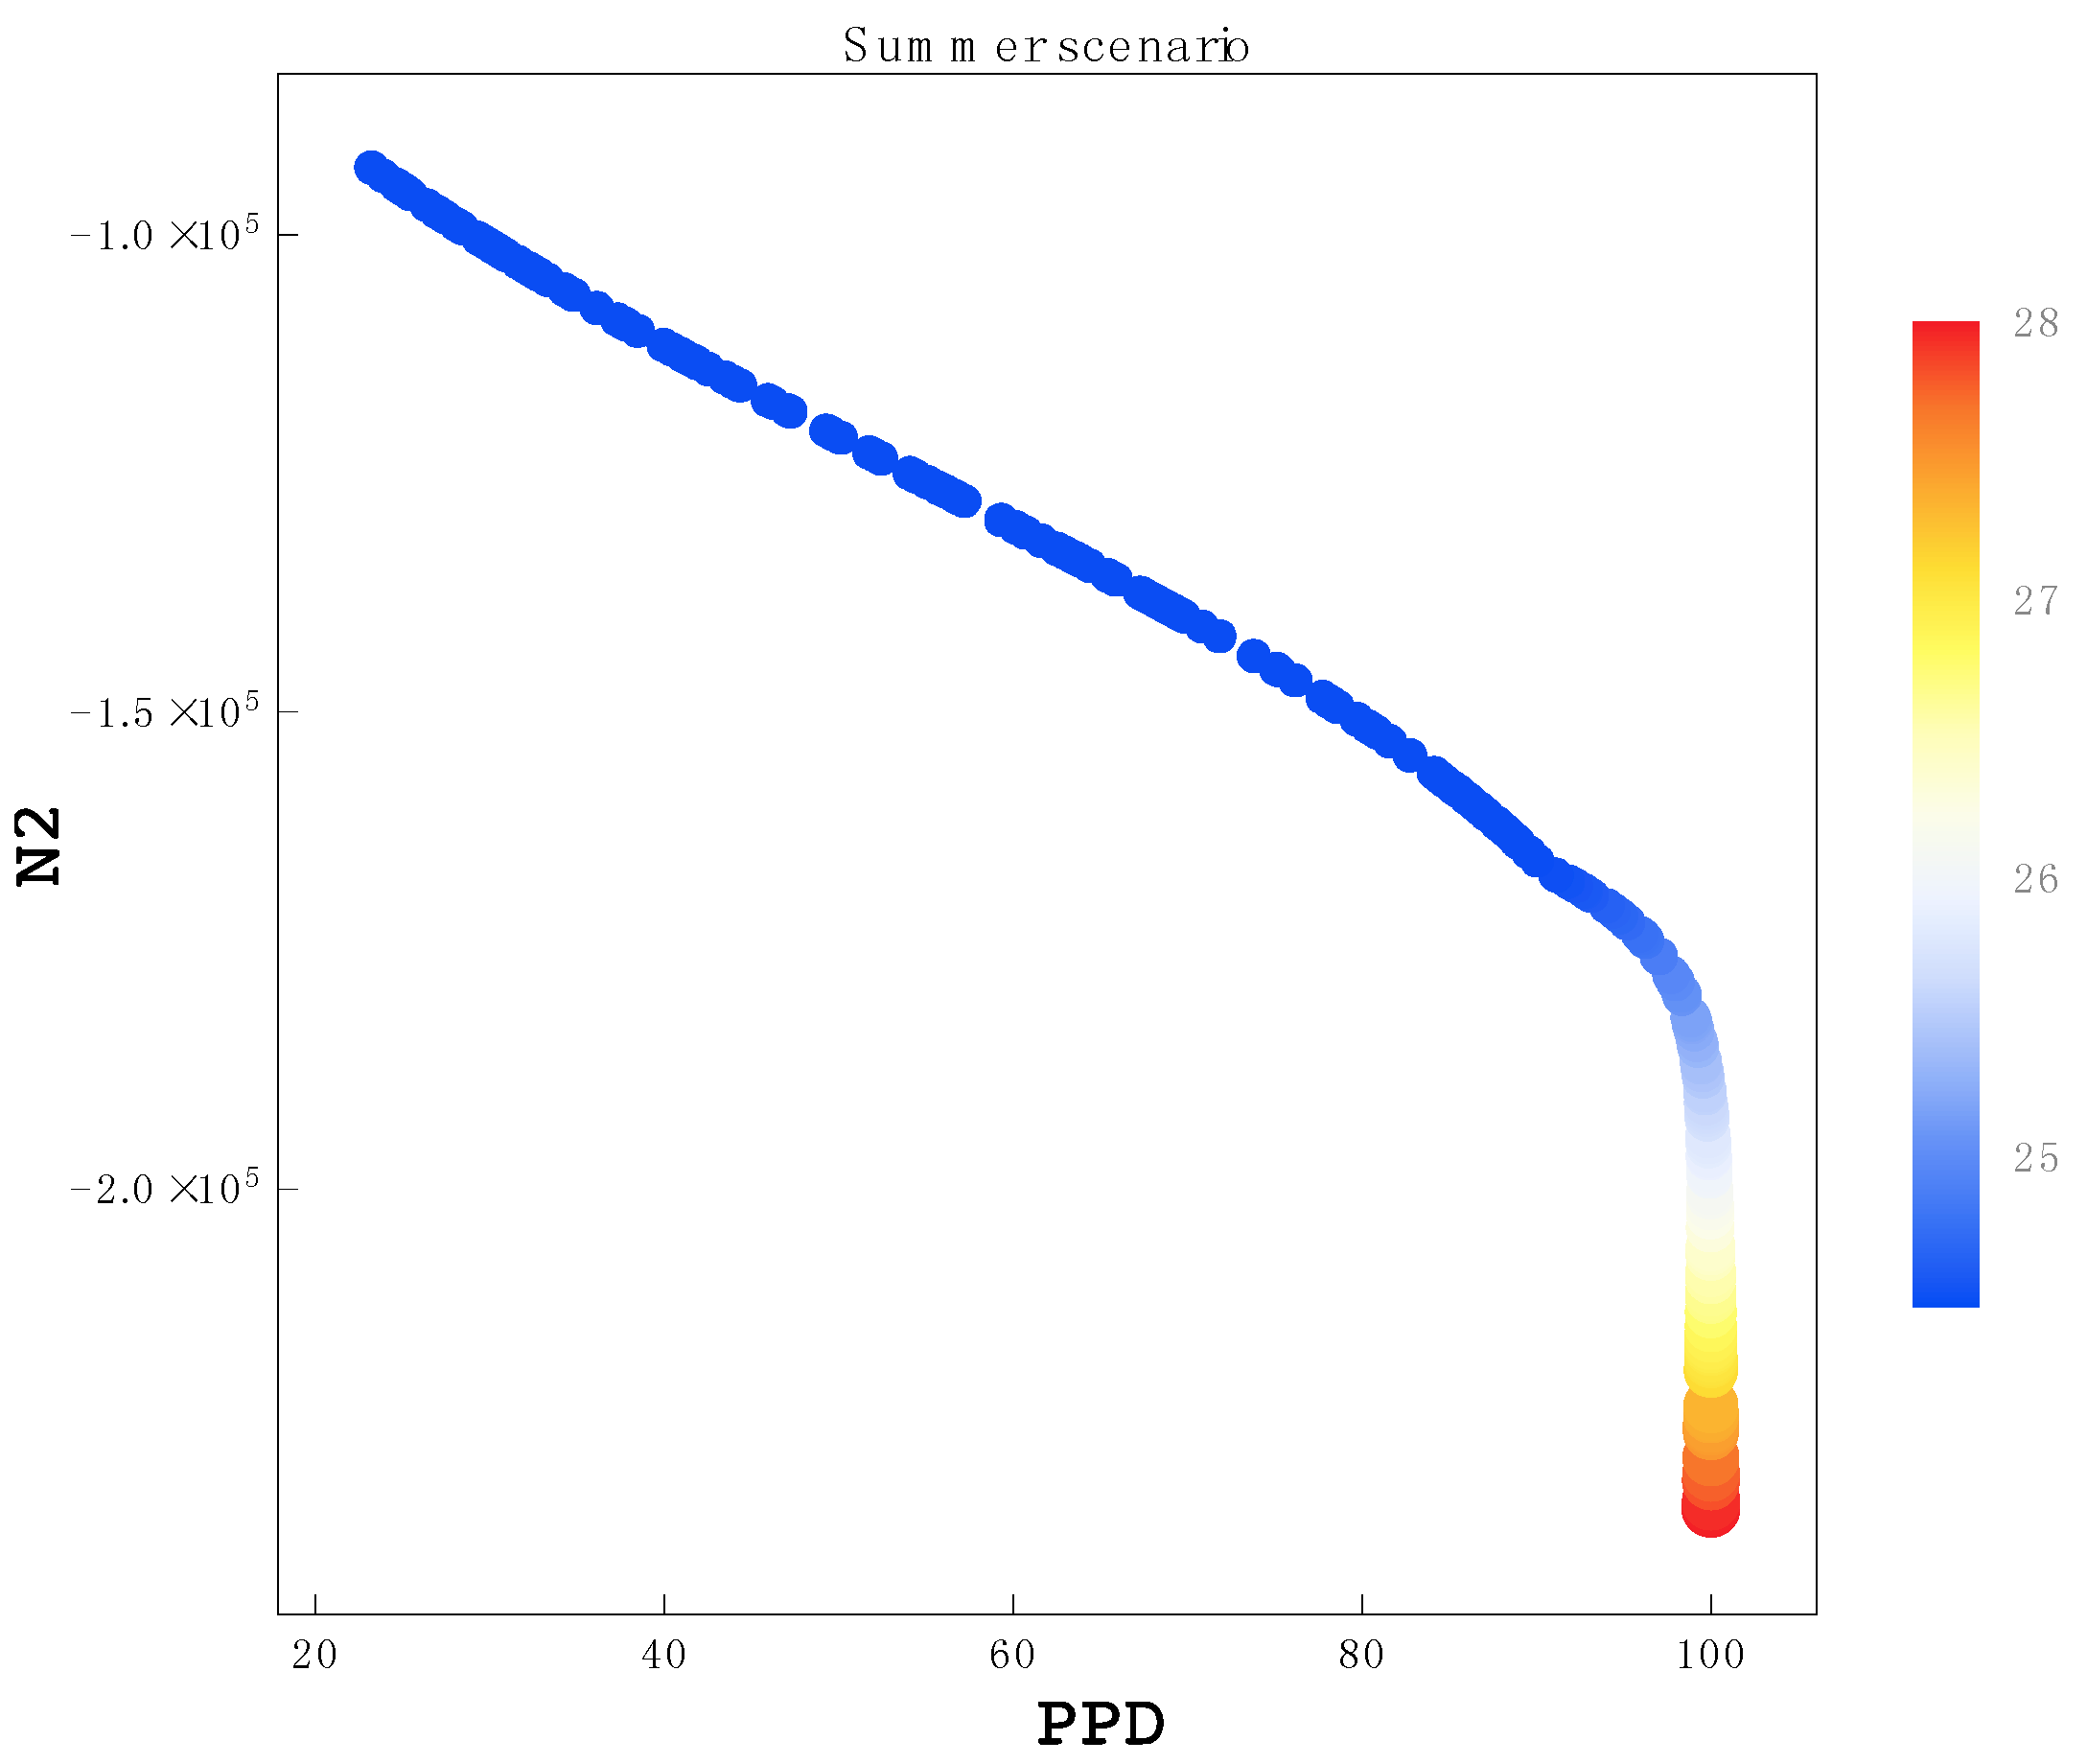
N3 relate to energy consumption on the building and citywide scales, respectively, so their minimization ultimately leads to a more efficient and comfortable city environment. The bubble chart for parameter
N2 vs. the PPD index is shown in
Figure 6 and selected values for PPD and
N2 are listed in
Table 5.
For this parameter, a Pareto frontier is obtained but the shape of the frontier does not evince any singularly optimal values. Instead, there is a linear trade-off between
N2 and PPD, with lower temperatures clearly favored for a lower PPD. The temperature dependence was also analyzed in this case (
Figure 7). No solutions exist for temperatures higher than 30 °C, and there is 100% dissatisfaction even at 28 °C, a very typical summer temperature for Ancona.
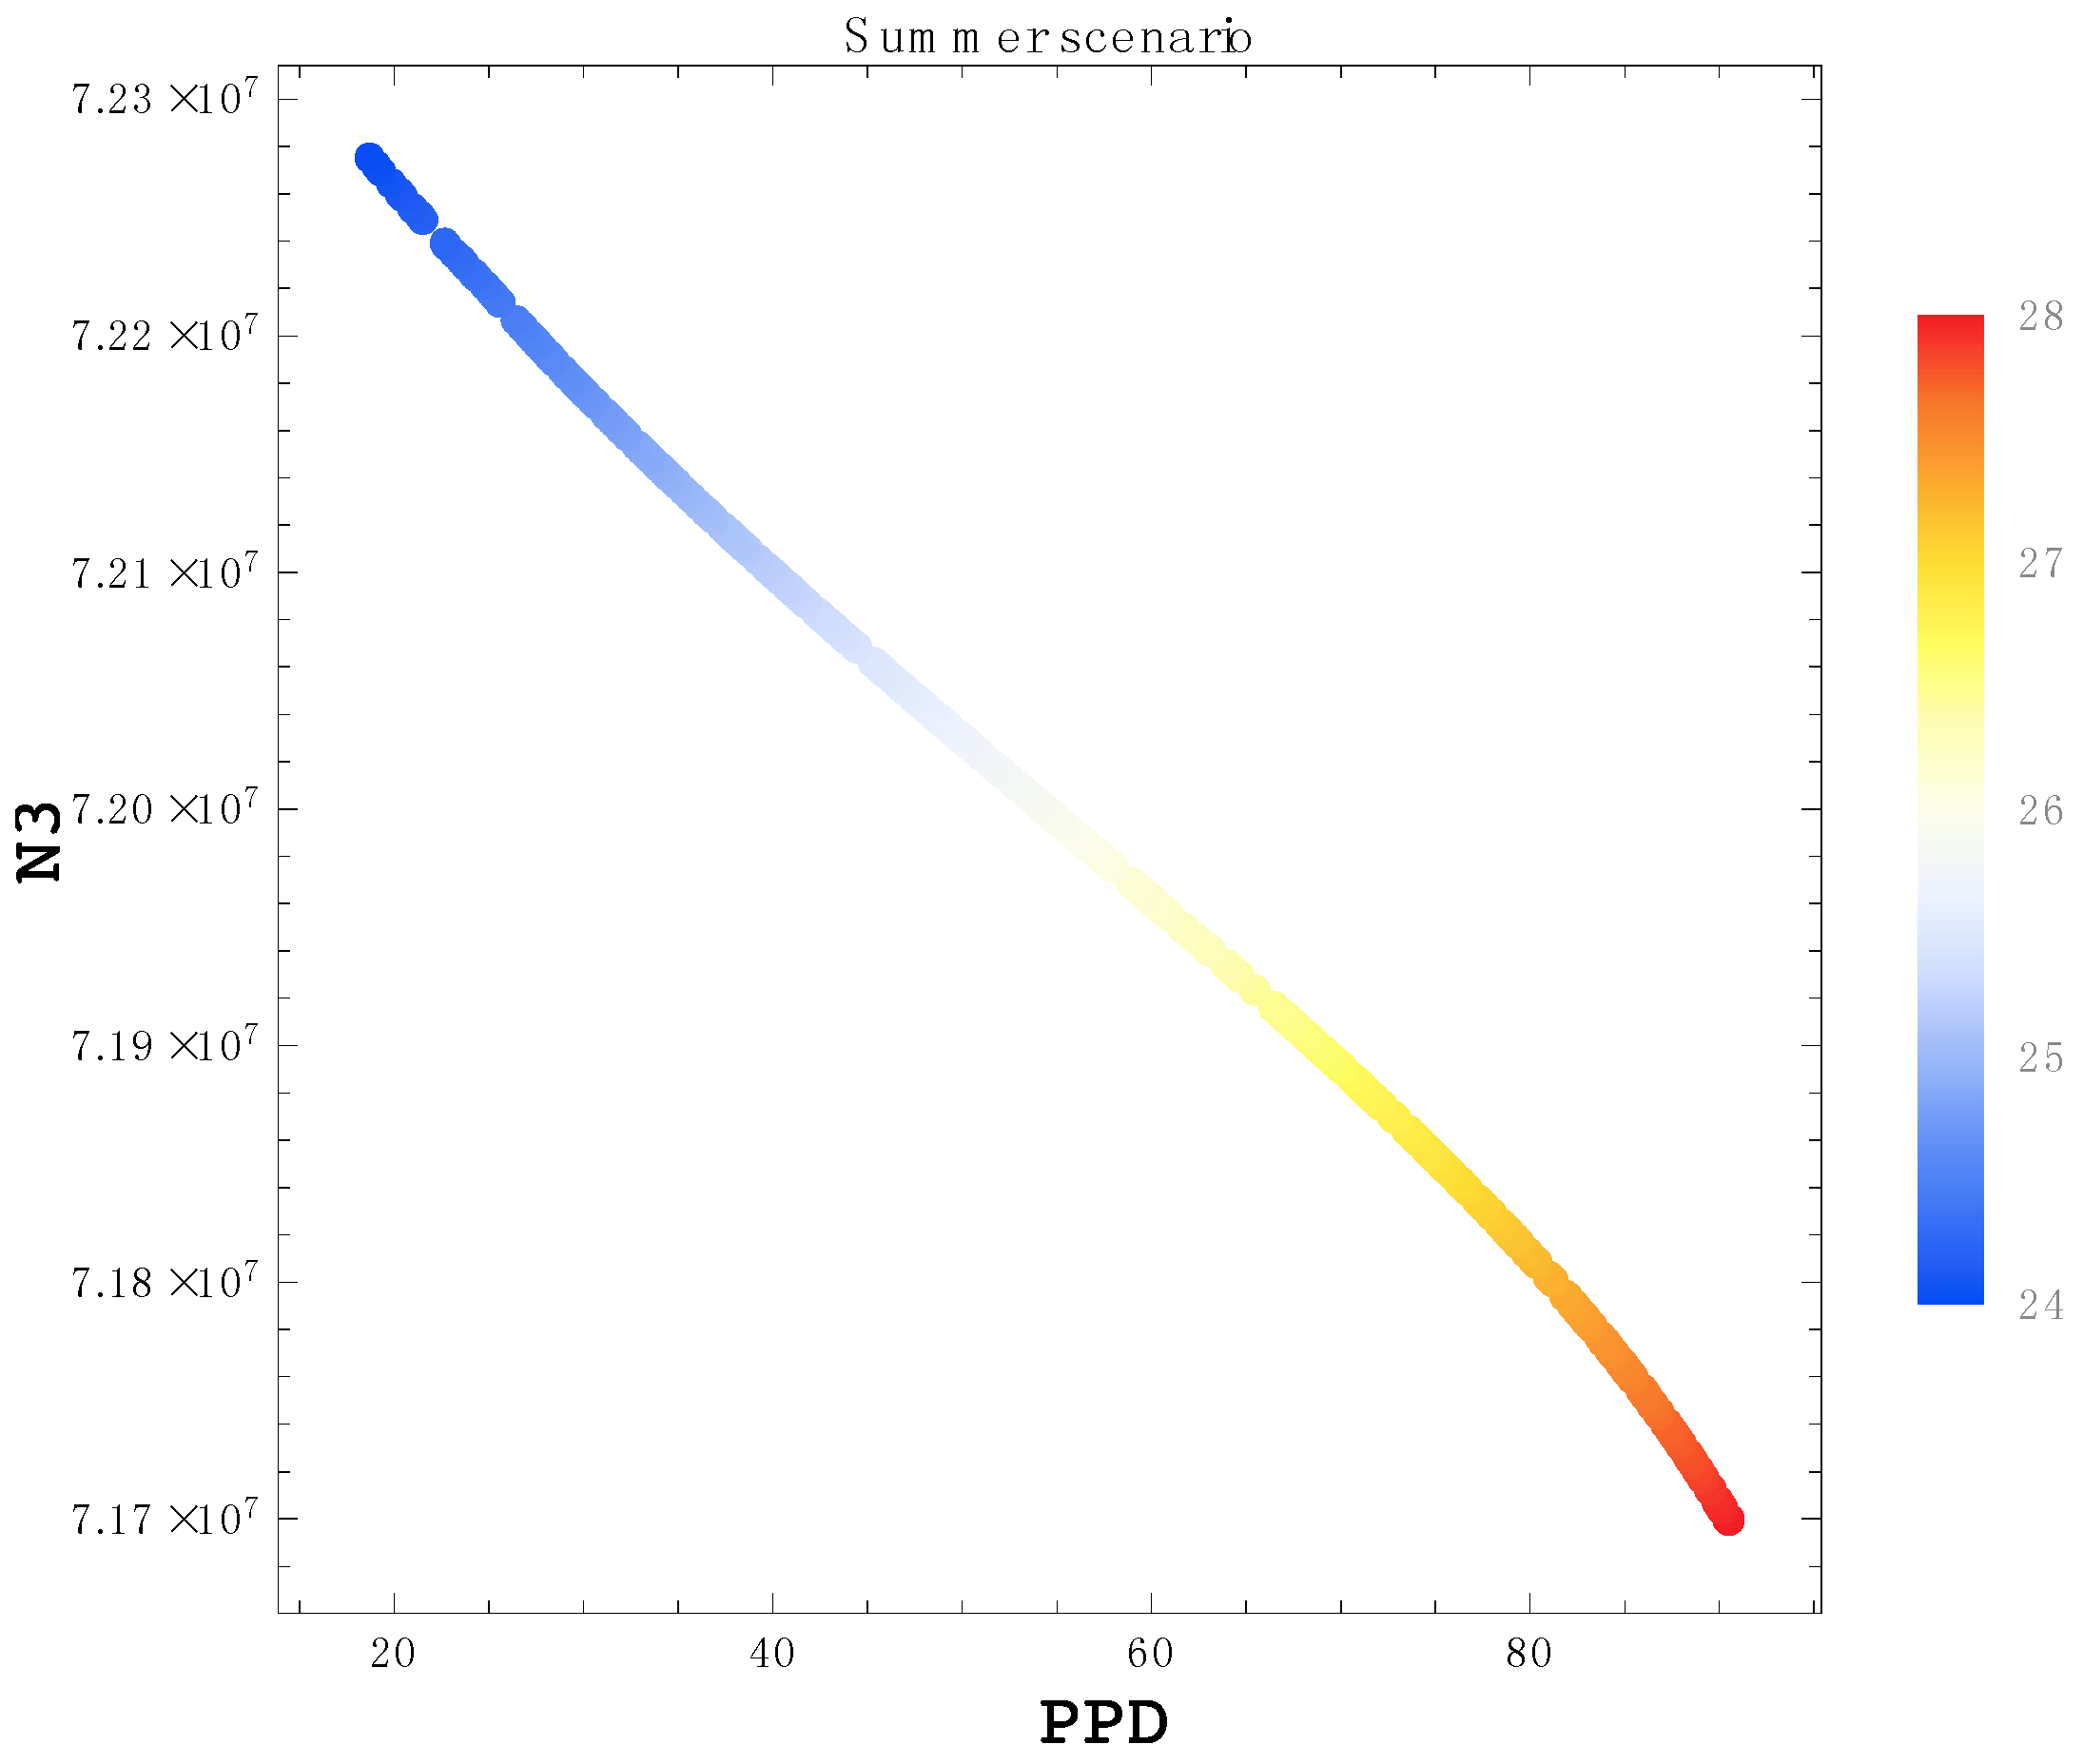
Finally, the bubble chart for parameter
N3 vs. the PPD index is shown in
Figure 8, and selected values for PPD and
N3 are listed in
Table 6. The results in this case largely reflect what was shown above for
N2: no clear minimization of both parameters can be made for this scenario. The values listed in the table are representative of the results presented in the bubble chart, which again shows a clear relationship between temperature and thermal comfort. Further temperature analysis has shown that no solutions exist even at 25 °C, a rather cool summer temperature for Ancona.
Since outdoor temperature is the leading parameter, however, it must be reduced in order to obtain Pareto optimal solutions and therefore provide indications to mitigate the UHI effect. To aid in understanding the relationship between temperature and the other variables considered in the optimization, as well as additional correlations,
Figure 9,
Figure 10 and
Figure 11 present different information output graphically by modeFRONTIER.
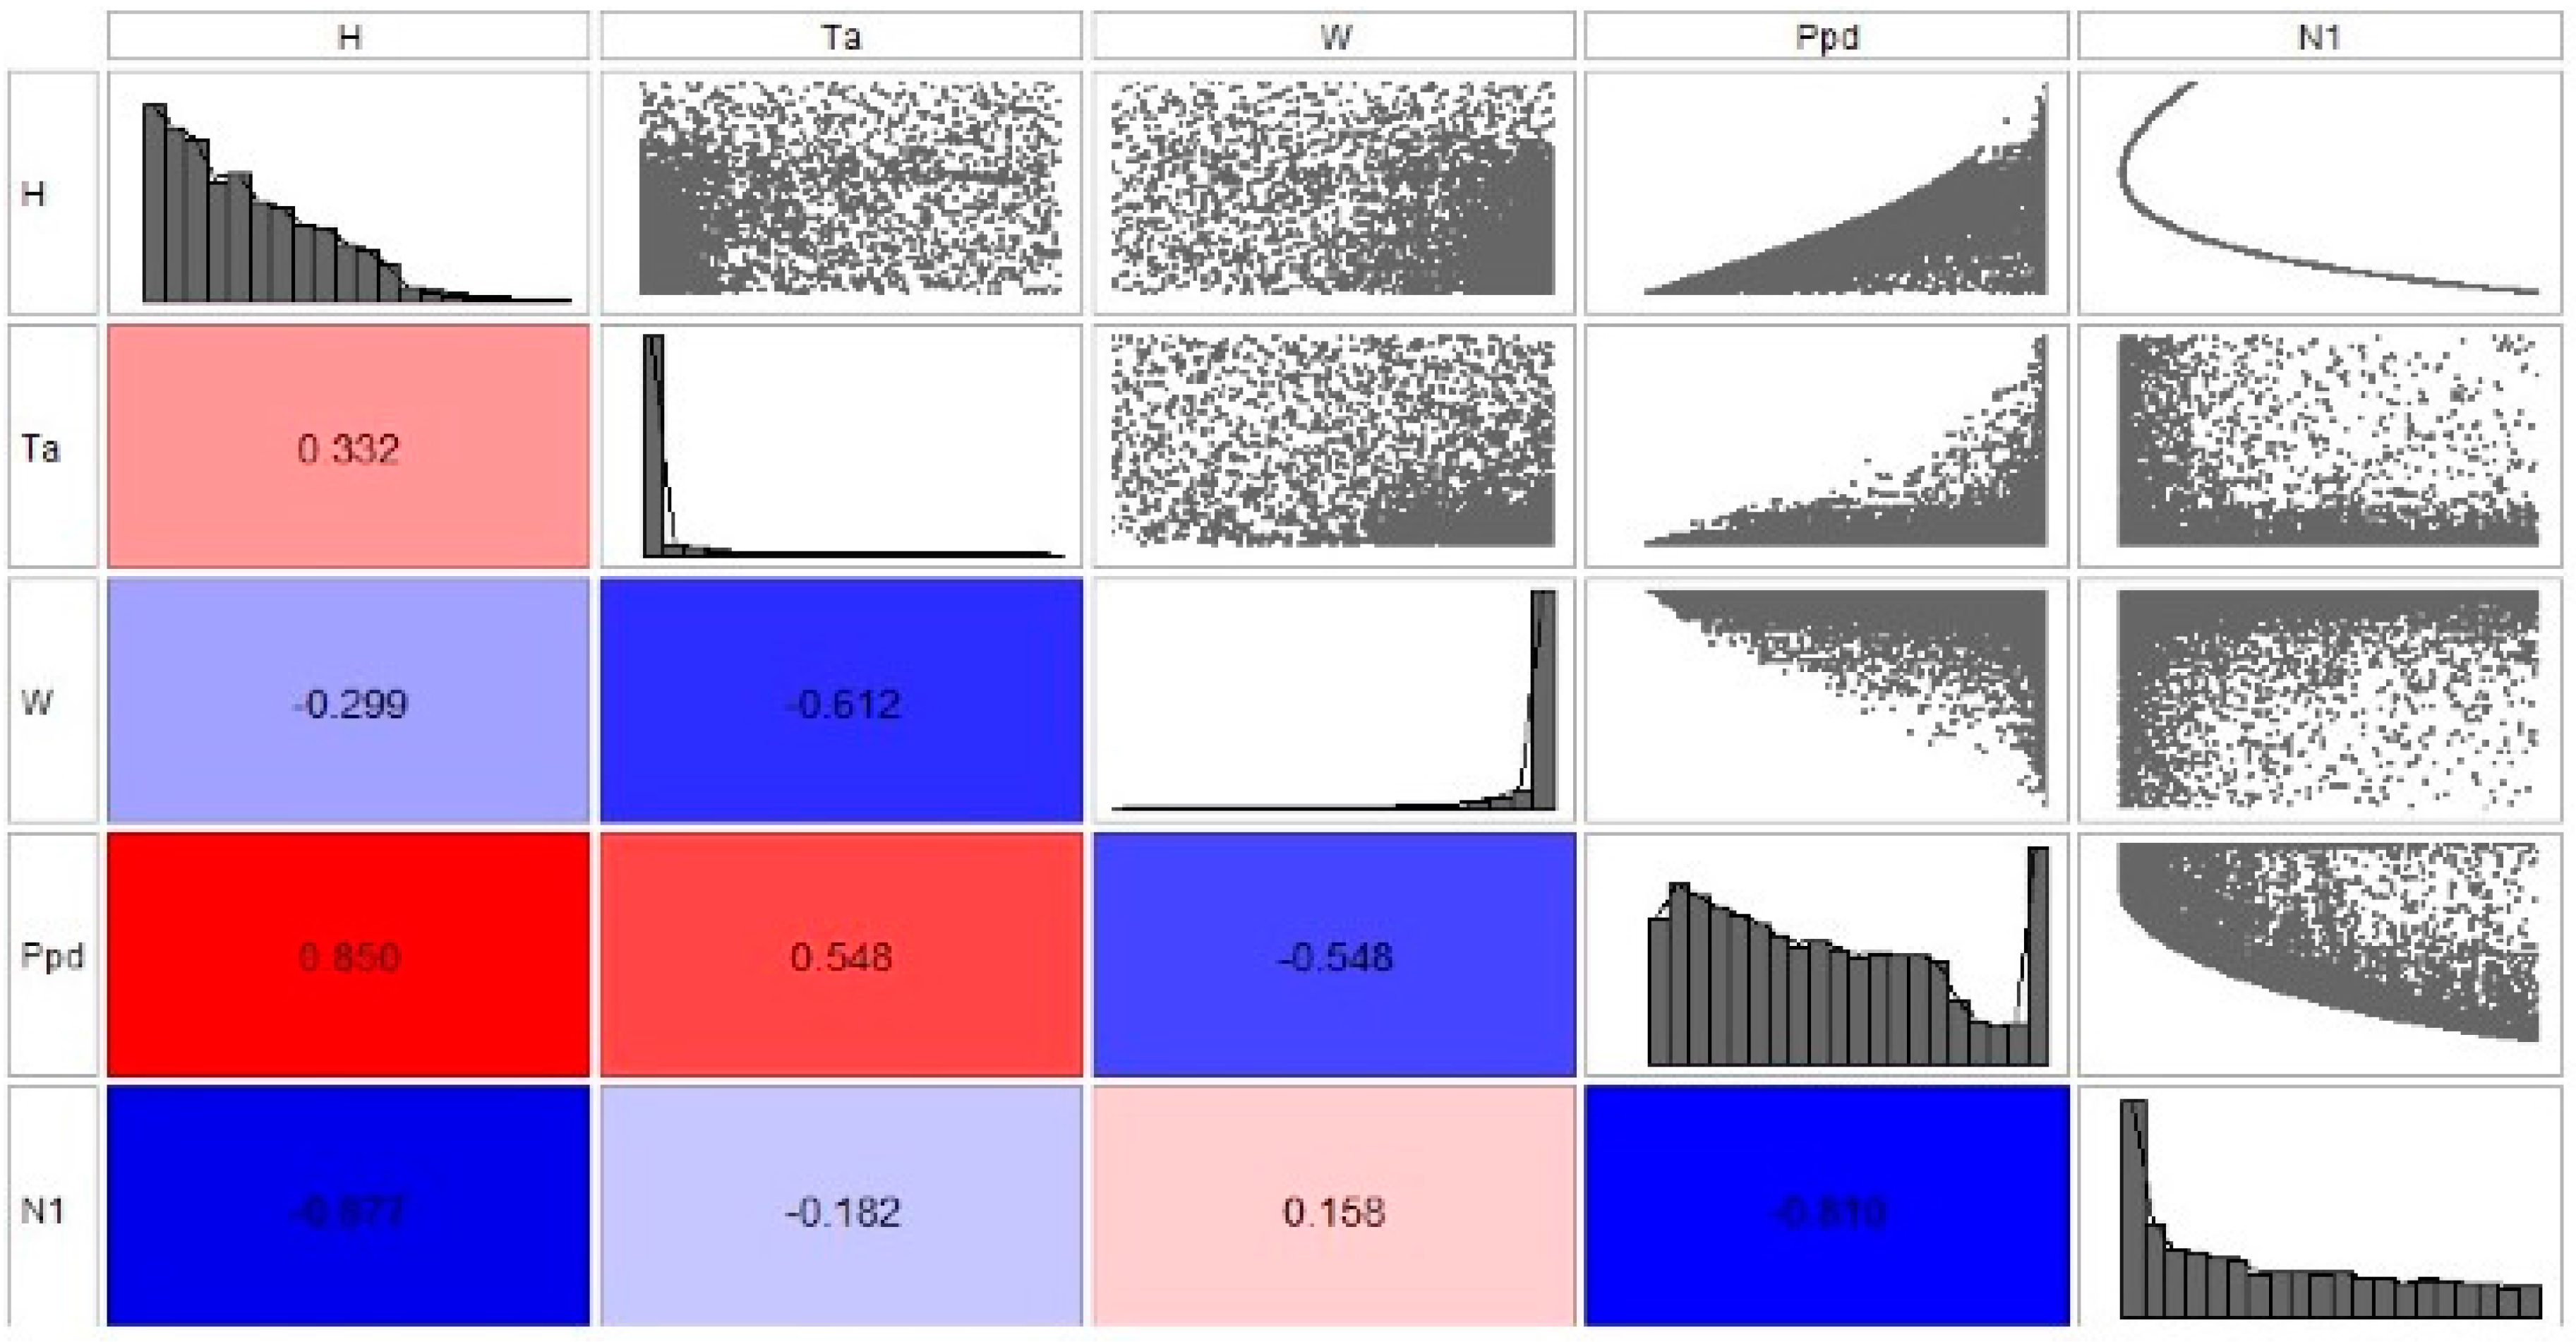
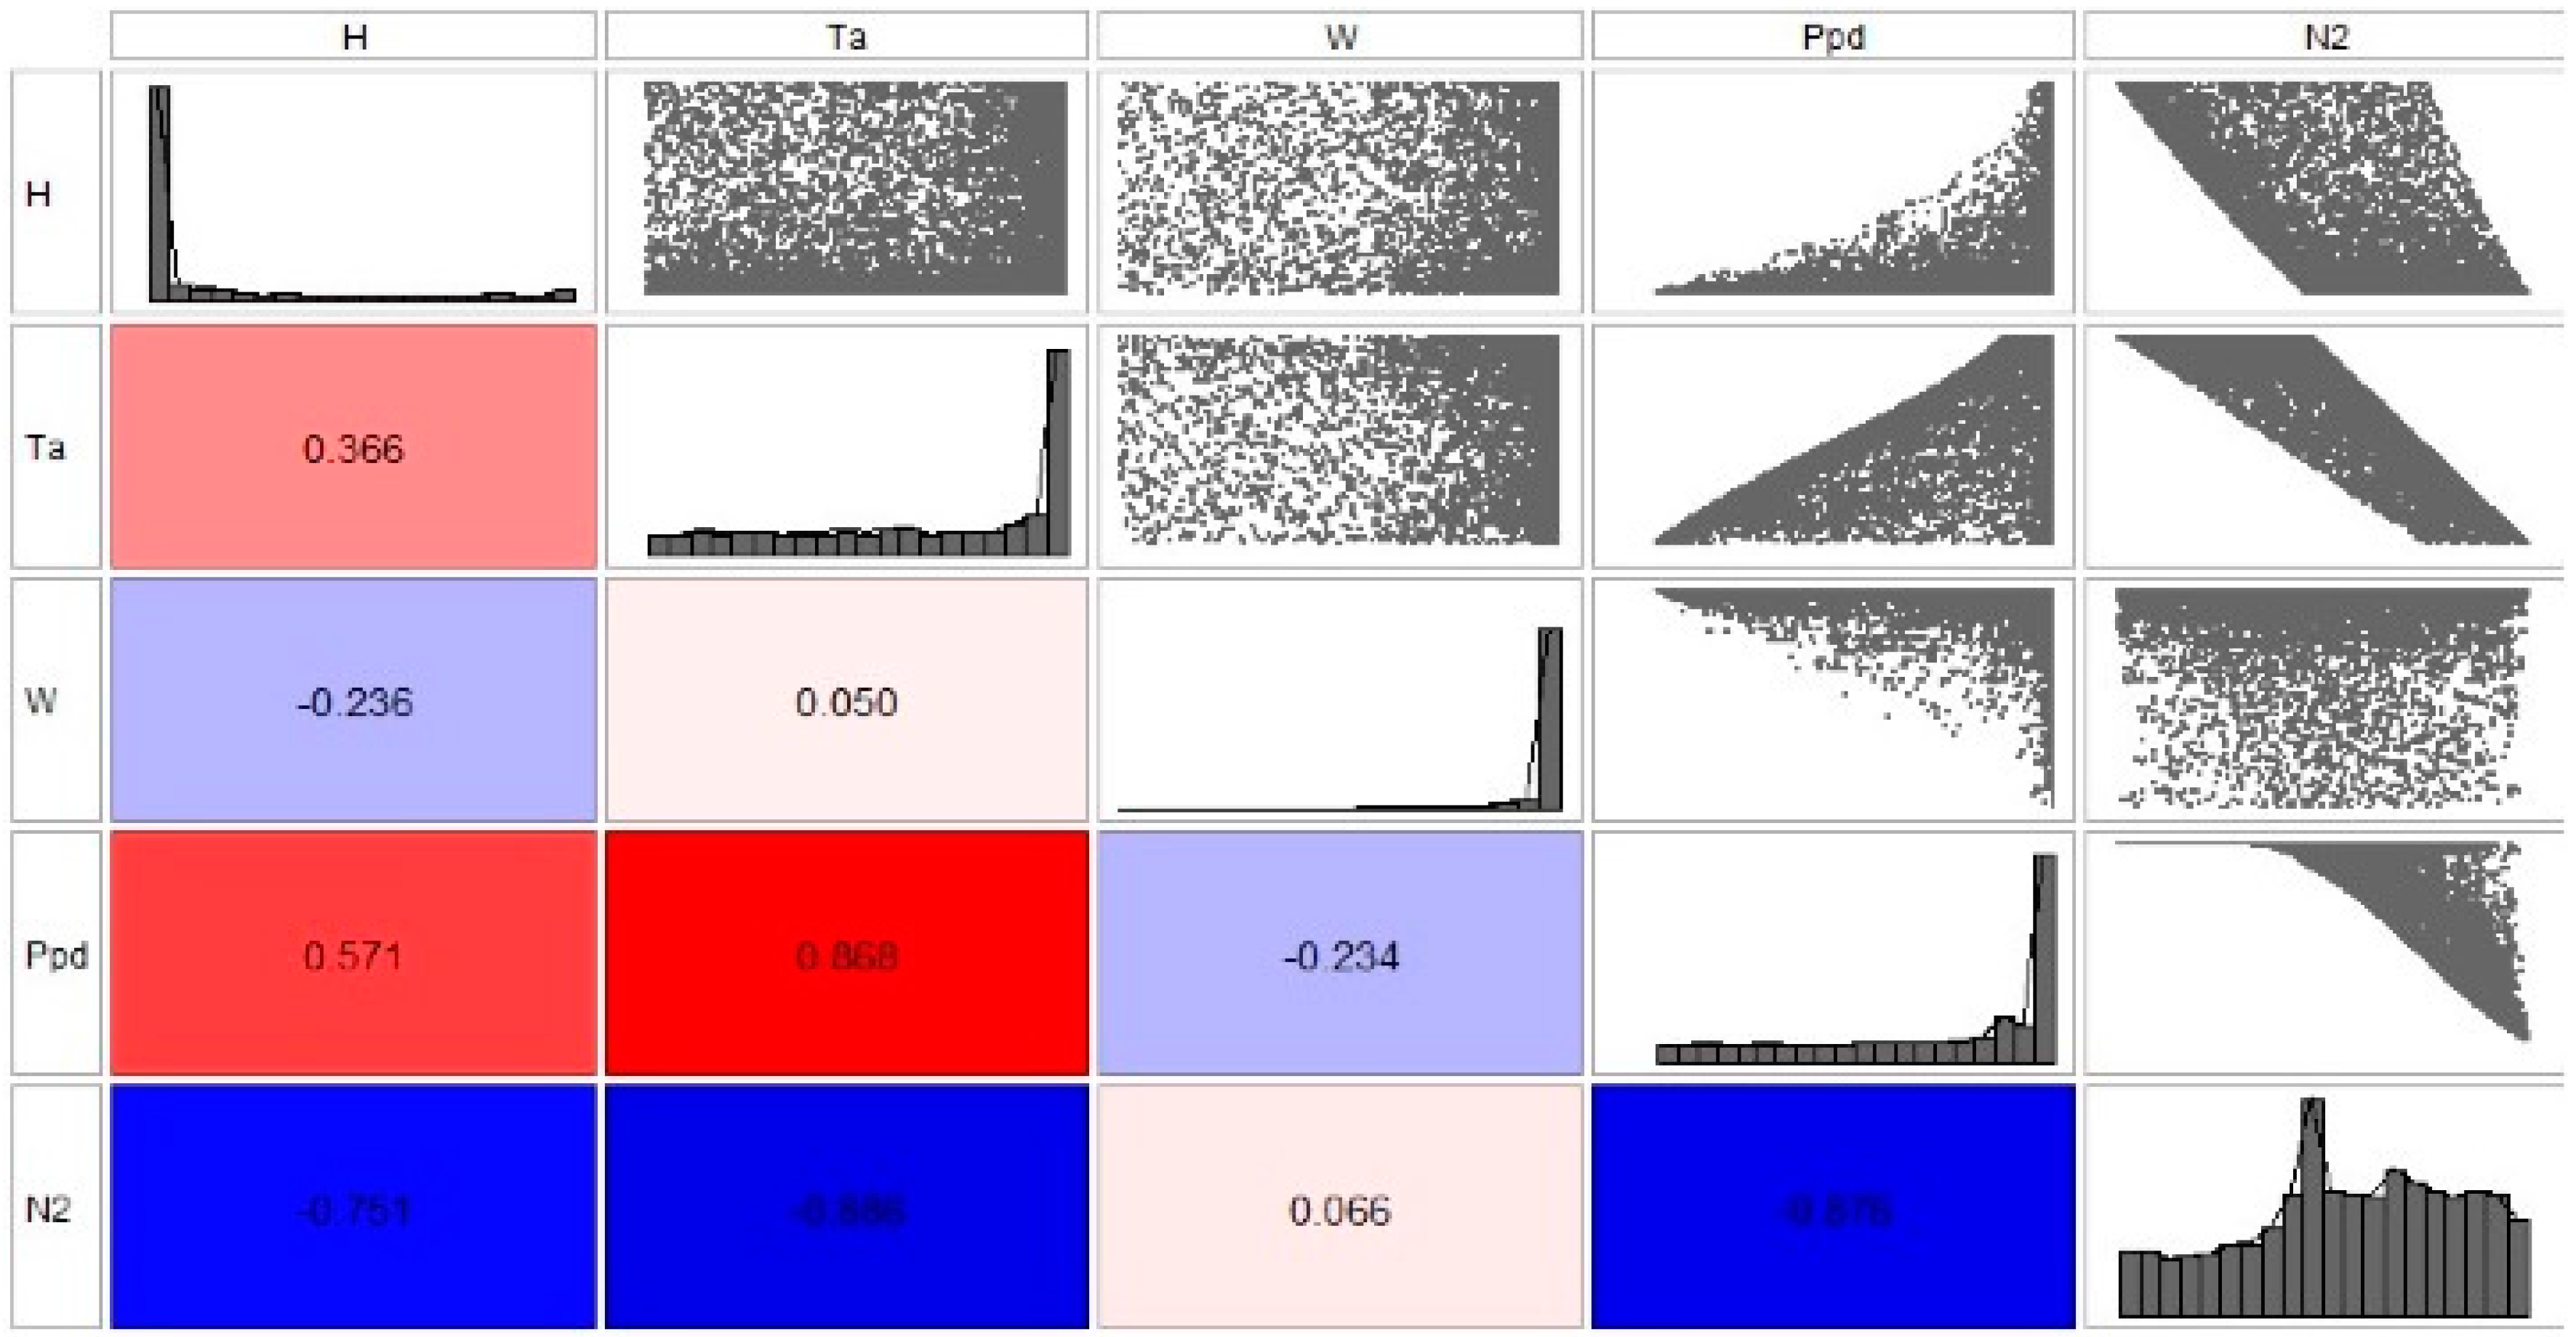
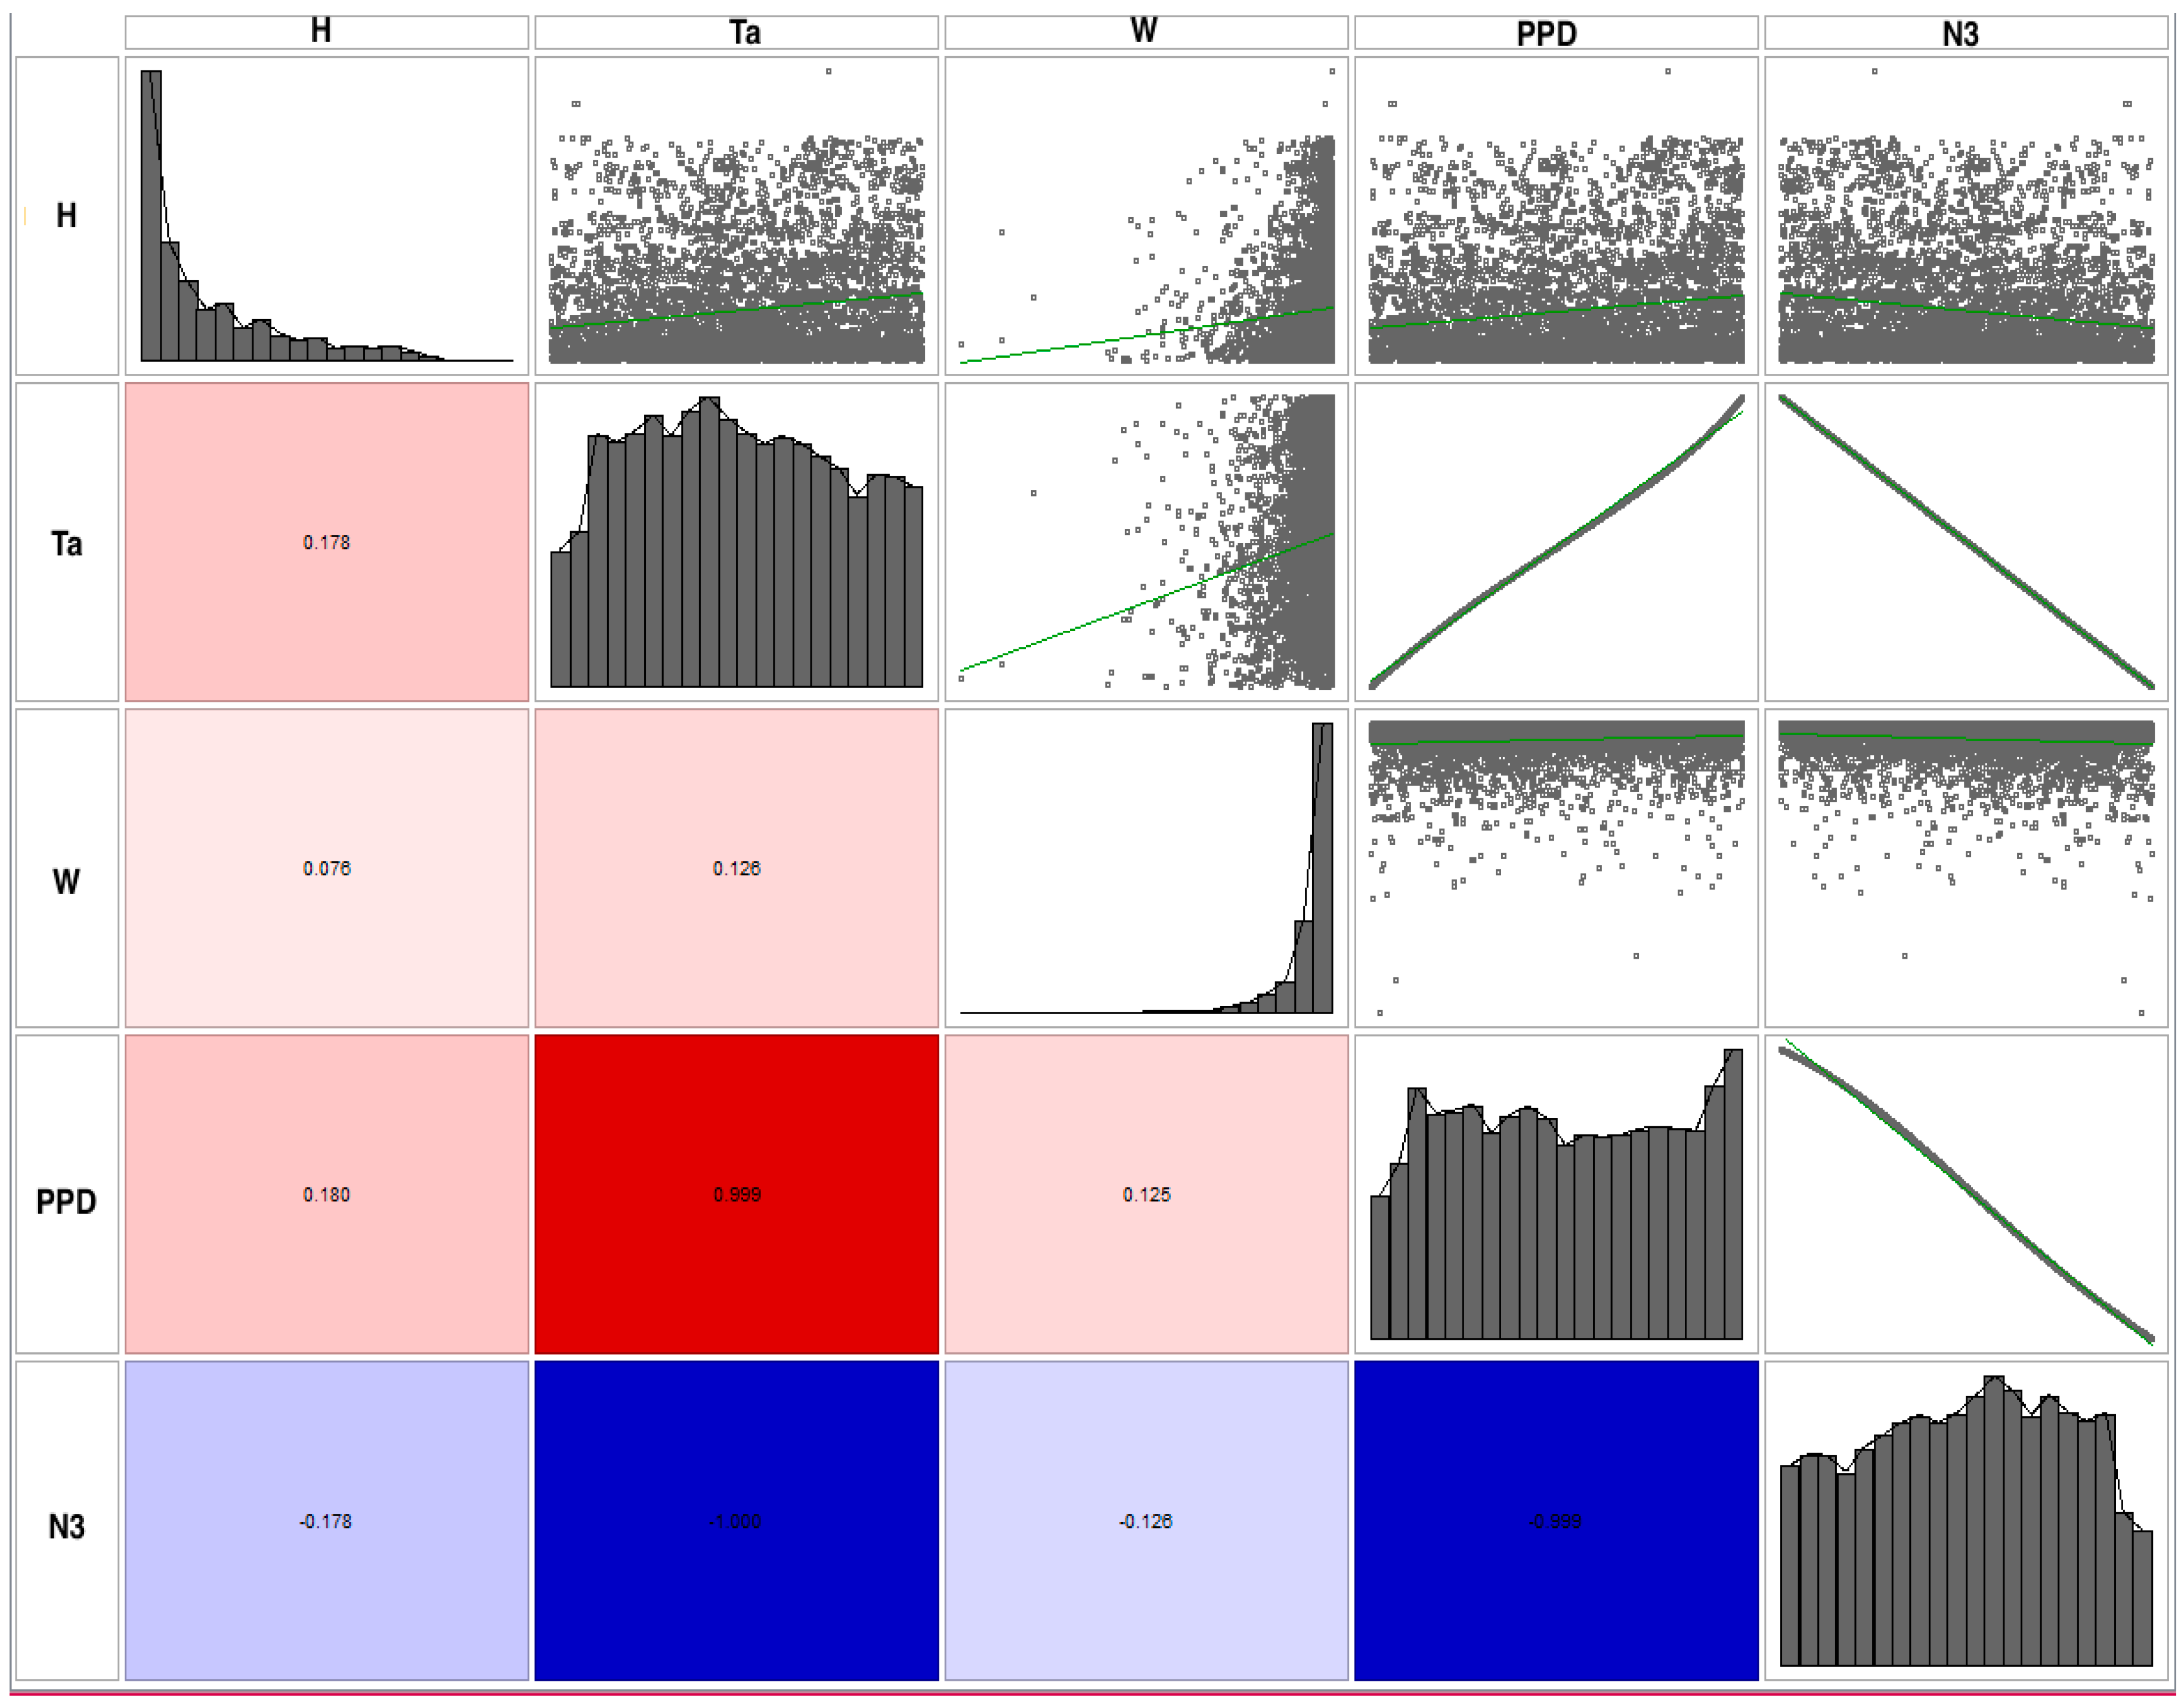
For a given set of variables, the scatter matrix chart [
43] contains: pairwise scatter plots of all the variables; correlation values between all the variables; and the probability density function (PDF) chart for each variable. In particular, for
n variables, the scatter plot matrix contains
n rows and
n columns and element [
i,
j] of the matrix (above the diagonal) contains a scatter chart of variable
i vs. variable
j. The PDF charts for variable
i lie along the diagonal. Since variable
i vs. variable
j is equivalent to variable
j vs. variable
i with the axes reversed, every element of the matrix below the diagonal shows the correlation value between variables
i and
j. Data presented in such a scatter matrix provides important information about the relationships between variables and whether they are direct or inverse.
A correlation index,
r, can be computed for each pair of variables,
where
N is the number of pairs and
x and
y are the variables considered. In the figures, the values in the colored boxes below the diagonal represent the correlation between two variables; a value of one represents a full positive correlation, while a value of zero means that the two values are uncorrelated. The color of the box is also representative, with bright red for a direct correlation and blue for an inverse correlation; the intensity of the color represents different correlation strengths.
The figures also show charts along the diagonal that represent the probability distribution for each variable, i.e., the number of solutions that fit into a given variable bin. Pairwise scatter plots of the variables are presented above the diagonal; the green lines highlight values pertaining to the Pareto frontier.
Some interesting correlations can be seen in these plots. As expected and as illustrated in
Figure 9, temperature has a minor effect on parameter
N1, with a correlation value of 0.110.
Figure 11 instead shows that there is a much stronger correlation of temperature with
N3, with a value of 1.00.
N2 also correlates highly with temperature. This is also confirmed by the scatter plots corresponding to temperature vs.
N1,
N2, and
N3 shown in
Figure 9,
Figure 10 and
Figure 11, respectively.
Figure 10 and
Figure 11 also reiterate the high correlation of temperature with PPD. One further interesting aspect is the relatively high correlation of building height with PPD as shown in
Figure 9 and
Figure 10, which also appears in
Figure 11 to a lesser degree. This is certainly an aspect that deserves further investigation.
4. Conclusions
In recent years, a lot of research and applications have looked at the energy efficiency of buildings. Many models have developed knowledge regarding insulation, thermal inertia, and renewable energy production. In contrast, themes related to phenomena on the larger urban scale have not been sufficiently investigated, and a well-accepted theory that can be used by planners still has not been formulated. One aspect that remains unresolved, for example, is the apparent paradox between the general trend to increase building density and the impact that such a process can have on the urban microclimate and the quality of life in the city. There is certainly a relationship between the urban form and energy efficiency, but there are numerous parameters regarding the form that need to be considered specifically, and reciprocal relationships that need to be investigated in order to reduce atmospheric emissions and improve energy efficiency. Widening this view and considering the city as an ecosystem would encourage adoption of a global vision that deals with the city, the efficiency of its form and buildings, the effectiveness of new technologies, and inhabitants’ behavior in an overall, integrated manner. This, then, becomes the way to orient the city toward sustainable urban development.
The main objective of this research was to identify the connections and mutual dynamic relationships between different attributes of the urban morphology and meteorological parameters. The results of this type of multi-objective optimization can be used to study different hypothetical building scenarios leading to the selection of those parameters that can best inform decisions and policies for change indicated as objectives for each scenario.
Analysis of the case study (Ancona) allowed various city parameters to be tested for sustainability and their effectiveness in mitigating the UHI effect. It has served as a proof-of-concept in providing effective support for the parametric analysis of building design by combining urban morphology indicators with meteorological parameters. Thermodynamic indicators (N1, N2, and N3) useful for the energy planning of urban areas, and for defining scenarios of integrated low-environmental-impact energy strategies and actions in an urban area were considered. The results show that compacity (N1) and thermodynamic indicator N2 can be useful parameters when designing comfortable cities. Their optimization implies different planning/building layouts to improve thermal comfort, such as wide streets and medium-height buildings in places where the wind speed is low. Parameter N3, on the other hand, shows that, within the limits of the model, it is even more difficult to find optimal solutions when dealing with the city as a whole. The temperatures examined are not at all extreme for summers in Ancona but represent typical real values in the representative summer scenario. This analysis shows that the external temperature can be considered the “dominant” variable in planning. On the building scale (N1), increasing the external temperature leads to an inversion of the Pareto frontier and therefore for temperatures greater than 33 °C (in the case study presented here) there are no possible solutions. Analogously for N2, there are no solutions for temperatures higher than 30 °C, and there is complete discomfort (100% PPD) even at 28 °C.
External temperatures are increasing due to climate change, and Italy in particular is seeing a higher increase in temperature compared to the European average. The analysis thus highlights the importance of reducing the outdoor temperature with physical elements such as green areas, green canopies, highly retroreflective materials, and urban shading. This initial result, applied to a typical Mediterranean city (Ancona), shows how important it is to mitigate the increase in temperature from a planning point of view. This research highlights a series of possible solutions that would allow energy consumption to be limited while improving the thermal comfort for users.
However, this is only the first step in this new technique and further development efforts are already being considered. In particular, an in-depth analysis should also be carried out for the winter scenario in order to identify the optimal characteristics of the city during cooler parts of the year. These would of course then be compared to the results for the summer scenario in order to find a suitable middle ground. As well, a wider set of parameters (building materials, green façades, solar devices, shading devices, etc.) should be considered. These aspects are particularly important during the hot summer months in order to reduce the effect of the urban heat island (UHI) and improve comfort in the city.
