1. Introduction
Coal is an especially crucial fuel in this uncertain world. Its low cost and wide availability make it especially attractive in major developing economies, such as China and India, for meeting their pressing energy needs [
1]. According to BP [
2], in 2012, the proportion of Chinese coal consumption of the world’s total coal consumption was more than 50% for the first time. In China, Shandong Province is one of the largest coal consumption provinces. Its coal consumption was up to 380 million tons in 2012, accounting for 12.5% of China’s and 6.3% of the world’s coal consumption. On one hand, China’s strong demand for energy has led to increases in coal import. By 2030, China’s coal import dependence will increase to 23% under a low growth scenario and up to 45% under a high growth scenario [
3]. On the other hand, coal faces significant environmental challenges in terms of mining, air pollution, and, importantly, emissions of carbon dioxide [
1]. So, determining what the driving forces of coal consumption in Shandong Province are, and to what extent these forces have impact, is not only beneficial to guarantee China’s energy security, but is also helpful for global environmental protection.
Shandong province is one of the largest provinces in terms of economic output in China, and it is also the biggest energy consumer of the provinces. In 2013, the economic output in Shandong province accounted for 9.6% of China’s total economic output. Moreover, the proportion of energy consumption in Shandong province has risen to 10.9%. Furthermore, coal consumption represents the majority of energy consumption, and its share is as high as 73.8%. In recent years, along with rapid industrialization and urbanization in Shandong province, energy consumption, especially coal, has increased rapidly. Speaking specifically, the industrial development of Shandong province has been relying on the comparative advantages of natural resources. The majority of the industrial enterprises were those focused on either energy exploitation or raw material supply. For instance, the growth of the south and southwest regions in Shandong province has mainly relied on coal mining and coal chemical industries. Moreover, these industries are characterized by high energy consumption, high resource input and high pollution. Since 2005, Shandong province has become one of the most affected areas of China by haze weather. The rapid degeneration of air quality which is caused by the traditional extensive production pattern in Shandong province has seriously influenced the sustainable development of the economy and people’s health. In addition, the rising urbanization rate is one of the main factors promoting coal consumption in Shandong province. The urbanization rate has increased constantly since 2005, with an average annual increase of 1.09 percentage points. The increased traffic volume due to the mass migration movements and the transformation of lifestyle promote the consumption of coal directly or indirectly. Quantitative analysis of these factors can provide a reference for developing more effective energy-saving policies.
Many research studies have been carried on coal consumption [
4,
5,
6,
7,
8,
9,
10,
11,
12,
13,
14,
15]. From a national perspective, the researches were mainly concentrated in countries which consumed a large amount of coal [
16,
17,
18]. Yildirim et al. investigated the causality relationship among industrial production index and coal consumption in USA [
16]. Bloch et al. probed the relationship between coal consumption and income in China [
17], while Govindaraju and Tang employed econometric methods to provide more conclusive evidence on the nexus of economic growth and coal consumption in India [
18]. Moreover, similar studies have also been carried out in other countries [
19,
20,
21,
22,
23,
24]. Speaking of the research approaches, the two most commonly used methods are the index decomposition method and the econometric method [
5,
8,
10,
11,
25,
26,
27].
Overviewing the existing literature, we can find that the vast majority of research focuses on the relationships between coal consumption, economic growth and CO
2 emissions. The driving forces of coal consumption are less studied, though important. Moreover, existing literature has paid more attention at the national level than regional or provincial levels. However, it cannot be ignored that there are significant regional differences in coal consumption, whether between countries or within countries. Therefore, investigating the main driving forces of coal consumption at the provincial level is important in most districts of the world. In addition, theoretical assumptions based on the existing literature are questionable. Most of the existing researches adopt linear models to study the nexus of coal consumption and other economic variables [
5,
7,
15,
21,
28,
29]. Granger [
30] pointed out that the world is almost certainly constituted by nonlinear relationships, and Anderson et al. [
31] found that the large number of nonlinear relationships embodied in economic variables have been ignored. Furthermore, the traditional econometric methods are based on economic theory and use these theories to determine whether a variable is endogenous or exogenous. So, the determination process often lacks objectivity. Moreover, endogenous variables can be placed on the right side of the equation and also can appear on the left side of the equation. This makes model estimation and inference more complex [
32].
Our paper advances the available literature because it (i) increases the amount of empirical research on coal consumption on a district scale; (ii) a VAR (Vector autoregression) model was used to overcome the problems from endogenous and nonlinear relationships between the economic variables; (iii) it used the STIRPAT (Stochastic Impacts by Regression on Population, Affluence, and Technology) model as a theoretical direction and based it on the actual situation in Shandong Province, identifying the main driving forces of coal consumption and proposing appropriate abatement measures.
The rest of the paper is structured as follows. In
Section 2, we outline the methodology and data followed by
Section 3, which presents the empirical analysis. The discussion is presented in
Section 4. Conclusions are outlined in
Section 5.
2. Methodologies and Data Definitions
2.1. VAR Model
The VAR model was first introduced to econometrics by Sims [
33]. It is the application of multivariate AR (Autoregressive) models in econometrics. Compared with conventional simultaneous equations models, the VAR model has the following advantages. Firstly, it was built on mathematical statistics properties of economic data rather than economic theory. Secondly, in the VAR model, all variables are endogenous variables and each equation forms a regression with the lagged values of all endogenous variables to estimate the dynamic relationships between all the endogenous variables [
34]. Thirdly, the impulse response and variance decomposition based on the stable VAR can reveal the relationship between variables visually.
The general VAR (p) model can expressed as follows:
where
yt,
t = 1, 2, …,
T, is a
K × 1 vector of time series,
is a
M × 1 vector of exogenous variables.
A and
B are
K ×
K and
K ×
M coefficients matrix to be estimated, respectively.
is the random error term.
Determining the lag length
p is a difficult and conflicting process when building the VAR model. The lag length
p can neither be too big nor too small. Because, on the one hand, the larger
p is, the more obvious dynamic characteristics are reflected by the model. However, on the other hand, the larger lag length means the more parameters to be estimated and the lower degrees of freedom [
35]. Therefore, it is necessary to find a balance between the lag length and degrees of freedom.
In this study, we use Akaike Information Criterion (AIC) and Swartz Criteria (SC) as the choosing principles. The two statistics can be expressed as follows:
where
k is the number of parameters to be estimated.
n represents sample size and satisfied the following formula.
2.2. Stationary Test
The vast majority of econometric models require that the economic series are stationary. If the non-stationary economic variable was used without testing, the established models which include this variable would be unreasonable. Therefore, it is necessary to implement a stationary test prior to establishing the model for analysis [
36]. In this paper, three methods most commonly used to test unit root were applied: Augmented Dickey Fuller (ADF) test, Kwiatkowski Phillips Schmidt Shin (KPSS) test, and Dickey Fuller GLS (DFGLS).
The ADF test is widely used by researchers when the series contain a high correction problem assuming that the series follow an AR (
p) process adding
p lagged difference of the dependent variable to the right side of the test regression [
37].
In empirical studies, although the ADF test is most widely used as a unit root test, its efficiency is low [
38]. When the sample is small and there is a high autocorrelation in data, the test results of ADF are unconvincing. Therefore, in order to improve the effectiveness of ADF test, Doan et al. proposed the DFGLS test [
39]. Both of these tests belong to the left-sided test and they have the same assumption that the economic sequence contains a constant and trend term. However, in fact, not all the economic sequences satisfy this assumption. However, KPSS test can overcome the limitations of the above two tests [
40]. In order to improve the credibility of the empirical results, the three test methods are used in the stationary test.
2.3. Model Specification
The IPAT identity was first proposed by Ehrlich and Holdren in the early 1970s [
41]. In this identity, they emphasized the impact of population growth on local and global environments. The model is as follows:
where
I is environmental impact,
P represents the population size,
A denotes affluence or economic activity per person.
T is the environmental impact per unit of economic activity. The model is simple, systematic and robust but has limitations. Thus, using this model as a basis, Dietz and Rosa [
42] reformulated it slightly and developed a stochastic version of the IPAT. The reformulation assumes a stochastic version of Equation (5):
Here,
I,
P,
A and
T are the same as that in Equation (5), the added subscript “
i” emphasizing that these quantities vary across observation units, “
i” was typically replaced by “
t” since it is annual data analysis. The quantities
a,
b,
c and
d are coefficients to be estimated by standard statistical techniques.
ei is the random residual term. The STIRPAT model allows tests of hypotheses regarding factors other than population, affluence and technology that may modify environmental impact. In order to eliminate spurious regression caused by heteroscedasticity which possibly exist in the model and facilitate hypothesis testing, and all the factors take logarithmic form [
43] and use L to represent. As the time series data is the research object, we use subscript “
t” instead “
i”. Then, Equation (6) can be expressed as:
The definition of environmental impact varied with the specific objective of study; usually, it was denoted by GHGs (Greenhouse gases) emissions, carbon emissions or the consumption of natural resources. Herein, we use the coal consumption to indicate environmental impact.
A is measured by per capita GDP (Gross Domestic Product),
P denotes population size,
T represents a technology index. In order to investigate the impacts of the driving forces of the coal consumption in Shandong province, we rewrote Equation (7) as follows:
Here, COAL denotes total coal consumption, the units is ten thousands tons of standard coal equivalent (104 tce), POP is population size (104 persons), GDP represents per capita GDP of 1990 constant yuan, CI is coal intensity and it denotes the technology level which was measured by coal consumption per unit of output (tons of standard coal use per 104 yuan). b, c and d represent the elasticities of coal consumption in response to changes in population, per capita GDP, and coal intensity, respectively. They refer to proportional change in total coal consumption to a change in any driving force with the other variables unchanged. La is the constant term and εt is the error term.
To further analyze the driving forces of total coal consumption, and with the consideration of the uniqueness of Shandong province, we expand the STIRPAT model by incorporating urbanization level, industrialization level and the oil consumption into the model. However, population scale is deleted from the model because China has been implementing a strict family planning policy over recent decades. Then, adding the above three variables to the model is based on the following reasons. Firstly, Shandong province is in a stage of rapid development of urbanization [
44,
45]. Based on the China National Bureau of Statistic’s indicators, the urban population in Shandong increased by more than 51% in terms of total population in 2011 and this percentage is expected to rise in the coming years. It is predicted that by 2020 60% of the population will be living in urban areas [
46]. This urbanization has had a profound impact on energy consumption, especially on coal consumption, through changing people’s lifestyles and increasing population mobility. Secondly, economic globalization has accelerated Shandong’s industrialization process, but the shorter the transition phase, the faster energy demand grows. Industrialization always goes along with the rapid expansion of heavy industry. So, industrialization is a vital factor to coal consumption. Thirdly, Shandong province has been committed to the adjustment of its energy structure in recent years. The proportion of oil consumption increased gradually. As an alternative resource, the increase of oil consumption may be accompanied by the reduction of coal consumption [
47,
48,
49]. Consequently, the introduction of these three variables can help us analyze the driving forces of coal consumption accurately.
Based on the above analysis and STIRPAT model, the econometric model of coal consumption established can be expressed as:
where
COAL,
GDP,
CI are the same as in Equation (8),
URB represents urbanization level (expressed as the ration of urban population to total population),
IND denotes the industrialization level (expressed as the share of value-added of industry in
GDP), and
OIL represents the oil consumption (10
4 tce).
2.4. Data Source and Description
The chosen dataset includes annual observations on coal consumption, per capita GDP, coal intensity, urbanization level, industrialization level and oil consumption in Shandong Province during 1990–2013. In order to eliminate the effect of price change, per capita GDP is calculated at constant prices (1990 = 100). Data regarding coal consumption and oil consumption are obtained from China Energy Statistic Yearbook (1991–2014) [
50]. The data on GDP and population are obtained from Shandong Statistic Yearbook (1991–2014) [
51]. Coal intensity is calculated as coal consumption divided by total output. In addition, urbanization level is obtained by dividing the urban population by the total population, and the industrialization level is calculated as value-added industrial output divided by the total gross domestic product. The definitions and statistical descriptions of all variables are shown in
Table A1.
The trends of each variable over the period applied in the study are shown in
Figure A1. As shown in
Figure A1, coal consumption, per capita GDP, urbanization level and oil consumption all show a rising trend. On the contrary, coal intensity declined steadily from 377.33 tce per 10
4 yuan to 55.13 tce per 10
4 yuan. In Shandong, coal-based energy consumption patterns did not change during 1990–2013; thus, coal intensity declined indicating a significant improvement in coal efficiency. The industrialization level in Shandong province experienced a tortuous development process. From 1992 to 1994, the industrialization level increased dramatically. During 1994 to 2003, the trend of industrialization growth tends to be stable, remaining at about 43%. Since 2004, industrialization entered a new round of rapid growth and reached the highest value of 51.5% in 2007. After then, it declined slowly.
3. Empirical Results
In this section, we use the VAR model to analyze the impacts of the various driving force on coal consumption in Shandong province. This specifically includes the following steps:
Section 3.1 reveals the results of the unit root test and
Section 3.2 presents the results of the Johansen co-integration tests.
Section 3.3.1 and
Section 3.3.2 describes the selection of lag order, model construct and the robustness test. Impulse response functions and the variance decomposition are included in
Section 3.3.3 and
Section 3.3.4.
3.1. Results of the Unit Root Test
Generally speaking, the majority of macroeconomic variables are nonstationary. The unit root test can effectively avoid the bias of the regression results. This section considers the main results from the unit root. The ADF, DFGLS and KPSS tests are used to test the null hypothesis of unit root in the different variables. The optimal lag structure is chosen by using the Schwarz and Akaike information criterions. Results of the unit root test for all variables are presented in
Table 1.
As
Table 1 shows, the results of ADF and DFGLS test give us sufficient reason to accept the conclusion that the level series is a non-stationary sequence. Furthermore, we tested for all the variables in first-order difference. The test results suggest that the null hypothesis of a unit toot in first-order difference can be rejected for all variables at the 1%, 5% or 10% significance level. It should be noted that the results of the KPSS test indicate the COAL, GDP and CI were stationary series, which contradicts the results of ADF and DFGLS. In this case, we adopt the results which were verified by the ADF and DFGLS due to their higher efficacy. Thus, comprehensive analyses of the three test results indicate all series were I(1). Thus, we can proceed with the co-integration test.
3.2. Johansen Co-Integration Tests
The variables in this paper are more than three, so we adapt Johansen co-integration tests. Johansen co-integration tests are a multivariate co-integration method based on the VAR model [
32,
34,
52]. If there is co-integration equation between the variables, we can build the VAR model with level series. This model contains more economic information to facilitate our further explanation. Prior to performing the co-integration tests, it is necessary to determine the optimal lag length. We choose lag 1 as it is dictated by AIC, SC criterion. Then, we test for co-integration among the different variables in log-levels. The maximum eigenvalue statistic and the trace statistic are used to determine the number of co-integration relationships and build the co-integration equation. The results of Johansen co-integration test for all variables are given in
Table 2.
It can be seen from
Table 2 that both the eigenvalue and trace tests show that there exists a co-integration equation among the factors coal consumption, per capita GDP, coal intensity, urbanization level, industrialization level and oil consumption. It means that there exists a long-term co-integration between these variables. Due to the key purpose of this paper to analyze the dynamic relationship between variables based on a stable VAR model, a co-integration equation and a VEC (Vector Error Correction) model were not completed.
3.3. VAR Model
3.3.1. The Optimal Lag Order Analysis
The proper selection of lag length is very important when building a VAR model. The right lag length not only ensures the parameters in the VAR model have a strong explanatory power, but also that they maintain a balance with the degrees of freedom. In this paper, we choose optimal lag order as dictated by the sequential modified likelihood ratio test statistic (LR), Final prediction error (FPE), AIC, SC and Hannan-Quinn (HQ) information criterion. The results are given in
Table A2. As
Table A2 shows, the optimal lag order which was suggested by these criterions is 2.
3.3.2. VAR Specifications and Estimates
Results of unit root test and Johansen co-integration tests showed that all variables are I(1) and there are co-integration relationships between these variables. Therefore, following the standard procedure, we estimated the VAR model which takes all the variables as endogenous. Using the SC and AIC criterions, the model specification is determined. The estimates are reported in
Table 3.
It can be seen from
Table 3 that most of the
t-statistics are significant and the equation has high adjust-R
2. To avoid the non-constancy of parameters which may be caused by misspecification of the model, it is necessary to perform the stability test of the VAR model. Only when the VAR model is stable can the estimated results be used effectively. The results of the diagnostic checking of the estimated VAR model, such as autocorrelation, normality and heteroscedasticity, are shown in
Figures S1 and S2, and
Table S1, respectively. According to the results of the diagnostic tests, the estimated VAR model performed well, and the impulse response analysis based on this model is reasonable and reliable. In addition, the stability test is conducted by the characteristic roots of the coefficient matrix and Pesaran procedure [
53,
54]. The test result is shown in
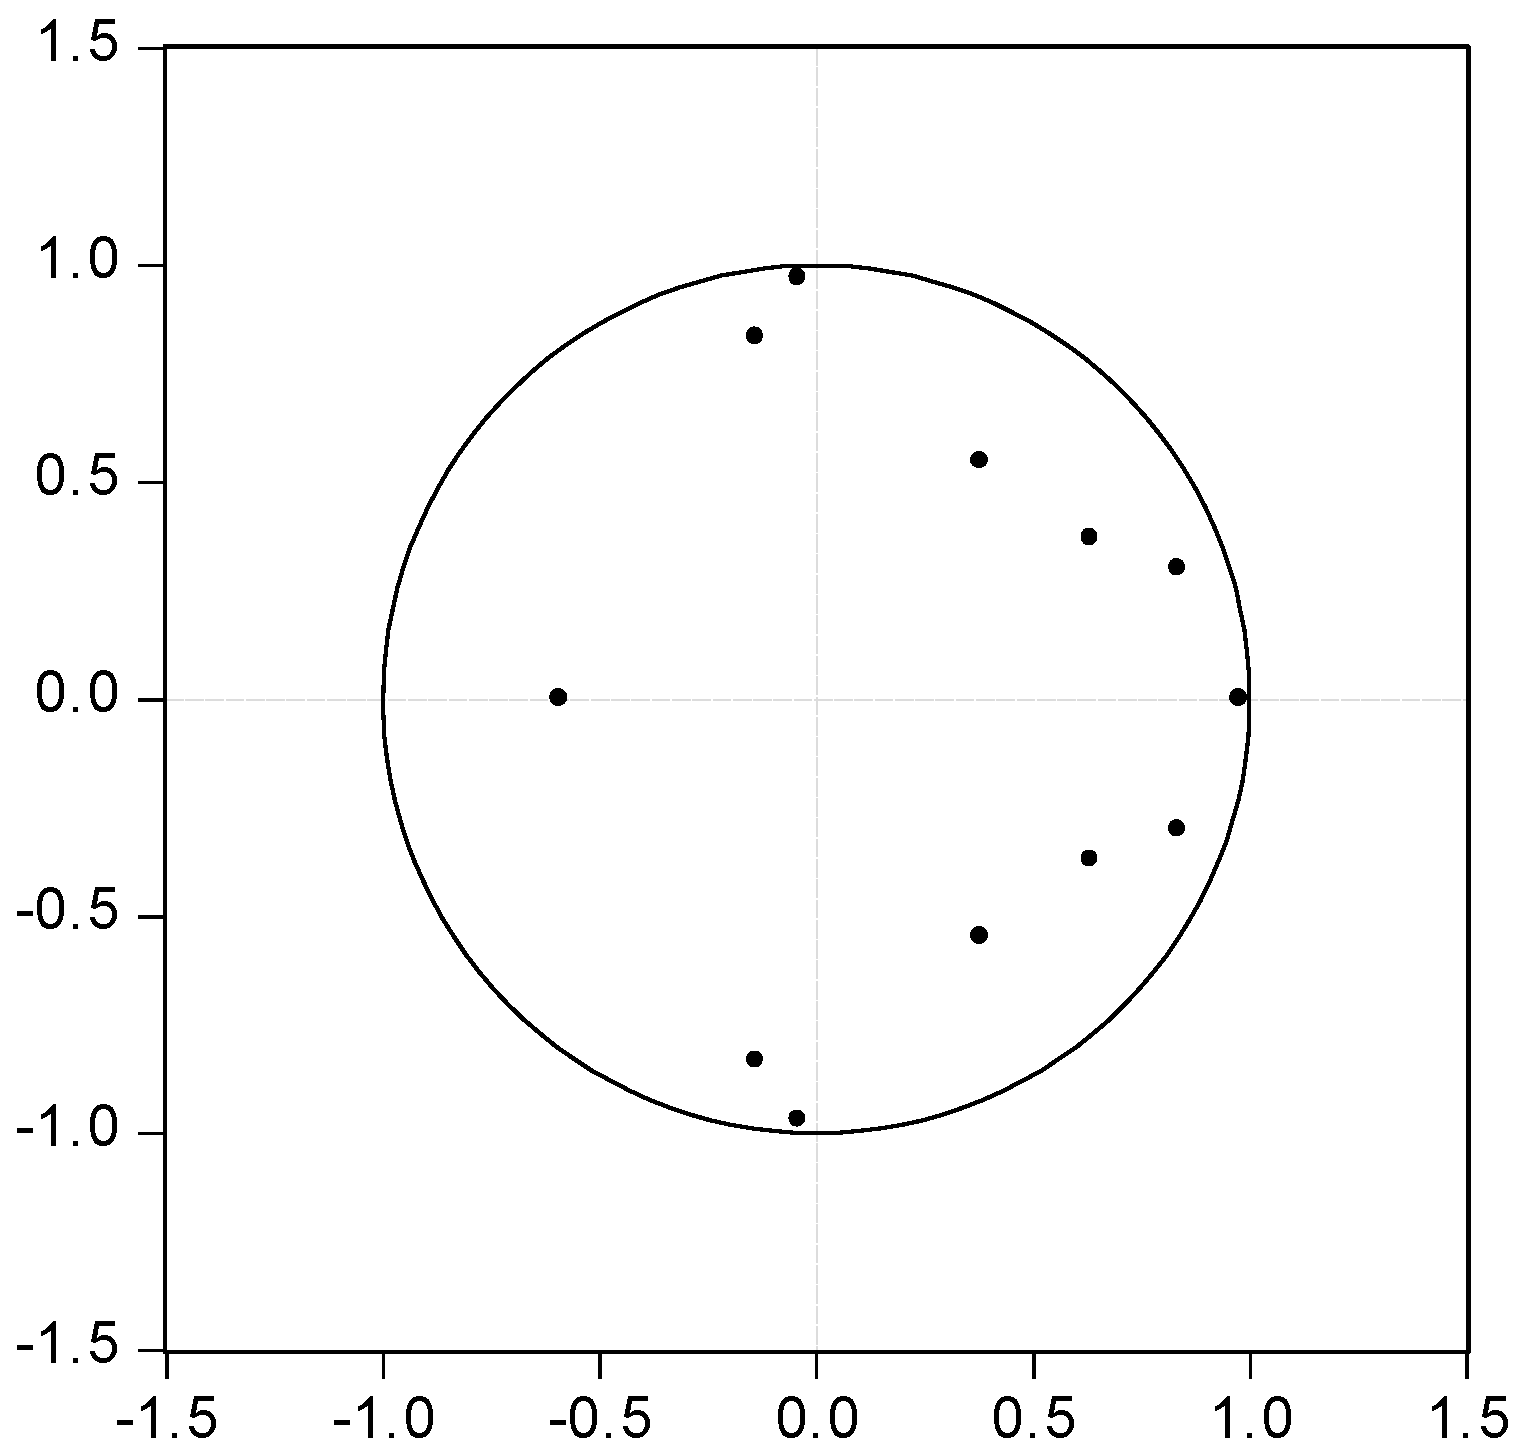
Figure 1. No characteristic roots lay outside the unit circle and they are less than 1. It means that the VAR(2) model satisfies the stability condition. So, the estimated results derived from the VAR(2) are valid.
3.3.3. Impulse Response Functions
In order to investigate the dynamic relationship between variables in the estimated VAR model, impulse response functions are employed in this section. An impulse response function describes the response of endogenous variables to a residual shock which is called innovation. Specifically, it describes the dynamic impact of the current and future value of the endogenous variables to a standard deviation shock.
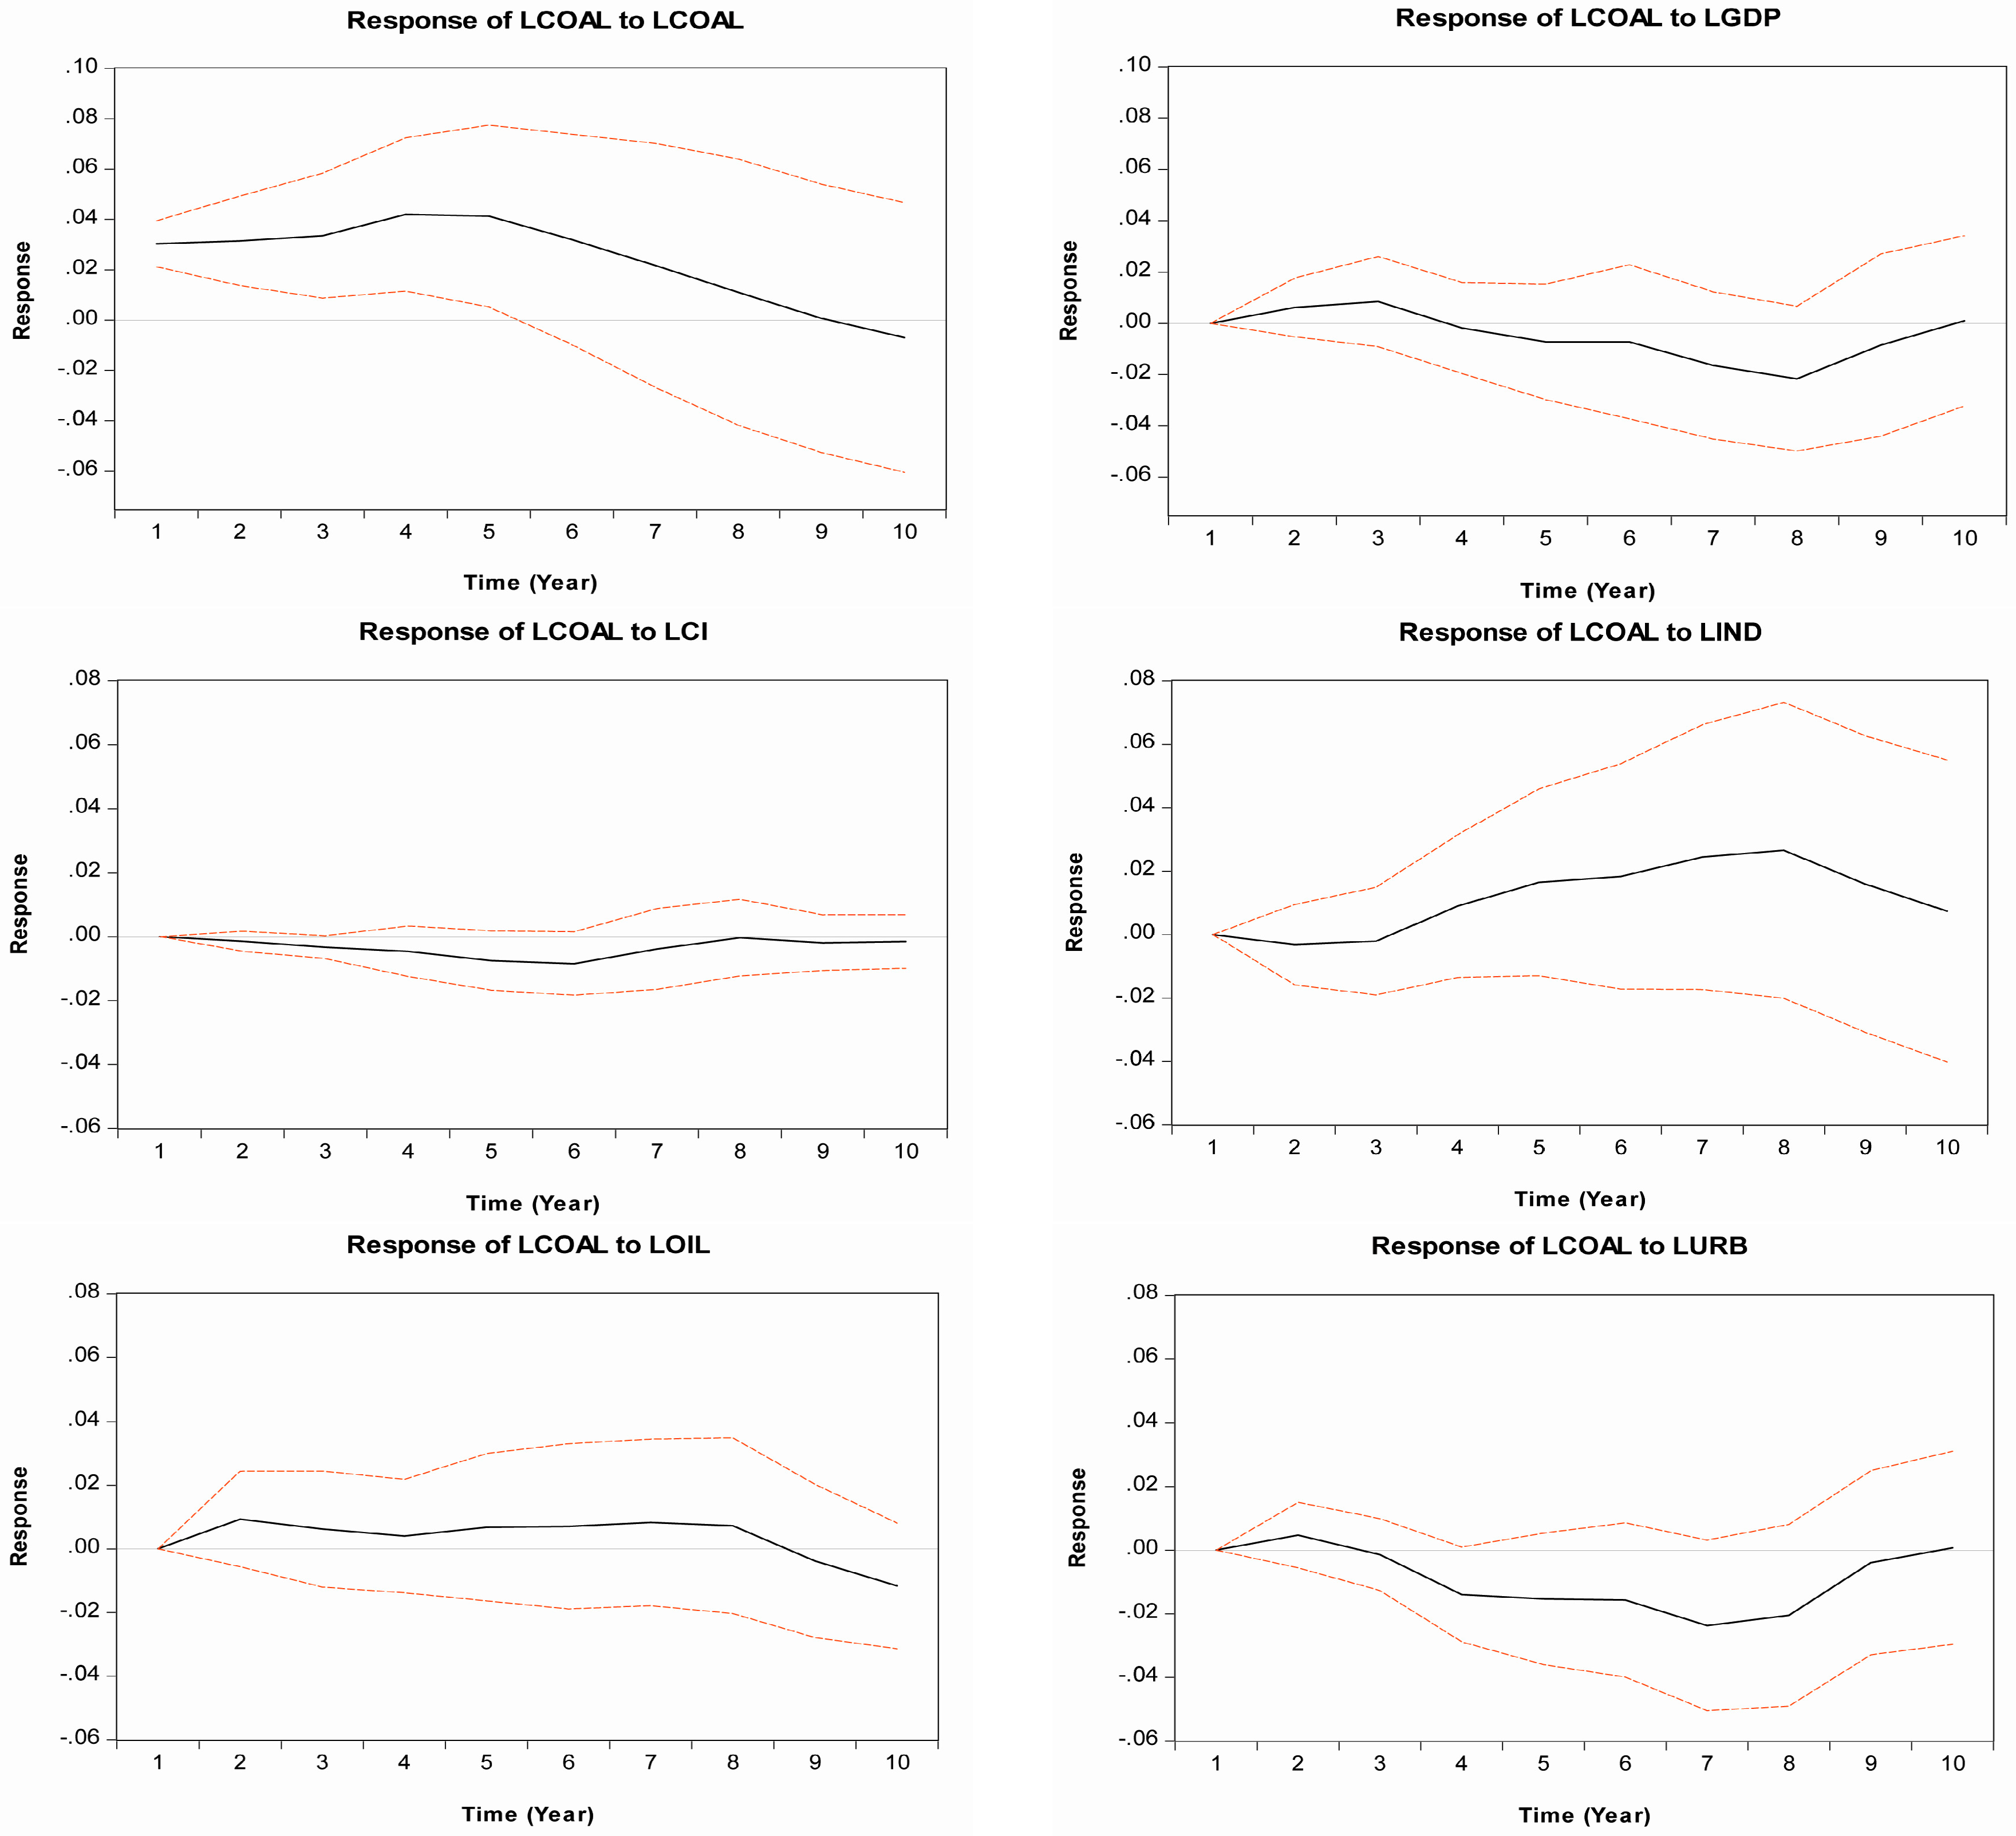
Figure 2 shows the responses of coal consumption in Shandong province to fluctuations in its driving forces in the short- and long-term lag structure.
Coal consumption shows a positive response to economic growth (LGDP) in the early stage which means the growth of per capita GDP has promoted coal consumption. However, in the long term, with the increase of per capita GDP, the coal consumption starts to be negative with time. This result is contrary to the Environment Kuznets Curve (EKC) hypothesis [
55,
56,
57]. In our opinion, it is mainly due to the following two reasons: technological advances in coal utilization and the substitution effect of renewable energies. The integration of renewable energy technologies in Shandong province lead to a reduction in the consumption of coal. Furthermore, adjustment of the energy consumption structure which is promoted by economic growth will gradually reduce total coal consumption.
One standard deviation shock to coal intensity (LCI) curtailed the coal consumption in the former seven years. However, it increased the coal consumption in the last three years. In the former stage, owning to the advancements in coal-saving technology and the improvements in production efficiency in Shandong Province, coal consumption declined. However, in the later stage, with the increase of coal efficiency, the coal consumption did not reduce but increased. In other words, it indicated a rebound effect of coal efficiency may exist in Shandong province in the long run. This is because, with the improvement of coal efficiency, the price of coal services reduced. The lower price stimulates the growth of coal demand which will offset the reduction in demand of coal efficiency. However, it should be noted that coal efficiency plays a marginal role in curtailing total coal consumption.
Coal consumption in Shandong Province shows a positive “U-shaped” curve response to urbanization (LURB). Put in another way, the response is weakly positive in a very short period but is negative over the next six years. Furthermore, the response went in to reverse and started to creep up again. From our point of view, urban policies and the coal-dominated energy structure in Shandong together determined this trend. Specifically, in the early stage of urbanization, urban infrastructure and real estate construction are the main driving forces of coal consumption. However, with the increasing scale effect of population agglomeration, coal consumption declined gradually. However, as years passed by, marginal utility decreased successively and the diseconomies of scale increased greatly; therefore, coal consumption returned to a growth scenario.
Generally speaking, a one standard deviation shock to industrialization (LIND) increased coal consumption in the long run. This result is in line with [
58,
59]. In other words, the development of industrialization promotes the growth of coal consumption. This is due to the high proportion of heavy industry in Shandong province. According to data from Shandong provincial Bureau of Statistics, during 1990–2013, the proportion of heavy industry of total industry rose from 49.2% to 68.6% continuously. In addition, the expansion of energy-intensive industries is another leading cause. Take 2013 for example, added value of energy-intensive industries accounts for 30% of total industry, meanwhile, the proportion of the coal consumption is as high as 90%.
The impulse response of coal consumption to oil consumption shows that one standard deviation shock to oil consumption (LOIL) causes a significant change in coal consumption in the short term, prior to showing a negative response later. As it is shown in
Figure 2, the impulse response values are above zero in the short term which means that the effect of oil consumption on coal consumption is positive. This conclusion is contrary to our expectation that growth in oil consumption should reduce coal consumption because of a substitution effect. This could be due to the following two reasons: Firstly, economic growth in Shandong province promoted increased consumption of all energy, whether coal or oil. Secondly, the dominance of coal consumption in the energy consumption structure is not easy to change in the short term. However, with the continuous adjustment of the energy structure of Shandong Province, the increased amount of oil consumption will eventually reduce the consumption of coal.
3.3.4. Variance Decomposition
The variance decomposition of VAR can be used to analyze the different contributions of structural shocks that affect the endogenous variables. An assessment of the relative importance of different driving forces of coal consumption in Shandong province can be obtained by investigating the proportion of the error variance which is accounted for by each of the factors as reported in
Table 4. A 10-year period is selected to represent the variance decomposition in the short term as well as in the long term.
For coal consumption in Shandong, industrialization is the major contributor explaining its variability. It accounts for 7.4% of forecast error variance from an average of 10 years. In the fifth period, it accounts for 7.3% of the forecast error variance and increased to 16.6% in the long run. Urbanization shock ranked second and was followed by economic growth shock. In the first three periods, the former is slightly lower than the latter, but in the 10th period, the explanatory power of urbanization increased to 12.2%, exceeding that of economic growth which was only 7.4%. Oil consumption explains an important part of the entire forecast error variance. It explains around 4% and 2% of the variability in the short and long run, respectively. However, coal intensity shock does not play a significant role in influencing coal consumption, whether in the short or long term.
4. Discussion
This paper addresses the driving factors of coal consumption of Shandong Province. According to the above empirical analysis, several interesting results emerge.
The first finding is that industrialization is not only the main driving force promoting coal consumption but also the most significant contributor to the variation in coal consumption, disregarding its own effect. This result is in line with the findings from an array of previous literature [
3,
12,
13,
44]. Many studies have highlighted the role of economic growth in energy consumption while ignoring the role of industrialization [
37,
44,
60,
61,
62,
63]. For many developing countries which are in the process of industrialization, the gradual increase in the proportion of industrial added value means more energy consumption, especially coal. Taking 2013, for example, the proportion of coal consumption of the total energy consumption in the industrial sector was as high as 90.8%. Moreover, coal consumption in the industrial sector accounted for 94.1% of total coal consumption. This strongly indicates that the industrialization in Shandong Province is heavily dependent on coal consumption.
The second finding is that coal efficiency played a dominant role in decreasing energy consumption during the study period. This result is in line with [
25,
26,
64,
65,
66,
67]. The impulse response function shows there exists a rebound effect of coal intensity in Shandong province. The underlying reason is that the reduced demand due to increased utilization efficiency will be offset or even exceeded by the increased demand caused by relatively low prices. Meanwhile, the results from variance decomposition reveal that the coal intensity does not play a significant role in influencing coal consumption when comparing with other factors. This indicates the improvement of coal utilization efficiency has great potential for reducing coal consumption.
The third finding is urbanization has promoted coal consumption as well as economic growth in Shandong Province. In recent decades, the development of urbanization in Shandong province has grown rapidly. The urbanization level rose from 18.7% in 1990 to 42.9% in 2013, with an annual growth rate of 3.7%. Urbanization creates new demand, stimulating the development of new industries, then lead to the consumption of more energy, especially coal. Regarding economic growth, during 1990–2013, the annual growth rate of the economy in Shandong Province reached 12.3%, 3.1 percentage points higher than that of China’s average level as a result of rapid economic growth accompanied by a large consumption of coal resources. However, the results from impulse response indicate that with the growth of per capital income and environmental pollution getting gradually worse, energy-saving technologies integrated to and adjusting the energy consumption structure promoted by economic growth will gradually reduce the total coal consumption in Shandong province. The last finding is that there is almost no substitution effect of oil to coal. Both the impulse response function and variance decomposition illustrated that increased oil consumption did not reduce coal consumption obviously. In our opinion, this may be due to the following two reasons. One reason is the rapid development of Shandong’s economy causes a great increase in the consumption of various types of energy, including oil and coal. The other reason is that obstacles of “path dependence” exist in the consumption of coal industrial equipment, so, even though the energy structure of consumption has adjusted, there are many difficulties to overcome when putting theory into practice.
5. Conclusions Remarks and Policy Implications
The rapid increase of coal consumption has motivated researchers to determine the driving forces of this increase in consumption, and identify exactly to what extent each of these forces play a role. Research on the driving forces and the potential for reduction of coal consumption in Shandong province has much significance for China’s energy security and global environmental protection. To achieve this goal, a time series was utilized taking the period 1990–2013 into consideration, and a VAR model was used to analyze the dynamic changes. Some conclusions were obtained as follows.
Industrialization played a dominant role in increasing coal consumption in Shandong Province during 1990–2013. Specifically, in Shandong Province, the process of industrialization is characterized by high coal-consumption and high pollution. In particular, the pillar industries in Shandong were the main coal industries which include electric power, iron and steel, building materials, and chemical industry. Therefore, in order to reduce coal consumption in Shandong province, policy makers should pay more attention to upgrading the industrial structure and invest more money in high-tech industries than traditional industries. Coal efficiency is the only factor to inhibit the growth of coal consumption. Impulse response function shows there exists a rebound effect of coal consumption in the short term; hence, the VAR model estimation results show that coal efficiency will reduce coal consumption in the long run. However, it is noteworthy that the inhibition result from coal efficiency is relatively weak. Therefore, improving coal efficiency is the most fundamental way to reduce coal consumption. Meanwhile, adjusting the energy structure and gradually increasing the proportion of clean energy used represents another effective way.
Both urbanization and economic growth have a significant effect on coal consumption. Therefore, accelerating the transformation of urbanization and the economic growth mode is an urgent need. There are two crucial measures to be taken to achieve this goal without damaging the economy. On one hand, Shandong province should follow a new path to urbanization characterized by urban and rural integration, industrial interaction, conservation and intensive, ecological and harmonious development. On the other hand, research and application of coal-saving technologies should be further highlighted. Moreover, liberalizing coal prices and linking China to international markets to ensure more reasonable coal prices is also recommended.
The substitution effect of oil to coal has not yet met expectations in Shandong Province. To some extent, the existing energy structure characterized by high use of coal, low use of oil and even lower use of gas fixes coal as the main energy source. However, gradually liberalizing coal and oil prices to keep in line with international markets is an effective way to adjust the energy structure. Despite the contributions presented by this paper, there are also some limitations that would warrant further discussion. Firstly, due to the constraints of the STIRPAT model, the factors that may affect coal consumption are selected based on qualitative analysis and reference to the relevant literature, rather than the Granger causality test. Thus, there may be some influencing factors to be ignored. Secondly, even though the established VAR model in this paper is stable, because one characteristic root is very close to 1, to some extent, some results of the impulse response analysis are not statistically insignificant. Taking these issues into account, we will make some corrections in future research. Thirdly, since the main objective of our study is to identify the dynamic relationships among coal consumption, economic growth, coal efficiency and industrialization and urbanization, the long-run and short-run relationships among these economic variables were not clearly demarcated; thus, an in-depth analysis of this nexus will be investigated further.


