Abstract
Understanding of the influencing factors of industrial sector carbon dioxide emissions is essential to reduce natural and anthropogenic greenhouse gas emissions. In this paper, we applied the Logarithmic Mean Divisia Index (LMDI) decomposition method based on the extended Kaya identity to analyze the changes in industrial carbon dioxide emissions resulting from 39 industrial sectors in Inner Mongolia northeast of China over the period 2003–2012. The factors were divided into five types of effects i.e., industrial growth effect, industrial structure effect, energy effect, energy intensity effect, population effect and comparative analysis of differential influences of various factors on industrial sector. Our results clearly show that (1) Industrial sector carbon dioxide emissions have increased from 134.00 million ton in 2003 to 513.46 million ton in 2012, with an annual average growth rate of 16.097%. The industrial carbon dioxide emissions intensity has decreased from 0.99 million ton/billion yuan to 0.28 million ton/billion yuan. Also, the energy structure has been dominated by coal; (2) Production and supply of electric power, steam and hot water, coal mining and dressing, smelting and pressing of ferrous metals, petroleum processing, coking and nuclear fuel processing, and raw chemical materials and chemical products account for 89.74% of total increased industrial carbon dioxide emissions; (3) The industrial growth effect and population effect are found to be a critical driving force for increasing industrial sector carbon dioxide emissions over the research period. The energy intensity effect is the crucial drivers of the decrease of carbon dioxide emissions. However, the energy structure effect and industrial structure effect have considerably varied over the study years without displaying any clear trend.
1. Introduction
Global warming which is caused by emissions of greenhouse gases has become one of the world’s major environmental problems and draws much attention [1]. Carbon dioxide emissions due to the consumption of fossil fuels are the leading greenhouse gas, accounting for total greenhouse gas emissions (GHG) 76.7% [2]. Therefore, many politicians and academics have made efforts to adopt effective policies that determine the carbon dioxide reductions targets and reduce whole energy consumption, which mostly depends on fossil fuels, as well as ensuring environmental and economic sustainability. As the world’s largest emitter of energy-related carbon dioxide emissions, China has more and more challenges in investigating carbon dioxide emission levels and the driving forces of evolution [3].
With the development of industrial production and the gradual improvement of people’s living standards, energy consumption of economic activity is gradually increasing and carbon dioxide emissions caused by energy consumption are increasing as well. The industrial sector includes many specific industries, and industrial carbon dioxide emissions reduction policy implementation ultimately required to be carried out within a specific industrial sector. Inner Mongolia is one of the energy resource endowment inland provinces and extensive economic growth that has taken place is based on energy exploitation. The energy reduction problem is more and more obvious, and has hindered the industrialization of the province significantly. Therefore, it is very necessary for a deeper understanding of the change of energy related carbon dioxide emissions in the industrial sector as one of the most important carbon dioxide emissions contributors in Inner Mongolia. Also, it is very necessary to identify the driving factors which dominate industrial carbon dioxide emissions. In order to accomplish this, a possible method is to decompose the influencing factors which are effect the change in industrial carbon dioxide emissions into proper parts.
Since the 1970s, various decomposition methods have been used to quantify the impact of different factors on the change of energy consumption and carbon dioxide emissions, such as the econometric regression, the structural decomposition analysis (SDA) and the index decomposition analysis (IDA), and so on. There are quite a lot of similarities and differences between IDA and SDA. The SDA method uses information from an input-output format in specific years, whereas IDA, an extension of the Kaya identity, applies aggregate data at the sector level [4]. Furthermore, the SDA method requires more data than IDA and the main limitation is that it can be performed additively only because of reliance on the input–output format, which results in some limitations in the improved use of SDA [5]. However, The IDA method needs less data than SDA, it provides a few detailed analyses and provides a direct impact assessment, which allows making policy decisions at the sectoral level [6]. The IDA approach is more widely used at the city scale than the SDA approach [7]. In recent years, the index decomposition analysis (IDA) and the structural decomposition analysis (SDA) have been successfully applied to study the effects of different influencing factors on the energy consumption and carbon dioxide emissions [8,9,10,11,12]. However, there is no consensus at to which is the most preferred decomposition approach. Latest, Ang et al. [13] indicated that Logarithmic Mean Divisia Index (LMDI) method is the best decomposition method. Due to its advantages i.e., solid theoretical basis, easy to use and adaptability, many studies [14,15,16,17,18,19,20,21,22,23,24,25] have applied the LMDI method to identify which factors influence the changes in energy consumption and carbon dioxide emissions. However, those decomposition approaches do not measure the structure effects, which have been regarded as important factors in explaining changes in carbon dioxide emissions. Also, most studies have only analyzed the emission driving forces at the national level and few studies have focused on regional-level emissions. Although there are studies that do this kind of decomposition of carbon dioxide emissions, they focus on the economy as a whole or particular industries. To our knowledge, there are a few studies that apply this decomposition method to specifically analyze the industrial sector in Inner Mongolia, northeast of China. The main objectives of this research are to quantify and explore the influencing factors behind carbon dioxide emissions in Inner Mongolia by using the extended Logarithmic Mean Divisia Index (LMDI) decomposition model and, based on this, to make policy recommendations to help achieve the stated emission reduction targets.
According to the previous researches, we decided to apply the best decomposition method which is a LMDI decomposition model to decompose energy related carbon dioxide emissions in the industrial sector into several effects i.e., industrial growth, industrial structure, energy intensity, energy structure, population and emissions factor, respectively. The remainder of this study is organized as follows. In Section 3, we describe how to calculate the carbon dioxide emissions by the IPCC method, and apply the LMDI decomposition model to decompose the change of carbon dioxide emissions. In Section 4, a detailed analysis of results is performed and, finally, we summarize the main conclusion of the paper and discuss a number of environmental strategies in order to reduce the industrial carbon dioxide emissions.
2. Data Resources and Variable Description
2.1. Sources of Data
The study years span from 2003 to 2012. The GDP, energy consumption and population data during the research period were selected from the Inner Mongolia Statistical Yearbook (2004–2013) [26,27,28,29,30,31,32,33,34,35]. The GDP data used in this paper is the gross industrial output value at current prices. China currently lacks the authoritative statistical agency released data for carbon dioxide emissions, so we need estimates for carbon dioxide emissions. The common approach is to obtain a variety of energy consumption measures (quantity of goods produced), and then estimate carbon emissions according to the carbon emission factors of varying energy consumption which is published by the authority in Inner Mongolia. The method used in this paper is provided by IPCC (2006) [36] which is one of the most widely used method. The total carbon dioxide emissions consist of the use of fossil fuels, land-use/land-use cover change and human activities such as the production of cement. According to the current results of monitoring greenhouse gas emissions, the percentage from fossil fuels is 70%, which is the main source of greenhouse gases. Meanwhile, the carbon dioxide emissions from fossil fuel consumption are easy to analyze and the results have high reliability. Therefore, it is the main study object to evaluate greenhouse gas emissions and, in this paper, the carbon dioxide emissions from fossil fuel consumption is the main study object, too. Eight types of fuels were considered in this research, including coal, coke, crude oil, gasoline, kerosene, diesel oil, fuel oil and natural gas. In our study, we calculate the energy consumption carbon dioxide emissions based on the energy balance of the terminal consumption (standard amount), excluding energy consumption, carbon dioxide emissions of processing and conversion processes, transport and distribution losses. The carbon dioxide emissions of electricity and heat calculated from thermal power and heating energy delivered are no longer considered as part of the carbon dioxide emissions.
2.2. Description of Variables
(1) Population size: population size generally refers to a country or regional population over a given period. Rapid population growth increases the demand for fossil energy consumption and fossil energy consumption boosts the rise in carbon dioxide emissions, which have been confirmed by many studies. The population size in this paper is the average number of people employed in industrial sector in a year. Industry employment reflects the level of development of the industry, and its impact on carbon dioxide emissions, mainly reflected by human practices. However, few people consider the employment effect of population size on carbon in the analysis of industrial carbon dioxide emissions. We did not neglect this factor when building our model.
(2) Industrial growth: economic growth, which generally refers to the amount of the per capita GDP of a country, will be taken into account when studying the area’s carbon dioxide emissions. This paper uses industrial growth that refers to the per capita industrial output and reflecting the value created by each employed person of the industrial sectors in the research of industrial carbon dioxide emissions. In many provinces of China, industrial growth has limited impact on the economic growth mode in the short term. On the one hand, the growth mode of industry will drive the increase in fossil fuel consumption and bring more carbon dioxide to the atmosphere. One the other hand, the industrial growth will accelerate the progress of science and technology, promoting green energy instead of fossil fuels, which will significantly improve the environment. It will come to a conclusion that industrial growth has a certain correlation with the intensity of energy use. Therefore, it is necessary to introduce industrial growth to analyze its impact on carbon dioxide emissions.
(3) Industrial structure: industrial structure generally refers to the proportion of gross value of production proportion in the enterprise category, whereby there is little difference between the lines of business within the industrial sector. Now, there are 39 specific industries in the industrial sector. Energy levels vary greatly among the various industries. The fossil energy types, quantity and efficiency are different in different sectors restricted by technological development, national policies and other factors. Research on industry structure is important for the effects of carbon dioxide emissions. Industry structure used in this study is the gross value of production of each industry sector accounting for a proportion of the total value.
(4) Energy intensity: energy intensity is generally used as the amount of energy by creating units of GDP. In this article, it refers to the standard coal consumption quantity per million GDP in various industries (unit: standard coal/million). Energy intensity in this article is the amount of energy consumed by each unit GDP of the industry. We assume that if GDP was unchanged, the higher the energy intensity, the greater amount of energy consumption leads to an increase in carbon dioxide emissions.
(5) Energy structure: this refers to the eight major categories of energy consumption accounting for a proportion of the total energy consumption. The energy structure of this paper is the standard energy consumption converted from the crude oil, coke, etc., accounting for a proportion of the total energy consumption in industry. The adjustment of energy structure is the main task in Inner Mongolia in recent years, which requires reducing the demand for fossil energy, developing clean energy and improving technologies. However, considering the sustainability and stability of economic development, the coal-dominated energy structure will still exist for a relatively long period. The carbon dioxide emission factor of coal consumption is large, so the amount of carbon dioxide emissions is large as well. Also, other types of energy, especially clean energy used in Inner Mongolia Province, are not common. Therefore, this study suggests that energy structure is an important factor affecting the level of carbon dioxide emissions in the industrial sector in this study area.
(6) Carbon emission factors: Carbon emission factors refer to the generated amount of carbon dioxide emissions by each unit of energy. According to the assumptions made in academic circles, all carbon emission factors of energy are fixed.
3. Methodology
3.1. Estimation of Industrial Carbon Dioxide Emissions
In this paper, the IPCC 2006 national greenhouse gas inventory which is issued by United Nations Panel on climate change for the default carbon dioxide emission factors method is used to calculate energy consumption carbon dioxide emissions. The formula can be expressed as follows [36]:
where is the carbon dioxide emissions, Mt; is the carbon dioxide emission coefficient (tC/tce), is each energy type; is terminal energy consumption of energy type, M tce (as shown in Table 1).

Table 1.
The carbon dioxide emission coefficient of different energy types.
Because of the period (2003–2012) analyzed in this study is relatively short, we assume that the carbon emission factors of coal, coke, crude oil, gasoline, kerosene, diesel oil, fuel oil and natural gas are constant. In fact, the coefficients of these energy types have changed in the long term because of a change in types of fuels. Thus, these minor changes are negligible when we analyze the carbon emissions in the short term [15].
3.2. Decomposition Analysis
In this paper, using Logarithmic mean Divisia index (LMDI) decomposition method to decompose influencing factors into six parts i.e., energy intensity (EI), industrial growth (IG), energy structure (ES), industrial structure (IS), population (P) and carbon dioxide emission coefficient (R), respectively. The basic formulation of LMDI decomposition method is expressed as follows which is extended by Kaya [37] identity.
We assume that:
The Equation (2) can be expressed as:
The carbon dioxide emissions of the t period comparative with basic period are:
Therefore, we can formulate the LMDI decomposition model, as follows:
According to Equation (3), the result of the decomposition can be expressed as follows:
The cumulative effect of time series can be expressed as follows:
The carbon dioxide emissions coefficient is generally constant in actual application. Therefore, the emissions factor is always zero. Also, it can prove that the logarithmic mean weight division method residual is equal to zero as well.
The LMDI method consists of two forms, either additive or multiplicative, to link a simple mathematical connection [38]. The choice of the form depends on the aim of the study, the consideration of the data set, and ease of application. In our research, we choose the multiplicative form to link year by year over the entire study period. The results are concluded as each index effect is organized annually and grouped by each index percentage annual change as well.
4. Results and Discussion
Using the LMDI decomposition method, we can investigate what factors will have a major effect on the changes resulting from industrial carbon dioxide emissions over the research period 2003–2012.
4.1. Analysis of Industrial Carbon Dioxide Emissions
The energy saving and emission reduction in the industrial sector has an important role in realizing the government’s carbon intensity reduction strategy. Figure 1 presents the energy consumption growth from 53.20 million t standard coal in 2003 to 141.06 million t standard coal in 2012, and the annual growth rate reached 11.44%. Also, Figure 2 presents the trend of the industrial sector’s carbon dioxide emissions and gross industrial output value at current prices over the period 2003–2012. The industrial sector’s carbon dioxide emissions have increased from 134.00 million t in 2003 to 513.46 million t in 2012, an annual growth rate of 16.097%. However, carbon dioxide emissions increased about 3.83 times in 10 years. Figure 2 also shows that carbon dioxide emissions by industrial are closely connected to the economic growth. In the past decades, during 2003–2012, Inner Mongolia’s economy grew at an average annual economy growth rate of 33.369%.
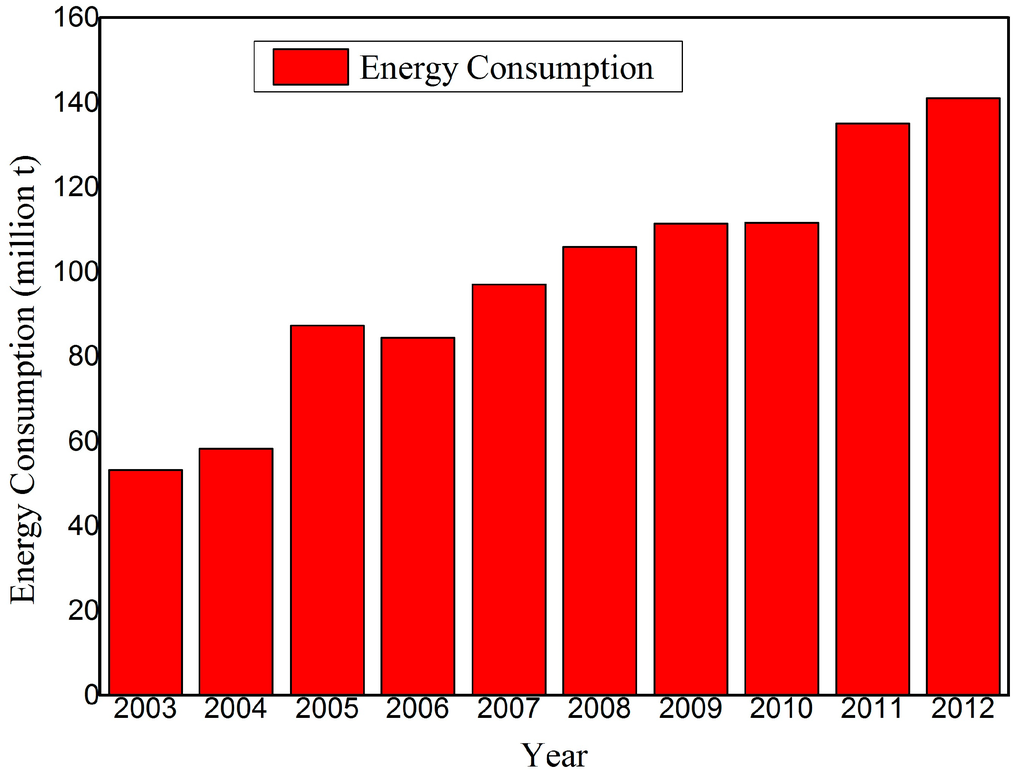
Figure 1.
Energy consumption of industrial sector in Inner Mongolia northeast of China (2003–2012).
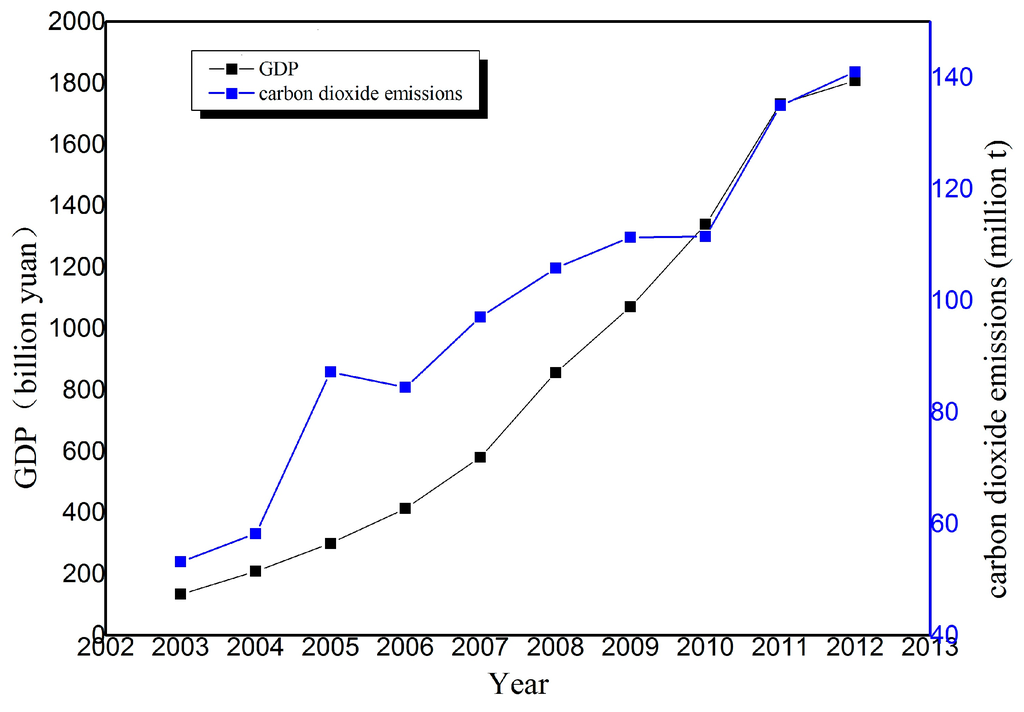
Figure 2.
Carbon dioxide emissions and GDP of industrial sector in Inner Mongolia, northeast of China (2003–2012).
The annual carbon dioxide emissions by each energy type for the period from 2003 to 2012 are presented in Figure 3. In 2003, coal was the biggest carbon dioxide emitter with a share of 81.87%. At present, the energy structure in the Inner Mongolia region is based on coal, which belongs to the traditional “high carbon” energy. Figure 3 reveals that the carbon dioxide emissions of coal accounts for 90%. However, nuclear power, wind power, hydro and other clean energy consumption produced relatively fewer carbon emissions, and even achieved zero carbon emissions. In recent years, the proportion of coal has a downward trend. On the contrary, the share of natural gas in energy consumption has an upward trend. Although the proportion of natural gas is still relatively low, you can find the overall energy consumption of the Inner Mongolia is moving towards clean energy. From the emissions of different energy types, the carbon dioxide emissions of coal accounted for most of the total carbon dioxide emissions of energy consumption and carbon emission factors of coal is the highest of three kinds of fossil energy. The need for hydropower, solar energy, wind energy, nuclear energy and other low carbon and zero carbon emission factor clean energy development is growing as well.
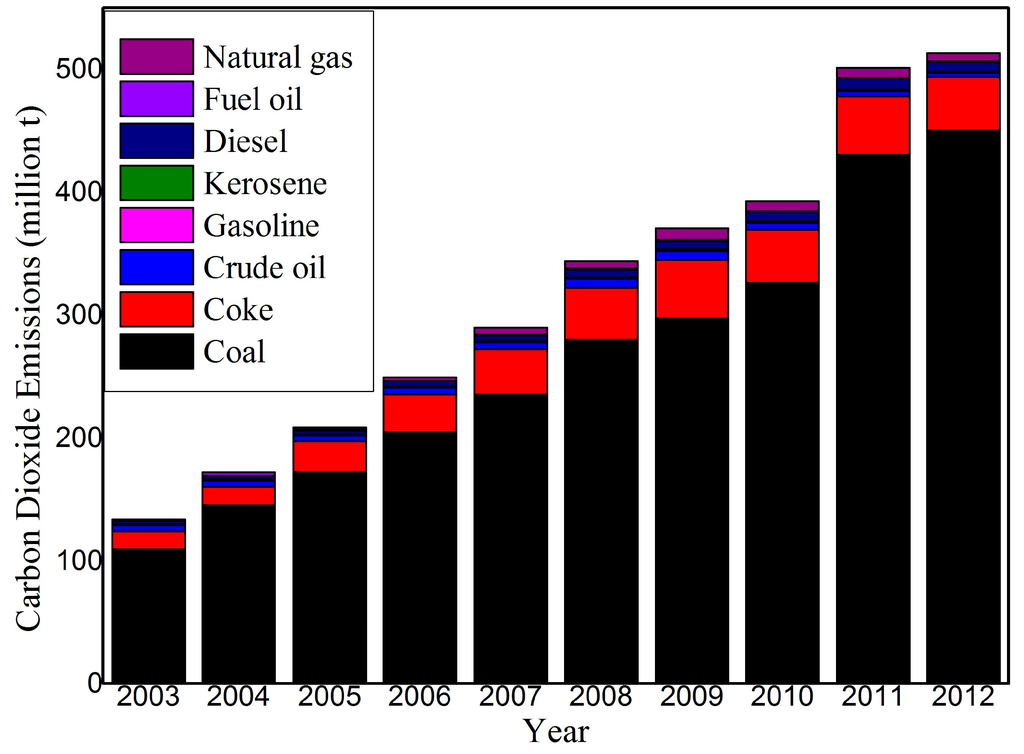
Figure 3.
The annual carbon dioxide emissions by each energy type for the period from 2003 to 2012.
The carbon dioxide emissions intensity refers to per unit GDP carbon dioxide emissions of a country or region. In this paper, we calculate carbon dioxide emissions intensity by per unit GDP of the total carbon dioxide emissions and the decline of carbon dioxide emission intensity reflects the improvement of energy efficiency to some extent. The development over time of carbon dioxide intensity calculated from 0.99 million ton/billion Yuan in 2003 to 0.28 million ton/billion Yuan in 2012 is presented in Figure 4, which shows that there is clearly a downward trend and the annual decrease rate is −12.95% over the period 2003–2012. It shows a reduction in the dependence on energy-intensive industries undergoing industrial economic development and improved energy efficiency in the industrial sector by a series of energy saving measurements in Inner Mongolia is very necessary.
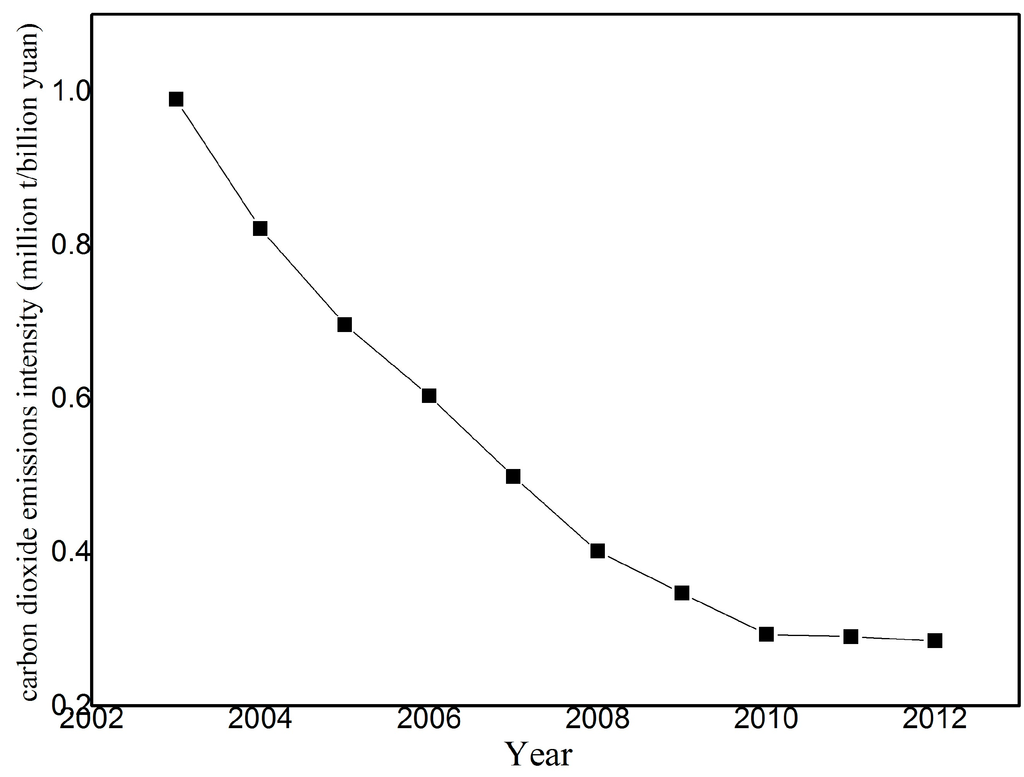
Figure 4.
Carbon dioxide emissions intensity of energy consumption industrial sector in Inner Mongolia, northeast China (2003–2012).
4.2. Decomposition Results
The carbon dioxide emissions are not only influenced by the different factors at different times, but also the effects are different for different industries. The results of the decomposition for industrial sector carbon dioxide emissions in Inner Mongolia from 2003 to 2012 are listed in Table 2 and Figure 5.
Table 2.
Definition of variables.
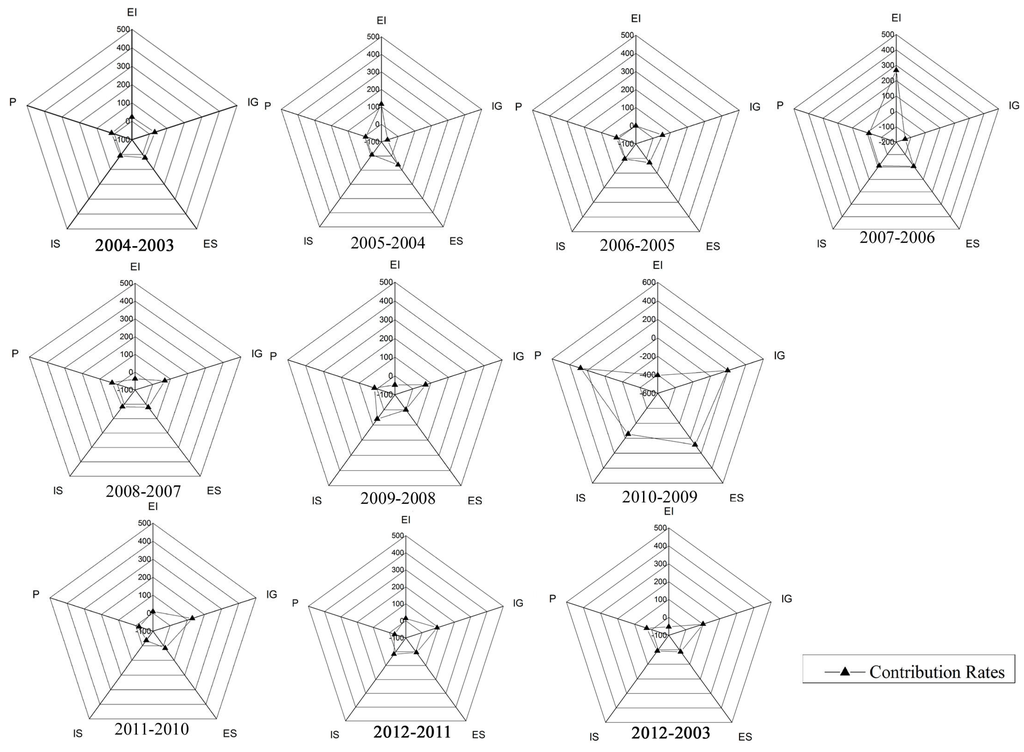
Figure 5.
Comparison of the contribution rates of each determinant over the research period. EI refers to energy intensity. IG refers to industrial growth. ES refer to energy structure. IS refers to industrial structure. P refers to population.
(1) Table 3 shows that the greatest contributor to the increasing emissions was the high industrial growth. During the periods 2003–2004, 2004–2005, 2005–2006, 2007–2008, 2008–2009, 2009–2010 and 2010–2011, 0.54, 0.48, 1.27, 1.08, 0.66, 0.058 and 6.71 million ton carbon dioxide emissions, respectively. The industrial growth effect has found to be main driving force for the increase of carbon dioxide emissions in Inner Mongolia’s industrial sector, which resulted in an increase in carbon dioxide emissions of 49.25%. Also, its effect strengthened during the whole research periods except from 2006 to 2007 and from 2011 to 2012. In terms of time series, the cumulative contribution rate was almost more than 400% with the minimum of −138.23% in 2006, and then peaked up to 195.06% in 2009. In a word, Inner Mongolia’s economic development was a main determining factor for energy consumption carbon dioxide emissions growth and the contribution to carbon dioxide emissions growth increased as well. As a developing province, economic growth is necessary to meet the basic needs of people’s material life and development. Energy consumption reflects the needs of residents and the intensity of regional economic activity, as a basic input to maintain economic development. The carbon emission is a direct product of energy consumption. In a certain stage of economic development, carbon emissions and economic output will have a high correlation undoubtedly. It is difficult to avoid the environmental pressures. However, we can mitigate industrial growth to reduce carbon dioxide emissions.
Table 3.
Effect of different driving factors on carbon dioxide emissions of Inner Mongolia during 2003–2012.
(2) Energy intensity refers to the ratio of total energy consumption and gross domestic product, which is an important indicator for regional energy efficiency. The energy intensity in the industrial sector declined from 0.99 million ton/billion to 0.28 million ton/billion during the study period. The energy intensity effect decreased carbon dioxide emissions by 25.71%. The decomposition results show that the energy intensity effect has played an important role in the reduction of carbon dioxide emissions in general. Because of the implementation of energy efficiency policies and measurements, the decline of energy intensity and the increase in measures curbing carbon emissions is significantly narrowed by adjusting the energy structure and industrial structure. On the one hand, this illustrates that the energy use efficiency has made great progress at the technology level. On the other hand, it shows that there is great scope to decrease energy intensity and the inhibitory effect needs to be strengthened. However, Table 3 reveals that from 2003 to 2004, 2006 to 2007 and from 2010 to 2012, the energy intensity effect on carbon dioxide emissions was positive, so carbon dioxide emissions increased annually. The reason is that the high energy consumption, energy inefficiency and low output expansion lead to the decline of the whole energy efficiency during this period.
(3) Table 3 shows that the effect of industry structure on carbon dioxide emissions in Inner Mongolia’s industrial sector was found to be rather small, which certificates that the structural shift of industrial sector did not have a significant influence on the reduction of carbon dioxide emissions during the entire study period of this research. It was shown to be a much weaker factor than the effect of energy intensity and industrial growth and population. However, the effect of industrial structure should not be ignored. We can make structural changes in some heavy industrial sectors, such as production and supply of electric power, steam and hot water, coal mining and dressing, smelting and pressing of ferrous metals petroleum processing, coking and nuclear fuel processing, and raw chemical materials and chemical products and so on to reduce the carbon dioxide emissions in the future.
(4) The decomposition results of the energy structure effect on carbon dioxide emissions showed a weak positive effect on Inner Mongolia’s industrial carbon dioxide emissions growth from 2003 to 2012 with low fluctuation. Table 3 reveals that from 2003 to 2004, 2005 to 2006, 2007 to 2008, and from 2009 to 2011, the energy structure impact on changes in industrial carbon dioxide emissions was positive which means carbon dioxide emissions increased annually. With the rapid economic development in Inner Mongolia, the improvement of industrialization would definitely be based on the increased consumption of various fossil fuels such as coal, petroleum and natural gas in different industrial sectors. Also, the energy structure in Inner Mongolia is dominated by coal and this is hard to change significantly within a short period of time. However, from 2004 to 2005, 2005 to 2006, 2008 to 2009 and from 2011 to 2012, the energy structure impact on changes in industrial carbon dioxide emissions was negative which means carbon dioxide emissions decreased annually and energy structure improved for these years. The declining trend of carbon dioxide emissions’ intensity and the weak inhibition effect of energy structure on carbon dioxide emissions are consistent, which can be considered to be preliminary results of the optimization of the energy structure in Inner Mongolia, but did not achieve breakthrough changes. Therefore, we must take action to reduce carbon dioxide emissions by continually adjusting and optimizing the energy structure in industrial sectors and increasing the low carbon energy consumption ratio in the future.
(5) The decomposition result shows that population effect is the second most significant influencing factor after the economic growth effect. The results of our decomposition analysis indicate that a rapidly growing population and increasing levels of income result in greater demand for goods and services that rely on more energy consumption and carbon dioxide emissions. Figure 5 and Table 3 reveals that the population effect on carbon dioxide emissions is positive and stable. The contribution of population effect to carbon dioxide emissions increased from 0.29 million ton in 2003 to 1.19 million ton in 2012. The increasing population has contributed obviously to the carbon dioxide emissions increment in Inner Mongolia province during the study period. There is positive correlation between population and carbon dioxide emissions, which indicates that the population growth plays an important role in the increase of carbon dioxide emissions. A deceleration in the rate of population growth would appear significant for keeping and sustaining development of the population, natural resources, economic growth and environmental management.
In recent years, the impact of each effect on carbon dioxide emissions has significant characteristics that can be confirmed from the perspective of the contribution rate, as shown in Figure 5. In 2003–2012, in addition to the energy effect, usually maintaining a positive effect, which indicates that the energy structure has not fundamentally changed, and low energy consumption and low emissions should be achieved by adjusting the energy structure in the future. The contribution rate of the energy intensity effect, the industrial growth effect, industry structure effect and population effect on carbon dioxide emissions undergo increases, decreases and then an increase. The contribution rate of the energy intensity effect peaked at 267.42 in 2006–2007 and then dropped to −404.94% in 2009. The contribution rate of the industrial growth effect on carbon dioxide emissions reached 195.06% and then dropped to −138.23% in 2006. The highest contribution rate of population effect on carbon dioxide emissions reached 277.27% and remained at about −30%~30% in recent years. The contribution rate of industry structure effect on carbon dioxide emissions was kept at around 20% and dropped to −54.48% in 2009.
5. Conclusions and Policy Implications
In this paper, we calculated the energy consumption carbon dioxide emissions and used the Logarithmic Mean Divisia Index method (LMDI) to explore the industrial structure effect, industrial growth effect, energy intensity effect, energy structure effect, population effect and carbon dioxide emissions factors effect on the changes of carbon dioxide emissions resulting from the industrial sector in Inner Mongolia over the 2003–2012 period. The main conclusions are presented as follows:
(1) The energy consumption has increased from 53.20 million ton standard coal to 141.06 million ton standard coal during 2003–2012. Industrial sector carbon dioxide emissions have increased from 134.00 million ton in 2003 to 513.46 million ton in 2012, with an annual growth rate of 16.097%. The industrial carbon dioxide emissions intensity has decreased from 0.99 million ton/billion yuan to 0.28 million ton/billion yuan. Inner Mongolia province is a coal dominant industrial economy. Our results are more accurately compared with the 133.25 million ton carbon dioxide emissions in 2003 and 346.83 million ton carbon dioxide emissions in 2009, which is estimated by Gong and Wang [39].
(2) The carbon dioxide emissions resulting from the production and supply of electric power, steam and hot water, coal mining and dressing, smelting and pressing of ferrous metals, petroleum processing, coking and nuclear fuel processing and raw chemical materials and chemical products account for 89.74% of total increased industrial carbon dioxide emissions.
(3) The industrial growth effect and population effect are found to be overwhelming contributors to the increase of Inner Mongolia’s industrial carbon dioxide emissions in the period 2003–2012, except for decreasing emissions during 2006–2007, 2010–2011 and 2011–2012. The energy intensity effect is a crucial driver of the decrease of carbon dioxide emissions in Inner Mongolia, except for increasing carbon dioxide emissions over the period 2003–2004, 2006–2007 and 2010–2011. However, the energy structure effect and industrial structure effect fluctuated obviously over the study years without displaying any clearly trend.
(4) Each effect shows a typical pattern in recent years, the negative effect caused by the energy structure and energy intensity and the positive effect caused by population mostly cancel out each other, and the contribution rate of industrial growth effect on carbon dioxide emissions increased to close to 100%. It confirms that the economic development of Inner Mongolia province has gradually become the dominant factor resulting in carbon dioxide emissions. The development of a low-carbon economy has become an urgent task in today’s society and represents an efficient economic model, which can drive future social and economic development and improve people’s quality of life. China announced that the carbon emissions intensity per unit of GDP would decrease by 40%–45% from the 2005 level by 2020 at the Copenhagen Climate Conference which was held in 2009, and effective measures should be taken to reduce carbon emissions.
This study showed that the economy scale, energy intensity, industrial structure, energy structure and population size are important factors affecting the carbon dioxide emissions of each industrial sector in Inner Mongolia. Based on the results of our study, we recommend the following policy implications. First, the industrial structure should be adjusted. The growth rate of energy-intensive industries should be controlled and the dependence of economic growth on energy consumption should be reduced. The low power and high value-added industry should be developed positively while the enterprises with high pollution, high energy consumption and high investment should be limited. At the same time, the development of tertiary industry should be accelerated. Then , it is very important to establish proper measurements i.e., optimizing energy structure, changing the traditional development pattern of the industrial economy which is based on a reliance on non-renewable resources, developing wind, solar and other clean energy, reducing dependence on coal, oil, natural gas and other carbon energy, introducing advanced technology to improve energy efficiency, improving management and evaluation systems for energy savings and emissions reduction and enhancing energy regulations, and so on. Last but not least, it is necessary to control population and plan population development. The population should be controlled in the context of ecological capacity. More attention should be given to increasing the awareness of the population of low-carbon technology. Improving the awareness of the public of green transportation and low-carbon lifestyles would promote patterns of low-carbon consumption. The results of this study will promote a more comprehensive understanding of the inter-relationships of economic development, industrial structural, urbanization and carbon dioxides emissions in Inner Mongolia’s industrial sector and is helpful for exploration of relevant strategies to reduce carbon dioxide emissions.
Acknowledgments
This study is supported by the National Key Technology R&D Program of China under Grant No. 2013BAK05B02 and No. 2013BAK05B01 and National Natural Science Fund of China under Grant No. 41161060The authors are grateful to the anonymous reviewers for their insightful and helpful comments to improve the manuscript.
Author Contributions
All authors contributed to the data extraction. Rina Wu designed the methods, and Rina Wu, Jiquan Zhang, Yuhai Bao, Laiquan and Siqin Tong undertook the data analysis. All authors contributed to the drafting of the article and approved the final manuscript.
Conflicts of Interest
The authors declare no conflict of interest.
References
- Fan, T.; Luo, R.L.; Xia, H.Y.; Li, X.P. Using LMDI method to analyze the influencing factors of carbon emissions in China’s petrochemical industries. Nat. Hazards 2015, 75, 319–332. [Google Scholar] [CrossRef]
- IPCC. Climate Change. In Mitigation of Climate Change; Working Group III Contribution to the Fourth Assessment Report of the IPCC; Cambridge University Press: Cambridge, UK, 2007. [Google Scholar]
- Zhang, M.; Mu, H.; Ning, Y. Accounting for energy-related CO2 emission in China, 1991–2006. Energy Policy 2009, 37, 767–773. [Google Scholar] [CrossRef]
- Wang, Y.; Zhao, H.; Li, L.; Liu, Z.; Liang, S. Carbon dioxide emission drivers for a typical metropolis using input-output structural decomposition analysis. Energy Policy 2013, 58, 312–318. [Google Scholar] [CrossRef]
- Ang, B.W.; Zhang, F.Q. A survey of index decomposition analysis in energy and environmental studies. Energy 2000, 25, 1149–1176. [Google Scholar] [CrossRef]
- Cellura, M.; Longo, S.; Mistretta, M. Application of the structural decomposition analysis to assess the indirect energy consumption and air emission changes related to Italian households consumption. Renew. Sustain. Energy Rev. 2012, 16, 1135–1145. [Google Scholar] [CrossRef]
- Zhang, Y.J.; Da, Y.B. The decomposition of energy-related carbon emission and its decoupling with economic growth in China. Renew. Sustain. Energy Rev. 2015, 41, 1255–1266. [Google Scholar] [CrossRef]
- Ma, C.; Stern, D.I. China’s changing energy intensity trend: A decomposition analysis. Energy Econ. 2008, 30, 1037e53. [Google Scholar] [CrossRef]
- Sun, J.W. Changes in energy consumption and energy intensity: A complete decomposition model. Energy Econ. 1998, 20, 85–100. [Google Scholar] [CrossRef]
- Lise, W. Decomposition of CO2 emissions over 1980–2003 in Turkey. Energy Policy 2006, 34, 1841–1852. [Google Scholar] [CrossRef]
- González, D.; Martínez, M. Decomposition analysis of CO2 emissions in the Mexican industrial sector. Energy Sustain. Dev. 2012, 16, 204–215. [Google Scholar] [CrossRef]
- Su, B.; Ang, B.W. Structural decomposition analysis applied to energy and emissions: Some methodological developments. Energy Econ. 2012, 34, 177–188. [Google Scholar] [CrossRef]
- Ang, B.W. Decomposition analysis for policymaking in energy: Which is the preferred method? Energy Policy 2004, 32, 1131–1139. [Google Scholar] [CrossRef]
- Zhao, M.; Tan, L.R.; Zhang, W.G.; Ji, M.H.; Liu, Y.; Yu, L.Z. Decomposing the influencing factors of industrial carbon emissions in Shanghai using the LMDI method. Energy 2010, 35, 2505–2510. [Google Scholar] [CrossRef]
- Wang, W.W.; Zhang, M.; Zhou, M. Using LMDI method to analyze transport sector CO2 emissions in China. Energy 2011, 36, 5909–5915. [Google Scholar] [CrossRef]
- Ren, S.; Yin, H.; Chen, X. Using LMDI to analyze the decoupling of carbon dioxide emissions by China’s manufacturing industry. Environ. Dev. 2014, 9, 61–75. [Google Scholar] [CrossRef]
- Angela, H.; Heidelinde, A.; Kurt, K.; Erwin, S. Decomposing final energy use for heating in the residential sector in Austria. Energy Policy 2013, 62, 607–616. [Google Scholar]
- Fernández, G.P.; Landajo, M.; Presno, M.J. Multilevel LMDI decomposition of changes in aggregate energy consumption. A cross country analysis in the EU-27. Energy Policy 2014, 68, 576–584. [Google Scholar] [CrossRef]
- Wang, Z.; Zhao, L.; Mao, G.Z.; Wu, B. Factor decomposition analysis of energy-related CO2 emissions in Tianjin, China. Sustainability 2015, 7, 9973–9988. [Google Scholar] [CrossRef]
- Xu, X.Y.; Ang, B.W. Index decomposition analysis applied to CO2 emission studies. Ecol. Econ. 2013, 93, 313–329. [Google Scholar] [CrossRef]
- Wang, W.; Kuang, Y.; Huang, N. Study on the Decomposition of Factors Affecting Energy-Related Carbon Emissions in Guangdong Province, China. Energies 2011, 4, 2249–2272. [Google Scholar] [CrossRef]
- Chen, L.; Yang, Z.; Chen, B. Decomposition Analysis of Energy-Related Industrial CO2 Emissions in China. Energies 2013, 6, 2319–2337. [Google Scholar] [CrossRef]
- Geng, Y.; Zhao, H.; Liu, Z.; Xue, B.; Fujita, T.; Xi, F. Exploring driving factors of energy-related CO2 emissions in Chinese provinces: A case of Liaoning. Energy Policy 2013, 60, 820–826. [Google Scholar] [CrossRef]
- Wang, C.; Zhang, X.; Wang, F.; Lei, J.; Zhang, L. Decomposition of energy-related carbon emissions in Xinjiang and relative mitigation policy recommendations. Front. Earth Sci. 2014, 9, 65–76. [Google Scholar] [CrossRef]
- Wang, C.J.; Wang, F.; Zhang, H.O.; Ye, Y.Y.; Wu, Q.T.; Su, Y.X. Carbon Emissions Decomposition and Environmental Mitigation Policy Recommendations for Sustainable Development in Shandong Province. Sustainability 2014, 6, 8165–8179. [Google Scholar] [CrossRef]
- National Bureau of Statistics of Inner Mongolia Autonomous Region. Inner Mongolia Autonomous Region Statistical Yearbook 2010; China Statistics Press: Beijing, China, 2004. [Google Scholar]
- National Bureau of Statistics of Inner Mongolia Autonomous Region. Inner Mongolia Autonomous Region Statistical Yearbook 2011; China Statistics Press: Beijing, China, 2005. [Google Scholar]
- National Bureau of Statistics of Inner Mongolia Autonomous Region. Inner Mongolia Autonomous Region Statistical Yearbook 2012; China Statistics Press: Beijing, China, 2006. [Google Scholar]
- National Bureau of Statistics of Inner Mongolia Autonomous Region. Inner Mongolia Autonomous Region Statistical Yearbook 2012; China Statistics Press: Beijing, China, 2007. [Google Scholar]
- National Bureau of Statistics of Inner Mongolia Autonomous Region. Inner Mongolia Autonomous Region Statistical Yearbook 2012; China Statistics Press: Beijing, China, 2008. [Google Scholar]
- National Bureau of Statistics of Inner Mongolia Autonomous Region. Inner Mongolia Autonomous Region Statistical Yearbook 2012; China Statistics Press: Beijing, China, 2009. [Google Scholar]
- National Bureau of Statistics of Inner Mongolia Autonomous Region. Inner Mongolia Autonomous Region Statistical Yearbook 2012; China Statistics Press: Beijing, China, 2010. [Google Scholar]
- National Bureau of Statistics of Inner Mongolia Autonomous Region. Inner Mongolia Autonomous Region Statistical Yearbook 2012; China Statistics Press: Beijing, China, 2011. [Google Scholar]
- National Bureau of Statistics of Inner Mongolia Autonomous Region. Inner Mongolia Autonomous Region Statistical Yearbook 2012; China Statistics Press: Beijing, China, 2012. [Google Scholar]
- National Bureau of Statistics of Inner Mongolia Autonomous Region. Inner Mongolia Autonomous Region Statistical Yearbook 2012; China Statistics Press: Beijing, China, 2013. [Google Scholar]
- IPCC. The National Greenhouse Gas Inventories Programme. IPCC Guidelines for National Greenhouse Gas Inventories; Eggleston, H.S., Buendia, L., Miwa, K., Ngara, T., Tanabe, K., Eds.; IGES: Kanagawa, Japan, 2006. [Google Scholar]
- Mahony, T.O. Decomposition of Ireland's carbon emissions from 1990 to 2010: An extended Kaya identity. Energy Policy 2013, 59, 573–581. [Google Scholar] [CrossRef]
- Ang, B.W. The LMDI approach to decomposition analysis: A practical guide. Energy Policy 2005, 33, 867–871. [Google Scholar] [CrossRef]
- Gong, F.; Wang, F. Carbon emissions in Inner Mongolia. J. Arid Land Resour. Environ. 2013, 2, 37–40. (In Chinese) [Google Scholar]
© 2016 by the authors; licensee MDPI, Basel, Switzerland. This article is an open access article distributed under the terms and conditions of the Creative Commons Attribution (CC-BY) license (http://creativecommons.org/licenses/by/4.0/).