Article

The Design of Policy Instruments towards Sustainable Livestock Production in China: An Application of the Choice Experiment Method

Institute of Poyang Lake Eco-Economics, Jiangxi University of Finance and Economics, Nanchang 330013, China
Sustainability 2016, 8(7), 611; https://doi.org/10.3390/su8070611
Submission received: 31 March 2016 / Revised: 12 June 2016 / Accepted: 24 June 2016 / Published: 5 July 2016
(This article belongs to the Section Sustainable Urban and Rural Development)

Abstract

:
In face of gradual ecological deterioration, the Chinese government has been in search of more efficient and effective mitigation policies, aiming to promote the sustainability of livestock production. However, researchers and policy makers seem to neglect a key issue: pinpoint policies are the most important, which means niche targeting is the premise before any policy design, such that better knowing of the livestock farmers preference is prerequisite. This paper then analyzes this question using a method of choice experiment to elicit the farmers’ preference and valuation of livestock pollution control policy instruments at household-scale, medium-scale and large-scale farms. Five attributes (technology regulation, pollution charge, biogas subsidy, manure price, and information provisioning) were set as livestock pollution control policy instruments. In total, 754 pigs farmers from five representative provinces in China were surveyed, and the collected data were analyzed using random parameter logit models. The marginal substitution rates for attributes are estimated both with preference space approach and willingness to pay space approach. The results show significant heterogeneities in farmers’ preferences and valuations for livestock pollution control policy instruments within the three scales. All policy instruments effectively increased the manure eco-friendly treatment ratio for medium-scale farms, and household-scale farms showed little change in the manure eco-friendly treatment ratio under all policy instruments. Household-scale farms and medium-scale farms suggested the highest preference for the biogas subsidy policy, while large-scale farms suggested the highest preference for the manure price policy.

1. Introduction

Livestock production in China, which has been ignored for decades, was the main source of point source pollution and accounted for more than 90% of chemical oxygen demand, 38% of total agricultural nitrogen and 56% of total agricultural phosphorus discharges to surface water systems [1]. Ecological damages associated with livestock production have been intensively investigated worldwide because onsite nutrient release, nitrous oxide emissions from animal wastes such as manure, threats to biodiversity, and soil acidification, among others are important sources influencing our environment [2].
To deal with such serious ecological problems, several policies such as direct regulation, subsidy, pollution charges and rewards have been launched by the Chinese government to ensure the production of livestock can be sustainable. For instance, a biogas subsidy program introduced by the Chinese government in 2005 has become the most important instrument in rural China. Over 24.8 billion Yuan in subsidies have been invested to encourage farmers to install biogas digesters from 2001 to 2010 [3]. In addition, the eco-friendly utilization of manure has been encouraged and supported by the act of “Intensive livestock farming Pollution Prevention Regulations” established in 2014 [4]. Nevertheless, the current policy instruments to decrease the environmental impacts of rapidly expanding livestock production in the future are with little success. A report from SAIN [5] showed that nearly 20% of generated livestock manure was dumped, 66% was directly utilized as fertilizer without treatment, and only 8% was used to produce biogas.
Participation of individual farmers plays an important role in determining the effectiveness of environmental policies. To ensure the efficient livestock production, willingness to comply and willingness to accept must be determined so that farmers can participate with the program and the mechanism can be responded effectively. This is because the policy instruments are usually designed in cost effective approaches, farmers’ preferences and needs were ignored [6]. Meanwhile, as Zheng et al. [7] pointed out, effectiveness of pollution mitigation from livestock production is often decided by scale groups, which have significant differences. As the Statistical Yearbooks of Chinese Livestock Husbandry indicates, the amount of medium-scale farms and large-scale farms has increasing for decades, but the amount of livestock breeding in household operations has decreased during this period. To illustrate, the proportion of household-scale pig farms (less than 50 pigs) was 76.80% in 1998, but this proportion decreased to 35.49% in 2010; in the same period, the proportion of medium-scale farms (50–500 pigs) increased from 7.66% to 29.97%, and the proportion of large-scale farms (more than 500 pigs) increased from 15.53% to 34.54%. Nevertheless, scholars identified the continuing coexistence of household-scale, medium-scale, and large-scale patterns as the primary differences between China and other countries [8]. As a result, effective policy instruments must be investigated and employed to target different groups that may differ in final operationalization between the three scales.
Against this background, we employ a choice experiment (CE) approach to investigate farmers’ prospective responses to policy instruments in the Chinese livestock sector. Specifically, this work investigates to what extent the policy instruments and their levels may affect farmers’ willingness to comply; explores the heterogeneity of preferences among different scale farms; and draws useful conclusions that can be used to improve the design of mechanisms. Few studies have analyzed the preferences for livestock pollution control policy instruments between different scale farms in China. Meanwhile, the previous research related to farmers’ preference for agri-environmental schemes usually adopts a price attribute to investigate the farmers’ willingness to comply or implementation under different policies. Unlike the previous approaches, we use an attribute that reflects the participation intensity of the respondent (manure eco-friendly treatment ratio). Results from this study can deduce how manure eco-friendly treatment ratio may be influenced by characteristics of policies by investigating the marginal rate of substitution among attributes. In addition, we also calculate the marginal substitution rates for attributes in willingness to pay space method, which can model farmers’ heterogeneous preferences and result in more stable estimates.
This study is organized as follows: the next section narrates the choice experiment approach and survey design; Section 3 provides descriptive results of the survey; and Section 4 gives detailed random parameter logit regression results and the valuation of different policy attributes, and the last section is Conclusions that will summarize this study.

2. Methodology

2.1. The CE Approach and Agricultural Environmental Policy

Two general paradigms for preference elicitation are “conjoint analysis” (CA) and “choice experiments” (CE). As stated by Louviere et al. [9], CA is based on a non-behavioral theory of “Conjoint Measurement” (CM) and requires individuals to rank or rate choice data. Thus, CA cannot give detailed information about how individual behavior will alter in reaction to different choice sets. Because CA relies on CM, CE evolved out of a deep-rooted theory of choice behavior which can consider individual choice behaviors. Specifically, as recalled by Bennett and Blamey [10], CE roots in Lancaster’s theory of demand which assumed that any good can be decomposed in a finite set of characteristics, referred to as attributes. Individuals derive utility not from the good itself, but from its attributes [11]. CE is an appropriate approach to investigate individual preference for policy instruments. By asking individuals to select an alternative policy option from various policy choices, we can figure out how individuals will trade off the policy attributes and their levels [12].
Nowadays, a growing body of literatures employed CE to assess farmers’ preference for different agricultural environmental policies. Ruto and Garrod [13] conducted a CE with 2262 EU farmers to assess their preference toward an agri-environmental schemes (AES). Espinosa Goded et al. [14] studied Spanish farmers’ preference for an AES that targeted at cultivating nitrogen fixing crops in marginal dry-land areas. Christensen et al. [15] investigated the preference toward subsidy schemes that aimed at reducing pesticide use based on the data of 444 Danish farmers. Otieno et al. [16] analyzed 343 Kenyan cattle farmers’ preference for an AES for disease free zones. Broch and Vedel [17] investigated farmers’ preference for afforestation schemes in Denmark. Schulz et al. [18] analyzed 128 German farmers’ willingness to participate in the Common Agricultural Policy program (CAP). Lienhoop and Brouwer [6] studied farmers’ preference for an AES aimed at afforestation in Germany. Villanueva et al. [12] assessed Spanish farmers’ willingness to enroll in an AES. Vidogbéna et al. [19] investigated vegetable producing farmers’ willingness to comply with pest control schemes in Benin.

2.2. Attributes and Levels

We fix the policy attributes and their levels in our CE from previous studies that investigated agricultural environmental policies in Chinese livestock production [7,20] and two focus-group survey conducted in Jiangxi Province and Jiangsu Province. We also carried out broad consultations with experts and government officials in soil science, environmental science and agricultural science. The survey was pretested in a small pilot study conducted in Jiangxi Province and Jiangsu Province. Through this process, six attributes were set: technology regulation, pollution charge, biogas subsidy, manure price, information provisioning and manure eco-friendly treatment ratio. Technology regulation is a command-based policy instrument, while pollution charge, biogas subsidy and manure price are market-based policy instruments and information provisioning is a communicative policy instrument. Table 1 listed the attributes and their levels in our CE.
Manure eco-friendly treatment ratio was used as a policy outcome variable in this research. The manure eco-friendly treatment ratio refers to how much more or less manure each farmer is likely to treat in an eco-friendly way. Farmers will not treat the manure in an eco-friendly way activity because they can receive benefits by neglecting manure treatment and the government must give support to encourage farmers to treat the manure in an eco-friendly way. Using manure eco-friendly treatment ratio as the policy outcome attribute, we can figure out how farmers would trade-off different levels of policy attributes against manure eco-friendly treatment ratio.

2.3. Experimental Design

Based on the six attributes and their levels shown in Table 1, we can obtain 864 livestock pollution control policy profiles which will create 864 × 863 possible combinations making up the livestock pollution control policy designs. It is clearly too difficult for farmers to choose from such a large number of choice tasks in practice [22]. Therefore, it is important to be able to determine the number of choice profiles and to randomly design the attribute combinations of livestock pollution control policy instruments to reduce bias and estimate all of the cross-terms. For this reason, we employed an orthogonalization approach of main effects experimental design with SPSS version 13.0 to cut down the number of combinations to 12 with a D-efficiency of 92.6%. Furthermore, to reduce farmer’ cognitive burden and probability of respondent fatigue, all of the 12 choice combinations were randomly divided into 3 groups with 4 choice sets in each group [23]. Each farmer receives a total of 4 randomly selected choice sets. Each choice set depicts two alternatives describing two different livestock pollution control policy combinations and a baseline alternative option. The latter baseline alternative option is referring to “no policy” indicating that farmers choose not to comply with any of the two livestock pollution control policy combinations. The reason we set “no policy” as the baseline alternative option is that not all farmers in China are influenced by current livestock pollution control policies, and most importantly, they are actually not required to practice under these policies so far. Thus, ”no policy” is the baseline that we found can fit to all targeted farmers for our study. Inclusion of a baseline alternative option is important for the interpretation of farmers’ choices in terms of welfare economics and is accordance with demand theory [10]. By including a baseline alternative option, we can resemble farmers’ practical choice behavior and decrease the likelihood of forced choice because farmers may not want to change the current practice [24]. An example of a choice set is presented in Figure 1.

2.4. The Econometric Model

2.4.1. The Random Parameter Logit Model (RPL)

Based on the Lancaster demand theory, the utility obtained from a certain livestock pollution control policy instrument is the sum of the utilities obtained from each of the six policy attributes. Random utility theory assumes that individual i aim to maximize the utility and thus choose the alternative j that delivers most utility. It is difficult to predict farmers’ choice behavior because of the information deficiency by the analyst. In order to account for this uncertainty, the utility function is comprised of a deterministic (observable) component ( V i j ) and an error component ( ε i j ), which can be shown as follows:
U i j = V i j + ε i j
The conditional logit model (CLM) is the most frequently used model to estimate Equation (1). The CLM take for granted that the relationship between utility and attribute parameters is linear, and the error term is identically and independently distributed (i.i.d.) [25]. Moreover, the CLM model results will be biased if i.i.d. is violated, such that it is much more accepted to use a model where the i.i.d. should not be used. In addition, the CLM assumes that individuals have homogeneous preference. However, just as we stated in the introduction section, the livestock farmers in China are heterogeneous and their demand and preferences for policy is not the same. Assuming that farmers have homogeneous preference will get a biased estimation [16].
The random parameter logit model (RPL) is advanced, and it not only requires the i.i.d. assumption, but can also take preference heterogeneity across individuals into consideration. The associated random utility function is as follows:
U i j = β i X i j + ε i j
where X i j is a vector of observed determinants, and β i is a vector of individual-specific taste coefficients with a cumulated density function f ( β i | Ω ) , where Ω include parameters of the distribution, and ε i j is an unobserved random error term that is i.i.d. extreme value, and independent of β i and X i j .
However, the RPL model cannot give detail explanation for the reasons of heterogeneity. Since heterogeneity is often resulting from different socio-economic characteristics of the participants [26], one way to identify the sources of heterogeneity is by allowing interactions of farmers’ socio-economic characteristics with choice specific attributes and/or an alternative specific constant (ASC) in the utility function. The indirect utility function estimated with interaction terms can be expressed as:
V i j = A S C + β m h r × M T R i j + n = 1 n β n Z n + m = 1 m δ m ( S i m × A S C ) + m = 1 m θ m ( S i m × Z n )
where ASC is the alternative specific constant, capturing changes of utility from any other features not included in the choice attributes; β m h r is the coefficient of variable M T R i j (manure eco-friendly treatment ratio); n is the number of policy attributes and the coefficient; β n is associated to the attribute vector (Z); m is the number of farmers socio-economic characteristics aimed to supply explanation for the choice of the policy alternative; and the coefficients δ m and θ m are parameters for interaction term vector that has impact on utility. δ m captures the influence of socio-economic characteristics variables on the probability that an individual will opt for the baseline situation. Therefore, significantly positive result indicates that the attribute generates a higher likelihood that participants will prefer the baseline alternative situation, whereas negative suggests a higher likelihood preferring to the improved options. θ m captures the influence of socio-economic characteristics variables on the probability that a respondent will opt for the policy attributes.

2.4.2. The Calculation of Marginal Substitution Ratio

The marginal substitution rate (MSR) stands for the tradeoff between the manure eco-friendly treatment ratio attribute and the other attributes. It is calculated as follows:
M S R = β n / β m h r
It suggests how manure eco-friendly treatment ratio may be influenced by characteristics of policies. However, this method will cause a skewed distribution of MSR, thus it is calculated from two random variables in RPL model.
A widely used method to reduce the MSR bias is to specify the manure eco-friendly treatment ratio variable to be fixed. This will make MSR calculation more straightforward. However, by doing so, it is assumed that farmers have homogeneous preferences for manure eco-friendly treatment, which is unrealistic. Recently, there has been growing interest in using WTP space method to calculate more stable MSR estimates [27]. This leads to adding the estimation for the distribution of MSR directly in the revised model where the coefficients can represent the MSR.
On the basis of Equation (2), the outcome attribute is separated from the vector of other attributes, i.e., assuming β i X i j = α i M T R i j + b i Z i j , where M T R i j denotes the outcome attribute (manure eco-friendly treatment ratio) and Z i j denotes other attribute vector. α i and b i denote individual coefficients related to the outcome attribute and the other attributes. The associated utility for farmer i choosing alternative j is:
U i j = α i M T R i j + b i Z i j   + ε i j
ε i j is a random error term. It is assumed that ε i j is extreme value distributed with a variance of μ i 2 ( 2 / 6 ) , where μ i is an individual-specific scale parameter. Train and Weeks [27] illustrated that dividing Equation (5) by μ i would not affect behavior and results in a new error term which is i.i.d. extreme value distributed with variance equal to 2 / 6 :
U i j = λ i M T R i j + c i Z i j   + ε i j
where λ i = α i / μ i and c i = b i / μ i . It is named the model in preference space by Train and Weeks [27]. Using the fact that the MSR for a given attribute is obtained through the ratio γ i = c i / λ i = b i / α i , Equation (6) can be rewritten as:
U i j = λ i [ M T R i j + γ i Z i j ] + ε i j
which is the model in WTP space according to Train and Weeks [27]. Equations (6) and (7) similarly demonstrate individuals’ behaviors. In the model in WTP space, unrealistic skewed distributions would be avoided via directly specifying the distribution of the WTP parameter γ i since γ i = b i / α i . The coefficients in the preference space and WTP space models can be estimated by using maximum simulated likelihood or hierarchical Bayesian methods [28]. The estimation was conducted by using the “gmnl” package with STATA 13 [29], following Thiene and Scarpa [30].

3. Data and Description Statistics

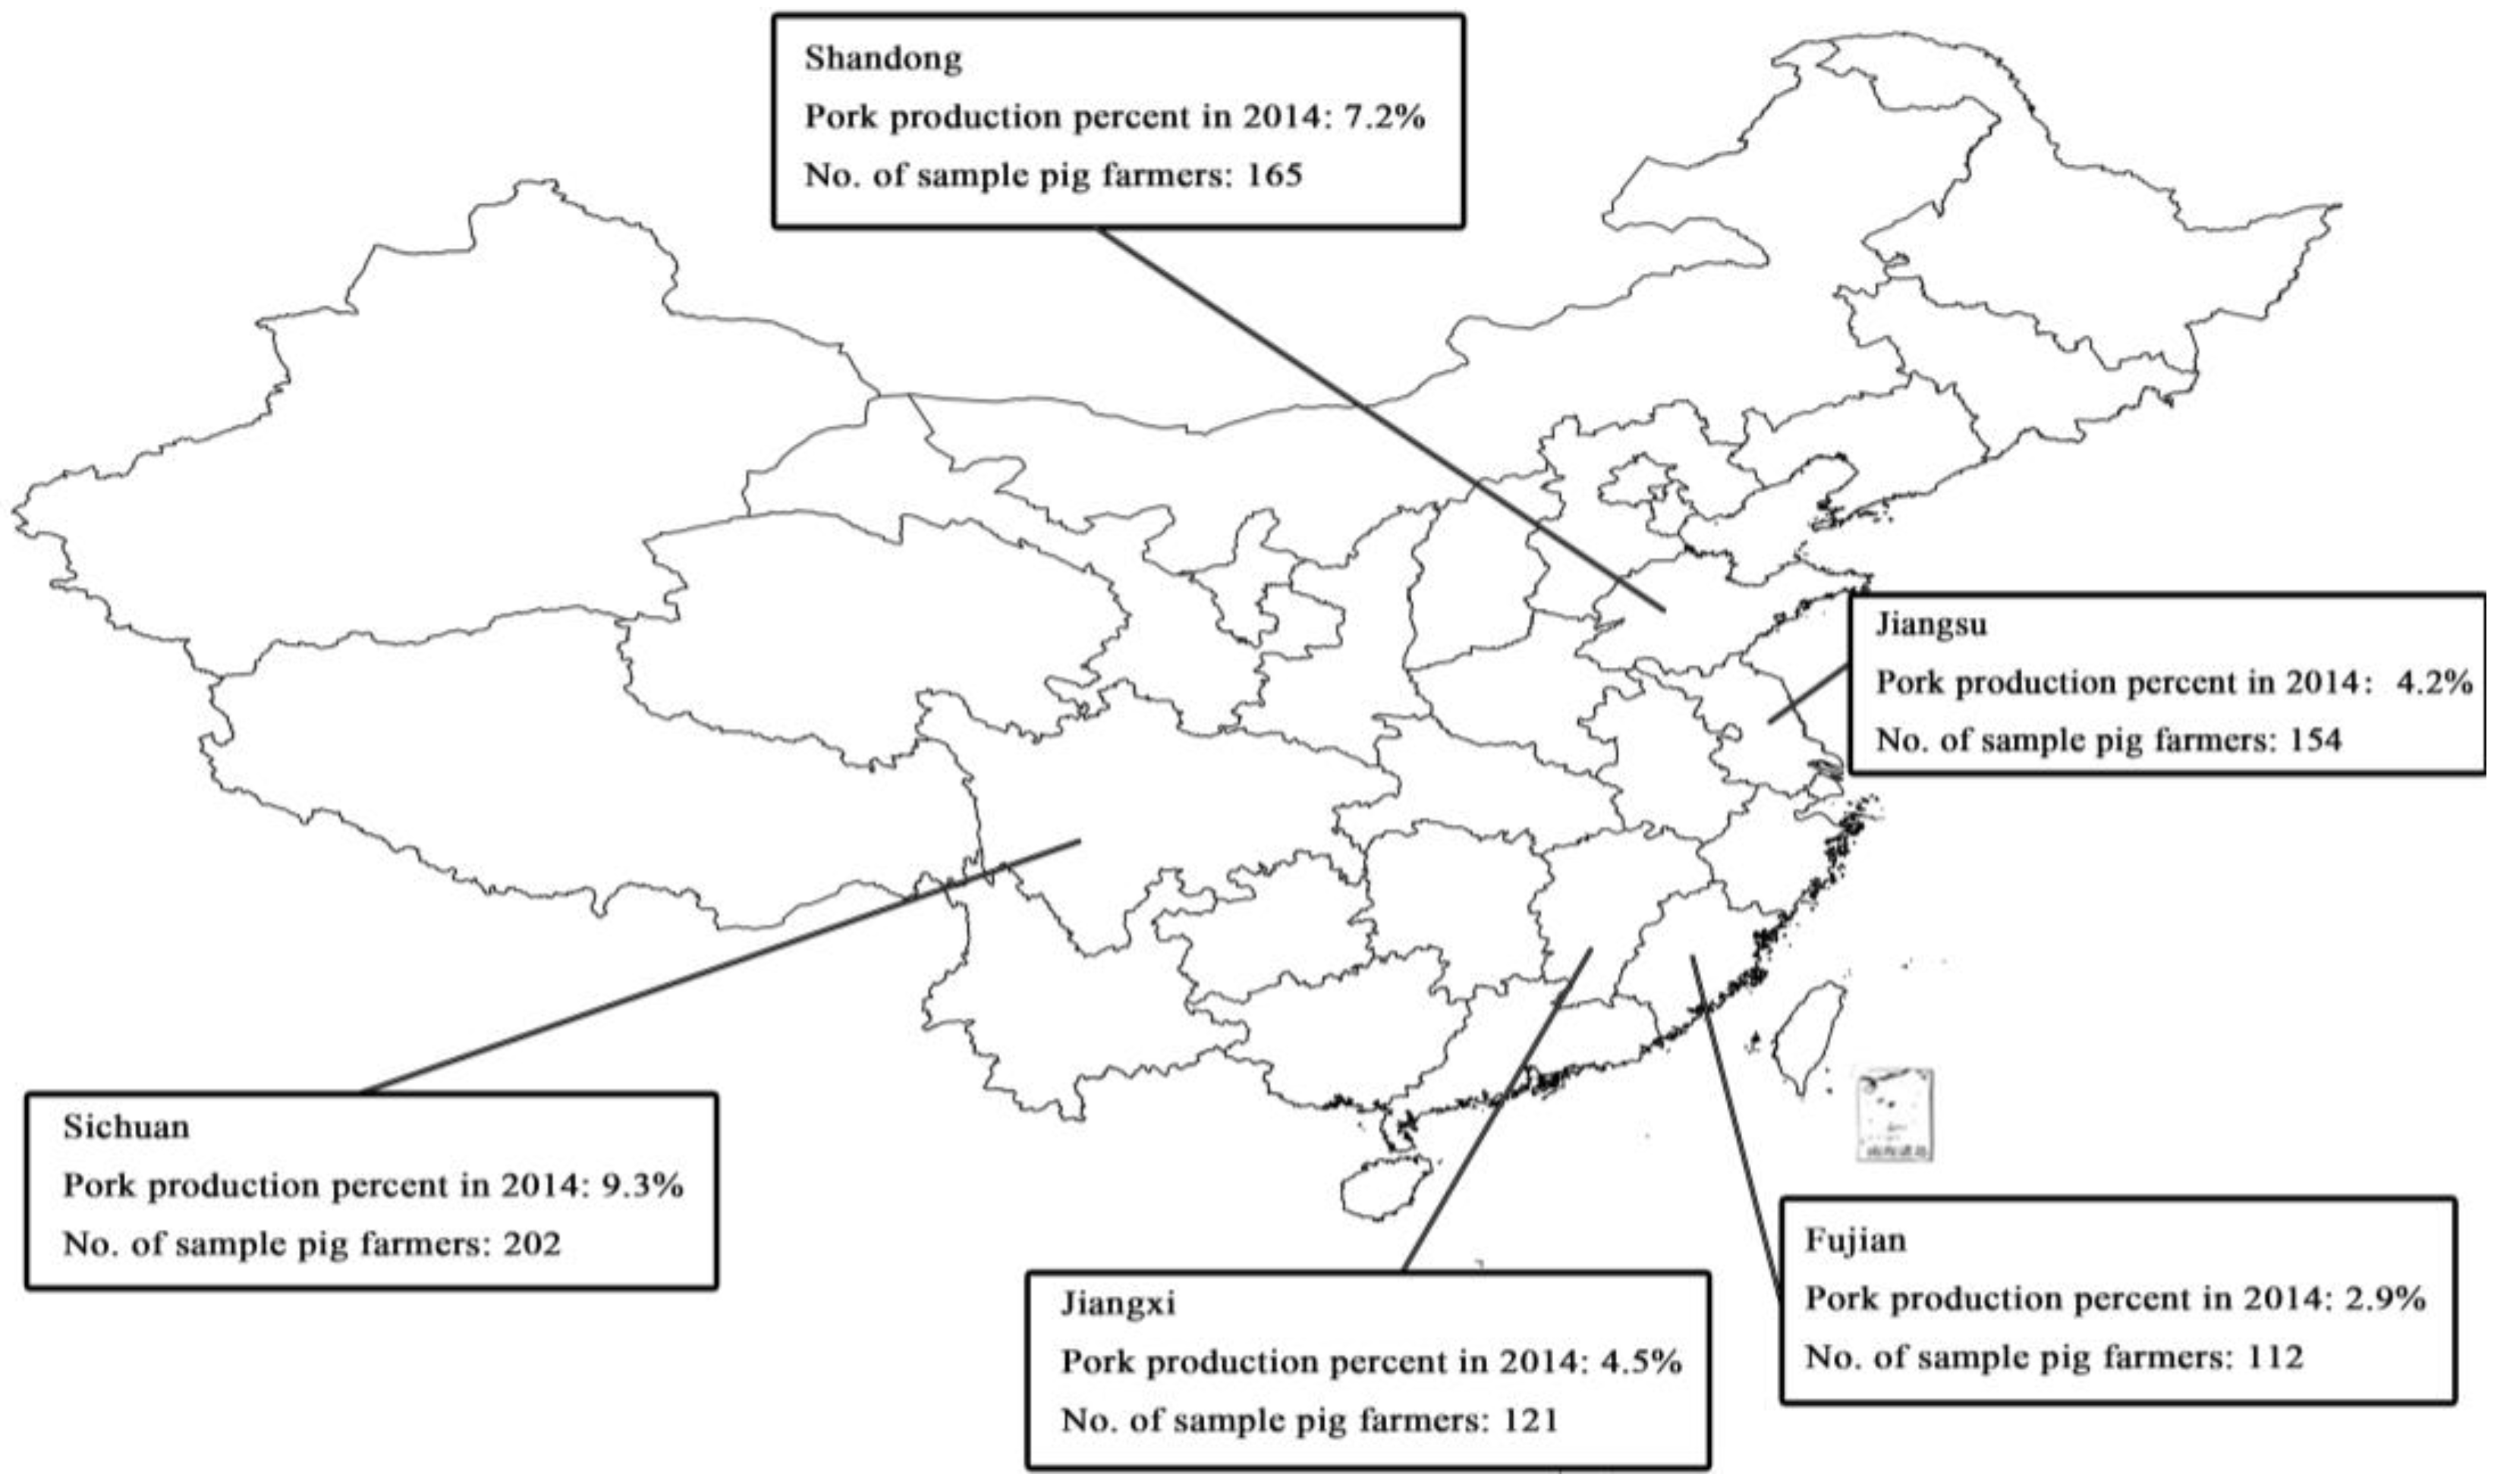
3.1. Data Collection

After pre-testing, the final CE survey was carried out between August and October 2014 through in-person interviews with pig farmers in rural China. Farmers were interviewed with the help of trained enumerators. We used a multi-stage sampling approach to identify our survey sample. Firstly, five provinces in China were chosen as primary sampling provinces from a total of 31 provinces following a stratified sampling proportional to pork production: Jiangsu, Fujian, Shandong, Sichuan and Jiangxi. These five sampled provinces accounted for 28% of Chinese pork production in 2014. In the second stage, three counties located in each of the sampled provinces were selected as secondary sampling units according to the industrial output per capita. The reason we choose to identify our sample based on the industrial output per capita is that we want to select counties that represent different development standards. Pig breeding characteristic and pig farmers’ demand for livestock pollution policies will vary in different development standard counties and industrial output per capita is a preferred indictor of development standard than net rural per capita income [31]. Third, three villages located in each of the sampled counties were selected based on industrial output per capita. Fourth, we decided the sample size of pig farmers in each village proportionally to the total pig breeding number in that village. Thus, the number of pig farmers per village is not the same, which ranged from ten to twenty-five. The relative amount of pork production is higher in Sichuan Province (9.3 percent) and Shandong Province (7.2 percent), thus, the relative amount of sampled pig farmers of these two provinces are higher than the other three sampled provinces (with sample proportions ranging from 14.9 percent to 20.4 percent). Finally, 800 pig farmers complete the CE survey. We dropped the following 46 pig farmers: 14 farmers who rejected to answer the CE cards, 14 farmers chose the baseline alternative option constantly regardless of the alternative policies suggested and 18 farmers who did not finish the CE survey. Consequently, 754 pig farmers were used for our analysis. Figure 2 presented the location of the sampled provinces and their pork production and the number of sampled pig farmers in each province.
The questionnaire consisted of three parts. Firstly, socio-economic information of pig farmers such as household head’ gender, age, education years and sown area were collected. This was followed in the second part with questions focusing on farmers’ knowledge, perceptions and attitudes regarding livestock pollution. The third part of consisted of the CE.
CE is not a regular household survey for farmers, and it is very difficult to understand. One concern with using CE was whether poorly educated pig farmers would be able to make repeated choices with six attributes. We explained each attribute and attribute level in detail before the pig farmers took the survey, and we conducted a warm-up choice task before the 4 choice tasks to make sure that they understood the exercise well enough.

3.2. Statistical Analysis of Sample Pig Farmers

Variable definitions and socio-demographic characteristics across the three farm scales are listed in Table 2. The significant difference test indicates that there exists apparent dissimilarity in almost all socio-demographic characteristics across the three scales (except for Fscale). Pig farmers had an average age of 47.551; the age of larger-scale farmers was relatively younger. Most pig farmers had an average education of 6–9 years and the education years of larger-scale farms are higher. Approximately 65% of pig farmers identified that livestock pollution has “nearly no” or “little” ecological damages. However, large-scale farmers had a higher recognition that livestock pollution will have serious ecological damages. The pig farmers’ average knowledge on livestock pollution control policy instruments was low, and the knowledge of larger-scale farmers was relatively higher. We found a general trend toward higher knowledge on livestock pollution control policy instruments with an increasing farming scale. The willingness to treat manure in an eco-friendly way of medium-scale farms was the highest. The reason for this phenomenon may be that the amount of manure generated by household-scale farms is relatively small and they have enough farmland to absorb the generated manure. Large-scale farms can obtain financial support more easily from the government because of their contribution to the local economy and thus they have more money and capacity to take up environmentally friendly manure treatment technologies. Nevertheless, medium-scale farms have less government subsidies and lack adequate investment capital to use modern technologies for environmentally friendly manure treatment; they also lack enough farmland to absorb the relatively greater amount of generated manure compared with household-scale farms [8].

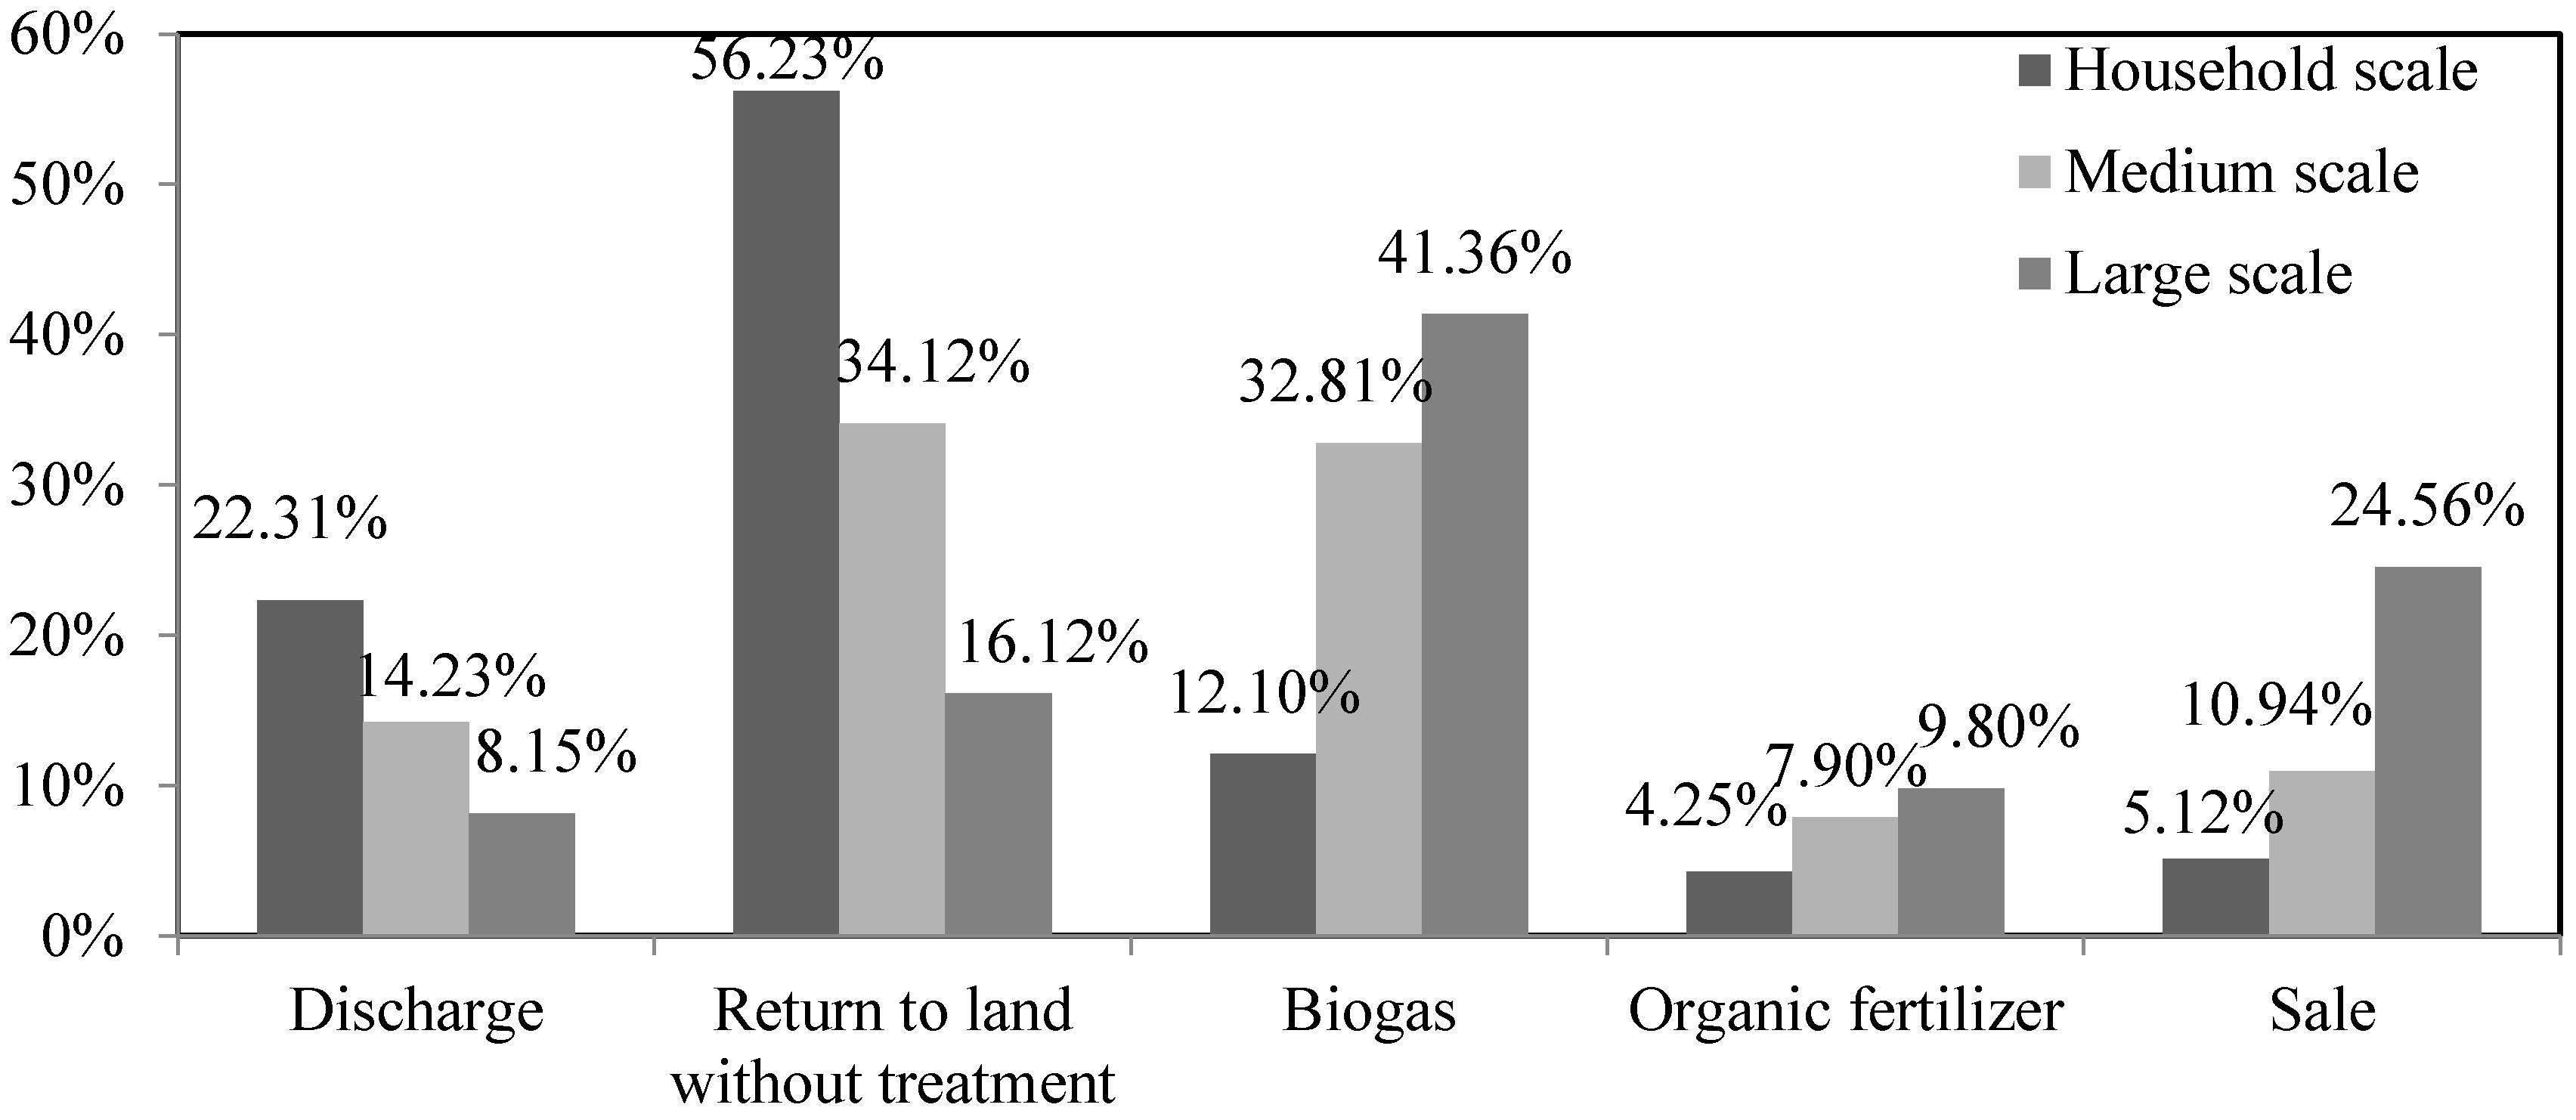
3.3. Livestock Manure Treatment Technologies in Three Farm Scales

Discharge, return to land without treatment, biogas, organic fertilizer and sale are the five main treatment technologies of livestock manure in China. Discharge technology refers to that manure is directly abandoned; return to land without treatment technology refers to that manure directly utilized as fertilizer without treatment; biogas technology means that manure is employed to generate biogas; organic fertilizer technology means that manure is stored to produce organic fertilizer and sale technology means that manure is sold to other farmers or agricultural factories to manufacture fertilizer. In this paper, the manure eco-friendly treatment technologies are referred to manure that treated with biogas, organic fertilizer and sale technologies which will cause less damage to the environment compared with the other two treatment technologies.
The distribution of livestock manure treatment technologies across the three farm scales is shown in Figure 3. While the farm scale increased, the likelihood of farmers to choose manure eco-friendly treatment technologies is higher. In total, 41.36% of large-scale farms and 32.81% of medium-scale farms used manure for biogas production. However, only 12.10% of household-scale farms used manure for biogas production. Manure for sale and organic fertilizer were also higher on large-scale and medium-scale farms. Meanwhile, although Chinese government forbids the directly abandonment of manure, many farmers still choose the discharge technology to treat manure. The proportion of discharged manure was 22.31%, 14.23% and 8.15% in household-scale, medium-scale, and large-scale farms, respectively. Manure that was returned to the land was lower in large-scale and medium-scale farms. Household-scale farms returned most of the manure (56.23%) to the land.

4. Results and Discussion

4.1. RPL Estimation Results

Table 3 shows the estimation results of the RPL models conducted with Stata 13. The variable manure eco-friendly treatment ratio is estimated using a fixed distribution, while the other variables are specified as random parameters which are assumed to be uniformly distributed. Simulations are based on a 500 Halton draws.
The models have a decent goodness of fit for all farm scales by the conventional standards with an estimated Pseudo-R2 of 0.3215, 0.3146 and 0.3087, respectively [32]. The sign and significance of the ASC is negative in all of the three scales. ASC is a dummy variable that equals to 0 if farmers preferred option A or option B and 1 otherwise [33]. It represents the likelihood of farmers’ choice for not comply with one of the two improved livestock pollution control policy options. The statistically negative sign of this variable suggests that farmers, all else being constant, are willing to change their current treatment behavior of manure. This indicated that farmers have a preference for a situation move away from their current livestock pollution management [24]. Just as the statistical description section stated, most pig farmers had a high willingness to treat the livestock pollution with eco-friendly technologies. The policy outcome variable manure eco-friendly treatment ratio has a highly negative influence on farmers’ choice behavior in all three scales. That is, if farmers increase their manure eco-friendly treatment ratio, their utility will decrease. This is consistent with the rational agent assumption. To deal with manure in an eco-friendly way, farmers need to install new treatment equipment, which are often costly and will have sunk costs. In addition, risk aversion of the costs and benefits has also decreased the utility of manure eco-friendly treatment.
For household-scale farms, the coefficients of biogas subsidy, manure price, medium information provisioning and high information provisioning attributes all have a significantly positive impact on their choice behavior. This indicated that if household-scale farms were offered more biogas subsidy, received higher manure price and obtained more medium information provisioning and high information provisioning, then they tend to choose the livestock pollution control policy instruments including these characteristics. However, contrary to our expectations, technology regulation and pollution charge appeared to have no significant influence on household-scale farms’ choice behavior. This result is similar to the result obtained by Zheng et al. [7]. There are hundreds of millions of household-scale farms distributed in China. The pollution emission from the household-scale farms is highly dispersive, randomized and is difficult to supervise. For this reason, nowadays, the technology regulation policy and pollution charge policy only target at large-scale farms and was hardly implemented in household-scale farms. Therefore, the household-scale farms’ choice behavior was not influenced by technology regulation and pollution charge attributes. Four attributes, pollution charge, biogas subsidy, manure price and medium information provisioning, have highly significant standard deviations indicating that household-scale farms’ preferences for these four attributes are heterogeneous. In contrast, the high information provisioning attribute has an insignificant standard deviations coefficient but a significant mean coefficient suggesting that there is no heterogeneous preference for high information provisioning attribute of household-scale farms, i.e., all household-scale farms consider high information provisioning is necessary for increasing their manure eco-friendly treatment ratio. The coefficients of an interaction of ASC with Education and ASC with Fscale were statistically significant. Farmers who received more education have higher capacity to understand manure eco-friendly treatment technologies and are more aware of the costs and benefits relating to manure eco-friendly treatment. Thus, Education has a positive impact on household-scale farms’ choice of one of the improved policy alternatives. The likelihood of choosing the improved policy alternatives of household-scale farms with less sown area is lower. The interactions between Fscale, Willingness and biogas subsidy attribute, Education and manure price attribute, as well as the interactions between Attitude, Willingness and information provisioning attribute are positive. That is, household-scale farms with more sown area and higher willingness to treat manure in an eco-friendly way were more likely to choose the biogas subsidy policy. Farmers with higher education have a greater preference for the manure price policy. Household-scale farms with higher attitude toward negative environmental impacts of livestock pollution and higher willingness to treat manure in an eco-friendly way were more likely to choose the information provisioning policy.
For medium-scale farms, all of the attributes had significant and positive impacts on their choice behavior. This indicated that if medium-scale farms received higher technology regulation and pollution charge, received higher biogas subsidies, gained higher manure price and obtained more medium information provisioning and high information provisioning, then they would choose the livestock pollution control policy instruments including these characteristics. Five attributes, technology regulation, pollution charge, manure price, medium information provisioning and high information provisioning, have highly significant standard deviations indicating that medium-scale farms’ preferences for these five attributes are heterogeneous. In contrast, the biogas subsidy attribute has an insignificant standard deviations coefficient but a significant mean coefficient suggesting that there is no heterogeneous preference for biogas subsidy attribute of medium-scale farms, i.e., all medium-scale farms consider biogas subsidy is necessary for increasing their manure eco-friendly treatment ratio. The coefficients of an interaction of ASC with Education, ASC with Attitude and ASC with Willingness were statistically significant. Medium-scale farms with more education, higher attitude toward negative environmental impacts of livestock pollution and higher willingness to treat manure in an eco-friendly way have higher probability to choose one of the improved policy alternatives. No significance was found amongst interactions between the technology regulation attribute and demographics, except for Fscale. That is, the less sown area the medium-scale farmers have, the more likely the farmers would choose the technology regulation policy. No significances were found for the coefficients of pollution charge attribute. The interactions among Fscale, Knowledge and biogas subsidy attribute, Willingness and medium information provisioning attribute as well as the interaction between Attitude and high information provisioning attribute are positive. That is, medium-scale farms with more sown area and higher knowledge on livestock pollution control policy instruments were more likely to choose the biogas subsidy policy. The higher the willingness to treat manure in an eco-friendly way, the more likely the medium-scale farmers are to choose the medium information provisioning policy. Medium-scale farms with higher attitude toward negative environmental impacts of livestock pollution were more likely to choose the high information provisioning policy. The interaction between Fscale and manure price is negative, indicating medium-scale farmers with less sown area were more likely to choose the manure price policy.
For large-scale farms, technology regulation, pollution charge, biogas subsidy, manure price and high information provisioning were significant factors in the farmers’ choice. This suggested that if large-scale farms received higher technology regulation and pollution charge, received higher biogas subsidies, gained higher manure price and obtained more high information provisioning, then they would choose the livestock pollution control policy instruments including these characteristics. Medium information provisioning appeared to have no significant influence on large-scale farms’ choice. The derived standard deviations of technology regulation, pollution charge, biogas subsidy and high information provisioning were significant, indicating that the preferences of these attributes do indeed vary significantly within the large-scale farms. The manure price attribute has an insignificant standard deviations coefficient but a significant mean coefficient which implies that the manure price is a necessary policy for large-scale farms. The coefficients of an interaction of ASC with Education, ASC with Knowledge and ASC with Willingness were statistically significant. Large-scale farms with more education, higher knowledge on livestock pollution control policy instruments and higher willingness to treat manure in an eco-friendly way have higher probability to choose one of the improved policy alternatives. The interactions among Knowledge and pollution charge attribute, Fscale, Knowledge and biogas subsidy attribute, Knowledge and manure price attribute as well as the interaction between Attitude and high information provisioning attribute are positive. That is, large-scale farms with higher knowledge on livestock pollution control policy instruments were more likely to choose the pollution charge, biogas subsidy and manure price policies. Large-scale farms with more sown area were more likely to choose the biogas subsidy policy. Large-scale farms having higher attitudes toward negative environmental impacts of livestock pollution showed higher preference for the high information provisioning policy. The interactions between Fscale and technology regulation as well as manure price are negative, indicating large-scale farmers with less sown area were more likely to choose the technology regulation and manure price policies.

4.2. MSR Results

Table 4 presents the MSR estimation results in preference space and WTP space of the RPL model in Table 3. In Table 4, the MSR distributions of all attributes are similar between the two estimation approaches. However, it is obvious that the MSR mean values estimated with preference space approach are much higher than the values estimated with WTP space approach. This is in accordance with the previous studies conducted by Sonnier et al. [34]. They also found that WTP space approach will obtain higher estimation results. Moreover, the standard deviations of MSR estimation results in preference space are much higher than the values estimated in WTP space. As stated in previous studies by Scarpa et al. [35] and Hole et al. [36], lower standard deviations indicating more precise MSR estimation. For this reason, we explain the MSR estimation results in Table 4 based on the WTP space approach.
The rankings of the mean values of MSR estimation are significantly different across the three farm scales. The policy preference ranking of household-scale farms are as follows: biogas subsidy policy, high information provisioning policy, medium information provisioning policy, manure price policy, pollution charge policy and technology regulation policy. The policy preference ranking of medium-scale farms are as follows: biogas subsidy policy, manure price policy, high information provisioning policy, technology regulation policy, medium information provisioning policy and pollution charge policy. The policy preference ranking of large-scale farms are as follows: manure price policy, biogas subsidy policy, technology regulation policy, pollution charge policy, high information provisioning policy and medium information provisioning policy.
Besides significant differences in the policy preference ranking across the three farm scales, the mean values of MSR estimation also showed obvious heterogeneity. The mean values of MSR estimation are the lowest in household-scale farms under all policy instruments, and are the highest in medium-scale farms under all policy instruments. This indicates that by offering policy instruments, medium-scale farms will increase their manure eco-friendly treatment ratio more than the other farms.
Medium-scale farms and large-scale farms had a higher preference for the technology regulation policy. However, household-scale farms’ preference for this policy was relatively low. If technology regulation exists, then the manure eco-friendly treatment ratio of medium-scale farms and large-scale farms will increase 7.19% and 4.33%, respectively. However, the manure eco-friendly treatment ratio of household-scale farms will increase only 1.35%. The reason for this low increment may be that the pollution emission from the household-scale farms, which have a scattered distribution in China, is highly dispersive, randomized and is difficult to supervise. Thus, the technology regulation is only target at medium-scale farms and large-scale farms in China. For example, the technical standard of livestock pollution control issued by State Environmental Protection Administration set specific regulations only for medium-scale farms and large-scale animal farms.
All three scale farms had a low preference for the pollution charge policy. The manure eco-friendly treatment ratio across the three farm scales will increase 2.13%–3.64% with the pollution charge policy. The pollution charge is assumed to have a high impact on farmers’ choice behavior. This assumption is made on the basis that farmers will encounter a high penalty if they do not treat livestock manure in an eco-friendly way. However, opposite to our assumption, the impact of pollution charge policy on the enhancement of manure eco-friendly treatment ratio is very low. There are several reasons for this. First, just as we stated earlier, the pollution charge policy in China is mainly target at large-scale farms. However, large-scale farms are usually protected by the local government because of their contribution to the local economy. In many areas of China, large-scale farms will not be penalized if they do not treat livestock manure in an eco-friendly way [37]. In addition, even if there were pollution charges, the current pollution charges in China are about 33.6–60 Yuan/head/year, which are very low compared to the costs of manure eco-friendly treatment. Therefore, many livestock farmers would likely pay the penalty by choosing not to treat livestock manure in an eco-friendly way [38].
All three scale farms had a high preference for the biogas subsidy policy. With a biogas subsidy policy, farmers will get financial support from government to install biogas digesters which will lower the cost of manure eco-friendly treatment [3]. The impact of the biogas subsidy policy on the enhancement of manure eco-friendly treatment ratio is extremely higher for medium-scale farms. The manure eco-friendly treatment ratio of medium-scale farms will increase by 11.36% if a biogas subsidy is provided compared to 4.95% and 6.65% in household-scale and large-scale farms, respectively. A possible reason for this is that medium-scale farms usually have less government subsidies and lack adequate investment capital to use modern technologies to treat livestock manure in an eco-friendly way. This result is consistent with Zheng et al. [8] who also found the main barriers for eco-friendly manure treatment technology adoption by medium-scale farms focused on economic disadvantages.
Medium-scale farms and large-scale farms showed a higher preference for the manure price policy, but household-scale farms’ preference for this policy was relatively low. If a manure price exists, then the manure eco-friendly treatment ratio of medium-scale farms and large-scale farms will increase by 9.45% and 7.43%, respectively. However, the manure eco-friendly treatment ratio of household-scale farms will increase by only 2.32%. A possible reason for this is that the livestock emissions from household-scale farms were less than medium-scale and large-scale farms, and the economic profitability from selling manure is limited. Thus, most household-scale farms dislike the choice of selling manure.
Household-scale farms and medium-scale farms had a higher preference for the information provisioning policy, but large-scale farms’ preference for this policy was relatively low. The manure eco-friendly treatment ratio of large- scale farms will increase by only 0.85% if medium information provisioning is received, compared to 5.47% and 3.11% in medium-scale and household-scale farms, respectively. The manure eco-friendly treatment ratio of large-scale farms will increase by only 1.85% if high information provisioning is received compared to 8.76% and 3.84% in medium-scale and household-scale farms, respectively. The Chinese agricultural extension system has been reformed since the end of the 20th century, which has resulted in few promotion funds for agricultural extension. Consequently, the quality of promotion staff is low. The main workers have no qualified education or training. Previous investigation shows that only 10% of the system workers had a bachelor’s degree and 46% of the staff does not receive any training [39]. Additionally, the trained workers also do not update their knowledge and skills and cannot meet the demand of the promotion system. Meanwhile, due to higher education levels and other factors, large-scale farms’ knowledge on manure eco-friendly treatment technology is higher than household-scale and medium-scale farms, yet farmers reported that the promotion staff cannot provide enough technical support.

5. Conclusions

Livestock farmers’ preference is important in determining the effectiveness of policy instruments in China. However, researchers and policy makers seem to neglect a key issue: pinpoint policies are the most important, which means that niche targeting should be the premise of any policy design. The diversity of livestock farmers is inevitable, and the Chinese government should take this diversity into consideration and implement customized policies according to farmers’ needs. This paper makes a contribution in that the author accessed the preference and valuation of livestock pollution control policy instruments among household-scale, medium-scale and large-scale farms. A CE was conducted in five provinces of China. The attributes of the livestock pollution control policy instruments that were considered included technology regulation, pollution charge, biogas subsidy, manure price, and information provisioning.
Findings support that farmers’ preference and valuation for livestock pollution control policy instruments exhibits remarkable heterogeneity within the three scales of household-scale, medium-scale and large-scale farms. First, all the policies had significant impacts on medium-scale farms’ choice behavior. Technology regulation policy and pollution charge policy appeared to have no significant influence on household-scale farms’ choice behavior, and medium information provisioning policy has no significant influence on large-scale farms’ choice behavior. Second, household-scale farms and medium-scale farms had the highest preference for the biogas subsidy policy, and large-scale farms had the highest preference for the manure price policy. Third, the enhancement of manure eco-friendly treatment ratio was the lowest in household-scale farms under all policy instruments, and it was the highest in medium-scale farms.
This study has important policy implications. First, the government should adopt diverse policies on the basis of various targeted farmers. For household-scale farms, perfecting the biogas subsidy policy and providing more technical information on how to deal with the livestock manure in an eco-friendly way are effective ways to mitigate pollution. Meanwhile, due to the fact that the enhancement of manure eco-friendly treatment ratio is the lowest in household-scale farms under all policy instruments, cutting down the breeding amount is a primary way to reducing livestock pollution emission in household-scale farms. For medium-scale farms, all policy instruments are effective in increasing the manure eco-friendly treatment ratio. In recent years, the Chinese government has been encouraging household-scale farms to become medium-scale farms by enlarging the breeding scale. Consequently, medium-scale farms in China have developed rapidly. It is extremely critical to encourage medium-scale farms to treat the livestock manure in an eco-friendly way for environmental management in rural areas. Our results show that the biogas subsidy policy and the manure price policy have the highest impact on medium-scale farms’ manure eco-friendly treatment behavior. For large-scale farms, perfecting the biogas subsidy policy and expanding the manure price are effective ways to mitigate pollution. In addition, more information in eco-friendly technologies should be provided to farmers.
Nonetheless, our study has some limitations that should be acknowledged. First, a cost-benefit analysis should be carried out in future studies. An effective livestock pollution control policy should not only take account of farmers’ preference, but should also consider the financial cost associated with different policies. Second, this paper has not deal with the attribute non-attendance problem in CE. Attribute non-attendance means that individuals will ignore some attributes when doing the CE survey [40]. Nowadays, a growing body of literature has discussed the attribute non-attendance problem. Most of the previous studies showed that the CE results will be biased if the analyst did not deal with the attribute non-attendance problem, however, not all studies hold the same view [40,41]. A stated non-attendance(SNA) method (Hensher et al. [42], Carlsson et al. [43] and Chalak et al. [44]) or an inferred non-attendance (INA) method (Hess et al. [45] and Hensher et al. [46]) can be used to identify attribute non-attendance.

Acknowledgments

We would like to thank the financial support from the National Natural Science Foundation of China (No. 71303099; No. 71503113; and No. 71263018), the Education Science Foundation of Jiangxi Province (No. General 30), the National Social Science Foundation of China (No. 2015YZD16; and No. 15CGL039), the Philosophy and Social Science Foundation of Jiangxi Province (No. JJ1510) and the Natural Science Foundation of Jiangxi Province (No. 20152ACB20004).

Conflicts of Interest

The author declares no conflict of interest.

References

  1. Ministry of Environmental Protection of China (MEP); National Bureau of Statistics of China (NBS); Ministry of Agriculture of China (MOA). The First National Survey of Pollution Sources Bulletin. 2010. Available online: http://www.china.com.cn/news/txt/2010-02/11/content_19408590.htm (accessed on 28 June 2016). (In Chinese)
  2. Norse, D.; Ju, X. Environmental costs of China’s food security. Agric. Ecosyst. Environ. 2015, 209, 5–14. [Google Scholar] [CrossRef]
  3. Qu, W.; Tu, Q.; Bluemling, B. Which factors are effective for farmers’ biogas use?—Evidence from a large-scale survey in China. Energy Policy 2013, 63, 26–33. [Google Scholar] [CrossRef]
  4. Jia, W.; Yan, Z.; Chadwick, D.R.; Kang, L.; Duan, Z.; Bai, Z.; Chen, Q. Integrating soil testing phosphorus into environmentally based manure management in peri-urban regions: A case study in the Beijing area. Agric. Ecosyst. Environ. 2015, 209, 47–49. [Google Scholar] [CrossRef]
  5. SAIN Improving Manure Nutrient Management towards Sustainable Intensification in China. 2012. Available online: http://www.sainonline.org/SAIN-Website(English)/download/SAIN_%20Policy_Brief_No6_EN.pdf (accessed on 22 July 2012).
  6. Lienhoop, N.; Brouwer, R. Agri-environmental policy valuation: Farmers’ contract design preferences for afforestation schemes. Land Use Policy 2015, 42, 568–577. [Google Scholar] [CrossRef]
  7. Zheng, C.; Liu, Y.; Bluemling, B.; Mol, A.P.; Chen, J. Environmental potentials of policy instruments to mitigate nutrient emissions in Chinese livestock production. Sci. Total Environ. 2015, 502, 149–156. [Google Scholar] [CrossRef] [PubMed]
  8. Zheng, C.; Bluemling, B.; Liu, Y.; Mol, A.P.; Chen, J. Managing manure from China’s pigs and poultry: The influence of ecological rationality. AMBIO 2014, 43, 661–672. [Google Scholar] [CrossRef] [PubMed]
  9. Louviere, J.J.; Flynn, T.N.; Carson, R.T. Discrete choice experiments are not conjoint analysis. J. Choice Model. 2010, 3, 57–72. [Google Scholar] [CrossRef]
  10. Bennett, J.; Blamey, R. The Choice Modeling Approach to Environmental Valuation; Edward Elgar Publishing: Cheltenham, UK, 2001. [Google Scholar]
  11. Lancaster, K.J. A new approach to consumer theory. J. Political Econ. 1966, 74, 132–157. [Google Scholar] [CrossRef]
  12. Villanueva, A.J.; Gómez-Limón, J.A.; Arriaza, M.; Rodríguez-Entrena, M. The design of agri-environmental schemes: Farmers’ preferences in southern Spain. Land Use Policy 2015, 46, 142–154. [Google Scholar] [CrossRef]
  13. Ruto, E.; Garrod, G. Investigating farmers’ preferences for the design of agri-environment schemes: A choice experiment approach. J. Environ. Plan. Manag. 2009, 52, 631–647. [Google Scholar] [CrossRef] [Green Version]
  14. Espinosa Goded, M.; Barreiro Hurlé, J.; Ruto, E. What do farmers want from agri-environmental scheme design? A choice experiment approach. J. Agric. Econ. 2010, 61, 259–273. [Google Scholar] [CrossRef] [Green Version]
  15. Christensen, T.; Pedersen, A.B.; Nielsen, H.O.; Mørkbak, M.R.; Hasler, B.; Denver, S. Determinants of farmers’ willingness to participate in subsidy schemes for pesticide-free buffer zones—A choice experiment study. Ecol. Econ. 2011, 70, 1558–1564. [Google Scholar] [CrossRef]
  16. Otieno, D.J.; Ruto, E.; Hubbard, L. Cattle Farmers’ Preferences for disease-free zones in Kenya: An application of the choice experiment method. J. Agric. Econ. 2011, 62, 207–224. [Google Scholar] [CrossRef] [Green Version]
  17. Broch, S.W.; Vedel, S.E. Using choice experiments to investigate the policy relevance of heterogeneity in farmer agri-environmental contract preferences. Environ. Resour. Econ. 2012, 51, 561–581. [Google Scholar] [CrossRef]
  18. Schulz, N.; Breustedt, G.; LataczLohmann, U. Assessing farmers’ willingness to accept “greening”: Insights from a discrete choice experiment in Germany. J. Agric. Econ. 2014, 65, 26–48. [Google Scholar] [CrossRef]
  19. Vidogbéna, F.; Adégbidi, A.; Tossou, R.; Assogba-Komlan, F.; Ngouajio, M.; Martin, T.; Simon, S.; Parrot, L.; Zander, K.K. Control of vegetable pests in Benin-Farmers’ preferences for eco-friendly nets as an alternative to insecticides. J. Environ. Manag. 2015, 147, 95–107. [Google Scholar] [CrossRef] [PubMed]
  20. Chadwick, D.; Jia, W.; Tong, Y.; Yu, G.; Shen, Q.; Chen, Q. Improving manure nutrient management towards sustainable agricultural intensification in China. Agric. Ecosyst. Environ. 2015, 209, 34–36. [Google Scholar] [CrossRef]
  21. Sun, D.; Bai, J.; Qiu, H.; Cai, Y. Impact of government subsidies on household biogas use in rural China. Energy Policy 2014, 73, 748–756. [Google Scholar] [CrossRef]
  22. Allenby, G.M.; Rossi, P.E. Marketing models of consumer heterogeneity. J. Econom. 1998, 89, 57–78. [Google Scholar] [CrossRef]
  23. Hensher, D.A. How do respondents process stated choice experiments? Attribute consideration under varying information load. J. Appl. Econom. 2006, 21, 861–878. [Google Scholar] [CrossRef]
  24. Adamowicz, W.; Boxall, P.; Williams, M.; Louviere, J. Stated preference approaches for measuring passive use values: Choice experiments and contingent valuation. Am. J. Agric. Econ. 1998, 80, 64–75. [Google Scholar] [CrossRef]
  25. Hausman, J.; Mcfadden, D. Specification tests for the multinomial logit model. Econometrica 1984, 52, 1219–1240. [Google Scholar] [CrossRef]
  26. Boxall, P.C.; Adamowicz, W.L. Understanding heterogeneous preferences in random utility models: A latent class approach. Environ. Resour. Econ. 2002, 23, 421–446. [Google Scholar] [CrossRef]
  27. Train, K.; Weeks, M. Discrete Choice Models in Preference Space and Willingness-to-Pay Space; Springer: Berlin, Germany, 2005. [Google Scholar]
  28. Train, K.E. Discrete Choice Methods with Simulation; Cambridge University Press: Cambridge, UK, 2009. [Google Scholar]
  29. Gu, Y.; Hole, A.R.; Knox, S. Fitting the generalized multinomial logit model in Stata. STATA J. 2013, 13, 382–397. [Google Scholar]
  30. Thiene, M.; Scarpa, R. Deriving and testing efficient estimates of WTP distributions in destination choice models. Environ. Resour. Econ. 2009, 44, 379–395. [Google Scholar] [CrossRef]
  31. Rozelle, S. Stagnation without equity: Patterns of growth and inequality in China’s rural economy. China J. 1996. [Google Scholar] [CrossRef]
  32. Hensher, D.A.; Rose, J.M.; Greene, W.H. Applied Choice Analysis: A Primer; Cambridge University Press: Cambridge, UK, 2005. [Google Scholar]
  33. Louviere, J.J.; Hensher, D.A.; Swait, J.D. Stated Choice Methods: Analysis and Applications; Cambridge University Press: Cambridge, UK, 2000. [Google Scholar]
  34. Sonnier, G.; Ainslie, A.; Otter, T. Heterogeneity distributions of willingness-to-pay in choice models. Quant. Mark. Econ. 2007, 5, 313–331. [Google Scholar] [CrossRef]
  35. Scarpa, R.; Thiene, M.; Train, K. Utility in willingness to pay space: A tool to address confounding random scale effects in destination choice to the Alps. Am. J. Agric. Econ. 2008, 90, 994–1010. [Google Scholar] [CrossRef]
  36. Hole, A.R.; Kolstad, J.R. Mixed logit estimation of willingness to pay distributions: A comparison of models in preference and WTP space using data from a health-related choice experiment. Empir. Econ. 2012, 42, 445–469. [Google Scholar] [CrossRef]
  37. Zheng, C.; Liu, Y.; Bluemling, B.; Chen, J.; Mol, A.P. Modeling the environmental behavior and performance of livestock farmers in China: An ABM approach. Agric. Syst. 2013, 122, 60–72. [Google Scholar] [CrossRef]
  38. Taylor, J.; Xie, Q. Wuhan: Policies for the management and improvement of a polluted city. China’s Econ. Growth 2000, 20, 143–160. [Google Scholar]
  39. Xu, Q. The Study of Agricultural Non-Point Source Pollution Control Policy System; Michigan Technological University: Houghton, MI, USA, 2014. [Google Scholar]
  40. Scarpa, R.; Gilbride, T.J.; Campbell, D.; Hensher, D.A. Modeling attribute non-attendance in choice experiments for rural landscape valuation. Eur. Rev. Agric. Econ. 2009, 36, 151–174. [Google Scholar] [CrossRef]
  41. Widmar, N.J.O.; Ortega, D.L. Comparing consumer preferences for livestock production process attributes across products, species, and modeling methods. J. Agric. Appl. Econ. 2014, 46, 375–391. [Google Scholar]
  42. Hensher, D.A.; Rose, J.; Greene, W.H. The implications on willingness to pay of respondents ignoring specific attributes. Transportation 2005, 32, 203–222. [Google Scholar] [CrossRef]
  43. Carlsson, F.; Kataria, M.; Lampi, E. Dealing with ignored attributes in choice experiments on valuation of Sweden’s environmental quality objectives. Environ. Resour. Econ. 2010, 47, 65–89. [Google Scholar] [CrossRef]
  44. Chalak, A.; Abiad, M.; Balcombe, K. Joint use of attribute importance rankings and non-attendance data in choice experiments. Eur. Rev. Agric. Econ. 2016, 4, 1–24. [Google Scholar] [CrossRef]
  45. Hess, S.; Hensher, D.A. Using conditioning on observed choices to retrieve individual-specific attribute processing strategies. Transp. Res. Part B Methodol. 2010, 44, 781–790. [Google Scholar] [CrossRef]
  46. Hensher, D.A.; Rose, J.M.; Greene, W.H. Inferring attribute non-attendance from stated choice data: Implications for willingness to pay estimates and a warning for stated choice experiment design. Transportation 2012, 39, 235–245. [Google Scholar] [CrossRef]
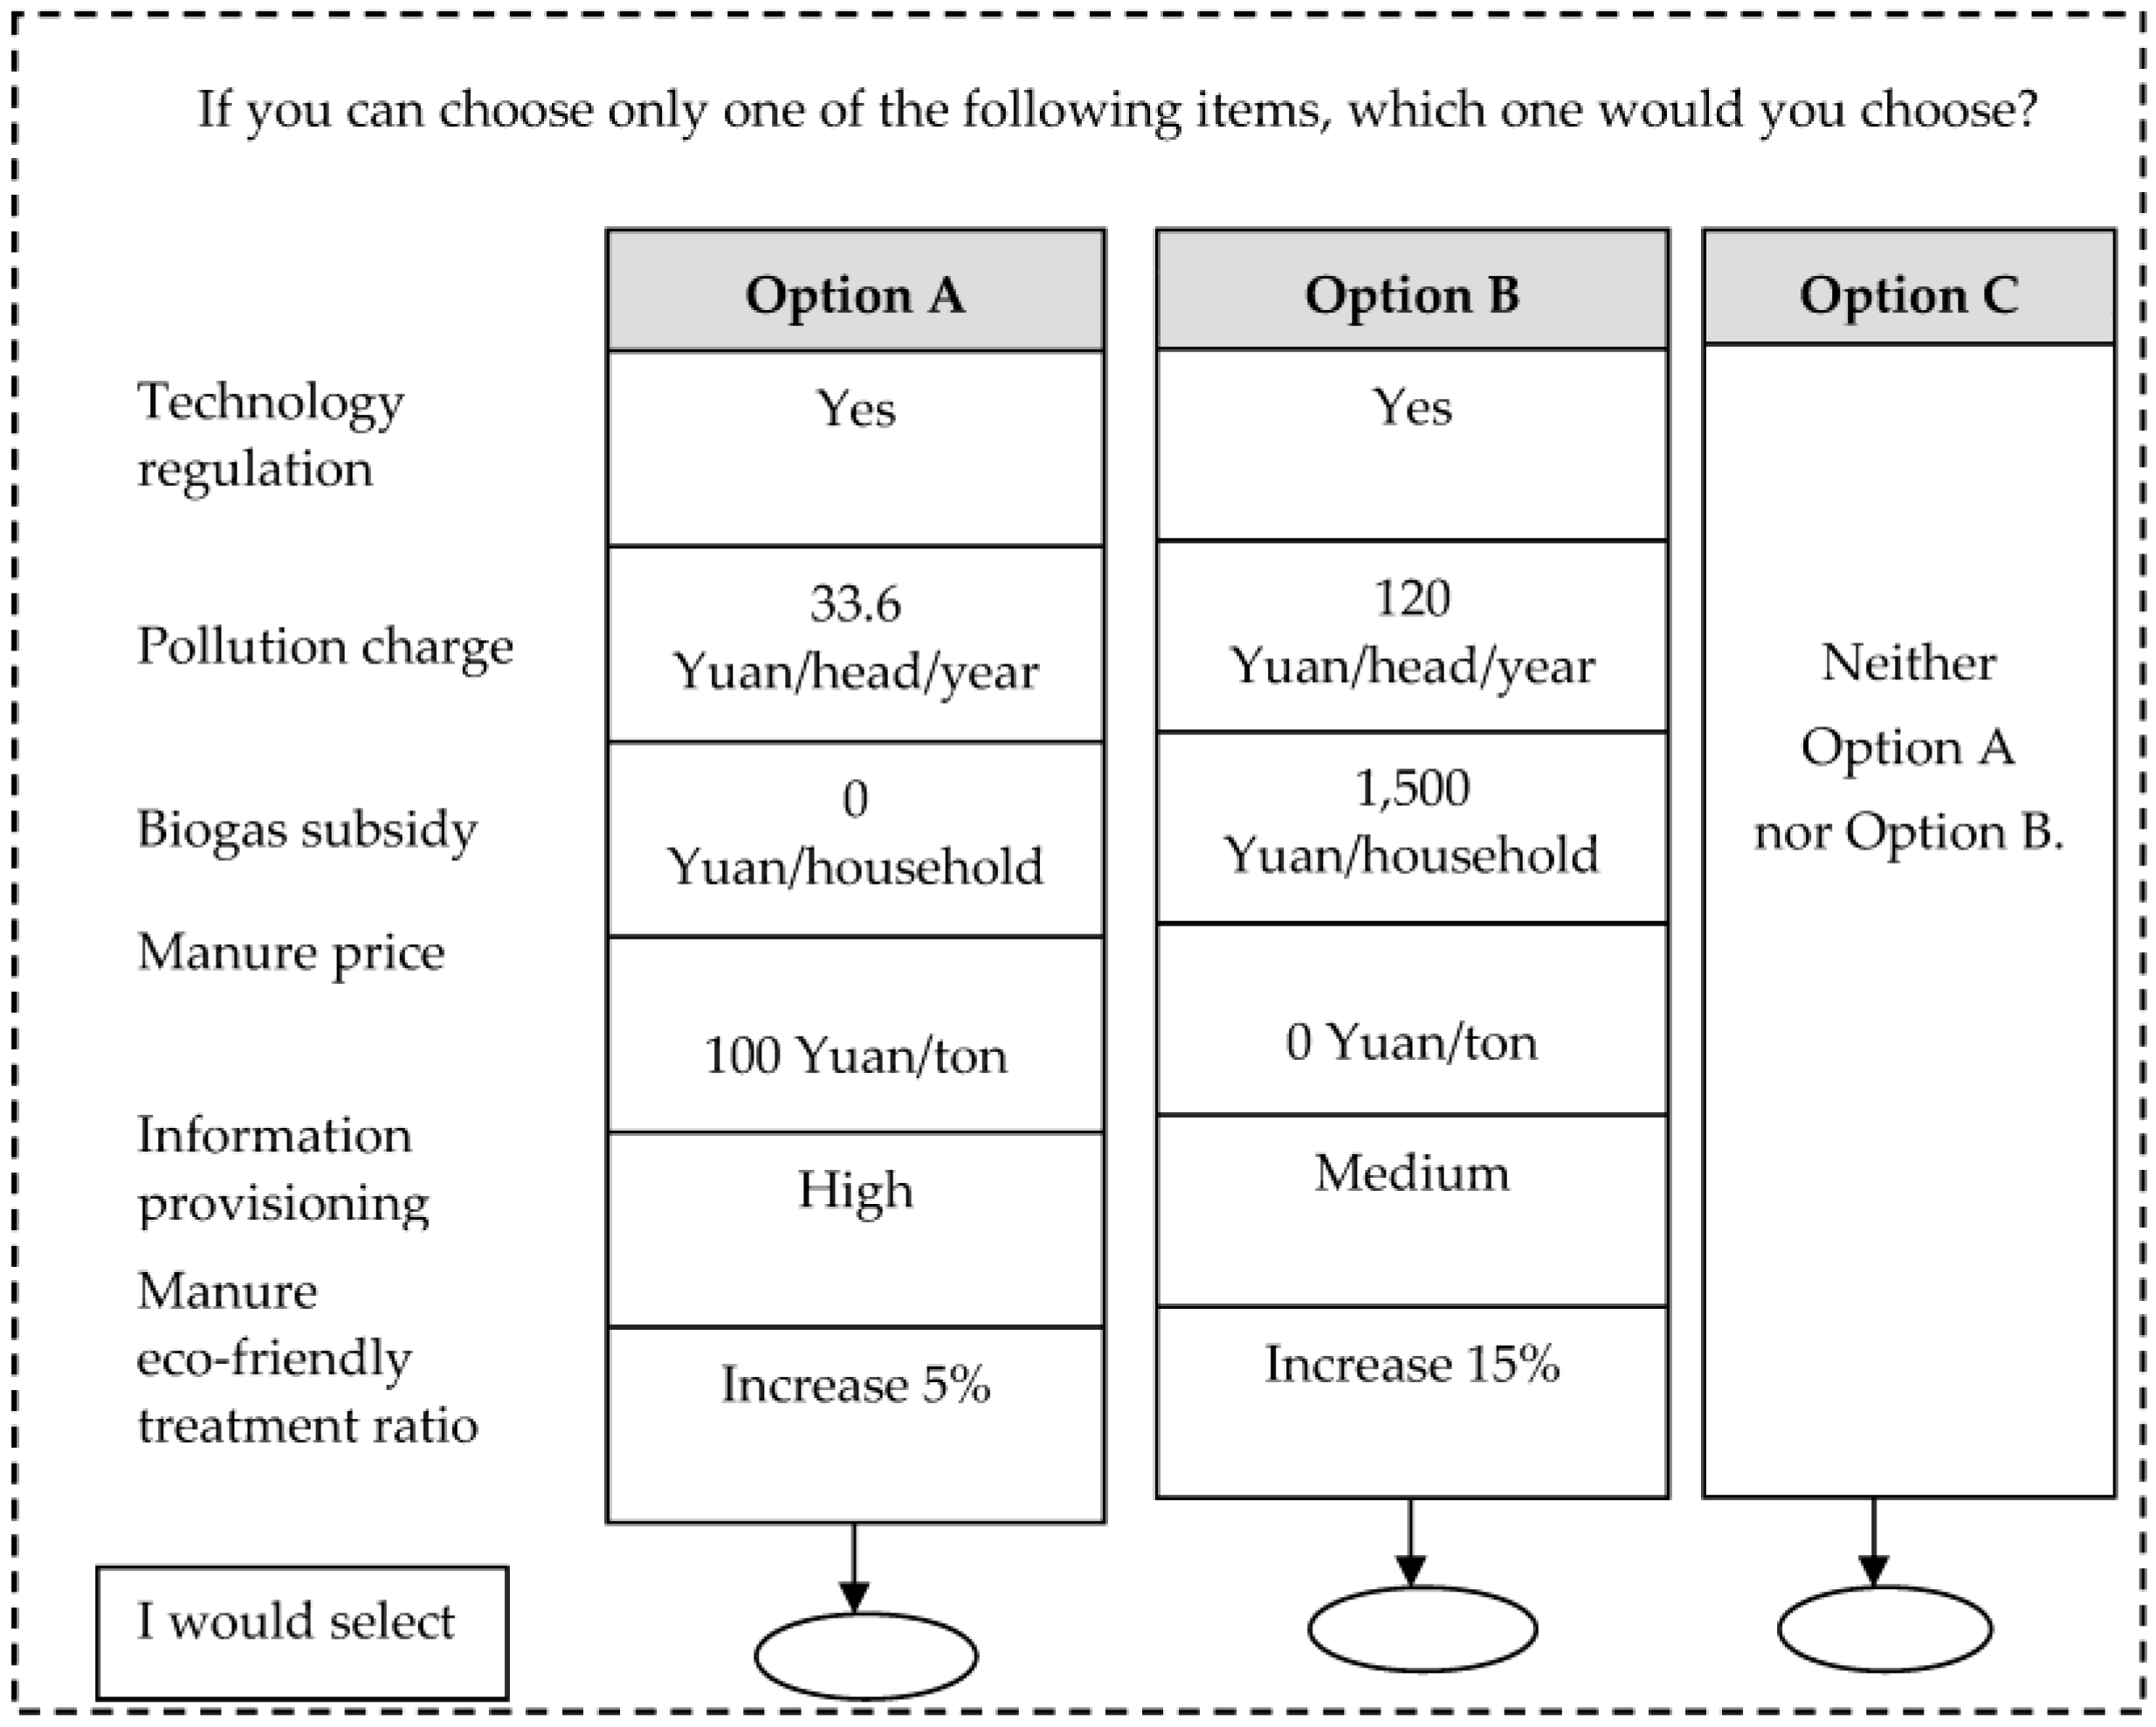
Figure 1. Example of a choice set.
Sustainability 08 00611 g001
Figure 2. Sample location and distribution.
Sustainability 08 00611 g002
Figure 3. Livestock manure treatment technologies in three farm scales.
Sustainability 08 00611 g003
Table 1. Attributes and levels used in the choice set design.
AttributesDescriptionLevelsJustification
Technology regulationDemands for farmers to adopt special criteria to treat livestock pollutionYes
No
Technical standard of livestock pollution control issued by State Environmental Protection Administration (HJ/T 81-2001)
Pollution chargePayment for livestock pollution emission that exceeds the pollution standardNo pollution charge
33.6 Yuan/head/year
60 Yuan/head/year
120 Yuan/head/year
Regulations on the Collection and Use of Pollution Discharge Fee (No. 369 policy paper issued by state council)
Biogas subsidySubsidies provided to farmers who use biogas infrastructureNo biogas subsidy
1000 Yuan/household
1500 Yuan/household
2000 Yuan/household
Literature Sun et al. [21]
Manure pricePrice of manure in the marketNo price
100 Yuan/ton
150 Yuan/ton
Literature Zheng et al. [7]
Information provisioningGovernment provides information about pollution control technologies to farmersNo information provisioning
Medium information provisioning
High information provisioning
Research assumption
Manure eco-friendlytreatment ratioChanges in manure eco-friendly treatment ratioIncrease 0%
Increase 5%
Increase 15%
Expert consultation and literature SAIN [5]
Table 2. Socio-demographic statistics across scale groups.
VariableDefinitionTotalHousehold ScaleMedium ScaleLarge ScaleDifference Significance
MaleHousehold head’gender 1 = male, 0 = female0.7630.7130.7370.7180.271
AgeHousehold head’ age in 201346.24447.55244.23441.1250.00 ***
EducationHousehold head’ education years in 20138.6717.8928.98110.3460.004 ***
FscaleSown area in 2013, Ha/person0.0800.0810.0820.0830.434
AttitudeAttitude towards negative environmental impacts of livestock pollution, 1 = don’t know; 2 = nearly no negative impact, 3 = little negative impact, 4 = less serious negative impact, 5 = serious negative impact2.8732.7553.2283.4650.034 **
KnowledgeKnowledge on livestock pollution control policy instruments, 1 = never heard of; 2 = occasionally heard of; 3 = basic understanding; 4 = full knowledge2.3012.2432.6242.6330.058 *
WillingnessWillingness to treatmanure in an eco-friendly way, 1 = yes; 0 = no0.8260.7750.8860.8160.042 **
Note: * Denotes significance at the 10% level; ** denotes significance at the 5% level; and *** denotes significance at the 1% level.
Table 3. RPL estimations for the three farm scales.
VariablesHousehold ScaleMedium ScaleLarge Scale
CoefficientStandard ErrorCoefficientStandard ErrorCoefficientStandard Error
Mean values
ASC1.302 **0.5232.089 **1.0231.275 **0.522
Technology regulation0.0890.1430.697 ***0.2340.415 *0.209
Pollution charge0.1320.1260.425 **0.1620.318 **0.124
Biogas subsidy0.326 ***0.1211.203 ***0.3430.608 ***0.223
Manure price0.163 **0.0730.997 ***0.2650.716 **0.308
Medium information provisioning0.195 **0.0830.554 **0.2110.0890.072
High information provisioning0.232 **0.1120.793 ***0.2420.181 ***0.064
Manure eco-friendly treatment ratio−0.053 **0.022−0.073 **0.033−0.081 **0.032
Standard deviations
Technology regulation0.2320.3141.543 ***0.5210.875 **0.329
Pollution charge0.278 **0.1211.154 ***0.4250.632 **0.291
Biogas subsidy0.523 **0.2211.1230.9130.984 ***0.329
Manure price0.357 ***0.1132.214 ***0.7620.6250.469
Medium information provisioning0.654 **0.2580.121 **0.0470.3210.195
High information provisioning0.3460.7921.458 **0.6220.543 **0.244
Covariates (socio-economic variables)
ASC × Male−0.0720.1350.0490.213−0.0650.092
ASC × Age0.0240.0920.0190.017−0.0260.126
ASC × Education−0.043 ***0.015−0.056 **0.022−0.034 **0.0136
ASC × Fscale0.018 **0.0090.0230.031−0.0270.094
ASC × Attitude−0.0160.014−0.024 **0.012−0.0210.054
ASC × Knowledge−0.0250.033−0.0180.052−0.033 **0.014
ASC × Willingness−0.0260.019−0.045 ***0.015−0.036 **0.014
Technology regulation × Male0.0150.0160.0110.008−0.0230.019
Technology regulation × Age−0.0030.007−0.006−0.005−0.0080.007
Technology regulation × Education0.1210.1650.0980.6540.0760.043
Technology regulation × Fscale−0.2040.142−0.143 **0.064−0.253 ***0.087
Technology regulation × Attitude0.0320.0610.0250.0320.0430.027
Technology regulation × Knowledge−0.0250.016−0.0310.026−0.0270.048
Technology regulation × Willingness−0.0420.025−0.0640.042−0.0960.064
Pollution charge × Male0.0080.0070.0120.0150.0160.013
Pollution charge × Age−0.0040.003−0.0060.007−0.0090.008
Pollution charge × Education0.0760.0530.0460.0280.0540.035
Pollution charge × Fscale0.0650.0490.0230.0190.0820.051
Pollution charge × Attitude0.1240.0760.0960.0520.1080.065
Pollution charge × Knowledge0.3080.1860.2870.1980.223 ***0.073
Pollution charge × Willingness0.0870.0650.0520.0350.1540.096
Biogas subsidy × Male0.0210.0180.0150.0120.0180.014
Biogas subsidy × Age0.0060.0040.0080.0070.0070.005
Biogas subsidy × Education0.0080.0060.0120.0090.0150.012
Biogas subsidy × Fscale0.123 **0.0560.206 ***0.0770.217 **0.082
Biogas subsidy × Attitude0.0320.0210.0450.0310.0530.037
Biogas subsidy × Knowledge0.0420.0260.076 *0.0430.085 **0.041
Biogas subsidy × Willingness0.054 **0.0230.0360.0280.1140.098
Manure price × Male0.0130.0090.0220.0180.0340.028
Manure price × Age0.0050.0040.0080.0060.0090.007
Manure price × Education0.031 **0.0130.0420.0290.0280.021
Manure price × Fscale−0.0270.018−0.056 **0.028−0.083 **0.041
Manure price × Attitude 0.2070.1840.0970.0650.1740.108
Manure price × Knowledge 0.1850.1760.0650.0430.046 **0.021
Manure price × Willingness0.0360.0430.0780.0490.0540.033
Medium information provisioning × Male0.0350.0270.0260.0160.0180.011
Medium information provisioning × Age0.0080.0050.0050.0040.0040.003
Medium information provisioning × Education0.0360.0260.0460.0310.3040.198
Medium information provisioning × Fscale0.0540.0350.0870.0540.0650.043
Medium information provisioning × Attitude0.021 **0.0080.0960.0580.1850.124
Medium information provisioning × Knowledge0.0440.0270.1040.0760.0750.064
Medium information provisioning × Willingness0.052 **0.0260.133 **0.0630.0870.054
High information provisioning × Male0.0160.0110.0120.0090.0240.019
High information provisioning × Age0.1080.0820.0050.0040.0080.005
High information provisioning × Education0.0270.0190.0650.0410.0550.036
High information provisioning × Fscale0.0450.0280.1060.0690.0410.028
High information provisioning × Attitude0.056 **0.0270.076 **0.0350.092 **0.042
High information provisioning × Knowledge0.0420.0290.0490.0320.0840.054
High information provisioning × Willingness0.038 **0.0180.0730.0450.0420.027
Log likelihood−3067.2−3132.8−3245.6
Prob > chi20.00000.00000.0000
Pseudo-R20.32150.31460.3087
Note: * denotes significance at the 10% level; ** denotes significance at the 5% level; and *** denotes significance at the 1% level.
Table 4. MSR results for the three farm scales.
MethodAttributesHousehold ScaleMedium ScaleLarge Scale
MeanSDMeanSDMeanSD
Preference spaceTechnology regulation1.88%0.83%8.42%2.17%5.41%1.21%
Pollution charge2.42%0.98%5.15%1.45%4.09%0.87%
Biogas subsidy6.13%2.34%13.74%3.54%7.76%2.03%
Manure price3.12%1.06%12.10%2.60%9.25%1.89%
Medium information provisioning3.80%1.77%6.64%1.76%1.18%0.21%
High information provisioning4.47%1.89%9.58%2.43%2.28%0.76%
WTP spaceTechnology regulation1.35%0.44%7.19%1.05%4.33%0.65%
Pollution charge2.13%0.58%3.64%0.76%2.96%0.48%
Biogas subsidy4.95%1.65%11.36%2.13%6.65%1.21%
Manure price2.32%0.74%9.45%1.65%7.43%0.82%
Medium information provisioning3.11%0.89%5.47%0.87%0.85%0.12%
High information provisioning3.84%1.23%8.76%1.54%1.85%0.26%

