
Integrated Approach to Construction of Benchmarking Network in DEA-Based Stepwise Benchmark Target Selection


Abstract
:1. Introduction
2. Problem Definition
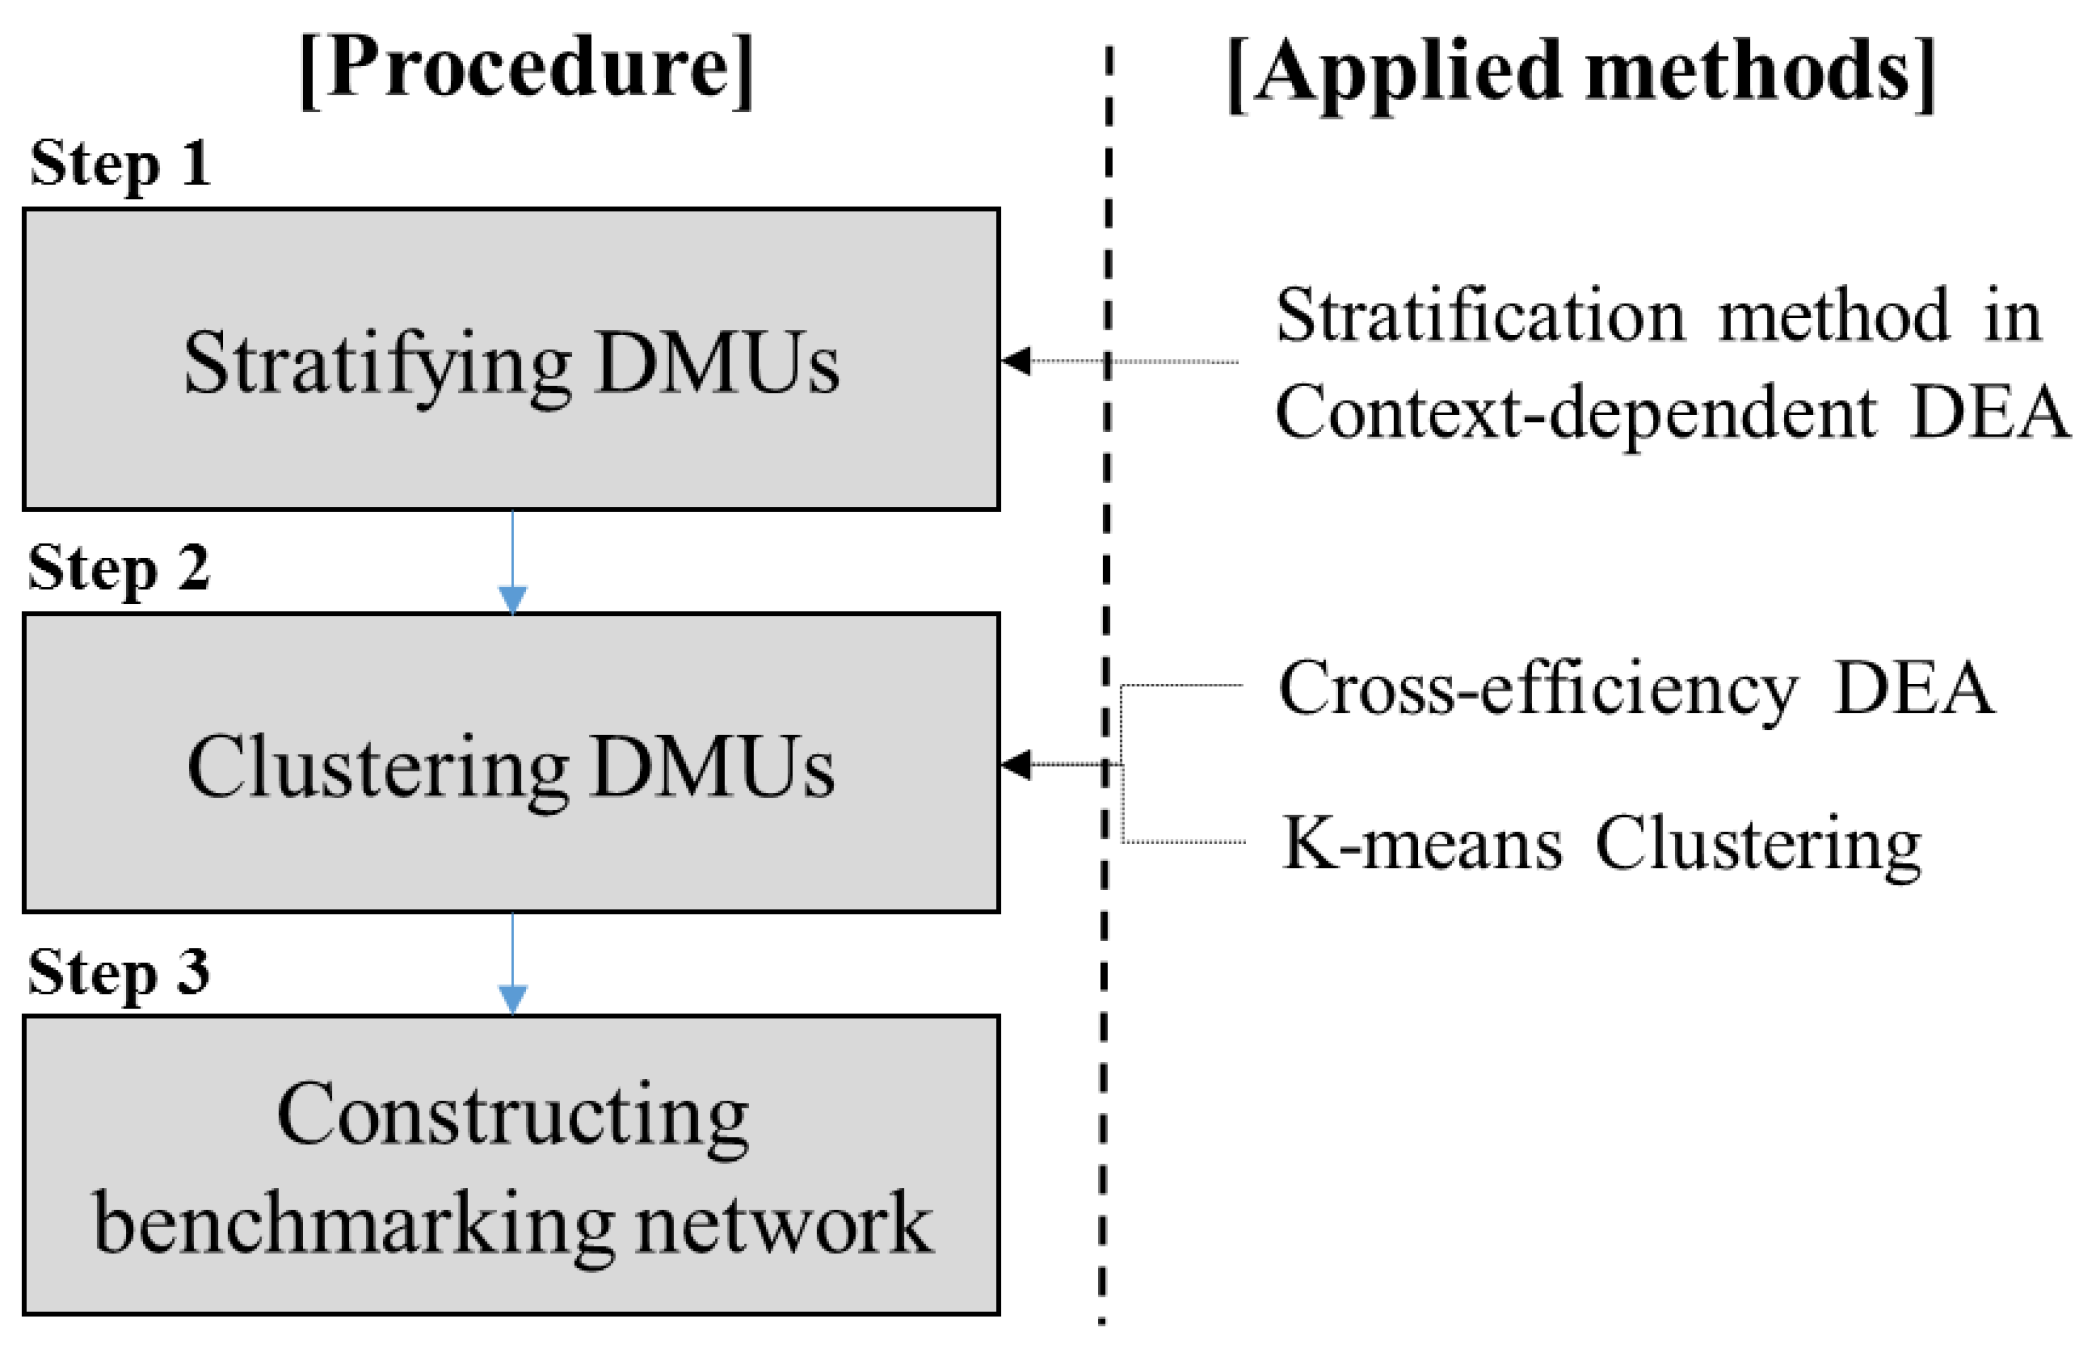
3. Proposed Method
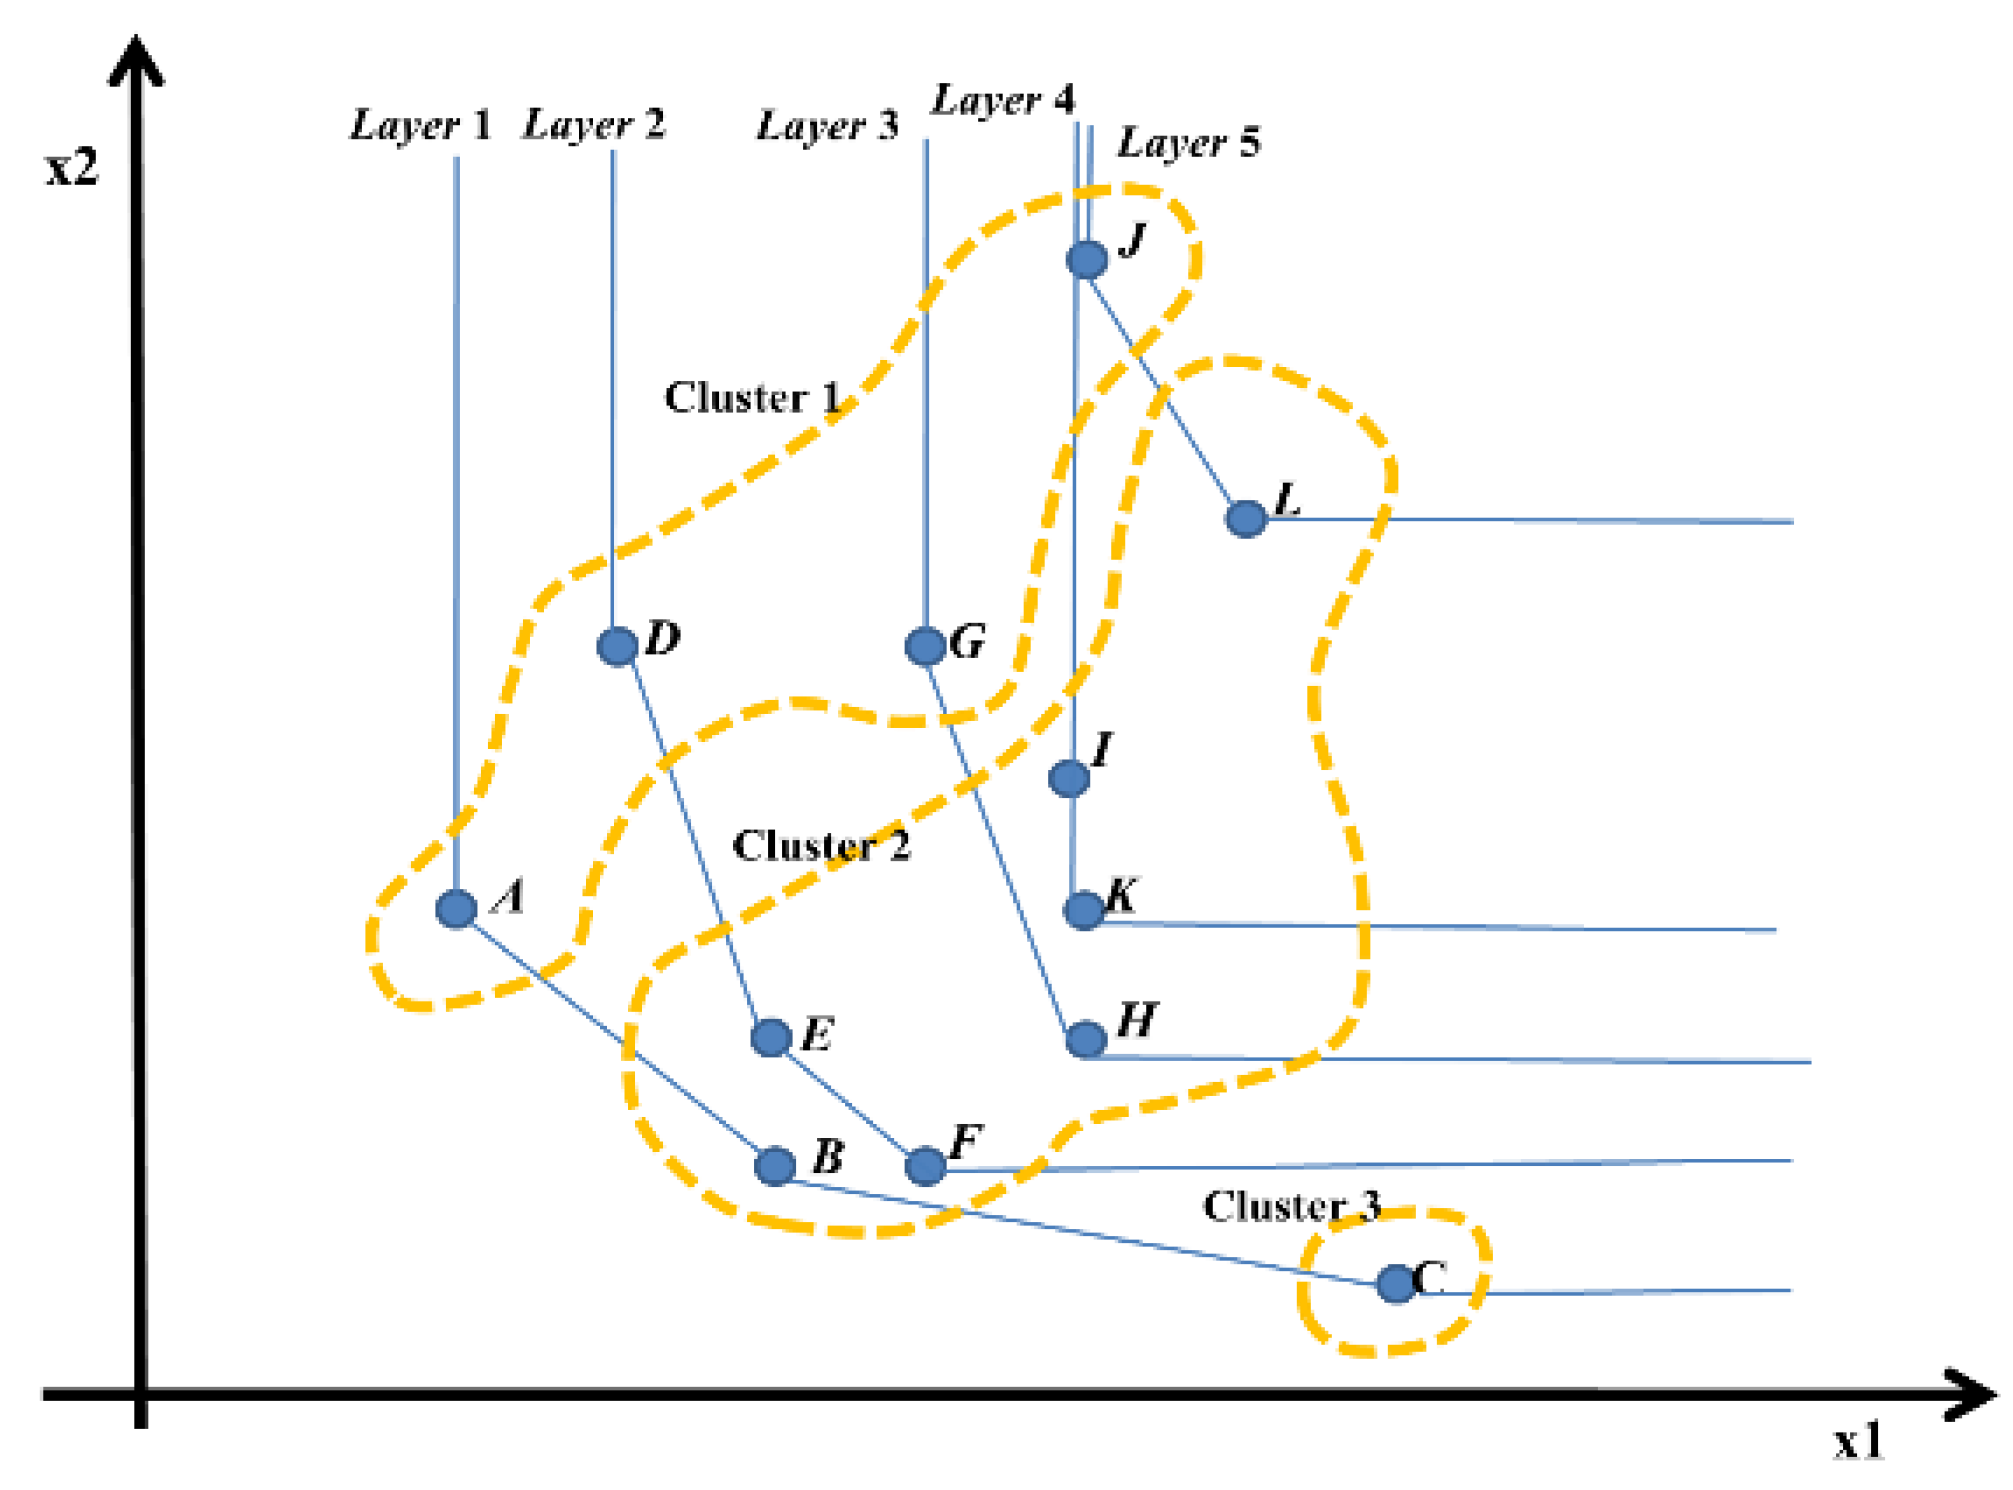
3.1. Stratification of DMUs
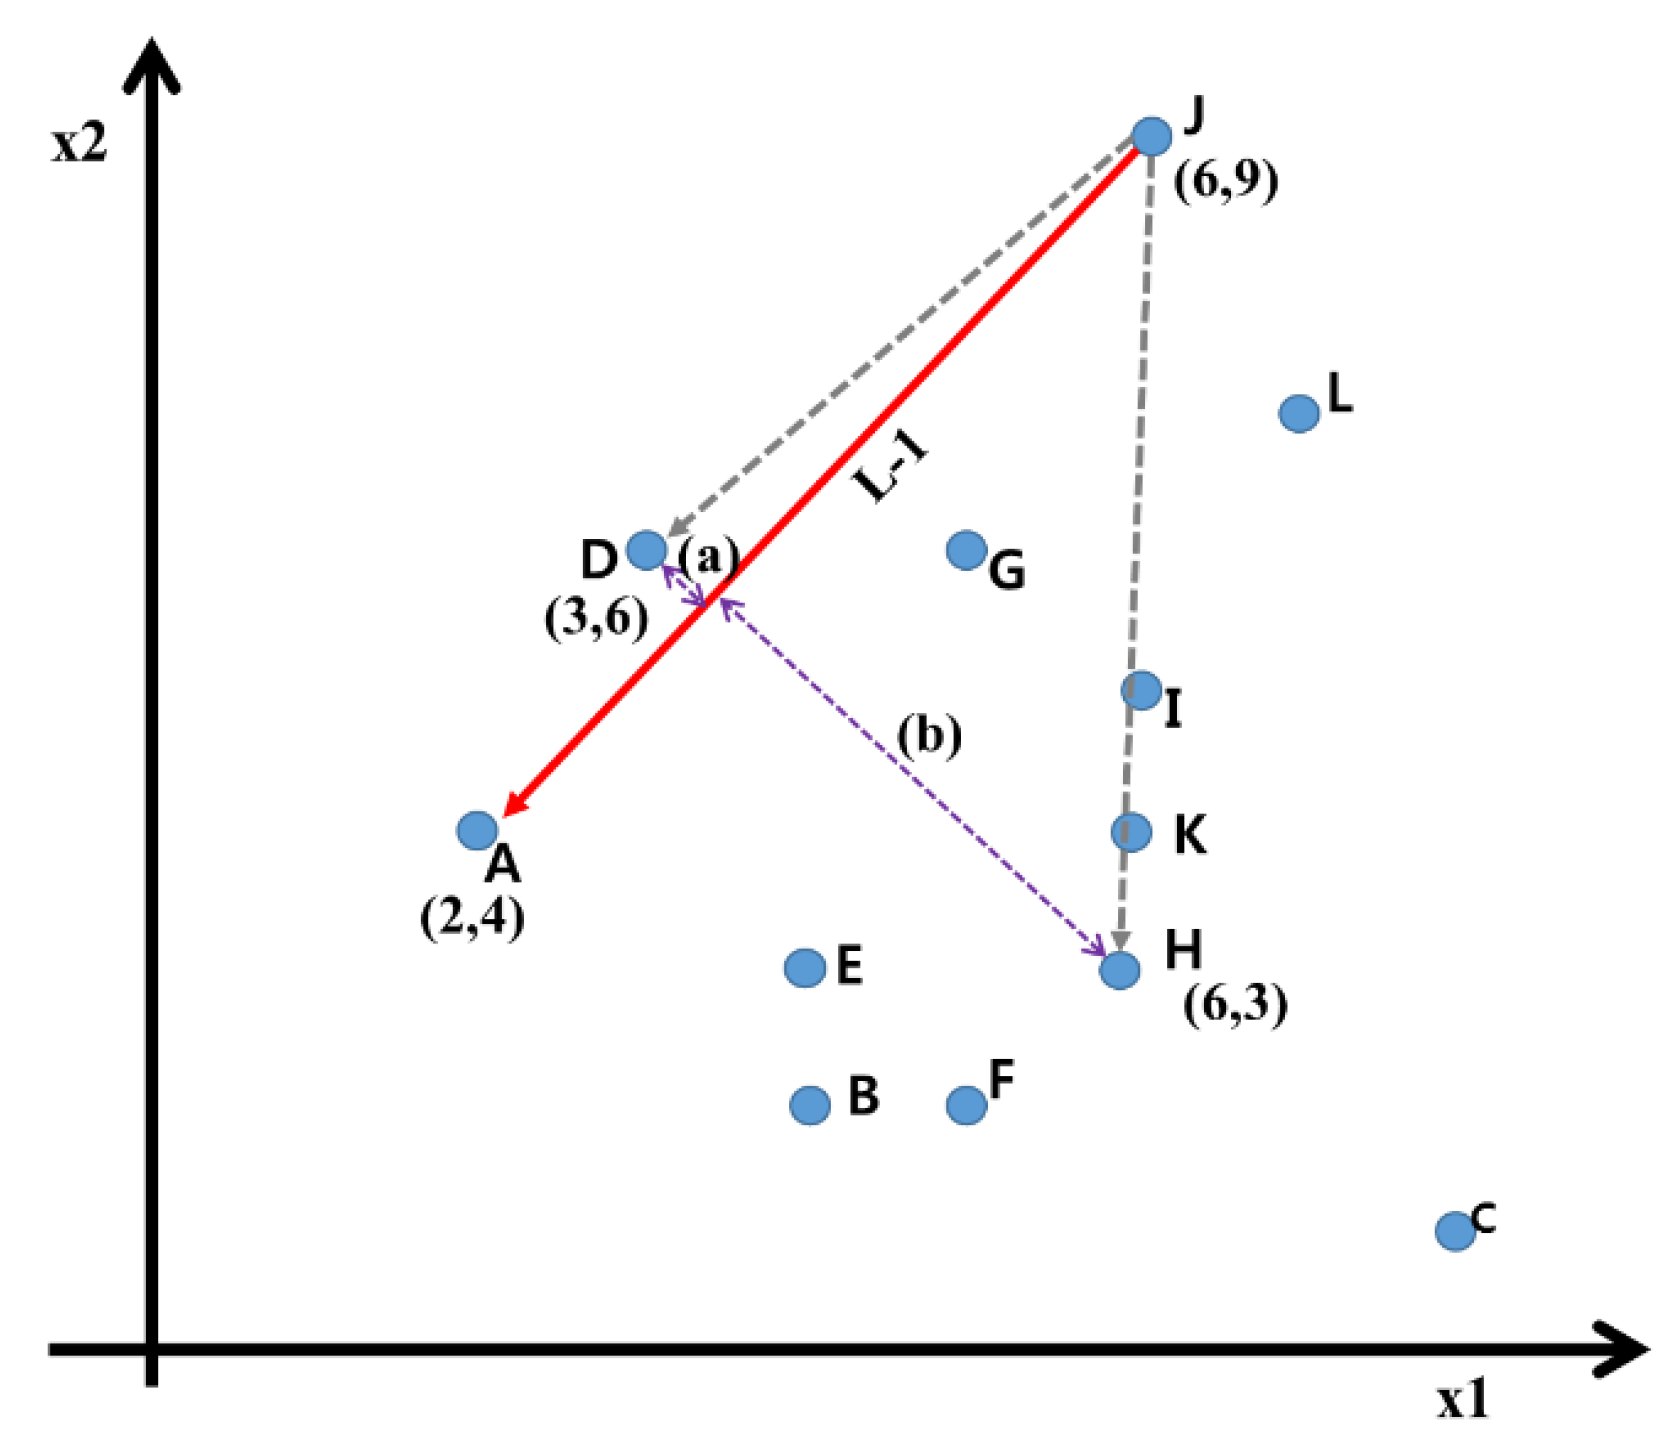
3.2. Classification of DMUs Based on Similarity of Benchmarking Direction
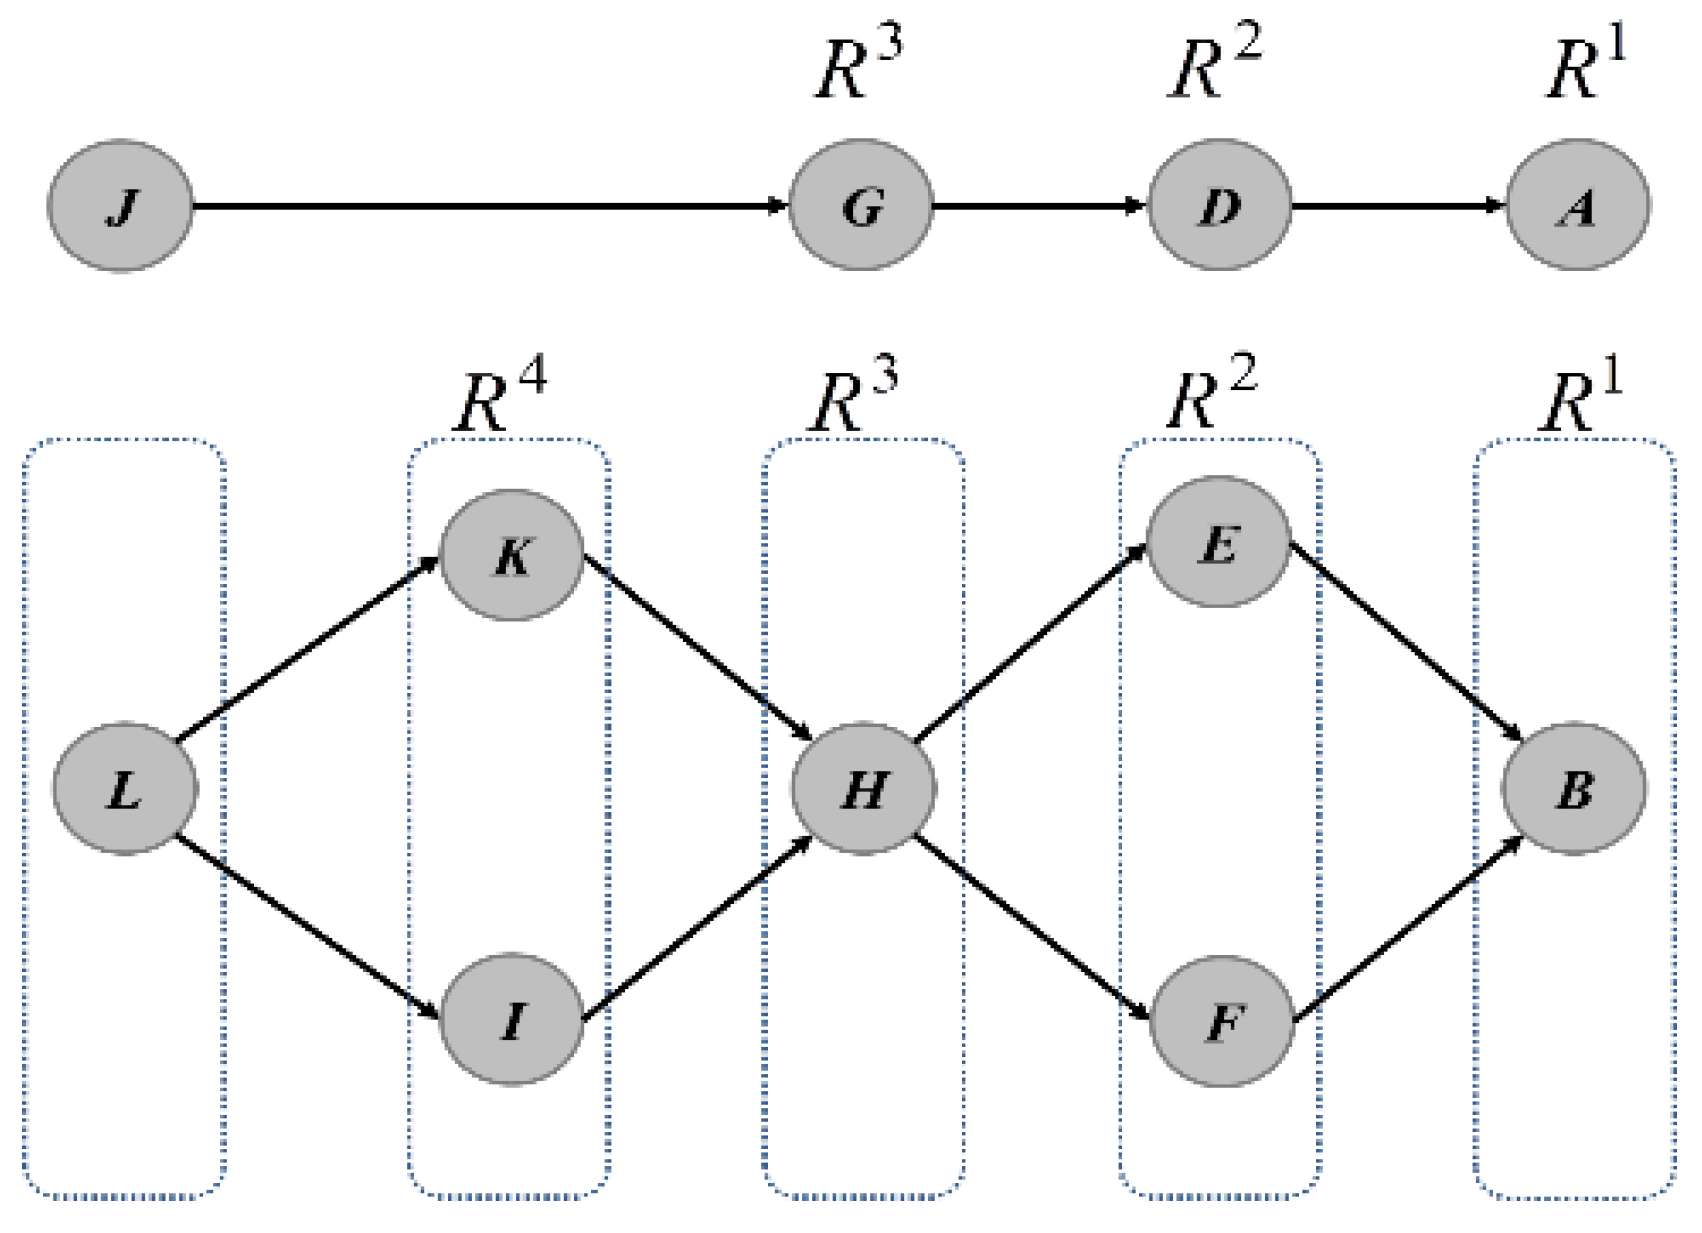
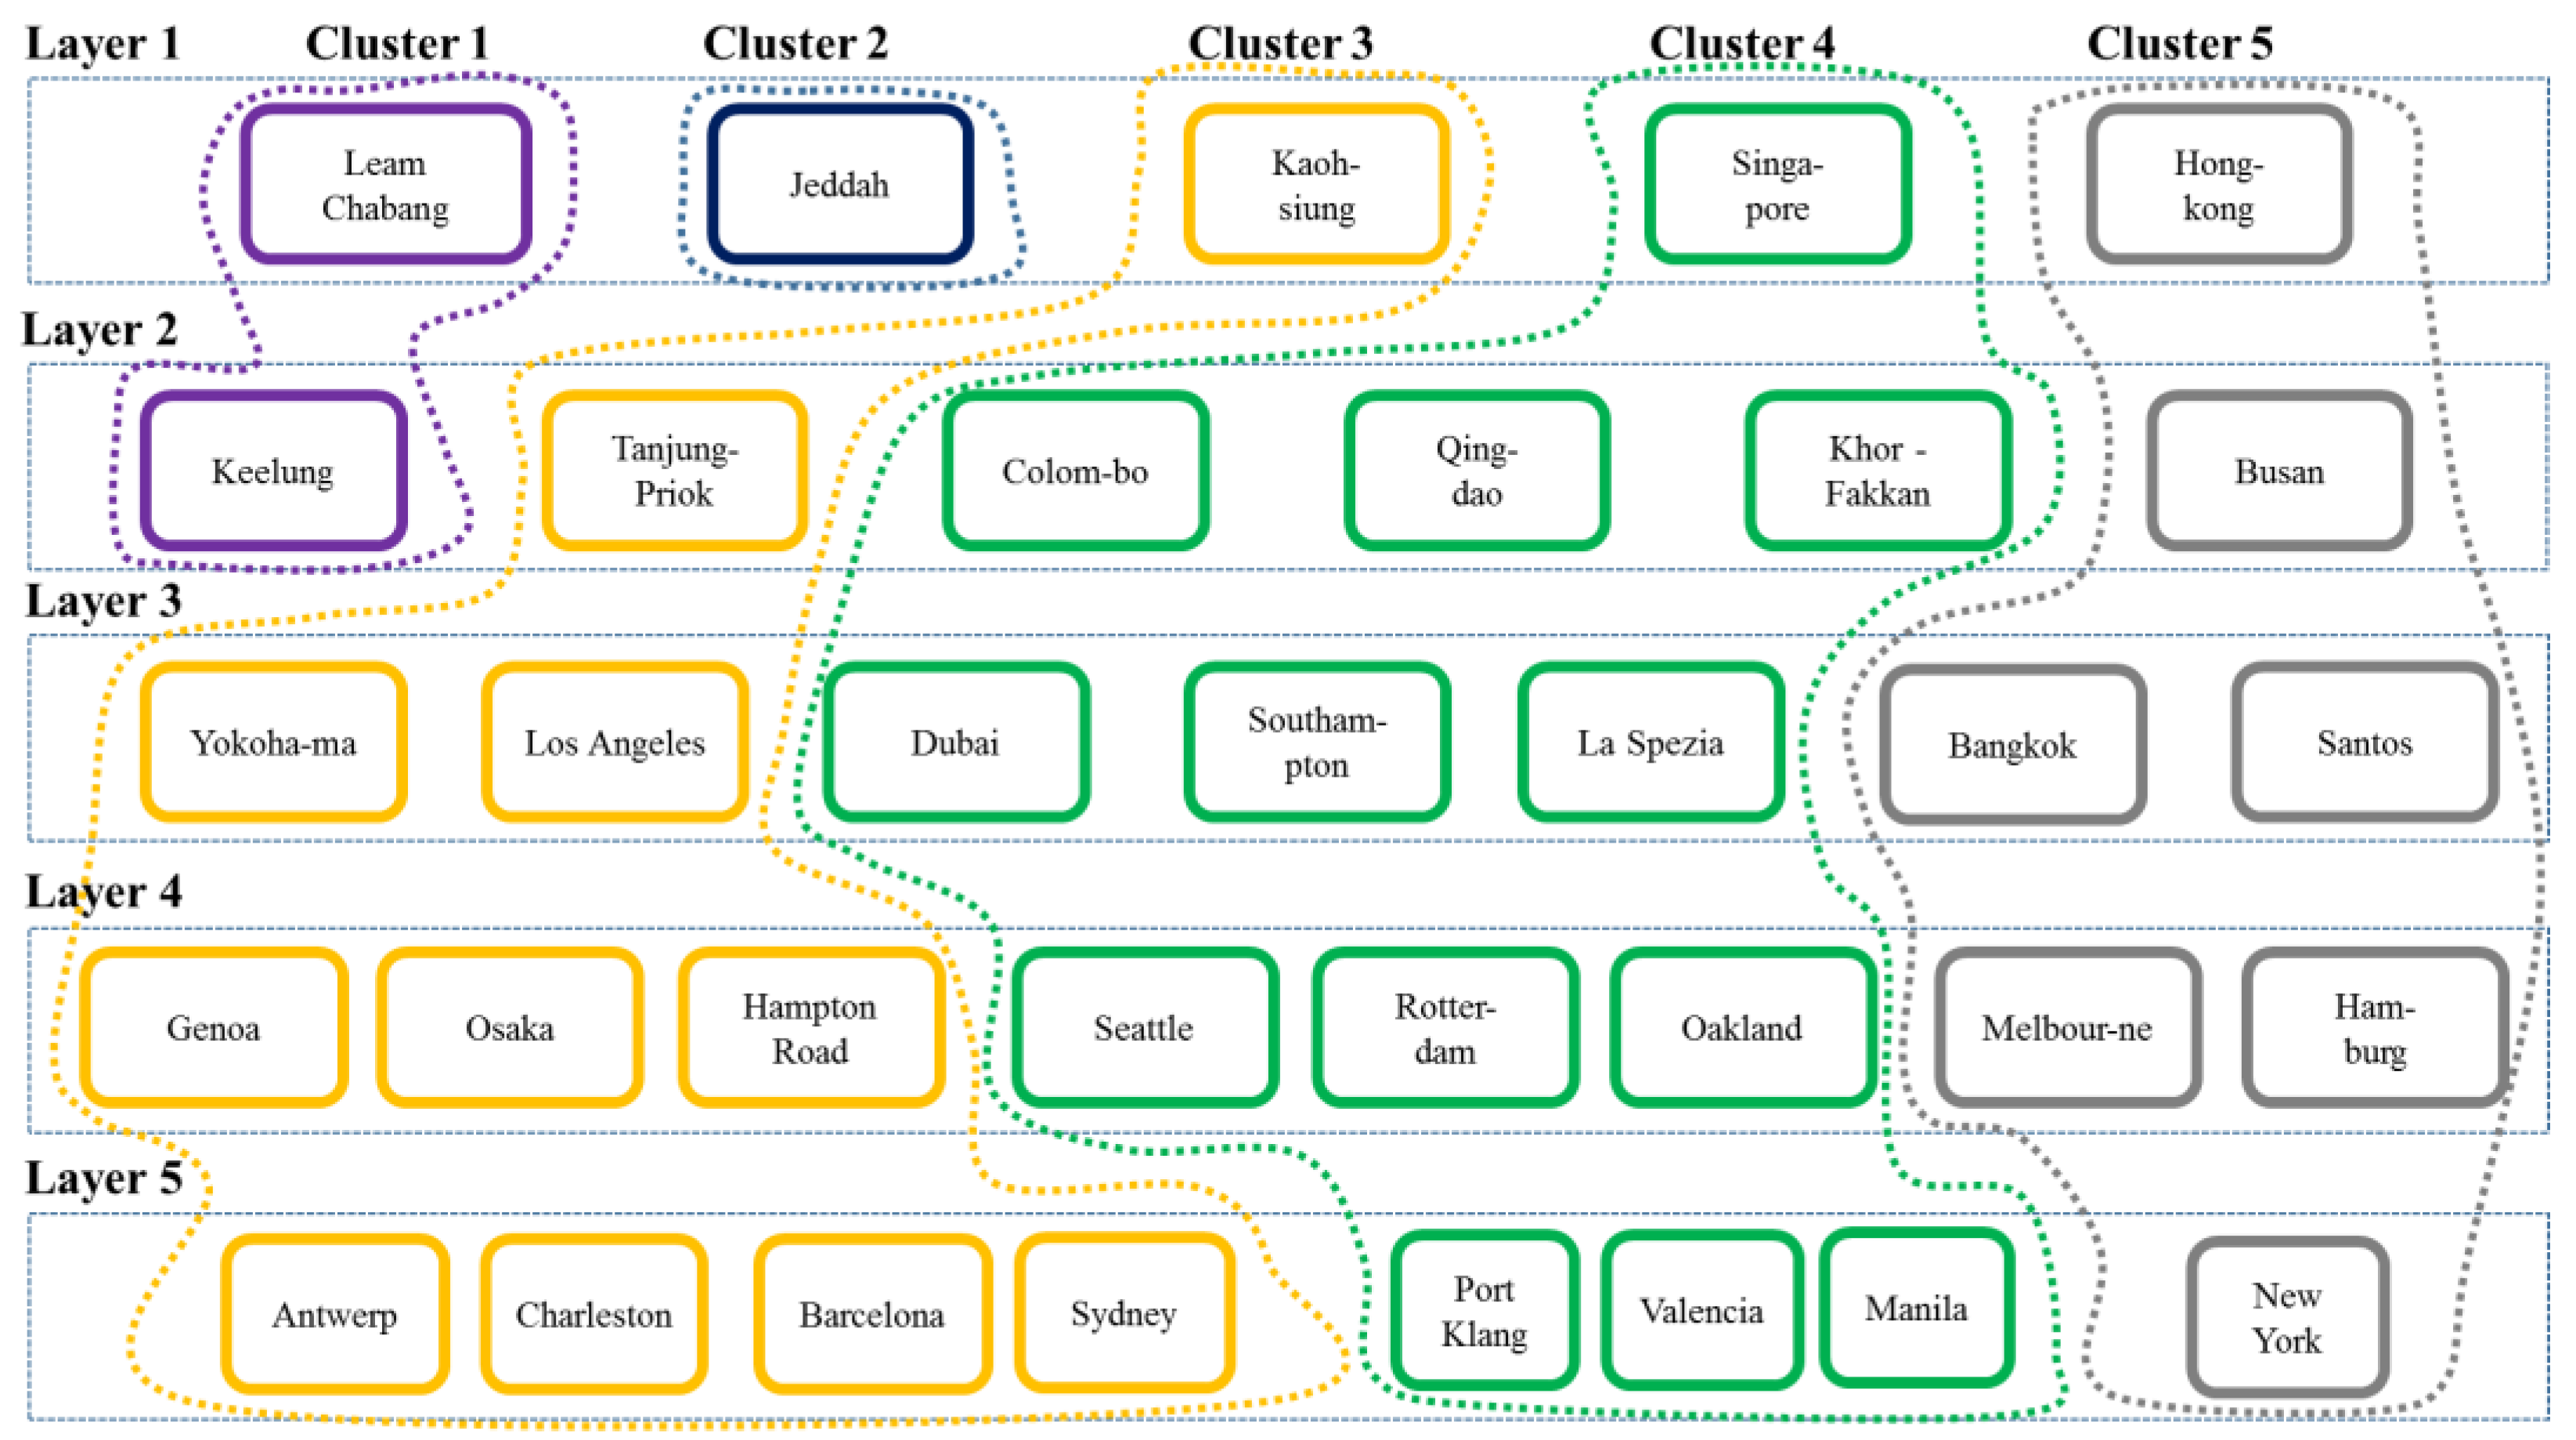
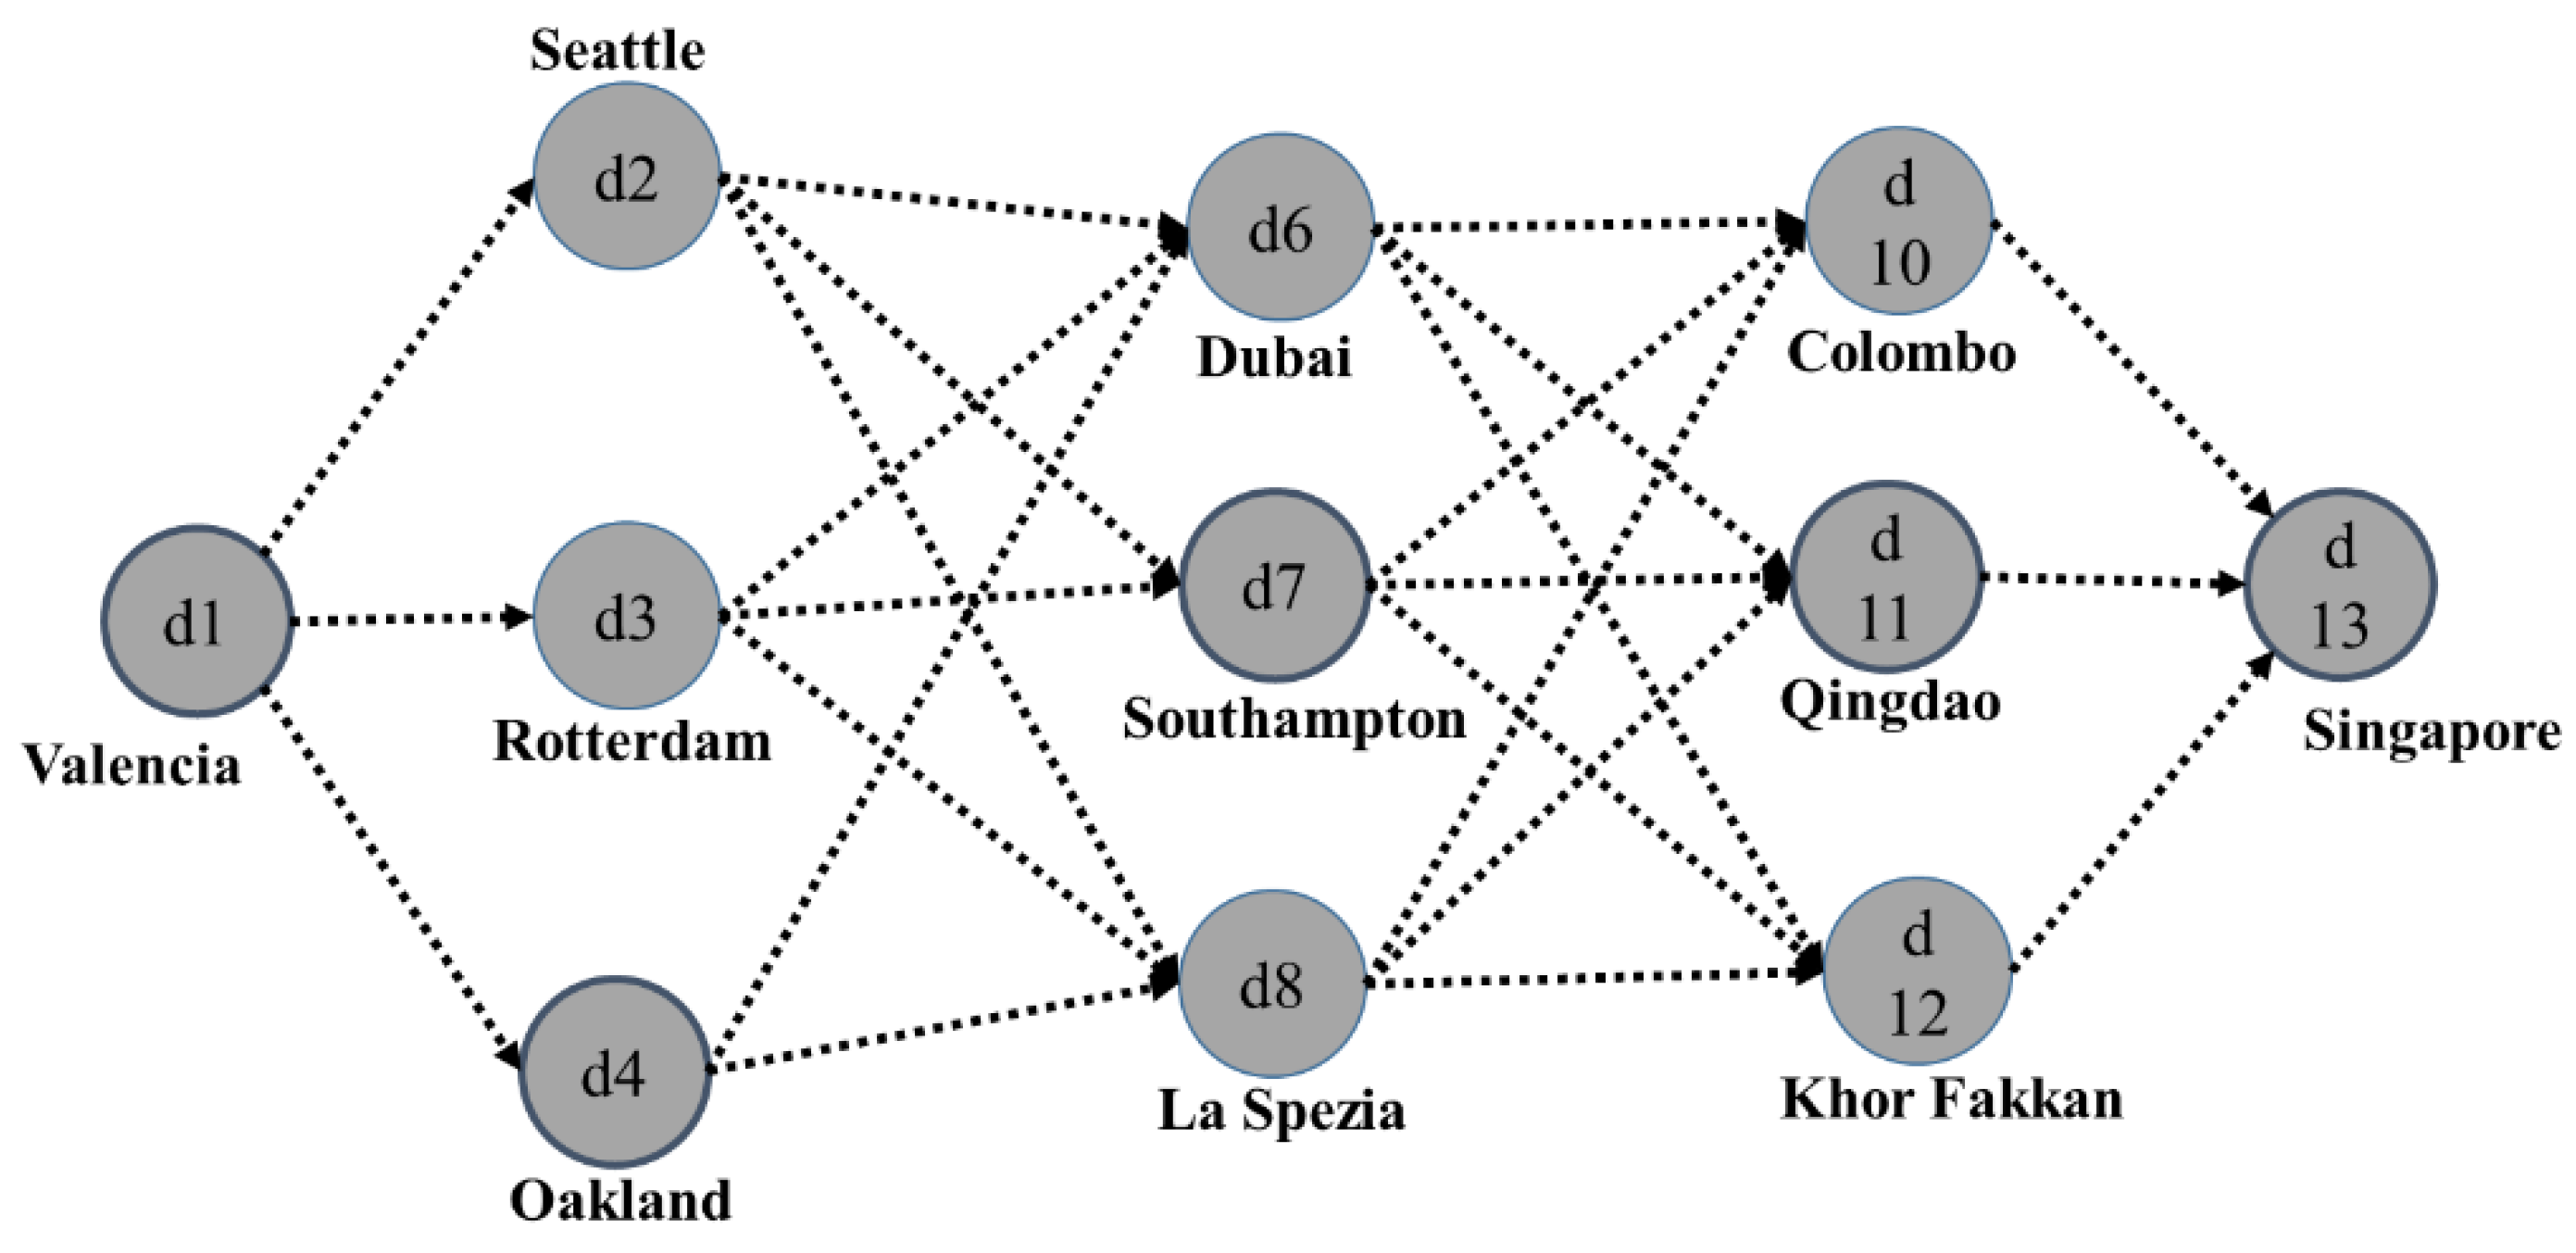
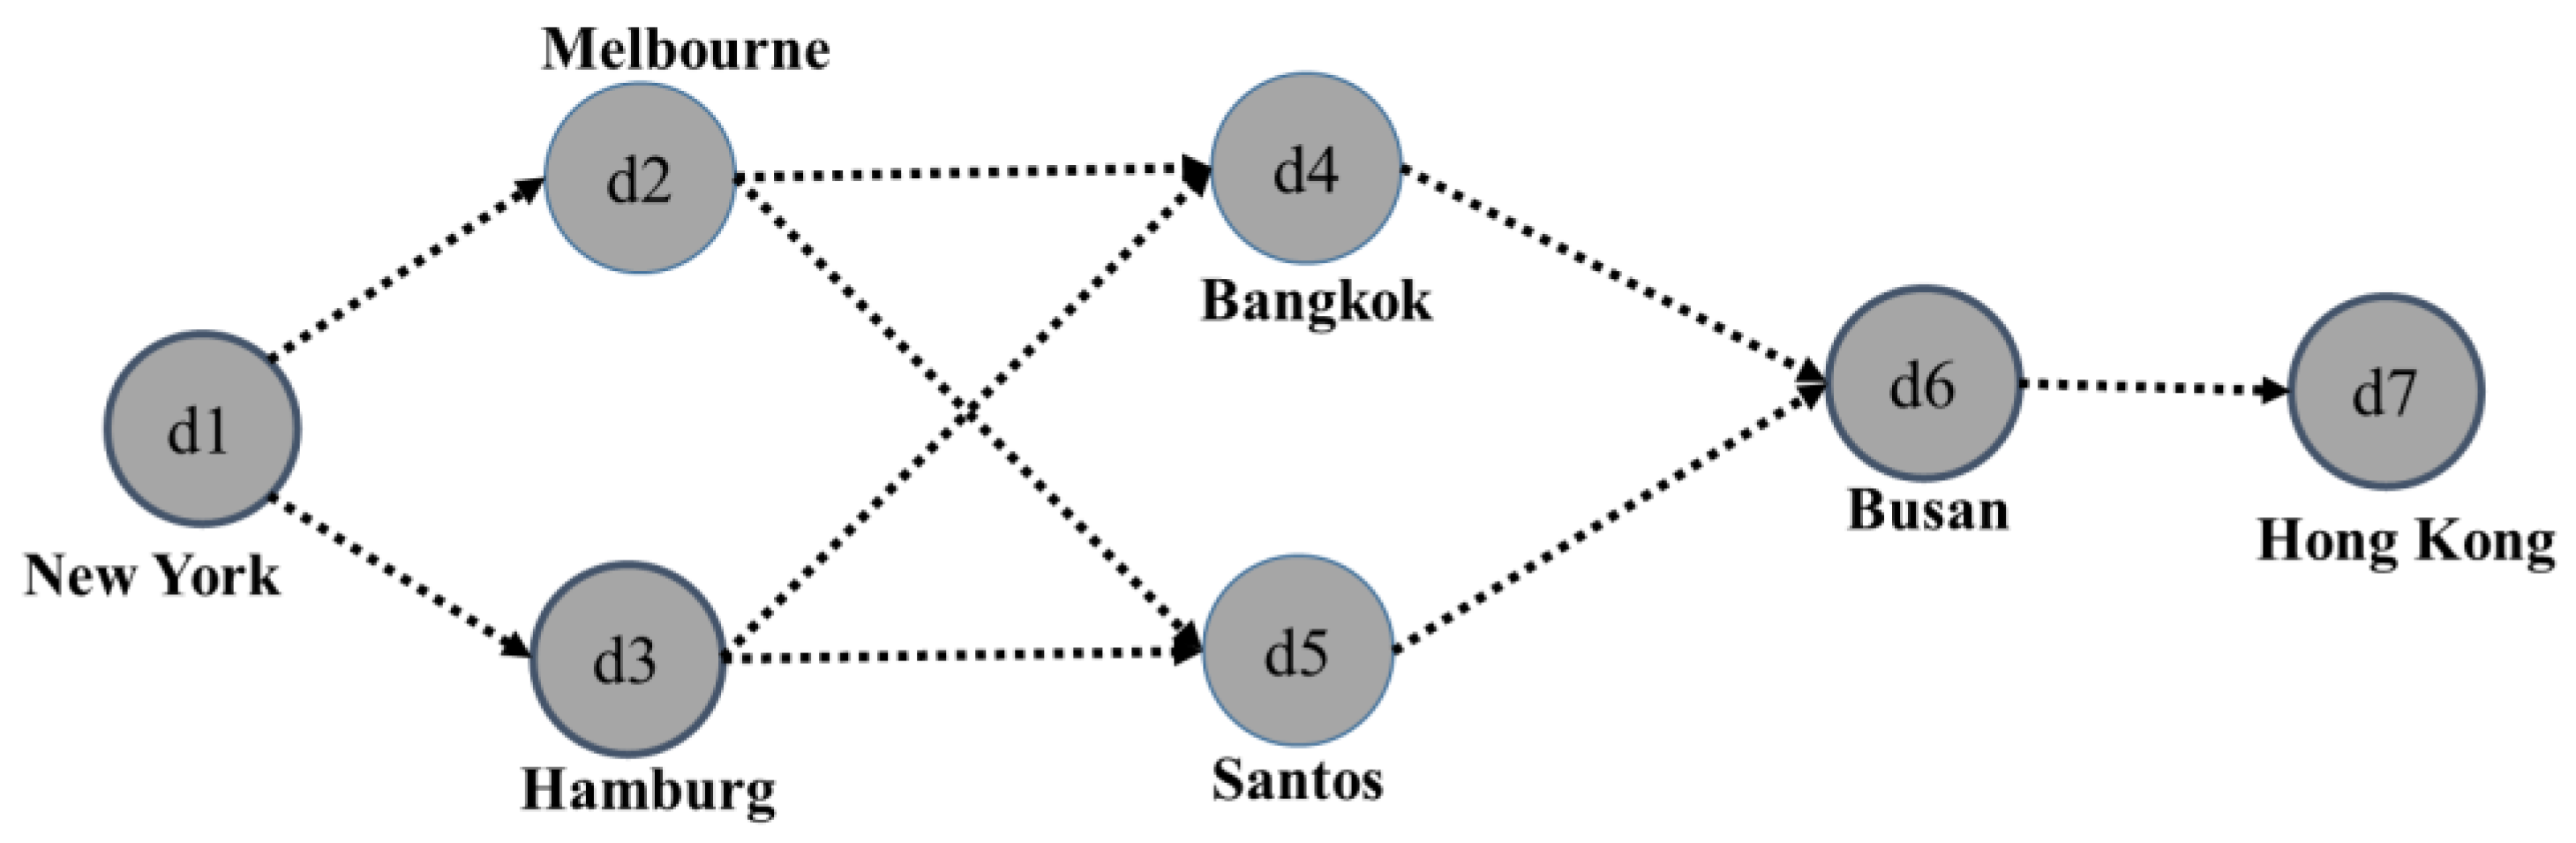
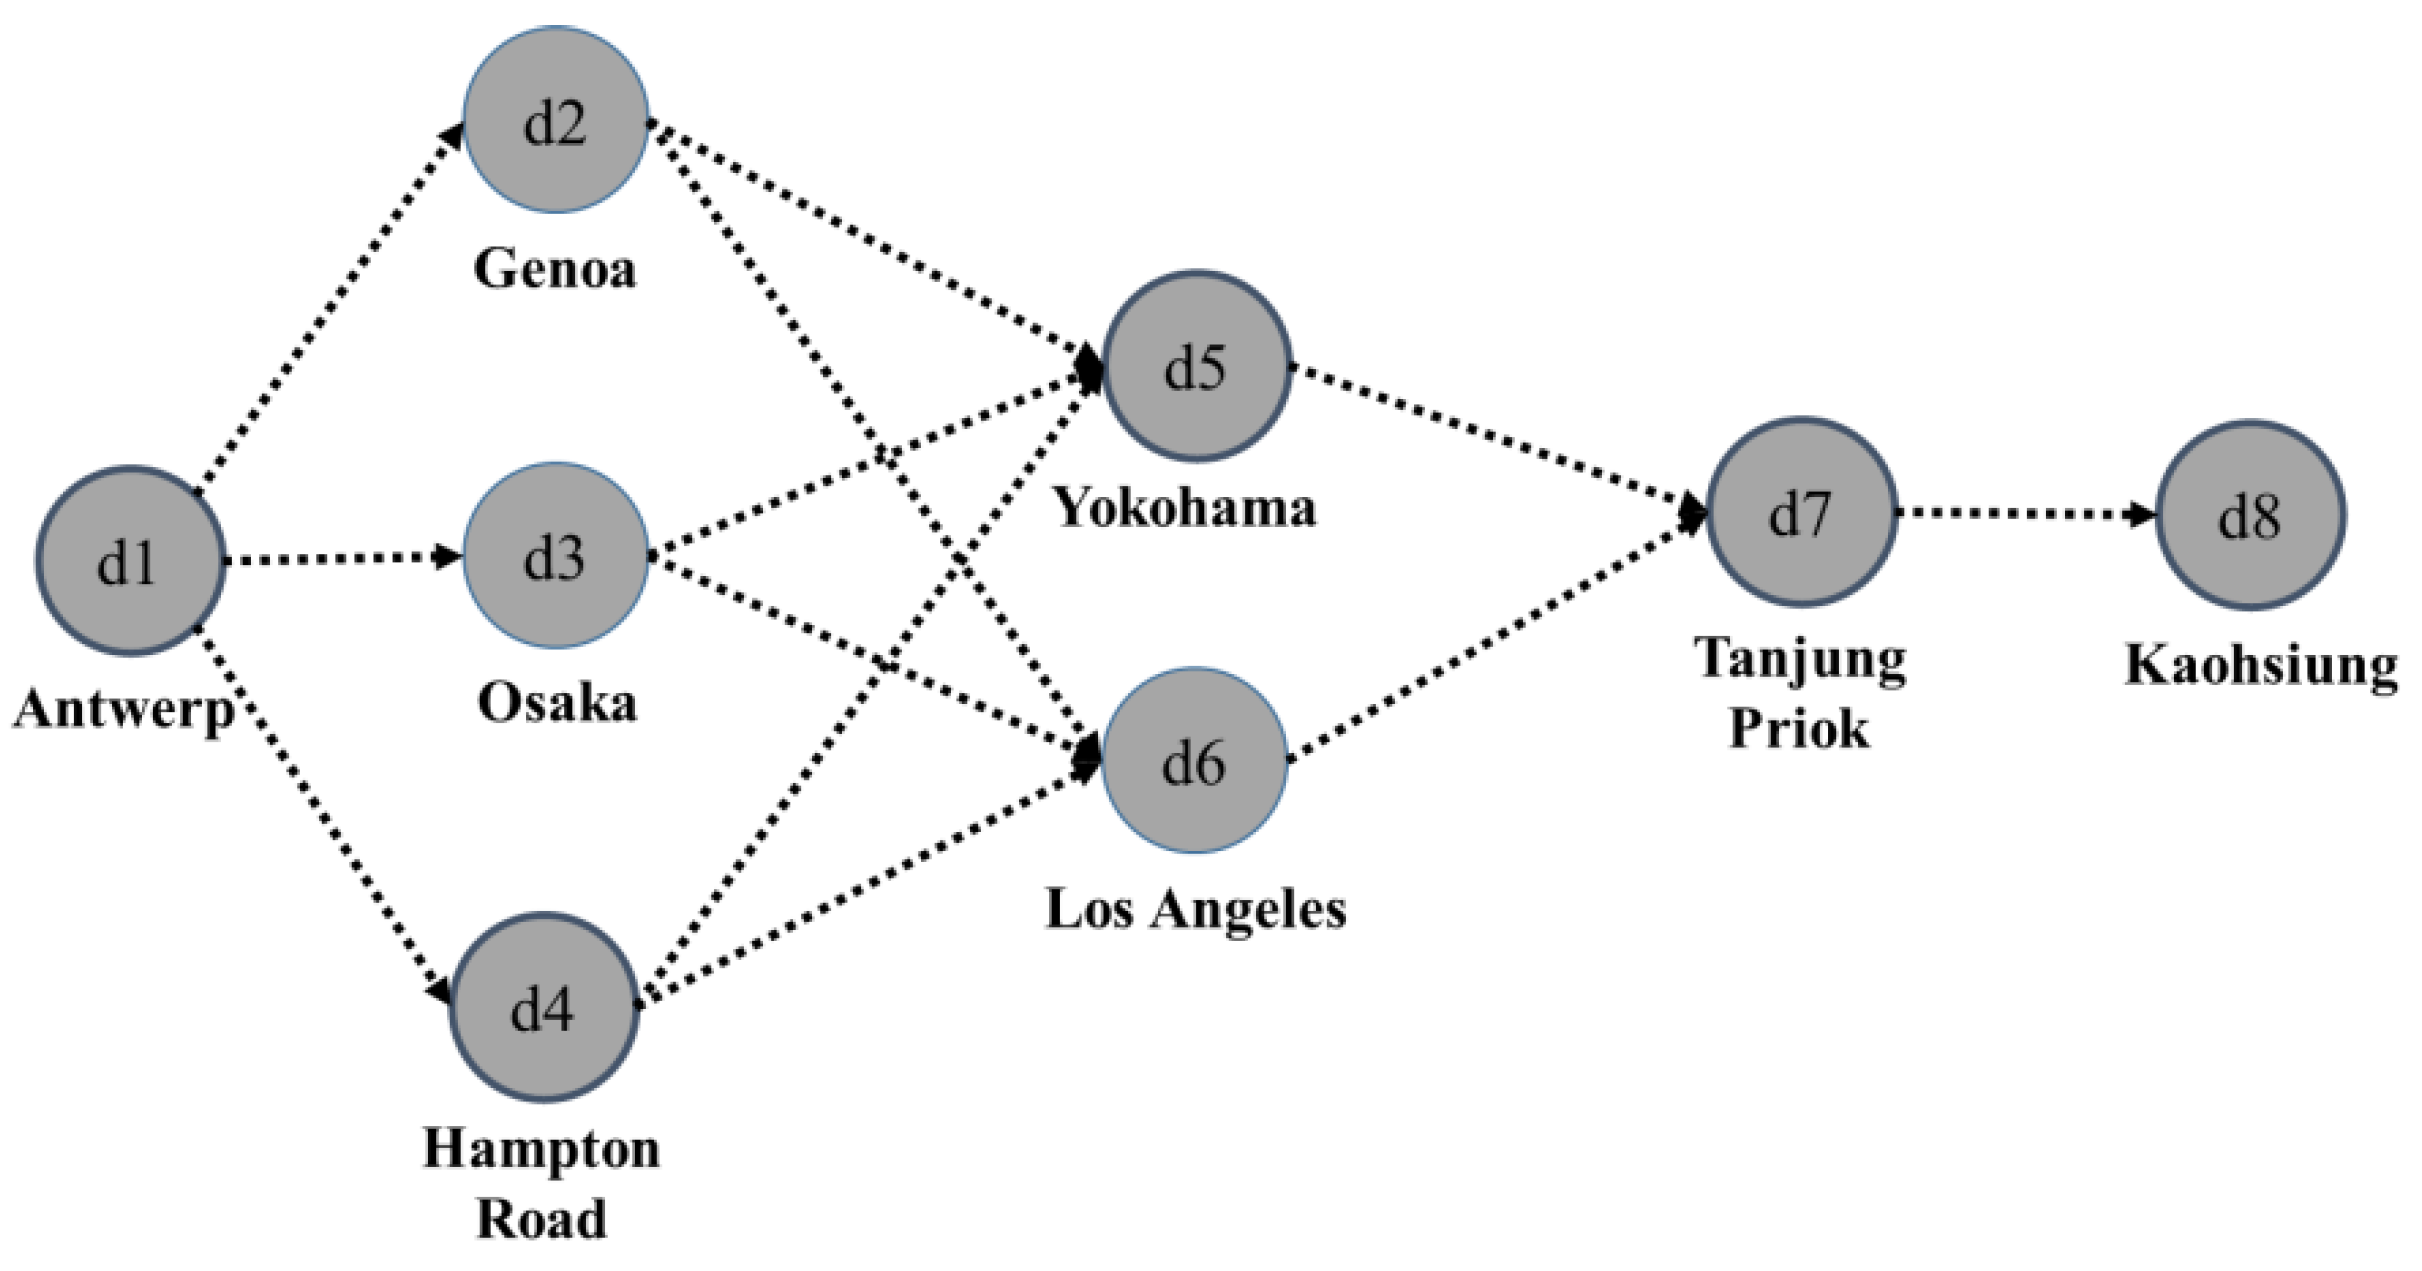
3.3. Benchmarking Network Construction
4. Application
5. Concluding Remarks
Author Contributions
Conflicts of Interest
Abbreviations
| DEA | data envelopment analysis |
| DMUs | decision-making units |
| IBTs | intermediate benchmark targets |
| UBT | ultimate benchmark target |
Appendix A

| Store | x1 | x2 | y | Efficiency | |||
|---|---|---|---|---|---|---|---|
| CRS | VRS | SE | Returns to Scale | ||||
| A | 2 | 4 | 1 | 1.00 | 1.00 | 1.00 | CRS |
| B | 4 | 2 | 1 | 1.00 | 1.00 | 1.00 | CRS |
| C | 8 | 1 | 1 | 1.00 | 1.00 | 1.00 | CRS |
| D | 3 | 6 | 1 | 0.66 | 0.66 | 1.00 | CRS |
| E | 4 | 3 | 1 | 0.85 | 0.85 | 1.00 | CRS |
| F | 5 | 2 | 1 | 0.92 | 0.92 | 1.00 | CRS |
| G | 5 | 6 | 1 | 0.54 | 0.54 | 1.00 | CRS |
| H | 6 | 3 | 1 | 0.66 | 0.66 | 1.00 | CRS |
| I | 6 | 5 | 1 | 0.54 | 0.54 | 1.00 | CRS |
| J | 6 | 9 | 1 | 0.40 | 0.40 | 1.00 | CRS |
| K | 6 | 4 | 1 | 0.60 | 0.60 | 1.00 | CRS |
| L | 7 | 7 | 1 | 0.42 | 0.42 | 1.00 | CRS |
References
- Ammons, D.N. Benchmarking as a performance management tool: Experiences among municipalities in North Carolina. J. Public Budg. Account. Financ. Manag. 2000, 12, 106–124. [Google Scholar]
- Grupp, H. Technometrics as a missing link in science and technology indicators. In Measuring the Dynamics of Technological Change; Pinter Pub Ltd: London, UK, 1990; pp. 57–76. [Google Scholar]
- Tata, J.; Prasad, S.; Motwani, J. Benchmarking quality management practices: US versus Costa Rica. Multinatl. Bus. Rev. 2000, 8, 37. [Google Scholar]
- Donthu, N.; Hershberger, E.K.; Osmonbekov, T. Benchmarking marketing productivity using data envelopment analysis. J. Bus. Res. 2005, 58, 1474–1482. [Google Scholar] [CrossRef]
- Ross, A.; Droge, C. An integrated benchmarking approach to distribution center performance using DEA modeling. J. Op. Manag. 2002, 20, 19–32. [Google Scholar] [CrossRef]
- Talluri, S. A benchmarking method for business-process reengineering and improvement. Int. J. Flex. Manuf. Syst. 2000, 12, 291–304. [Google Scholar] [CrossRef]
- Alirezaee, M.; Afsharian, M. Model improvement for computational difficulties of DEA technique in the presence of special DMUs. Appl. Math. Comput. 2007, 186, 1600–1611. [Google Scholar] [CrossRef]
- Estrada, S.A.; Song, H.S.; Kim, Y.A.; Namn, S.H.; Kang, S.C. A method of stepwise benchmarking for inefficient DMUs based on the proximity-based target selection. Expert Syst. Appl. 2009, 36, 11595–11604. [Google Scholar] [CrossRef]
- Suzuki, S.; Nijkamp, P. A stepwise-projection data envelopment analysis for public transport operations in Japan. Lett. Spat. Resour.Sci. 2011, 4, 139–156. [Google Scholar] [CrossRef]
- Sharma, M.J.; Yu, S.J. Benchmark optimization and attribute identification for improvement of container terminals. Eur. J. Op. Res. 2010, 201, 568–580. [Google Scholar] [CrossRef]
- Sharma, M.J.; Yu, S.J. Performance based stratification and clustering for benchmarking of container terminals. Expert Syst. Appl. 2009, 36, 5016–5022. [Google Scholar] [CrossRef]
- Lim, S.; Bae, H.; Lee, L.H. A study on the selection of benchmarking paths in DEA. Expert Syst. Appl. 2011, 38, 7665–7673. [Google Scholar] [CrossRef]
- Park, J.; Bae, H.; Lim, S. A DEA-based method of stepwise benchmark target selection with preference, direction and similarity criteria. Int. J. Innov. Comput. Inf. Control 2012, 8, 5821–5834. [Google Scholar]
- Park, J.; Lim, S.; Bae, H. DEA-based port efficiency improvement and stepwise benchmarking target selection. Inf. Int. Interdiscip. J. 2012, 15, 6155–6172. [Google Scholar]
- Golany, B.; Thore, S. Restricted best practice selection in DEA: An overview with a case study evaluating the socio-economic performance of nations. Ann. Op. Res. 1997, 73, 117–140. [Google Scholar] [CrossRef]
- Lozano, S.; Villa, G. Determining a sequence of targets in DEA. J. Op. Res. Soc. 2005, 56, 1439–1447. [Google Scholar] [CrossRef]
- Lozano, S.; Villa, G. Gradual technical and scale efficiency improvement in DEA. Ann. Op. Res. 2010, 173, 123–136. [Google Scholar] [CrossRef]
- Khodakarami, M.; Shabani, A.; Saen, R.F. A new look at measuring sustainability of industrial parks: A two-stage data envelopment analysis approach. Clean Technol. Environ. Policy 2014, 16, 1577–1596. [Google Scholar] [CrossRef]
- Cooper, W.W.; Seiford, L.M.; Tone, K. Introduction to Data Envelopment Analysis and Its Uses: With DEA-Solver Software and References; Springer Science & Business Media: Berlin, Germany, 2006. [Google Scholar]
- Seiford, L.M.; Zhu, J. Context-dependent data envelopment analysis—Measuring attractiveness and progress. Omega 2003, 31, 397–408. [Google Scholar] [CrossRef]
- Sexton, T.R.; Silkman, R.H.; Hogan, A.J. Data envelopment analysis: Critique and extensions. New Dir. Progr. Eval. 1986, 1986, 73–105. [Google Scholar] [CrossRef]
- MacQueen, J. Some Methods for Classification and Analysis of Multivariate Observations; University of California Press: Berkeley, CA, USA, 1967; pp. 281–297. [Google Scholar]
- Doyle, J.; Green, R. Efficiency and Cross-Efficiency in DEA: Derivations, Meanings and Uses. J. Op. Res. Soc. 1994, 45, 567–578. [Google Scholar] [CrossRef]
- Liang, L.; Wu, J.; Cook, W.D.; Zhu, J. The DEA game cross-efficiency model and its Nash equilibrium. Op. Res. 2008, 56, 1278–1288. [Google Scholar] [CrossRef]
- Cook, W.; Zhu, J. DEA Cobb-Douglas frontier and cross-efficiency. J. Op. Res. Soc. 2013, 65, 265–268. [Google Scholar] [CrossRef]
- Containerization International. Available online: https://www.lloydslist.com (accessed on 24 June 2016).
- Microsoft Lingo 10. Available online: http://lingo.software.informer.com (accessed on 24 June 2016).
- DEAFrontier. Available online: http://www.deafrontier.net (accessed on 24 June 2016).
- Vis, I.F.A.; de Koster, R. Transshipment of containers at a container terminal: An overview. Eur. J. Op. Res. 2003, 147, 1–16. [Google Scholar] [CrossRef]

| Store | A | B | C | D | E | F | G | H | I | J | K | L |
|---|---|---|---|---|---|---|---|---|---|---|---|---|
| x1 | 2 | 4 | 8 | 3 | 4 | 5 | 5 | 6 | 6 | 6 | 6 | 7 |
| x2 | 4 | 2 | 1 | 6 | 3 | 2 | 6 | 3 | 5 | 9 | 4 | 7 |
| y | 1 | 1 | 1 | 1 | 1 | 1 | 1 | 1 | 1 | 1 | 1 | 1 |
| Target DMUs | |||||||||||||
|---|---|---|---|---|---|---|---|---|---|---|---|---|---|
| A | B | C | D | E | F | G | H | I | J | K | L | ||
| Competitor DMUs | A | 1.000 | 0.500 | 0.250 | 0.667 | 0.500 | 0.400 | 0.400 | 0.333 | 0.286 | 0.333 | 0.333 | 0.286 |
| B | 0.500 | 1.000 | 0.500 | 0.333 | 0.667 | 0.800 | 0.333 | 0.667 | 0.571 | 0.222 | 0.500 | 0.286 | |
| C | 0.250 | 0.500 | 1.000 | 0.167 | 0.333 | 0.500 | 0.167 | 0.333 | 0.333 | 0.111 | 0.250 | 0.143 | |
| D | 1.000 | 0.500 | 0.250 | 0.667 | 0.500 | 0.400 | 0.400 | 0.334 | 0.286 | 0.334 | 0.334 | 0.286 | |
| E | 0.643 | 0.857 | 0.429 | 0.429 | 0.857 | 0.686 | 0.429 | 0.571 | 0.490 | 0.286 | 0.571 | 0.367 | |
| F | 0.462 | 0.923 | 0.577 | 0.308 | 0.615 | 0.923 | 0.308 | 0.615 | 0.615 | 0.205 | 0.462 | 0.264 | |
| G | 0.818 | 0.681 | 0.341 | 0.545 | 0.681 | 0.545 | 0.545 | 0.454 | 0.389 | 0.363 | 0.454 | 0.389 | |
| H | 0.500 | 1.000 | 0.500 | 0.334 | 0.667 | 0.800 | 0.334 | 0.667 | 0.572 | 0.222 | 0.500 | 0.286 | |
| I | 0.474 | 0.948 | 0.553 | 0.316 | 0.632 | 0.885 | 0.316 | 0.632 | 0.632 | 0.211 | 0.474 | 0.271 | |
| J | 0.900 | 0.600 | 0.300 | 0.600 | 0.600 | 0.480 | 0.480 | 0.400 | 0.343 | 0.400 | 0.400 | 0.343 | |
| K | 0.600 | 0.900 | 0.450 | 0.400 | 0.800 | 0.720 | 0.400 | 0.600 | 0.514 | 0.267 | 0.600 | 0.343 | |
| L | 0.751 | 0.751 | 0.375 | 0.501 | 0.751 | 0.601 | 0.501 | 0.501 | 0.429 | 0.334 | 0.501 | 0.429 | |
| A | B | C | D | E | F | G | H | I | J | K | |
|---|---|---|---|---|---|---|---|---|---|---|---|
| B | 0.058 | ||||||||||
| C | −0.245 | 0.473 | |||||||||
| D | 1.000 | 0.057 | −0.246 | ||||||||
| E | 0.341 | 0.870 | 0.239 | 0.340 | |||||||
| F | −0.027 | 0.968 | 0.584 | −0.027 | 0.781 | ||||||
| G | 0.854 | 0.429 | −0.140 | 0.854 | 0.725 | 0.312 | |||||
| H | 0.058 | 1.000 | 0.473 | 0.057 | 0.870 | 0.968 | 0.429 | ||||
| I | −0.010 | 0.982 | 0.551 | −0.010 | 0.806 | 0.997 | 0.338 | 0.982 | |||
| J | 0.972 | 0.205 | −0.234 | 0.972 | 0.508 | 0.100 | 0.946 | 0.205 | 0.122 | ||
| K | 0.237 | 0.937 | 0.320 | 0.236 | 0.984 | 0.863 | 0.629 | 0.937 | 0.885 | 0.401 | |
| L | 0.671 | 0.655 | 0.003 | 0.671 | 0.903 | 0.539 | 0.944 | 0.655 | 0.567 | 0.805 | 0.834 |
| Resource | Min. | Max. | Avg. | Std. Dev. | |
|---|---|---|---|---|---|
| Inputs | Berth length | 181 | 15,585 | 4054 | 3210 |
| Total area | 105,000 | 7,156,000 | 1,697,593 | 1,524,231 | |
| CFS area | 5000 | 1,535,000 | 161,850 | 288,312 | |
| Loading machine | 8 | 1955 | 363 | 369 | |
| Outputs | Unloading TEU | 46,393 | 7,180,397 | 1,280,869 | 1,639,527 |
| Loading TEU | 44,537 | 7,386,658 | 1,290,066 | 1,650,742 | |
| Port No. | Port Name | θ | Reference set | Port No. | Port Name | θ | Reference set |
|---|---|---|---|---|---|---|---|
| 1 | Hong Kong | 1.000 | - | 18 | Colombo | 0.924 | 1, 2, 26 |
| 2 | Singapore | 1.000 | - | 19 | Bangkok | 0.303 | 1, 26 |
| 3 | Kaohsiung | 1.000 | - | 20 | Osaka | 0.281 | 1, 2, 3, 26 |
| 4 | Rotterdam | 0.297 | 1, 2, 26 | 21 | Hampton Roads | 0.339 | 1, 2, 3 |
| 5 | Busan | 0.818 | 1, 31 | 22 | Charleston | 0.281 | 1, 3 |
| 6 | Hamburg | 0.260 | 1, 3 | 23 | Melbourne | 0.217 | 1, 2, 3 |
| 7 | Yokohama | 0.369 | 1, 2, 3, 26 | 24 | La Spezia | 0.389 | 1, 2, 26 |
| 8 | Los Angeles | 0.492 | 2, 26 | 25 | Genoa | 0.310 | 1, 2, 3 |
| 9 | Antwerp | 0.152 | 1, 2, 3 | 26 | Laem Chabang | 1.000 | - |
| 10 | New York | 0.147 | 1, 2 | 27 | Qingdao | 0.670 | 2, 3, 26 |
| 11 | Dubai | 0.421 | 1, 2 | 28 | Southampton | 0.441 | 1, 2, 3 |
| 12 | Keelung | 0.319 | 1, 2, 26 | 29 | Santos | 0.752 | 1, 31 |
| 13 | Manila | 0.183 | 1, 2, 26 | 30 | Barcelona | 0.207 | 1, 2, 3, 26 |
| 14 | Oakland | 0.213 | 1, 2, 3 | 31 | Jeddah | 1.000 | - |
| 15 | Seattle | 0.184 | 1, 2, 26 | 32 | Sydney | 0.055 | 1, 2, 3, 26 |
| 16 | Tanjung Priok | 0.559 | 1, 2 | 33 | Khor Fakkan | 0.510 | 2, 26 |
| 17 | Port Klang | 0.233 | 1, 2, 26 | 34 | Valencia | 0.149 | 1, 2 |
© 2016 by the authors; licensee MDPI, Basel, Switzerland. This article is an open access article distributed under the terms and conditions of the Creative Commons Attribution (CC-BY) license (http://creativecommons.org/licenses/by/4.0/).
Share and Cite
Park, J.; Sung, S.-I. Integrated Approach to Construction of Benchmarking Network in DEA-Based Stepwise Benchmark Target Selection. Sustainability 2016, 8, 600. https://doi.org/10.3390/su8070600
Park J, Sung S-I. Integrated Approach to Construction of Benchmarking Network in DEA-Based Stepwise Benchmark Target Selection. Sustainability. 2016; 8(7):600. https://doi.org/10.3390/su8070600
Chicago/Turabian StylePark, Jaehun, and Si-Il Sung. 2016. "Integrated Approach to Construction of Benchmarking Network in DEA-Based Stepwise Benchmark Target Selection" Sustainability 8, no. 7: 600. https://doi.org/10.3390/su8070600
APA StylePark, J., & Sung, S.-I. (2016). Integrated Approach to Construction of Benchmarking Network in DEA-Based Stepwise Benchmark Target Selection. Sustainability, 8(7), 600. https://doi.org/10.3390/su8070600