
Sustainable Assessment of Aerosol Pollution Decrease Applying Multiple Attribute Decision-Making Methods

 ,
,  ,
,  ,
,
Abstract
:1. Introduction
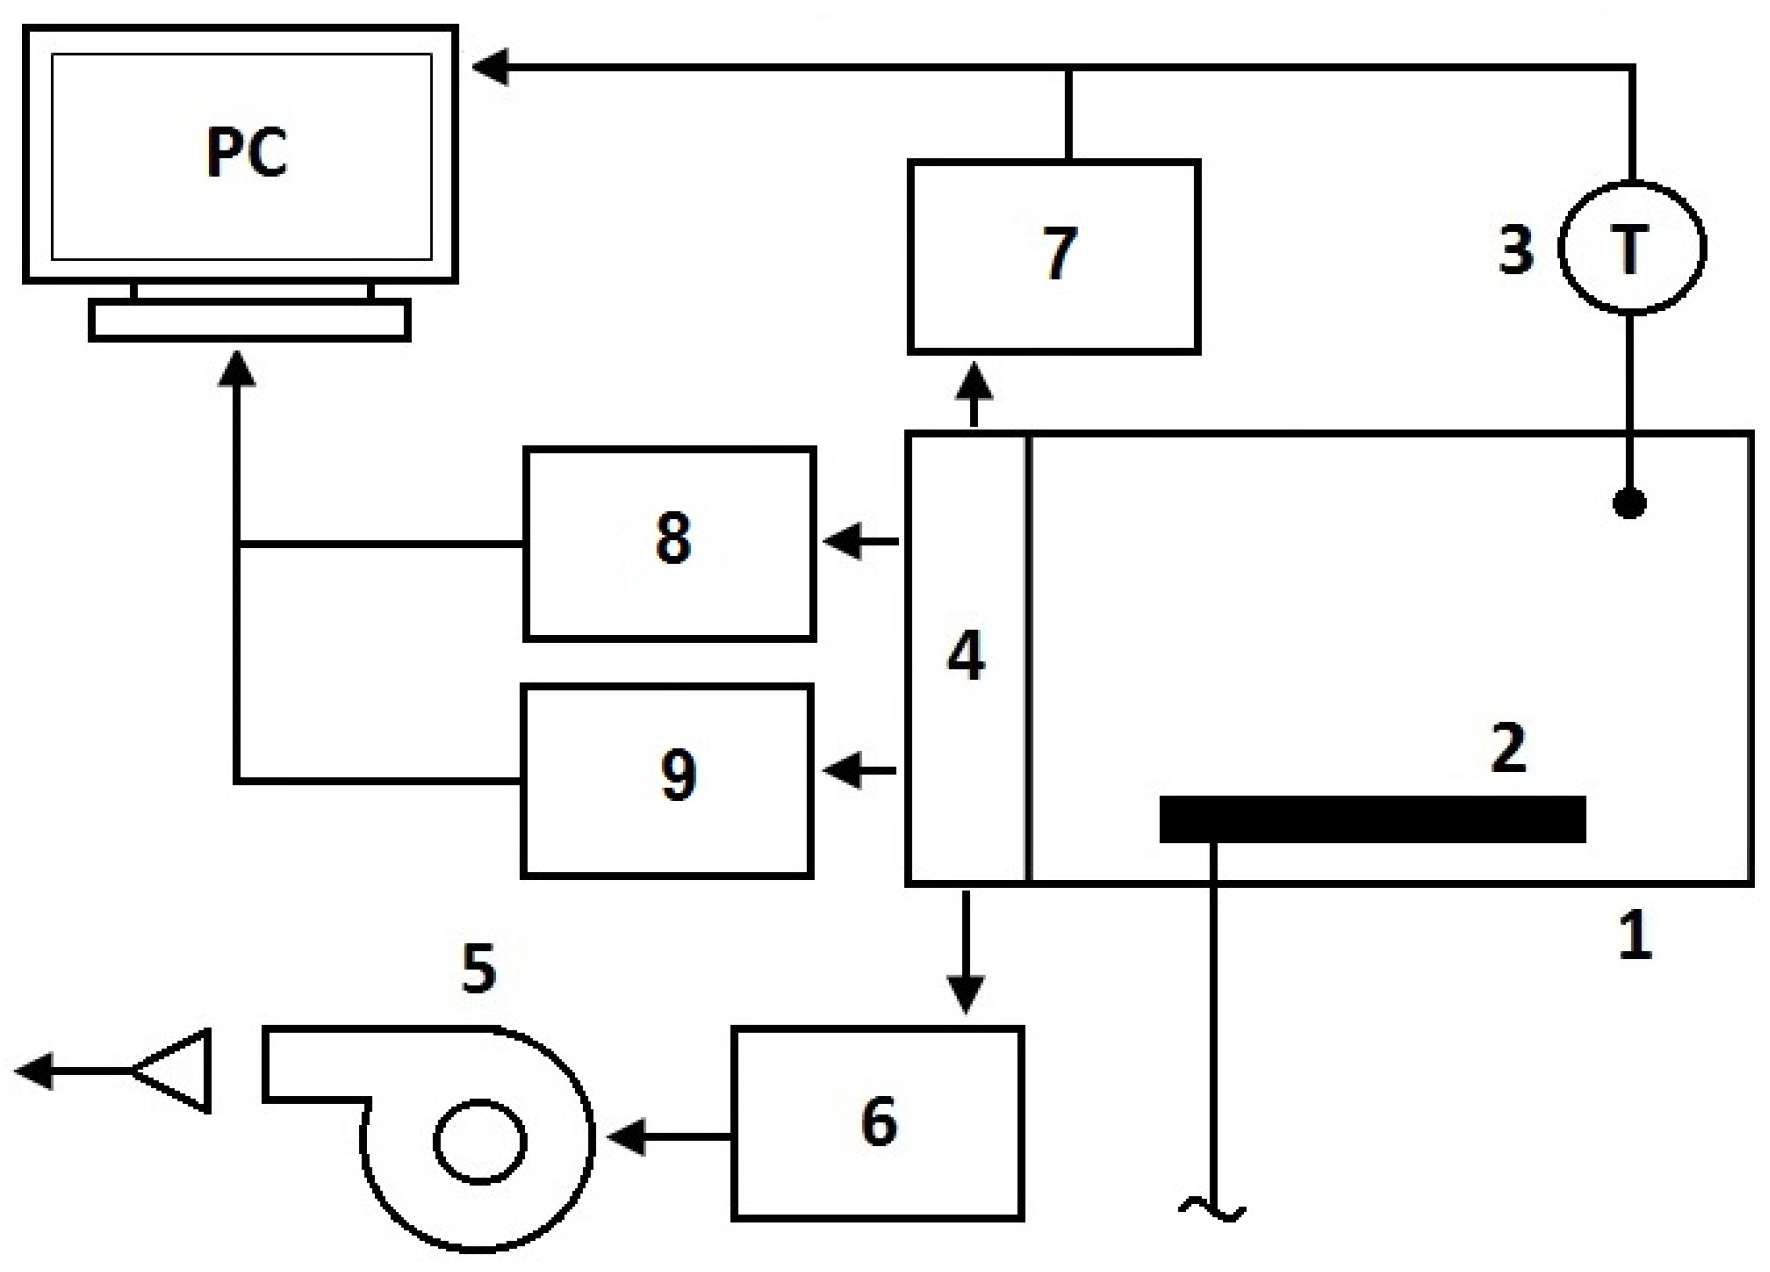
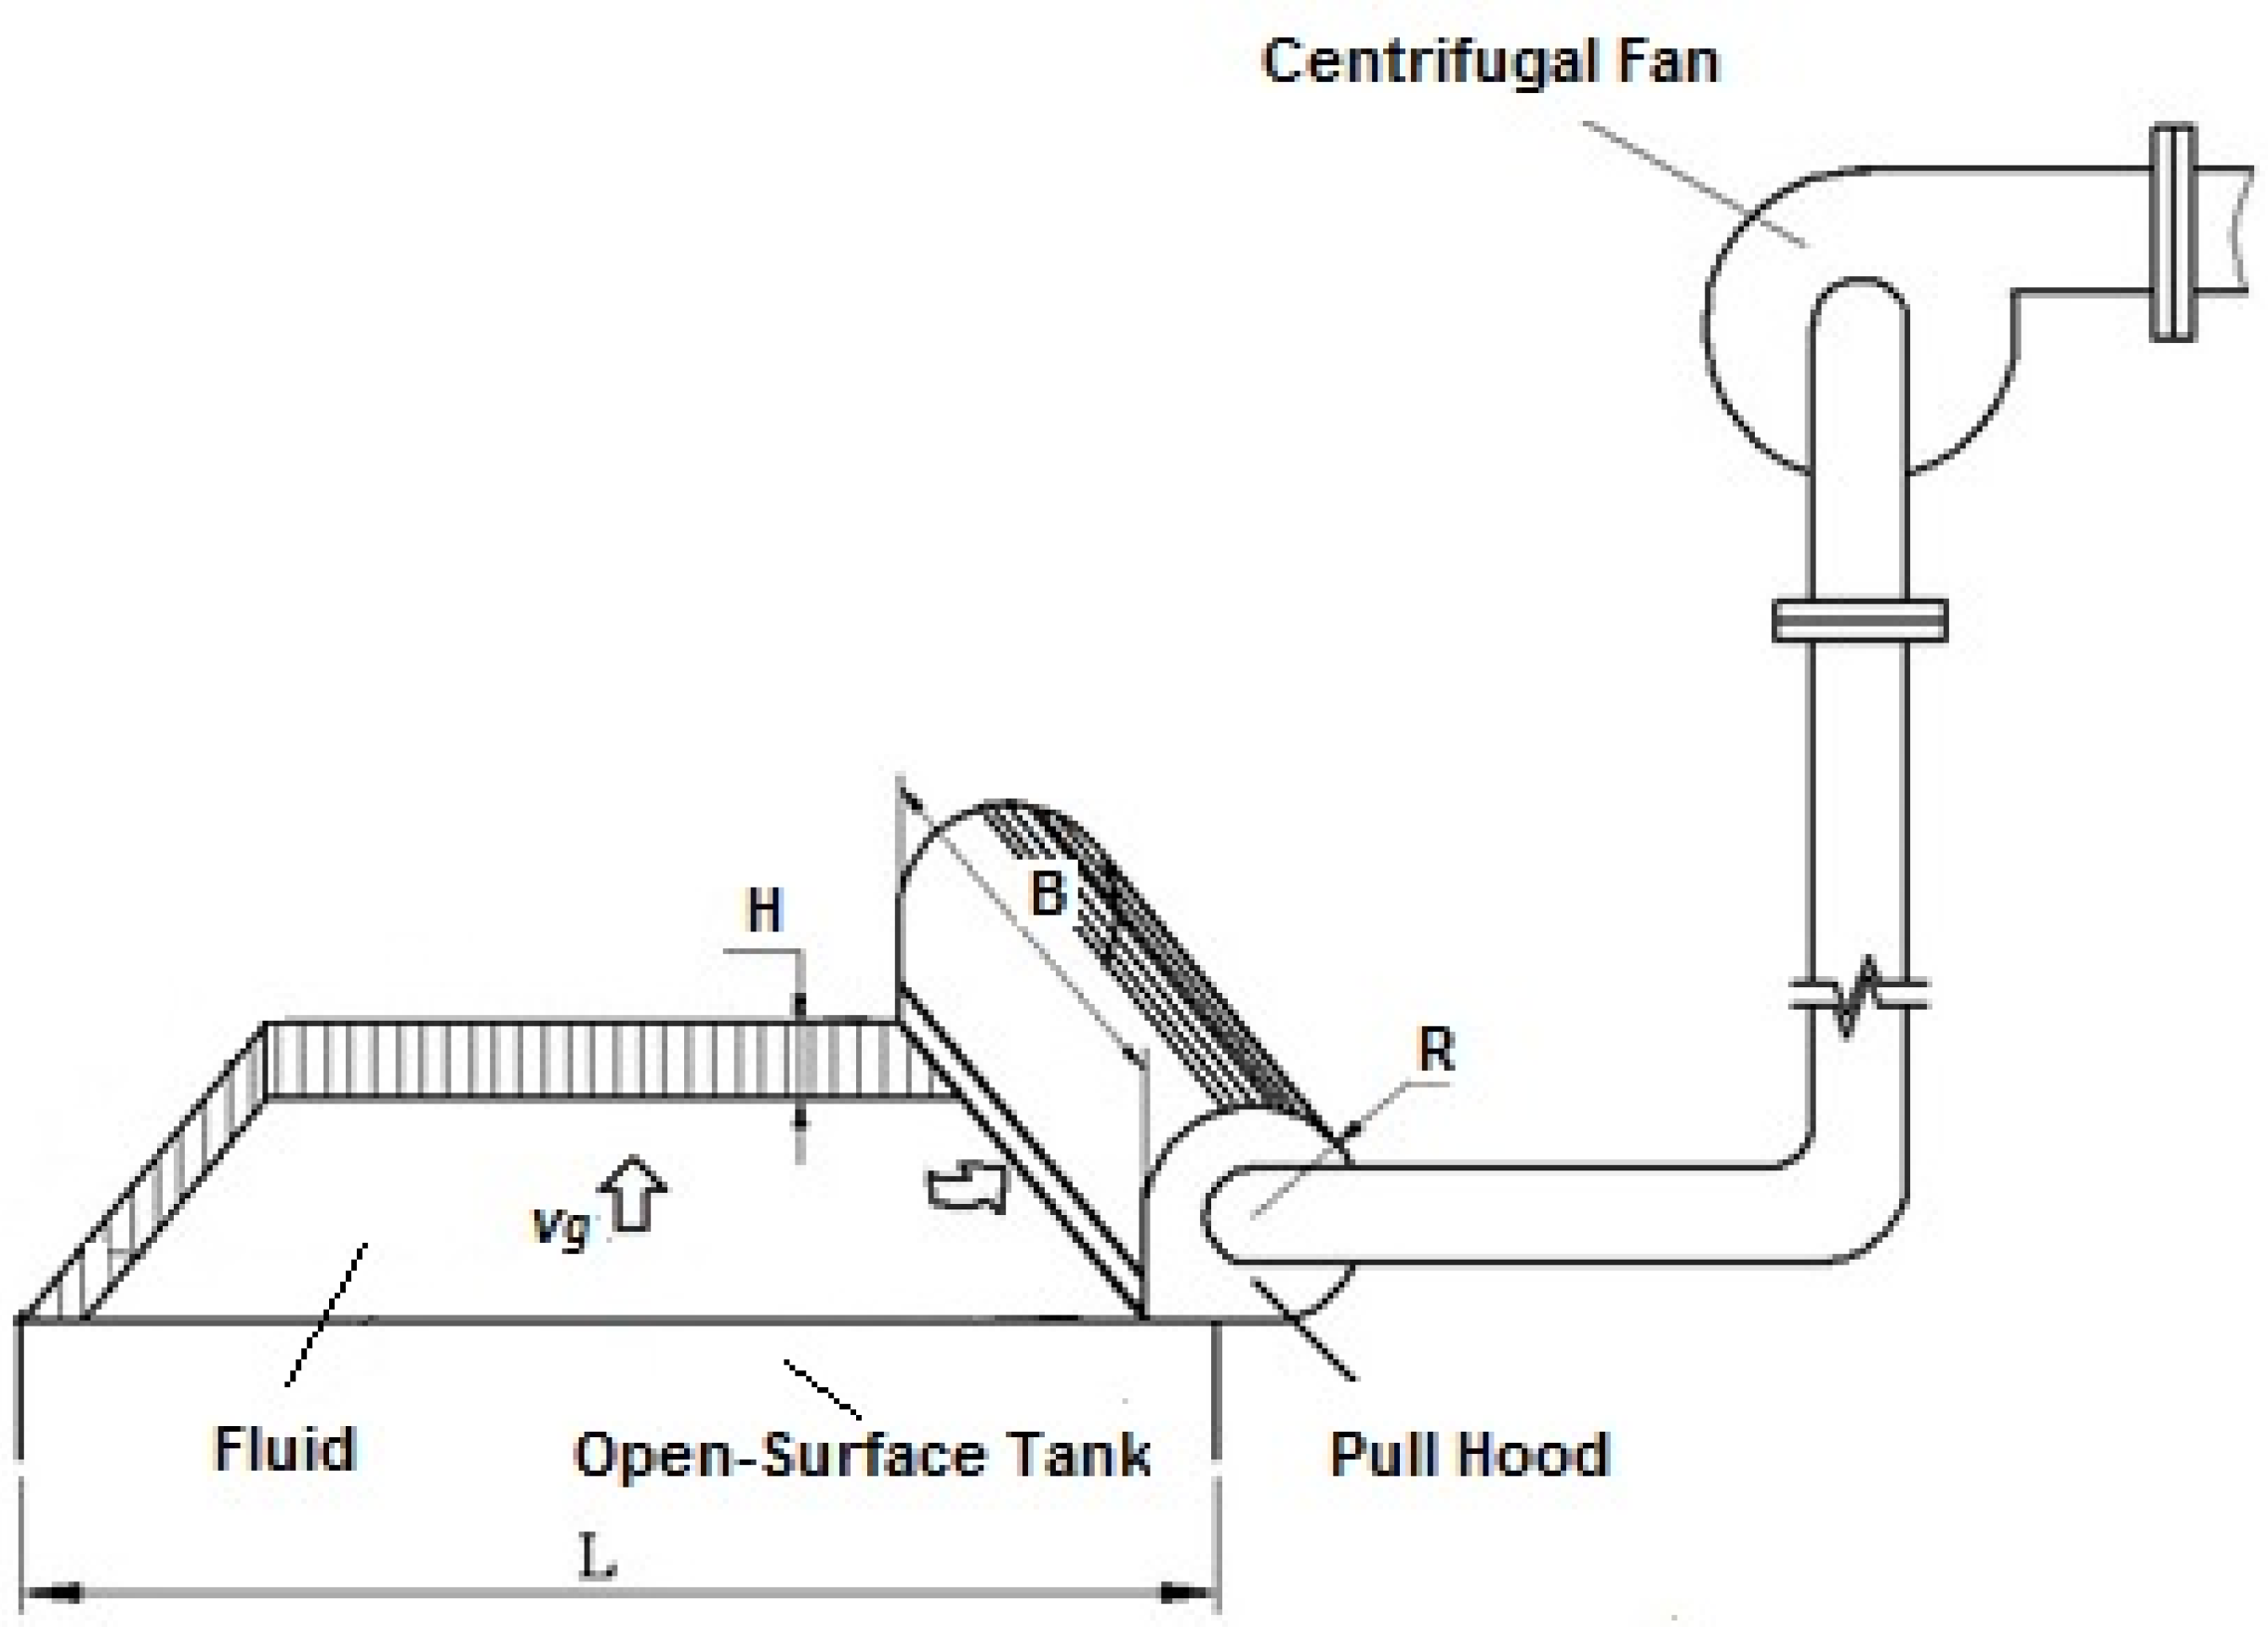
2. The Test Setup
3. Vapor Viscosity, Density, and the Flow Rate
4. Experimental Results
5. MADM Methods
5.1. The VIKOR Method
5.2. The COPRAS Method
- is the sum of the weighted values of the maximized criteria ,
- is same for the minimized criteria,
5.3. The CILOS (Criterion Impact LOSs) Method of Criteria Weight Determination
6. The Evaluation Results
7. Conclusions
Acknowledgments
Author Contributions
Conflicts of Interest
References
- Matthew, A.C. Air Pollution and ‘Dirty’ Industries: How and Why Does the Composition of Manufacturing Output Change with Economic Development? Environ. Resour. Econ. 2000, 17, 109–123. [Google Scholar] [CrossRef]
- Färe, R.; Grosskopf, S.; Pasurka, C.A., Jr. Accounting for Air Pollution Emissions in Measures of State Manufacturing Productivity Growth. J. Reg. Sci. 2001, 41, 381–409. [Google Scholar] [CrossRef]
- Bilde, M.; Pandis, S.N. Evaporation Rates and Vapor Pressures of Individual Aerosol Species Formed in the Atmospheric Oxidation of α- and β-Pinene. Environ. Sci. Technol. 2001, 35, 3344–3349. [Google Scholar] [CrossRef] [PubMed]
- Dockery, D.W.; Pope, C.A. Acute Respiratory Effects of Particulate Air Pollution. Annu. Rev. Public Health 1994, 15, 107–132. [Google Scholar] [CrossRef] [PubMed]
- King, M.D.; Menzel, W.P.; Kaufman, Y.J.; Tanre, D.; Gao, B.C.; Platnick, S.; Ackerman, S.A.; Remer, L.A.; Pincus, R.; Hubanks, P.A. Cloud and aerosol properties, precipitable water, and profiles of temperature and water vapor from MODIS. IEEE Trans. Geosci. Remote Sens. 2003, 41, 442–458. [Google Scholar] [CrossRef]
- Lohmann, U.; Feichter, J. Global indirect aerosol effects: A review. Atmos. Chem. Phys. 2005, 5, 715–737. [Google Scholar] [CrossRef]
- Chan, C.K.; Yao, X. Air pollution in mega cities in China. Atmos. Environ. 2008, 42, 1–42. [Google Scholar] [CrossRef]
- O’Donovan, T.S.; Murray, D.B. Jet impinge mentheat transfer—Part I: Meanandroot-mean-square heat transfer and velocity distributions. Int. J. Heat Mass Transf. 2007, 50, 3291–3301. [Google Scholar] [CrossRef]
- O’Donovan, T.S.; Murray, D.B. Jet impingement heat transfer—Part II: A temporal investigation of heat transfer and local fluid velocities. Int. J. Heat Mass Transf. 2007, 50, 3302–3314. [Google Scholar] [CrossRef]
- Murugappan, S.; Gutmark, E. Parametric study of the Hartmann–Sprenger tube. Exp. Fluids 2005, 38, 813–823. [Google Scholar] [CrossRef]
- Huang, R.F.; Lin, S.Y.; Jan, S.-Y.; Hsieh, R.H.; Chen, Y.-K.; Chen, C.-W.; Yeh, W.-Y.; Chang, C.-P.; Shih, T.-S.; Chen, C.-C. Aerodynamic Characteristics and Design Guidelines of Push–Pull Ventilation Systems. Ann. Occup. Hyg. 2005, 49, 1–15. [Google Scholar] [CrossRef] [PubMed]
- Cabaleiro, D.; Segovia, J.J.; Martín, M.C.; Lugo, L. Isobaric heat capacity at high pressure, density, and viscosity of (diphenyl ether + biphenyl) mixtures. J. Chem. Thermodyn. 2016, 93, 86–94. [Google Scholar] [CrossRef]
- Rota, R.; Nano, G.; Canossa, L. Design guidelines for push–pull ventilation systems through computational fluid dynamics modelling. Am. Ind. Hyg. Assoc. 2001, 62, 141–148. [Google Scholar] [CrossRef]
- Salin, A.A.; Galeev, A.D.; Ponikarov, S.I. Study of the evaporation of hydrochloric acid: Modeling and experiment. J. Eng. Phys. Thermophys. 2014, 87, 753–762. [Google Scholar] [CrossRef]
- Toro, J.C.O.; Dobrosz-Gómez, I.; García, M.A.G. Sodium sulfate solubility in (water + ethanol) mixed solvents in the presence of hydrochloric acid: Experimental measurements and modeling. Fluid Phase Equilib. 2014, 384, 106–113. [Google Scholar] [CrossRef]
- Marzal, F.; Gonzalez, E.; Minana, A. Determination and interpretation of total and transversal linear efficiencies in push–pull ventilation systems for open surface tanks. Ann. Occup. Hyg. 2002, 46, 629–635. [Google Scholar] [CrossRef] [PubMed]
- Liu, Z.; Thorpe, S.A.; Smyth, W.D. Instability and hydraulics of turbulent stratified shear flows. J. Fluid Mech. 2012, 695, 235–256. [Google Scholar] [CrossRef]
- Marzal, F.; Gonzalez, E.; Minana, A. Visualization of airflows in push–pull ventilation systems applied to surface treatment tanks. Am. Ind. Hyg. Assoc. 2003, 64, 455–460. [Google Scholar] [CrossRef]
- Hwang, C.L.; Yoon, K. Multiple Attribute Decision Making—Methods and Applications; Springer: New York, NY, USA, 1981. [Google Scholar]
- Tzeng, G.H.; Huang, J.J. Multiple Attribute Decision Making: Methods and Applications; CRC Press, Taylor & Francis Group: Boca Raton, FL, USA, 2011. [Google Scholar]
- Liou, J.J.H.; Tzeng, G.H. Comments on “Multiple criteria decision making (MCDM) methods in economics: An overview”. Technol. Econ. Dev. Econ. 2012, 18, 672–695. [Google Scholar] [CrossRef]
- Mardani, A.; Jusoh, A.; Nor, K.M.D.; Khalifah, Z.; Zakwan, N.; Valipour, A. Multiple criteria decision-making techniques and their applications—A review of the literature from 2000 to 2014. Econ. Res.-Ekon. Istraz. 2015, 28, 516–571. [Google Scholar] [CrossRef]
- Liou, J.J.H.; Chuang, Y.C.; Tzeng, G.H. A fuzzy integral-based model for supplier evaluation and improvement. Inform. Sci. 2014, 266, 199–217. [Google Scholar] [CrossRef]
- Tamosaitiene, J.; Zavadskas, E.K.; Liou, J.J.H.; Tzeng, G.H. Selecting Suppliers in Green Supply Chain Management. In Proceedings of the 8th International Scientific Conference on Business and Management Vilnius, Lithuania, 15–16 May 2014; pp. 770–776.
- Mardani, A.; Zavadskas, E.K.; Govindan, K.; Senin, A.A.; Jusoh, A. VIKOR Technique: A Systematic Review of the State of the Art Literature on Methodologies and Applications. Sustainability 2016, 8, 37. [Google Scholar] [CrossRef]
- Mardani, A.; Jusoh, A.; Zavadskas, E.K.; Cavallaro, F.; Khalifah, Z. Sustainable and Renewable Energy: An Overview of the Application of Multiple Criteria Decision Making Techniques and Approaches. Sustainability 2015, 7, 13947–13984. [Google Scholar] [CrossRef]
- Zavadskas, E.K.; Turskis, Z.; Kildiene, S. State of Art Surveys of Overviews on MCDM/MADM Methods. Technol. Econ. Dev. Econ. 2014, 20, 165–179. [Google Scholar] [CrossRef]
- Filip, F.G.; Suduc, A.M.; Bizoi, M. DSS in number. Technol. Econ. Dev. Econ. 2014, 20, 154–164. [Google Scholar] [CrossRef]
- Liou, J.J.H.; Tamosaitiene, J.; Zavadskas, E.K.; Tzeng, G.H. New hybrid COPRAS-G MADM Model for improving and selecting suppliers in green supply chain management. Int. J. Prod. Res. 2016, 54, 114–134. [Google Scholar] [CrossRef]
- Zavadskas, E.K.; Antucheviciene, J.; Turskis, Z.; Adeli, H. Hybrid multiple-criteria decision-making methods: A review of applications in engineering. Sci. Iran. A 2016, 23, 1–20. [Google Scholar]
- Zavadskas, E.K.; Bausys, R.; Lazauskas, M. Sustainable Assessment of Alternative Sites for the Construction of a Waste Incineration Plant by Applying WASPAS Method with Single-Valued Neutrosophic Set. Sustainability 2015, 7, 15923–15936. [Google Scholar] [CrossRef]
- Liou, J.J.H. New concepts and trends of MCDM for tomorrow—In honor of Professor Gwo-Hshiung Yzeng on the occasion of his 70th birthday. Technol. Econ. Dev. Econ. 2013, 19, 267–375. [Google Scholar] [CrossRef]
- Pourahmad, A.; Hosseini, A.; Banaitis, A.; Nasiri, H.; Banaitiene, N.; Tzeng, G.-H. Combination of Fuzzy-AHP and DEMATEL-ANP with GIS in a New Hybrid MCDM Model Used for the Selection of the Best Space for Leisure in a Blighted Urban Site. Technol. Econ. Dev. Econ. 2015, 21, 773–796. [Google Scholar] [CrossRef]
- Huang, K.-W.; Huang, J.-H.; Tzeng, G.-H. New Hybrid MADM Model for Improving Competence Sets: Enhancing a Company’s Core Competitiveness. Sustainability 2016, 8, 175. [Google Scholar] [CrossRef]
- Chou, S.-Y.; Yu, C.-C.; Tzeng, G.-H. A Novel Hybrid MCDM Procedure for Achieving Aspired Earned Value Management Applications. J. Math. Probl. Eng. 2016. [Google Scholar] [CrossRef]
- Gölcük, I.; Baykasoglu, A. An analysis DEMATEL approaches for criteria interaction handling within ANP. Expert Syst. Appl. 2016, 46, 346–366. [Google Scholar] [CrossRef]
- Gudienė, N.; Banaitis, A.; Podvezko, V.; Banaitienė, N. Identification and evaluation of the critical success factors for construction projects in Lithuania: AHP approach. J. Civ. Eng. Manag. 2014, 20, 350–359. [Google Scholar] [CrossRef]
- Lazauskaitė, D.; Burinskienė, M.; Podvezko, V. Subjectively and objectively integrated assessment of the quality indices of the suburban residential environment. Int. J. Strateg. Prop. Manag. 2015, 19, 297–308. [Google Scholar] [CrossRef]
- Opricovic, S.; Tzeng, G.H. The Compromise solution by MCDM methods: A comparative analysis of VIKOR and TOPSIS. Eur. J. Oper. Res. 2004, 156, 445–455. [Google Scholar] [CrossRef]
- Opricovic, S.; Tzeng, G.H. Extended VIKOR method in comparison with outranking methods. Eur. J. Oper. Res. 2007, 178, 514–529. [Google Scholar] [CrossRef]
- Keshavarz Ghorabaee, M.; Amiri, M.; Sadaghiani, J.S.; Zavadskas, E.K. Multi-criteria project selection using an extended VIKOR method with interval type-2 fuzzy sets. Int. J. Inform. Technol. Decis. Mak. 2015, 14, 993–1016. [Google Scholar]
- Bausys, R.; Zavadskas, E.K. Multicriteria Decision Making Approach by VIKOR under Interval Neutrosophic Set Environment. Econ. Comput. Econ. Cybern. Stud. Res. 2015, 49, 33–48. [Google Scholar]
- Zavadskas, E.K.; Kaklauskas, A.; Šarka, V. The new method of multi-criteria complex proportional assessment of projects. Technol. Econ. Dev. Econ. 1994, 1, 131–139. [Google Scholar]
- Podvezko, V. The Comparative Analysis of MCDM Methods SAW and COPRAS. Inž. Ekon.–Eng. Econ. 2011, 22, 134–146. [Google Scholar]
- Mulliner, E.; Malys, N.; Maliene, V. Comparative analysis of MCDM methods for the assessment of sustainable housing affordability. Omega 2016, 59, 146–156. [Google Scholar] [CrossRef]
- Nguyen, H.T.; Md Dawal, S.Z.; Nukman, Y.; Aoyama, H.; Case, K. An Integrated Approach of Fuzzy Linguistic Preference Based AHP and Fuzzy COPRAS for Machine Tool Evaluation. PLoS ONE 2015, 10, e0133599. [Google Scholar] [CrossRef] [PubMed]
- Saaty, T.L. The Analytic Hierarchy Process: Planning, Priority Setting, Resource Allocation; McGrawHill: New York, NY, USA, 1980. [Google Scholar]
- Podvezko, V.; Sivilevicius, H. The use of AHP and rank correlation methods for determining the significance of the interaction between the elements of a transport system having a strong influence on traffic safety. Transport 2013, 28, 389–403. [Google Scholar] [CrossRef]
- Podviezko, A.; Podvezko, V. Absolute and Relative Evaluation of Socio-Economic Objects Based on Multiple Criteria Decision Making Methods. Inz. Ekon.-Eng. Econ. 2014, 25, 522–529. [Google Scholar] [CrossRef]
- Ma, J.Z.; Fan, P.; Huang, L.H. A subjective and objective integrated approach to determine attribute weights. Eur. J. Oper. Res. 1999, 112, 397–404. [Google Scholar] [CrossRef]
- Mirkin, B.G. Problema Grupovogo Vibora; Nauka: Moskva, Russia, 1974. (In Russian) [Google Scholar]
- Mirkin, B.G. Group Choice; Winston & Sons: Wachington, DC, USA, 1979. [Google Scholar]
- Zavadskas, E.K.; Podvezko, V. Integrated determination of objective criteria weights in MCDM. Int. J. Inform. Technol. Decis. Mak. 2016. [Google Scholar] [CrossRef]
- Tishchenko, N.F. Atmospheric Air Protection. Calculation of the Content of Harmful Substances and their Distribution in Air; Khimiya: Moscow, Russia, 1991. (In Russian) [Google Scholar]
- Posokhin, V.N. Design of Local Ventilation Systems for the Process Equipment with Heat and Gas Release (in Russian); Mashinostroyeniye: Moscow, Russia, 1984. (in Russian) [Google Scholar]

| Experiment | (HAS) Concentration, % | (HAS) Temperature, T, °C | Vapor Density, ρg kg/m3 X1 | Dynamic Viscosity of Vapor, μg, 105 Pa·s X2 | Velocity of Vapor Flow, vg, m/s X3 |
|---|---|---|---|---|---|
| 1 | 28 | 50 | 1.0839 | 1.868 | 0.224 |
| 2 | 30 | 50 | 1.0995 | 1.855 | 0.223 |
| 3 | 32 | 50 | 1.1278 | 1.825 | 0.242 |
| 4 | 34 | 50 | 1.1789 | 1.775 | 0.250 |
| 5 | 28 | 60 | 1.0488 | 1.873 | 0.259 |
| 6 | 30 | 60 | 1.0742 | 1.845 | 0.265 |
| 7 | 32 | 60 | 1.119 | 1.810 | 0.272 |
| 8 | 34 | 60 | 1.1986 | 1.740 | 0.278 |
| 9 | 28 | 70 | 1.0155 | 1.835 | 0.284 |
| 10 | 30 | 70 | 1.055 | 1.815 | 0.291 |
| 11 | 32 | 70 | 1.1243 | 1.765 | 0.297 |
| 12 | 34 | 70 | 1.2448 | 1.680 | 0.304 |
| 13 | 28 | 80 | 0.9883 | 1.820 | 0.302 |
| 14 | 30 | 80 | 1.0118 | 1.975 | 0.309 |
| 15 | 32 | 80 | 1.1194 | 1.735 | 0.314 |
| 16 | 34 | 80 | 1.2370 | 1.655 | 0.323 |
| Criterion | X1 | X2 | X3 |
|---|---|---|---|
| Weight | 0.3641 | 0.5019 | 0.1340 |
| Rank | 2 | 1 | 3 |
| Weights Yielded by CILOS Method | |||||||||
|---|---|---|---|---|---|---|---|---|---|
| Method Alternatives (Variants) | VIKOR | COPRAS | The Total Rank * | ||||||
| Sj Rank | Rj Rank | Qj Rank | Zi Rank | ||||||
| 1 | 0.3976 | 2 | 0.2284 | 2 | 0.0423 | 2 | 0.0650 | 2 | 2 |
| 2 | 0.3945 | 1 | 0.2063 | 1 | 0 | 1 | 0.0651 | 1 | 1 |
| 3 | 0.4268 | 3 | 0.2353 | 3 | 0.0998 | 3 | 0.0644 | 3 | 3 |
| 4 | 0.4434 | 4 | 0.3137 | 8 | 0.2585 | 5 | 0.0642 | 4 | 4 |
| 5 | 0.4864 | 6 | 0.2782 | 7 | 0.2661 | 7 | 0.0630 | 6 | 6 |
| 6 | 0.5023 | 8 | 0.2422 | 4 | 0.2300 | 4 | 0.0628 | 8 | 5 |
| 7 | 0.5030 | 9 | 0.2588 | 5 | 0.2592 | 6 | 0.0629 | 7 | 7 |
| 8 | 0.5079 | 10 | 0.3686 | 13 | 0.4525 | 10 | 0.0631 | 5 | 9 |
| 9 | 0.6268 | 14 | 0.3255 | 9 | 0.5663 | 12 | 0.0608 | 14 | 12–13 |
| 10 | 0.6115 | 13 | 0.2694 | 6 | 0.4474 | 9 | 0.0611 | 13 | 10 |
| 11 | 0.5996 | 12 | 0.3294 | 10 | 0.5301 | 11 | 0.0615 | 11 | 11 |
| 12 | 0.5712 | 11 | 0.4627 | 15 | 0.7111 | 13 | 0.0623 | 10 | 12–13 |
| 13 | 0.7131 | 16 | 0.3641 | 12 | 0.7670 | 15 | 0.0549 | 16 | 16 |
| 14 | 0.4460 | 5 | 0.3307 | 11 | 0.2914 | 8 | 0.0625 | 9 | 8 |
| 15 | 0.6764 | 15 | 0.3764 | 14 | 0.7402 | 14 | 0.0605 | 15 | 15 |
| 16 | 0.5019 | 7 | 0.5019 | 16 | 0.8963 | 16 | 0.0613 | 12 | 14 |
© 2016 by the authors; licensee MDPI, Basel, Switzerland. This article is an open access article distributed under the terms and conditions of the Creative Commons Attribution (CC-BY) license (http://creativecommons.org/licenses/by/4.0/).
Share and Cite
Čereška, A.; Zavadskas, E.K.; Cavallaro, F.; Podvezko, V.; Tetsman, I.; Grinbergienė, I. Sustainable Assessment of Aerosol Pollution Decrease Applying Multiple Attribute Decision-Making Methods. Sustainability 2016, 8, 586. https://doi.org/10.3390/su8070586
Čereška A, Zavadskas EK, Cavallaro F, Podvezko V, Tetsman I, Grinbergienė I. Sustainable Assessment of Aerosol Pollution Decrease Applying Multiple Attribute Decision-Making Methods. Sustainability. 2016; 8(7):586. https://doi.org/10.3390/su8070586
Chicago/Turabian StyleČereška, Audrius, Edmundas Kazimieras Zavadskas, Fausto Cavallaro, Valentinas Podvezko, Ina Tetsman, and Irina Grinbergienė. 2016. "Sustainable Assessment of Aerosol Pollution Decrease Applying Multiple Attribute Decision-Making Methods" Sustainability 8, no. 7: 586. https://doi.org/10.3390/su8070586
APA StyleČereška, A., Zavadskas, E. K., Cavallaro, F., Podvezko, V., Tetsman, I., & Grinbergienė, I. (2016). Sustainable Assessment of Aerosol Pollution Decrease Applying Multiple Attribute Decision-Making Methods. Sustainability, 8(7), 586. https://doi.org/10.3390/su8070586