Abstract
Quality improvement practice (QIP), as a competitive strategy, is increasingly vital for auto factories to improve the product quality and brand reputation. Quality activity on selected automotive parts among a variety of competing candidates is featured by prioritization calculation. It arouses our interest how to select the appropriate auto part to perform quality improvement action based on the collected data from the after-sale source. Managers usually select the QIP part by the rule of thumb that is based on the quantitative criterion or the subjective preference of individuals. The total quality management (TQM) philosophy requires multiple stakeholders’ involvement, regarded as a multi-criteria decision making (MCDM) issue. This paper proposes a novel hybrid MCDM framework to select the best quality improvement solution combining the subjective and objective information. The rough set-based attribute reduction (RSAR) technique was employed to establish the hierarchy structure of influential criteria, and the decision information was collected with triangular fuzzy numbers (TFNs) for its vagueness and ambiguity. In addition, the novel hybrid MCDM framework integrating fuzzy DEMATEL (decision making trial and evaluation laboratory) method, the anti-entropy weighting (AEW) technique and fuzzy VlseKriterijumska Optimizacija I Kompromisno Resenje (VIKOR) was developed to rank the alternatives with the combined weight of criteria. The results argue that the optimal solution keeps a high conformance with Shemshadi’s and Chaghooshi’s methods, which is better than the existing determination. Besides, the result analysis shows the robustness and flexibility of the proposed hybrid MCDM framework.
1. Introduction
Companies have considered quality as an inevitable and competitive strategy for improving products and services in the market, and “continuous quality improvement” plays an important role in the success and survival of auto enterprises, which are realized by the quality improvement practice, such as 8D, the six sigma tool and quality management techniques. The quality management innovation and sustainable action could create new value for brand generation and more marketing sales [1,2]. Auto factories who can convert mistakes to success by giving life to learning from the past, especially from customers’ feedback, will be the triumphs. The quality activities of six sigma projects and DMAIC (define-measurement-analysis-improvement-control) phase operations help the company to achieve a competitive strategy by reducing failure frequency [3]. The total quality management (TQM) pilot program assists the auto factories to achieve sustainable competitive advantages [4,5]. The self-brand auto makers are experiencing soaring warranty costs and more complaints, which stimulate the QIP activity. The continuous quality improvement practice as a strategic competence can promote the product quality, customer satisfaction and brand reputation, which is driven by the non-conformance and performance imperfection with warranty expenditure and remedy actions [6,7,8]. However, the lack of the commitment of managers, segmented quality approaches and too narrow a focus on quality management are the main barriers for QIP implementation [8]. In order to ensure high efficiency under limited resources, Pareto analysis based on the failure frequency or occurrence [9,10] (measured by R/1000) is usually adopted to establish the specific failure parts in Chinese auto factories. However, with the concentration on customers, the quality data and reporting, especially the customers’ feedback, show their significance on the continuous quality improvement procedure (CQIP) [2]. Thus, how to select the best QIP part for quality improvement action is of great urgency for auto makers’ taking the voice of customers (VOC) into consideration [11]. The conflicting interests and different perceptions on the potential benefits of the program for different departments make the problem a complicated decision making process.
The crucial tools for QIP are total quality management (TQM) and six sigma, both of which are project-driven. Sabet advocated that TQM was a foundation upon which to build six sigma, and the quality performance through the implementation of TQM integrated with six sigma was much better than the quality yield by the conduction of TQM with no six-sigma [12]. However, the appropriate project selection is of significance for the quality movement and successful implementation, as well as the quality-related decision making matters. Kumar proposed a hybrid methodology combining analytic hierarchy process (AHP) and the project desirability matrix (PDM) for six sigma project selection and highlighted the significance of the successful deployment of six sigma [13]. Six sigma could dramatically improve the product quality level and achieve competitive advantage by implementing DMAIC phases [14]. According to Srinivasan, the DMAIC approach contributed to the quality improvement for small-and-medium enterprises (SMEs), even if they had little revenue to perform a belt-based systematic training infrastructure. Miguel discussed the different MCDM approaches on the six sigma project selection problem and argued that the decision making trial and evaluation laboratory (DEMATEL)-analytic network process (ANP) showed better performance for the interactions and feedback of the criteria structure [15]. Büyüközkan proposed the hybrid DEMATEL-ANP method to help logistics companies determine the most critical six sigma project. Saremi applied the fuzzy technique for order performance by similarity to ideal solution (TOPSIS) into TQM consultant selection with a systematic decision process [16]. Alsultan developed innovative, diagnostic matrices by mimicking the contradiction matrix of theory of inventive problem solving (TRIZ) to select the best quality tool and technique alternative [17]. Kabir proposed a hybrid fuzzy AHP-PROMETHEE (preference ranking organization method of enrichment evaluation) method to solve the quality management consultant selection problem [18]. In order to deal with the vagueness and ambiguity of the evaluation information, the fuzzy AHP was explored to select the six sigma project subject to multiple criteria (resource, benefit and effect dimension) [19]; while the warranty information and VOC data have not been made full use of to analyze the QIP project prioritization, especially in the automotive industry.
The quality improvement part prioritization and selection are regarded as a typical MCDM problem performed by evaluating alternatives along considered principles. There are a variety of techniques and methods to solve the decision making problem with multiple conflicting criteria, such as AHP [20], ANP [21], grey relation analysis (GRA) [22], TOPSIS [23], the elimination and choice translating reality (ELECTRE) method [24], artificial intelligence [25] and the VlseKriterijumska Optimizacija I Kompromisno Resenje (VIKOR) [26]. Similar to the above decision making problems in quality improvement practice, QI part prioritization can be resolved by employing an MCDM methodology. VIKOR and TOPSIS are developed based on the closeness to the ideal solution, and they select the most appropriate candidate by closeness ranking [16]. Mardani proposed a new hierarchical framework to prioritize the SMEs in terms of quality management practices based on the hybrid MCMD approach [3]. AHP as an effective method had been applied into quality management practice prioritization [4,8]. The hybrid MCDM methodology integrating several basic MCDM techniques is explored to cope with the management practice, which makes full use of the advantages of different tools. Talib adopted AHP to recognize the TQM practice prioritization. Gandhi applied the combined approach of AHP and DEMATEL to the factors’ evaluation of green supply chain management (GSCM) [27]. Mohammadshahi presented a review on the applications of the MCDM method in the quality areas. The review argued that the hybrid MCDM methods integrated with fuzzy-based techniques were the most popular and accounted for forty percent of the investigated references [28,29]. The fuzzy analytic hierarchy process (AHP) first proposed by Saaty had been proven to the most prevailing one that has been applied to many quality management practices, such as performance evaluation, quality index analysis and project prioritization [18,29,30,31]. However, AHP assumes that the attributes are independent and fails to consider the interactions and dependencies between criteria. The fuzzy DEMATEL shows its advantage that it can be used to deal with subjective information, which helps decision makers to recognize the criteria interrelationship by a diagraph map. To reflect the objective information, the anti-entropy weighting technique is employed.
The fact in Chinese auto factories is that the quality department determined QIP part prioritization is based on failure frequency (R/1000). Faced with the ignorance of VOC information and a subjective method, the hybrid MCDM approach has been developed to prioritize the strategic QIP part making full use of post-sales’ information. To fill the gap, a systematic analytical framework involving related departments with fuzzy-based techniques is employed, which is a contribution to the field of quality innovation and targeted to the audience of researchers and practitioners in quality management. The combined weight, including subjective and objective weights, is embedded into the fuzzy VIKOR method to identify the most critical failure part that should be prioritized for future quality improvement activity. The main contributions of the present research are as follows.
- (1)
- This research provides an analytical framework using a novel hybrid MCDM approach for managers to prioritize the quality improvement program part, and the case application in a Chinese auto factory shows the effectiveness and robustness of the proposed method.
- (2)
- The voice of customers (VOC) information has been taken into consideration for strategic QIP part prioritization, and the rough set-based attribute reduction (RSAR) technique is adopted to establish the criteria.
- (3)
- The combined weighting technique, including subjective and objective items, is employed based on fuzzy DEMATEL and the anti-entropy method, which is embedded into fuzzy VIKOR procedures to obtain the ranking order.
- (4)
- The application of fuzzy-based techniques facilitates managers investigating the evaluation information and implementing the proposed MCDM framework.
The reminder of this paper is organized as follows. The novel hybrid MCDM framework and its implementation steps integrating fuzzy DEMATEL, anti-entropy and fuzzy VIKOR are explored to rank the objective alternatives in Section 2. A case application in a self-brand auto factory is presented in the subsequent section. The result discussion compared to the existing decision method and sensitivity analysis are conducted to verify the effectiveness and robustness of the proposed framework in Section 4. Finally, we close this paper by providing conclusions, limitations and the scope of future research.
2. Quality Improvement Part Selection Based on the Hybrid MCDM Approach
The purpose of this paper is to provide a solution methodology for quality improvement (QI) part selection from several alternatives with the combined weights of criteria taken into account. In this paper, the novel hybrid MCDM approach integrating fuzzy DEMATEL, the anti-entropy weight method and the fuzzy VIKOR technique has been employed to solve this issue with respect to multiple criteria considering the preferences and opinions of multiple parties.
The QI part selection is regarded as a typical MCDM problem. It has a representative panel with K decision makers . The multiple criteria are denoted as C =. There are m failure part alternatives experiencing maintenance and complaints. The criterion weight has been divided into subjective and objective aspects; the interdependence between different criteria has been investigated; and the subjective weights of criteria are performed with the fuzzy DEMATEL technique, while the objective weights have been obtained based on the anti-entropy weight (AEW) method. The combined weights of criteria have been embedded into the fuzzy VIKOR procedure, which is used to obtain the ranking orders of alternatives. Let the fuzzy subjective weights of criteria be presented as and the objective weights of the criteria as . Let the value be the relative importance of the subjectivity, and the combination of the criterion weight can be calculated based on the subjective weight and the objective weight.
2.1. Hierarchy Criteria Construction
2.1.1. Criteria Development
To understand the criteria better used in the selection of the QI part in the automotive industry, we review the related references. Three dimensions including nine criteria are identified based on failure, expenditure and voice of customers (VOC), as shown in Table 1.

Table 1.
Indicators for the quality improvement part selection issue.
2.1.2. Criteria Establishment Using the Rough Set-Based Attribute Reduction Technique
In order to eliminate the redundant criteria, which may increase the complexity of decision making, the RSAR technique is adopted to construct the effective hierarchy index. The decision table is investigated through the investigation given by representatives. Let the decision table , and D is the decision attribute [41].
The decision table has collected the decision making considerations of different departments given by its representative. The Boolean variable is used to reflect whether the attribute has been chosen by the representative. When the value equals one, it means the attribute is selected as a crucial indicator for QI part selection and vice versa. The knowledge is presented in Table 2, which is conducted on attribute reduction by the Rosetta software. After the operation by the SAVGeneticReducer module, we obtain the effective indicators, as well as the hierarchy criteria structure for QI part selection.
Table 2.
Decision table for effective criteria construction.
2.2. The Hybrid MCDM Framework for QI Part Selection
Suppose is the performance rating of the i-th alternative with respect to the j-th criterion given by the k-th representative, and is the relative importance of each decision maker, which satisfies and for k = 1, 2, …, K. In this section, we explore the novel hybrid MCDM approach that integrates fuzzy DEMATEL, anti-entropy and fuzzy VIKOR techniques to resolve the QI part selection problem for continuous quality improvement practice.
2.2.1. The Fuzzy VIKOR Approach Integrated with the Combined Weighting Technique
In order to prioritize the quality improvement part by making full use of evaluation information, we proposed the novel hybrid MCDM method, which used combined weight, including subjective and objective items, to reflect the criteria’s relative importance. The triangular fuzzy number (TFN) is utilized to deal with the qualitative information, including the preferences and opinions of representatives, as well as the evaluation information of failure parts with respect to qualitative criteria. Due to the multiple criteria and their interaction, the fuzzy DEMATEL technique is introduced to get the subjective weight of criteria. In addition, the anti-entropy weight (AEW) method is employed to obtain the objective weight of a criterion based on the decision information given by a representative panel. After we obtained the combined weights of criteria via the weighted average operation, the VIKOR technique is conducted to rank the alternatives by comprehensive utility value Q [42]. The integrated hybrid MCDM framework and the implementation procedure are as Figure 1 shows.
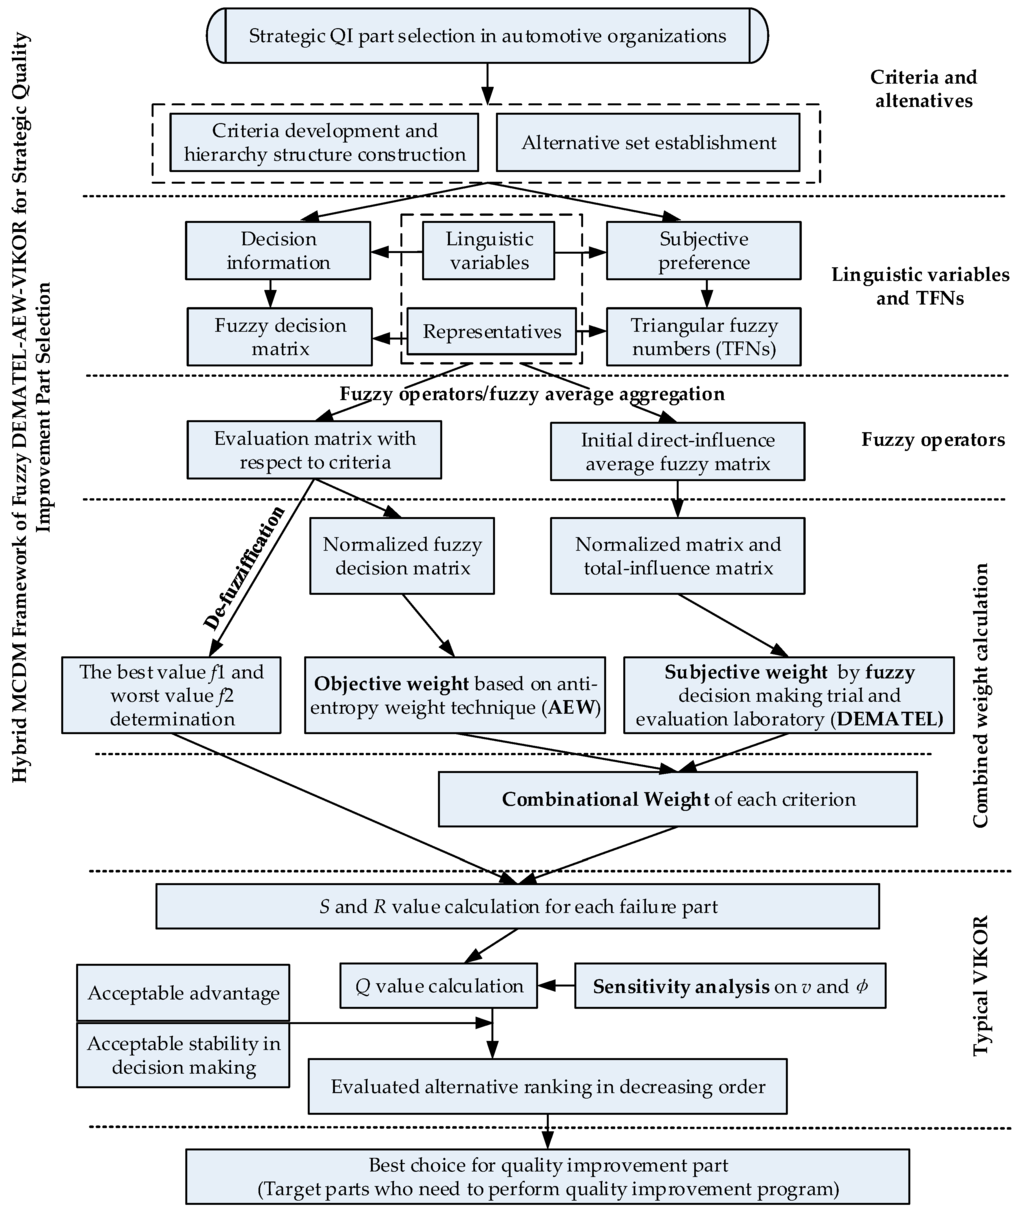
Figure 1.
The novel hybrid MCDM Framework for QI part prioritization.
2.2.2. Implementation Steps of the Proposed Method
The prioritization ranking of the QI part alternative subject to the multi-criteria is obtained by the sequence of the calculated index and . The solution based on the minimum reflects the maximum group utility, while the solution obtained by the minimum demonstrates the minimum individual regret. The evaluation index is the most widely used to obtain the compromising solution. The step details of the proposed framework are implemented as follows.
Step 1: Establishment of the QIP part set for quality reform alternatives (Pareto chart technique). The failure part alternatives are obtained from the global quality research system via maintenance statistics and questionnaire investigation (qualitative information). The five expert representatives must be good in the related research area, such as quality improvement, cost analysis, post-sales management, etc. In the investigated organization of this paper, the five expert panels are the chief executive officer (CEO), managers in R&D, manufacturing factory, marketing and the quality department.
Step 2: Criteria selection based on the RSAR technique [43]. In order to obtain the core criteria, the genetic attribute reduction SAVGeneticReducer module has been adopted based on the Rosetta software.
For the conditional attribute , if the formula IND (A) = IND (A − {}) is satisfied, then the index will be regarded as redundant for the knowledge system or the attribute will be necessary and independent. The RSAR operation is conducted, and the parameters of SAVGeneticReducer are as follows:
- Crossover rate: pc = 0.3; mutation rate: pm = 0.05;
- Initial population size: M0 = 70; maximum population size: M = 256;
- The optimal solution not terminating the number of iterations: N = 30;
- Weighting coefficient:
After the attribute reduction operation by Rosetta, the reduced criteria (a1, a2, a5, a6, a8, a9) are selected. The hierarchy structure with six influential criteria has been developed as Figure 2 illustrates.
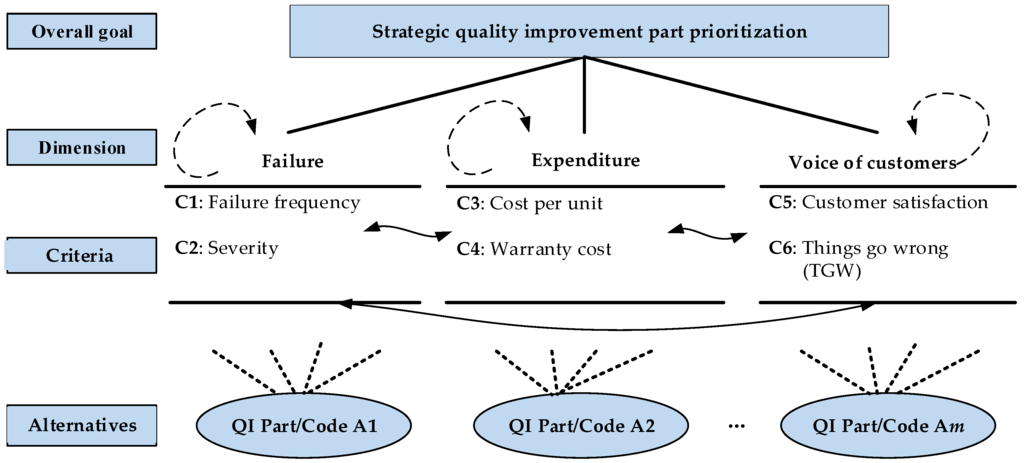
Figure 2.
The established hierarchy structure for QI part prioritization.
Step 3: Data collection. The corresponding linguistic variables of initial direct effect between the criteria and decision information of alternatives are investigated, given by the representative panel. Assume is the triangular fuzzy number, and the membership function is illustrated as Figure 3 shows.
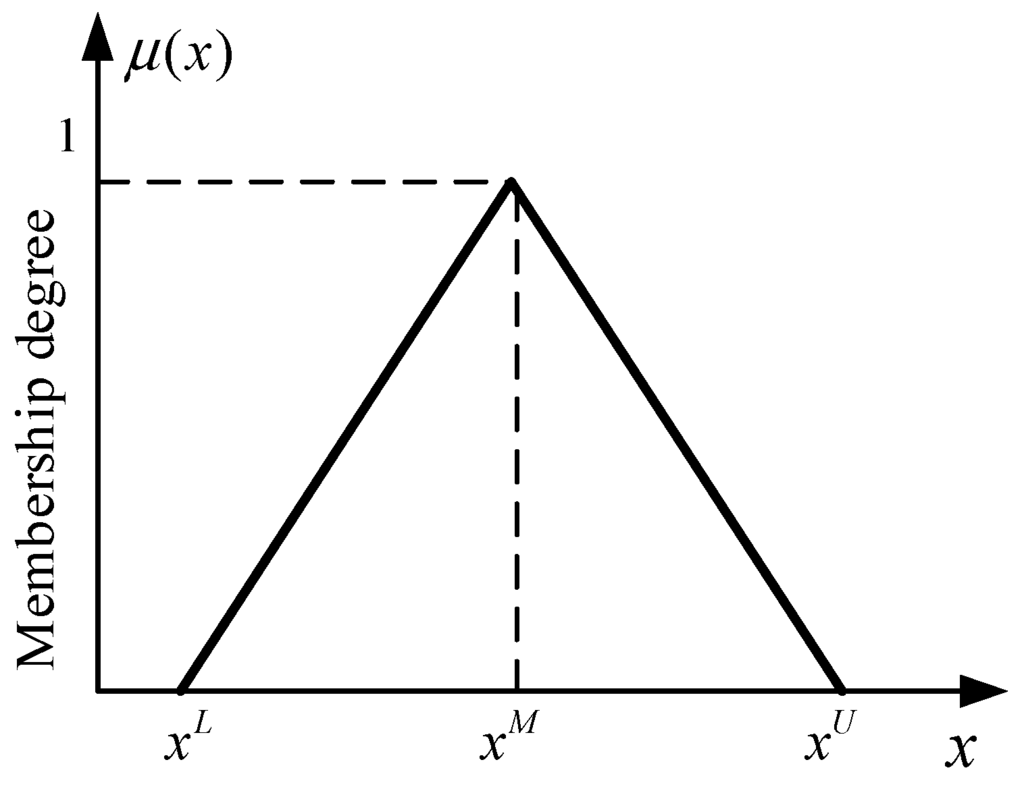
Figure 3.
Membership functions of the triangular fuzzy number (TFN).
In addition, the rating sales of qualitative linguistic variables and the corresponding TFNs of initial direct influence information and evaluation data are presented in Table 3 [44] and Table 4 [45]. The collected linguistic variables would be transferred to TFNs based on the following tables.
Table 3.
The defined linguistic variables and corresponding TFNs for the direct effect of criteria.
Table 4.
Defined linguistic variables and corresponding TFNs for the alternative rating.
Step 4: Aggregation of the gathered evaluation information. The fuzzy weighted decision matrix and initial direct-effect weighted fuzzy matrix would be generated based on the fuzzy aggregation and fuzzy weighted operators.
Suppose is the performance rating of the i-th alternative with respect to the j-th criterion given by the k-th expert, and is the relative importance of each decision maker, which satisfies and for k = 1, 2, …, K. Additionally, is the comparison result of the direct effect that on by expert k. Fuzzy aggregations are conducted to integrate the decision information of representatives through the following two fuzzy operators (Equations (2) and (3)).
where and ) are two triangular fuzzy numbers.
The fuzzy aggregation of the judgments of the representatives’ panel is generated as the following formulas (Equations (4) and (5)):
The fuzzy aggregated decision matrix and fuzzy initial direct-effect averaged matrix are:
Step 5: Fuzzy subjective weight of criteria based on the fuzzy DEMATEL technique [46]. The normalized direct-effect fuzzy matrix would be obtained by Equation (6) and, then, the total-effect fuzzy matrix by Equation (7).
Based on the total-effect fuzzy matrix, we can obtain the sum of rows and columns expressed as and by Equations (8) and (9). After that, the two variables and are calculated with ordered pairs of (); where denotes the degree of the targeted attribute role that the factor plays in the network system and means net effect that the element contributes to the network system [47]. The subjective weight of criteria would be obtained by Equation (10).
Step 6: The defuzzification operation has adopted the graded mean integration representation (GMIR) method as the following general operation in Formula (11) [40]. Then, the fuzzy average decision matrix would be transferred to the matrix with crisp values, as well as the fuzzy combined weights of criteria.
Step 7: Fuzzy objective weight of criteria based on the fuzzy anti-entropy weighting (AEW) technique [33]. The normalization operation is performed by Equation (12), and the anti-entropy of each criterion item is calculated by Equation (13). Then, we can obtain the fuzzy objective weights through Equation (13).
Step 8: Fuzzy combined weight calculation. Let the relative weight of the subjectivity item be φ. The integrated weights of criteria are formed by Equation (15) with subjective and objective weights taken into consideration.
Step 9: Establishment of the best and the worst solution for each criterion.
Step 10: The calculation on the maximum group utility values Si and the minimum individual regret value Ri for every alternative by Equations (17) and (18).
Step 11: Compute the overall distance of alternatives from the ideal solution (comprehensive utility value ) by Equation (19).
where is the weight of consideration for maximum group utility and the 1 − v is the relative importance of individual regret. Obliviously, the value of v can represent the attitude and preference of the representative panel.
Step 12: The best solution of the QI part from the ascending orders is based on the S, R and Q values. The candidate will be regarded as the compromising solution (the alternative with minimum comprehensive group utility value Q), if the following two conditions (acceptance advantage and its stability) can be satisfied:
C1 (acceptable advantage): The following formula should be satisfied. Additionally, is the second alternative in the ranking sequence by the Q value, and DQ = 1/(m − 1).
C2 (acceptable stability in decision making): The alternative must also be the best ranked by S or R. This compromise solution is stable within a decision making process, which could be: “voting by majority rule” (when v > 0.5 is needed), or “by consensus” v = 0.5, or “with veto” v < 0.5.
If one of the conditions is not satisfied, then a set of compromise solutions is proposed, consisting of two situations, that is:
- (1)
- Alternatives will be the compromise solutions if the condition C1 is not satisfied; while is decided by the formula for maximum m (the alternatives ranking are “in closeness”).
- (2)
- Alternatives and will fall into the compromise solution set if the condition C2 is not satisfied.
3. Case Application
In this section, we are going to put forward a numerical case to illustrate the application of the integrated method. A practical application of strategic part prioritization for QIP in an automotive organization (CA Co. Ltd., Chongqing, China) is presented located in Chongqing, China. The company is a famous vehicle-assembly enterprise with various products, like sports utility vehicles (SUV), multi-purpose vehicles (MPV), cars and vans, who has an increasing tendency to focus on the CQIP, quality improvement and brand construction. Although this company targets the part with the highest failure frequency (obtained from after-sales department feedback) as the quality improvement objective, the decision making on QI part selection does not consider the judgement of other departments. In addition, the feedback information via the customer complaint codes (CCCs) statistic has not been adopted. To be effective in continuous quality improvement, the case enterprise wished to develop a systematic approach of selecting the best QI part with limited resources based on collected information and questionnaire data through its global quality research system (GQRS). In view of this, the proposed hybrid MCDM framework was explored to evaluate the priority of the QI part and to select the best one comprehensively considering the judgements of multiple departments and evaluation information.
3.1. Data Collection and Experiment Parameters
The seven failure parts of the top 10 are evaluated in terms of the established six criteria (Figure 4). The other three objectives are customer complaint codes, for which it is difficult to attribute the failures to a certain part. For confidentiality issues, the realistic information was not presented in this paper, and the linguistic variables were given by the representatives based on the comparison of the failure report and the post-sale’s report obtained from the global quality research system (GQRS). In addition, the linguistic variables of alternatives with respect to each criterion and the fuzzy initial direct-effect comparison between criteria are provided in the Appendix tables. From the implementation stages of the hybrid MCDM framework, there are three parameters that affect the ranking result, namely the representative’s weight , the relative importance of the subjective weight and the group utility weight v. In order to explore the robustness of the proposed hybrid framework, there are several scenarios (Table 5, Table 6 and Table 7) settled for sensitivity analysis on these three parameters for the best QI part choice when the decision parameters vary.
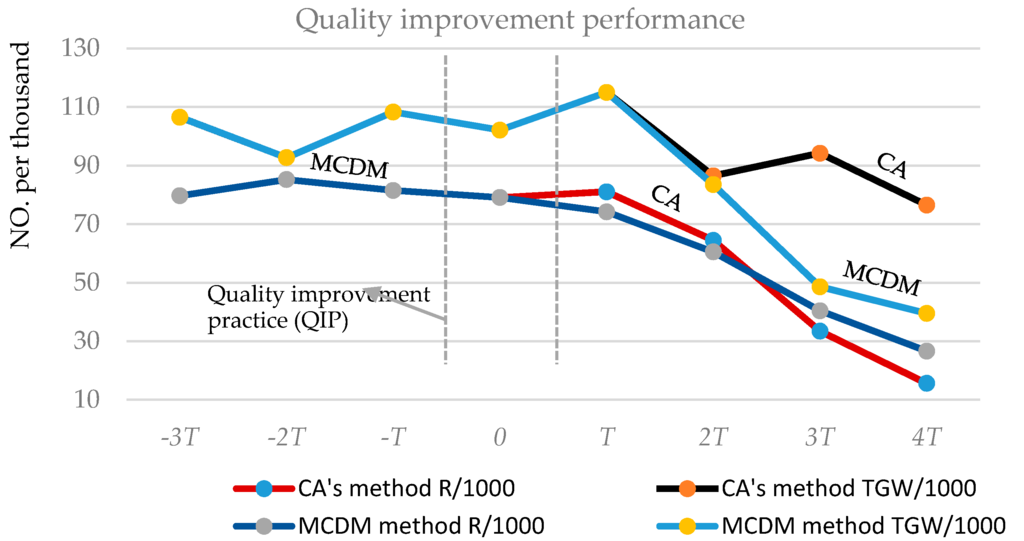
Figure 4.
The performance comparison of key indicators between CA’s and the MCDM method.
Table 5.
Relative weight of each representative (6 scenarios).
Table 6.
The relative weight setting of the subjectivity item (11 scenarios).
Table 7.
The group utility weight setting (11 scenarios).
3.2. The Best QI Solution Generation
Assume the relative importance of each representative is equal (), and φ = 0.5, v = 0.5. The implementation stages are conducted to perform the novel hybrid MCDM framework. Additionally, we obtain the ranking orders of the seven quality improvement part alternatives presented in Table 8 by decreasing sequence of S, R and Q value.
Table 8.
Prioritization of quality improvement parts by S, R and Q
In addition, the two conditions on the acceptance advantage and stability of the methodology are verified:
- (1)
- Q (A7) − Q (A6) = 0.2479 > 0.167, which satisfied the acceptance condition.
- (2)
- The top priority by S, R and Q is always alternative A6.
The presented result in Table 8 argues that the best choice for the quality improvement part is A2 based on the S, R and Q values. The ranking order and the specific priority sequence is A6 > A7 > A1 > A5 > A3 > A4 > A2 based on comprehensive group utility value Q.
4. Results and Findings
4.1. Solutions Compared to the Existing Selected QI Part
The ranking order of alternatives obtained by the proposed VIKOR-based method is A6 > A7 > A1 > A5 > A3 > A4 > A2; while the existing decision making process by the CA quality department is based on the C2 criteria (R/1000), and its ranking order was A3 > A6 > A2 > A5 > A1 > A7 > A4. As the calculation result presented above, the alternative part A6 has a top priority for quality improvement instead of the candidate A3 determined as the first priority by the Pareto chart. Even though the A3 alternative shows its priority on criteria C2 (R/1000), the weakness on other criteria, such as C6 (TGW/1000), contributes to the poor performance of the overall indicator. The decision process was implemented in the CA auto factory for its quality improvement practice, and the outcome of the two different decision philosophies is presented in the following figure. We aim at exploring the performance comparison of the two key indexes of failure frequency per thousand vehicles (R/1000) and things go wrong per thousand (TGW/1000) cars in three service months.
The performance roadmap of the two key indicators R/1000 and TGW/1000 is presented in Figure 4. The zone in the dashed line area means the quality improvement practice on the selected part (A3 by CA’s presenting method and A6 by the proposed MCDM approach). Before the activity is conducted, both failure frequency (R) and customer complaints (TGW) are very high. With the implementation of QIP on the selected objective, the quality indicators are improved. In addition, the R/1000 and TGW/1000 indicators are reduced dramatically by performing QIP on the MCDM component (A6) rather than the previous decision alternative (A3), because it may be invalid to improve the customer complaints (TGW) index by quality improvement practice on the previous solution.
4.2. The Best Choice Compared to Shemshadi’s and Chaghooshi’s Method
In order to verify the proposed hybrid MCDM framework, we perform the result analysis compared to Shemshadi’s and Chaghooshi’s method [46,48], respectively (Table 9).
Table 9.
Result comparison with Shemshadi’s and Chaghooshi’s consideration.
The Q value and ranking results by different methods are presented in the above table, which argues that A6 is the best quality improvement component. Then, calculated ranking orders by the proposed MCDM framework show high conformance with Chaghooshi’s method, which testify to the effectiveness of the proposed procedure. While the ranking orders of A3, A4 and A5 show a tiny fluctuation between Shemshadi’s and the proposed method, it definitely does not influence the best selection. In addition, the proposed MCDM shows its high flexibility on decision making by combing the subjectivity and objectivity.
4.3. Sensitivity Analysis
In order to investigate the robustness of the hybrid MCDM approach, the sensitivity analysis is performed in this part. We want to explore the ranking result of alternatives and the stability of the best solution when the three parameters () vary.
- (1)
- Sensitivity analysis on the decision makers’ weights :
The parameter reflects the relative importance of the representative during the decision making process, which may affect the best solution. In order to investigate the stability of decision results, we try to explore the ranking orders of the five alternatives, including the first two (A6, A7), the last two (A4, A2) and the A3 part (determined by the quality department), illustrated in Figure 5.
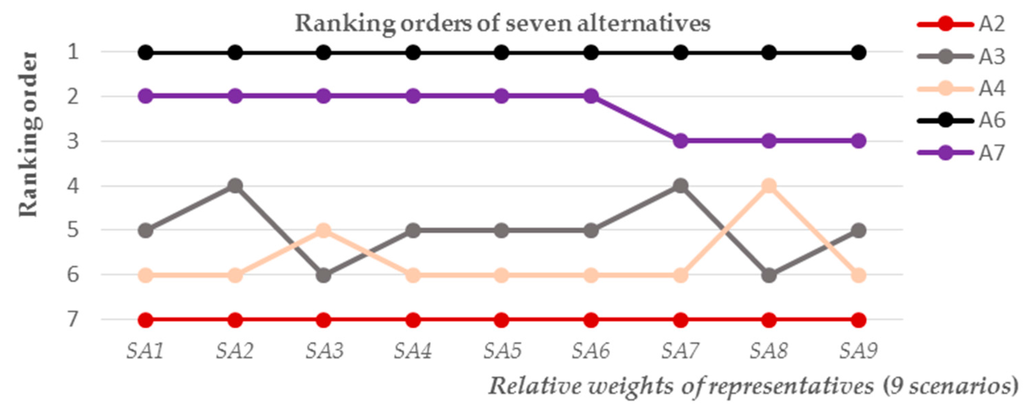
Figure 5.
Sensitivity analysis results on (nine experiment scenarios).
As Figure 5 shows, the best choice of the quality improvement part is A6, and the last ranking alternative is A2. The second ranking part A7 shows its backward ranking trend from the SA7 experiment scenario; however, it still shows its priority compared to the A3, A4 and A2 alternatives, which would be considered as the “8D” objectives. Due to the different combined solutions of the decision maker’s weight, the ranking order of A3, A4 shows their fluctuation; the same situations occurred in other parts (A1 and A5). However, the best selection (A6) and worst alternative (A2) keeps high stability, and the best one definitely is not the existing determination result (A3). The fluctuations of decision results on ranking order are due to the different considerations and discrepant preferences of decision makers (varying ).
- (2)
- Sensitivity analysis on the relative importance of subjectivity item φ:
The parameter φ reflects the relative importance of subjectivity. As the hybrid MCDM framework conducts the decision process from the subjective and objective perspectives, there is a trade-off between these two considerations. This parameter could reflect the preference of the decision maker, which also shows the flexibility of the decision making by adjusting the specific value. The ranking orders of all alternatives and the variation of the best solution are presented in Figure 6.
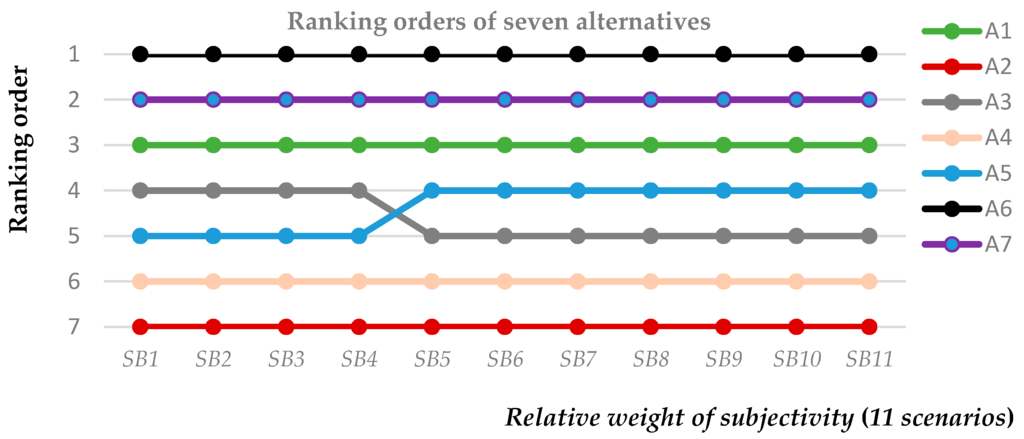
Figure 6.
Sensitivity analysis results on φ (11 experiment scenarios).
The above figure shows the ranking variation of each alternative part in 11 established scenarios. The stable ranking order of each alternative demonstrates the high robustness of the proposed method, and the best quality improvement part is always A6. With increasing of the subjectivity attention, candidate A3 shows the backward tendency in the ranking sequences. Even if there is a tiny fluctuation for A3 and A5, the last four ranking orders show the stability on A3, A5, A4 and A2.
- (3)
- Sensitivity analysis on group utility weight v:
The parameter v means the group utility weight compared to the individual regret consideration, which reflects the optimistic degree and preference of the decision maker. The decision results in different established scenarios are presented in Figure 7.
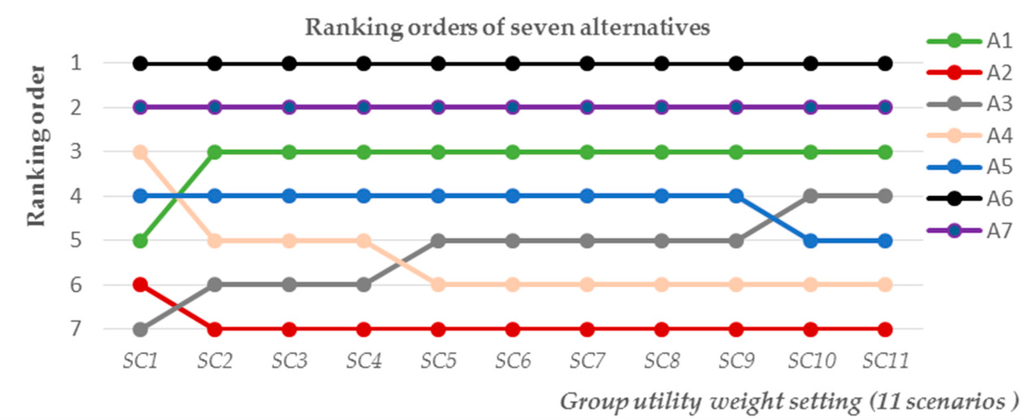
Figure 7.
Sensitivity analysis results on v (11 experiment scenarios).
As can be seen in Figure 7, the best choice for the quality improvement part is A6, as well. The ranking orders of the seven alternatives show the stability, except the tiny fluctuation of the A3 and A4 alternatives, and the ranking orders of the two alternative parts (A3 and A4) show their interaction with different considerations on individual regret and group utility. All in all, similar to the sensitivity analysis result in Figure 6, the last three alternatives are always A3, A4 and A2, which means it is not necessary to perform the quality improvement activity on these three parts. In order to improve the quality indicators, those alternatives, like A6, A7 and A1, would be selected as the objectives of “8D” or “six sigma” for the quality improvement.
5. Conclusions
5.1. Research Originality: Theoretical and Practical Implications
It is the quality improvement activity on failure components or the customer complaint code that increases customer satisfaction. The quality department decides to perform improvement activity on the selected alternative based on the failure frequency performance and the Pareto chart tool. However, how to select an appropriate failure component for QIP is crucial for the auto factory from the listed alternatives. The existing solution leads to the decrease of R/1000, but fails to improve the TGW and customer satisfaction criteria. Besides, the total involvement of TQM suggests to us to focus much on the feedback of product utilization by customers, as well.
In order to improve the situation, the novel hybrid MCDM framework for the strategic quality improvement part selection problem was developed integrating fuzzy DEMATEL, anti-entropy and the fuzzy VIKOR technique. The combined weight of criteria, including subjective and objective items, is embedded into the typical fuzzy VIKOR procedure to obtain the ranking orders. The ranking results show their high conformance with Shemshadi’s and Chaghooshi’s method by taking the subjectivity and objectivity into account. Through the result analysis, the R/1000 and TGW/1000 criteria have been improved dramatically compared to existing decision methods. In addition, the proposed framework shows the flexibility of decision making by adjusting the decision parameters, and the sensitivity analysis shows its robustness.
Managers would adopt the proposed MCDM framework to decide the QIP part integrating multiple representatives’ opinions instead of a monopoly determination, especially when the resource is limited. Those failure parts with high priorities need quality improvement action compared to those parts ranking as inferior.
5.2. Limitations and Future Research
The hybrid MCDM framework is designed and implemented in an auto factory, while the validity of the methodology in different applied environments and organizations needs to be discussed and verified, as well as the established hierarchy criteria structure. In addition, we also could realize the dynamic selection by integrating the evaluation information of different time spans. With the development of intelligent decision making techniques, in order to improve the rationality and objectivity of the decision information, the evaluation matrix can be obtained intelligently from more involvements. The computer-based techniques and management information system (global quality research system and warranty information system) also could be integrated and developed to put the intelligence selection into practice in the future.
Acknowledgments
We appreciate the anonymous referees and the editor for their remarkable comments and manuscript processing. The work is supported by the Research Fund for the Doctoral Program of Higher Education (RFDP) (20130191110045), the National Key Technology Support Program (2015BAH46F01 and 2015BAF05B03), the Fundamental Research Funds for Central University (CDJZR 13110048, CDJZR 14110001 and 106112015CDJSK02JD05) and the Chongqing Science and Technology Research Program (cstc2015yykfC-6002, cstc2015ZDCY-ZTZX60009 and cstc2014yykfA40006). In addition, we wish to thank the Automotive Collaborative Innovation Center (ACIC) at Chongqing University (CQU) and the CA automotive organization.
Author Contributions
Fuli Zhou and Xu Wang designed the research, and Fuli Zhou drafted, edited and revised the manuscript. Yun Lin and Yandong He provided support on the data collection and enterprise survey. Lin Zhou provided extensive suggestions throughout the study and draft. The discussion was a team task. In addition, all authors have cooperated to revise the draft about both the content and English expression. All authors have read and approved the final manuscript.
Conflicts of Interest
The authors declare no conflict of interest.
References
- Enquist, B.; Edvardsson, B.; Petros Sebhatu, S. Values-based service quality for sustainable business. Manag. Serv. Qual. Int. J. 2007, 17, 385–403. [Google Scholar] [CrossRef]
- Putri, T.; Yusof, M. Critical success factors for implementing quality engineering (QE) in Malaysian’s and Indonesian’s automotive industries: A proposed model. Int. J. Autom. Ind. Manag. 2008, 2, 1–15. [Google Scholar]
- Erginel, N.; Hasırcı, A. Reduce the failure rate of the screwing process with six sigma approach. In Proceedings of the 2014 International Conference on Industrial Engineering and Operations Management, Bali, Indonesia, 7–9 January 2014.
- Talib, F.; Rahman, Z.; Qureshi, M.N. Prioritising the practices of total quality management: An analytic hierarchy process analysis for the service industries. Total Qual. Manag. Bus. Excell. 2011, 22, 1331–1351. [Google Scholar] [CrossRef]
- Ahire, S.L.; Rana, D.S. Selection of TQM pilot projects using an MCDM approach. Int. J. Qual. Reliab. Manag. 1995, 12, 61–81. [Google Scholar] [CrossRef]
- Mardani, A.; Jusoh, A.; Zavadskas, E.K.; Zakuan, N.; Valipour, A.; Kazemilari, M. Proposing a new hierarchical framework for the evaluation of quality management practices: A new combined fuzzy hybrid MCDM approach. J. Bus. Econ. Manag. 2016, 17, 1–16. [Google Scholar] [CrossRef]
- Murthy, D.N.P.; Djamaludin, I. New product warranty: A literature review. Int. J. Prod. Econ. 2002, 79, 231–260. [Google Scholar] [CrossRef]
- Van de Water, H.; de Vries, J. Choosing a quality improvement project using the analytic hierarchy process. Int. J. Qual. Reliab. Manag. 2006, 23, 409–425. [Google Scholar] [CrossRef]
- Juran, J.; Godfrey, A.B. Quality Handbook; McGraw-Hill: New York City, NY, USA, 1999. [Google Scholar]
- Taguchi, G.; Chowdhury, S.; Wu, Y. Taguchi's Quality Engineering Handbook; Wiley: Verlag, German, 2005. [Google Scholar]
- Vinodh, S.; Kumar Chintha, S. Application of fuzzy QFD for enabling leanness in a manufacturing organisation. Int. J. Prod. Res. 2011, 49, 1627–1644. [Google Scholar] [CrossRef]
- Sabet, E.; Adams, E.; Yazdani, B. Quality management in heavy duty manufacturing industry: TQM vs. Six Sigma. Total Qual. Manag. Bus. Excell. 2014, 27, 215–225. [Google Scholar] [CrossRef]
- Kumar, M.; Antony, J.; Rae Cho, B. Project selection and its impact on the successful deployment of Six Sigma. Bus. Process Manag. J. 2009, 15, 669–686. [Google Scholar] [CrossRef]
- Srinivasan, K.; Muthu, S.; Devadasan, S.; Sugumaran, C. Enhancement of sigma level in the manufacturing of furnace nozzle through DMAIC approach of Six Sigma: A case study. Prod. Plan. Control 2016. [Google Scholar] [CrossRef]
- Ortíz, M.A.; Felizzola, H.A.; Isaza, S.N. A contrast between DEMATEL-ANP and ANP methods for six sigma project selection: A case study in healthcare industry. BMC Med. Inf. Decis. Mak. 2015. [Google Scholar] [CrossRef] [PubMed]
- Saremi, M.; Mousavi, S.F.; Sanayei, A. TQM consultant selection in SMEs with TOPSIS under fuzzy environment. Exp. Syst. Appl. 2009, 36, 2742–2749. [Google Scholar] [CrossRef]
- Alsultan, H.A. A Clustering Based Matrix for Selecting Optimal Tools and Techniques in Quality Management; University of Northern Iowa: Cedar Falls, IA, USA, 2014. [Google Scholar]
- Kabir, G.; Sumi, R.S. Integrating fuzzy analytic hierarchy process with PROMETHEE method for total quality management consultant selection. Prod. Manufact. Res. 2014, 2, 380–399. [Google Scholar]
- Bilgen, B.; Şen, M. Project selection through fuzzy analytic hierarchy process and a case study on Six Sigma implementation in an automotive industry. Prod. Plan. Control 2012, 23, 2–25. [Google Scholar] [CrossRef]
- Drake, P.R.; Lee, D.M. Component prioritisation for strategic purchasing and the case study of a South Korean elevator manufacturer. Int. J. Adv. Manufact. Technol. 2008, 43, 883–895. [Google Scholar] [CrossRef]
- Razmi, J.; Rafiei, H. An integrated analytic network process with mixed-integer non-linear programming to supplier selection and order allocation. Int. J. Adv. Manufact. Technol. 2009, 49, 1195–1208. [Google Scholar] [CrossRef]
- Mirhedayatian, S.M.; Azadi, M.; Saen, R.F. A novel network data envelopment analysis model for evaluating green supply chain management. Int. J. Prod. Econ. 2014, 147, 544–554. [Google Scholar] [CrossRef]
- Junior, F.R.L.; Osiro, L.; Carpinetti, L.C.R. A comparison between fuzzy AHP and fuzzy TOPSIS methods to supplier selection. Appl. Soft Comput. 2014, 21, 194–209. [Google Scholar] [CrossRef]
- Zandi, A.; Roghanian, E. Extension of fuzzy ELECTRE based on VIKOR method. Comput. Ind. Eng. 2013, 66, 258–263. [Google Scholar] [CrossRef]
- Yeh, W.-C.; Chuang, M.-C. Using multi-objective genetic algorithm for partner selection in green supply chain problems. Exp. Syst. Appl. 2011, 38, 4244–4253. [Google Scholar] [CrossRef]
- liu, H.-C.; You, J.-X.; You, X.-Y.; Shan, M.-M. A novel approach for failure mode and effects analysis using combination weighting and fuzzy VIKOR method. Appl. Soft Comput. 2015, 28, 579–588. [Google Scholar] [CrossRef]
- Gandhi, S.; Mangla, S.K.; Kumar, P.; Kumar, D. A combined approach using AHP and DEMATEL for evaluating success factors in implementation of green supply chain management in Indian manufacturing industries. Int. J. Logist. Res. Appl. 2016, 3, 1–25. [Google Scholar] [CrossRef]
- Mohammadshahi, Y. A state-of-art survey on TQM applications using MCDM techniques. Decis. Sc. Lett. 2013, 2, 125–134. [Google Scholar] [CrossRef]
- Mardani, A.; Jusoh, A.; Zavadskas, E.K. Fuzzy multiple criteria decision-making techniques and applications—Two decades review from 1994 to 2014. Exp. Syst. Appl. 2015, 42, 4126–4148. [Google Scholar] [CrossRef]
- Dincer, H.; Gorener, A. Performance evaluation using AHP-VIKOR and AHPTOPSIS approaches: The case of service sector. Sigma J. Eng. Nat. Sci. 2011, 29, 244–260. [Google Scholar]
- Rahman, M.A.; Ali, A. Defining service quality index preferences in a service industry using analytic hierarchy process. In Proceedings of the 2015 International Conference on Industrial Engineering and Operations Management (IEOM), Dubai, United Arab Emirates, 3–5 March 2015; pp. 1–7.
- Wang, Y.-M.; Chin, K.-S.; Poon, G.K.K.; Yang, J.-B. Risk evaluation in failure mode and effects analysis using fuzzy weighted geometric mean. Exp. Syst. Appl. 2009, 36, 1195–1207. [Google Scholar] [CrossRef]
- Liu, H.-C.; Liu, L.; Liu, N.; Mao, L.-X. Risk evaluation in failure mode and effects analysis with extended VIKOR method under fuzzy environment. Exp. Syst. Appl. 2012, 39, 12926–12934. [Google Scholar] [CrossRef]
- Teli, S.; Majali, V.; Bhushi, U.; Gaikwad, L.; Surange, V. Cost of poor quality analysis for automobile industry: A case study. J. Inst. Eng. Ser. C 2013, 94, 373–384. [Google Scholar]
- Freiesleben, J. The economic effects of quality improvement. Total Qual. Manag. Bus. Excell. 2005, 16, 915–922. [Google Scholar] [CrossRef]
- Murthy, D.P.; Blischke, W.R. Warranty Management and Product Manufacture; Springer Science & Business Media: Berlin, Germany, 2006. [Google Scholar]
- Donauer, M.; Peças, P.; Azevedo, A.L. Nonconformity tracking and prioritisation matrix: An approach for selecting nonconformities as a contribution to the field of TQM. Prod. Plan. Control 2014, 26, 131–149. [Google Scholar] [CrossRef]
- Ahtamad, M. Evaluating Automotive Sound Quality: The Disconnect between Market Research and Structured Evaluations; University of Warwick: Coventry, UK, 2013. [Google Scholar]
- Salvado, M.; Azevedo, S.; Matias, J.; Ferreira, L. Proposal of a sustainability index for the automotive industry. Sustainability 2015, 7, 2113–2144. [Google Scholar] [CrossRef]
- Zhao, H.; Guo, S. External benefit evaluation of renewable energy power in China for sustainability. Sustainability 2015, 7, 4783–4805. [Google Scholar] [CrossRef]
- Shu, W.; Qian, W. An incremental approach to attribute reduction from dynamic incomplete decision systems in rough set theory. Data Knowl. Eng. 2015, 100, 116–132. [Google Scholar] [CrossRef]
- Mandal, S.; Singh, K.; Behera, R.K.; Sahu, S.K.; Raj, N.; Maiti, J. Human error identification and risk prioritization in overhead crane operations using HTA, SHERPA and fuzzy VIKOR method. Exp. Syst. Appl. 2015, 42, 7195–7206. [Google Scholar] [CrossRef]
- Xu, W.; Li, Y.; Liao, X. Approaches to attribute reductions based on rough set and matrix computation in inconsistent ordered information systems. Knowl. Based Syst. 2012, 27, 78–91. [Google Scholar] [CrossRef]
- Jassbi, J.; Mohamadnejad, F.; Nasrollahzadeh, H. A fuzzy DEMATEL framework for modeling cause and effect relationships of strategy map. Exp. Syst. Appl. 2011, 38, 5967–5973. [Google Scholar] [CrossRef]
- Sun, C.-C. A performance evaluation model by integrating fuzzy AHP and fuzzy TOPSIS methods. Exp. Syst. Appl. 2010, 37, 7745–7754. [Google Scholar] [CrossRef]
- Chaghooshi, A.; Arab, A.; Dehshiri, S. A fuzzy hybrid approach for project manager selection. Decis. Sci. Lett. 2016, 5, 447–460. [Google Scholar] [CrossRef]
- Pamučar, D.; Ćirović, G. The selection of transport and handling resources in logistics centers using Multi-Attributive Border Approximation area Comparison (MABAC). Exp. Syst. Appl. 2015, 42, 3016–3028. [Google Scholar] [CrossRef]
- Shemshadi, A.; Shirazi, H.; Toreihi, M.; Tarokh, M.J. A fuzzy VIKOR method for supplier selection based on entropy measure for objective weighting. Exp. Syst. Appl. 2011, 38, 12160–12167. [Google Scholar] [CrossRef]
© 2016 by the authors; licensee MDPI, Basel, Switzerland. This article is an open access article distributed under the terms and conditions of the Creative Commons Attribution (CC-BY) license (http://creativecommons.org/licenses/by/4.0/).