Article

Study on the Evolvement of Technology Development and Energy Efficiency—A Case Study of the Past 30 Years of Development in Shanghai

1
MacEwan School of Business, Grant MacEwan University, Edmonton, Alberta T5J 4S2, Canada
2
Antai College of Economics and Management, Shanghai Jiao Tong University, Shanghai 200030, China
*
Author to whom correspondence should be addressed.
Sustainability 2016, 8(5), 457; https://doi.org/10.3390/su8050457
Submission received: 1 February 2016 / Revised: 13 April 2016 / Accepted: 21 April 2016 / Published: 9 May 2016

Abstract

:
Previous research in regional energy efficiency by using macro statistical data has demonstrated that technology development could improve regional energy efficiency. Since the start of reform and opening up in 1978, China has mainly adopted energy import and foreign direct investment to promote economic growth. At the same time, the country has also increased the input of technology and R&D to prompt technological reformation and imported technology absorption. However, there is limited research on the relationship between technology development and energy efficiency. Using the grounded theory method, the authors of this paper study the relationship between technology input-output and energy utilization efficiency in Shanghai over the past 30 years. They conclude that although the tactics of technology import and foreign direct investment can improve energy efficiency in the initial stages of modern industrialization, they cannot improve it continuously. In the more advanced stages of modern industrialization, the improvement of energy efficiency relies not only on increased R&D investment but also on R&D investment structure optimization and independent technological innovation.

1. Introduction

1.1. Research Background and Purpose

Past research in regional energy efficiency [1] using macro statistical data has demonstrated that technological progress could improve regional energy efficiency. Since reform and opening up, China has mainly adopted imported technology and foreign direct investment to promote economic growth [2,3]. At the same time, it has also increased input of technology and R&D, actively prompted technological reformation and imported technology absorption. However, the relationship between technological progress tactics (including imported technology, foreign direct investment and imported technology absorption) and the efficiency of energy utilization has garnered virtually no research thus far.
This paper uses grounded theory methodology to study the relationship between technology input (including R&D investment, imported technology investment, foreign direct investment and the technology contributing rate) and energy utilization efficiency in Shanghai over the past 30 years. Its purpose is to explore the evolving relationship between regional technological progress and energy utilization efficiency, develop the theory of technological progress and energy utilization efficiency, and give a reference for enhancing technology and increasing energy utilization efficiency in other regions in China and, more generally, the world.

1.2. Research Results and Contributions

The results of this study demonstrate that from 1980 to 1990, as technology equipment import and foreign investment increased, the ratio of energy consumption to GDP (ton SCE per 10,000 yuan) decreased from 6.8 in 1980 to 4.2 in 1990. It further decreased from 4.2 in 1990 to 1.2 in 2001, as Shanghai enhanced the strength of technology import and foreign investment. From 2002 to 2009, the ratio of energy consumption to GDP was 1.0 as a constringency state, although technology import and foreign investment increased significantly. In the past 30 years, the percentage of R&D investment to GDP increased from 0.48% in 1978, to 2.81% in 2009. There is a significant negative correlation between this percentage and energy consumption of GDP (−0.89); the number of patents and output of technology have no correlation with energy consumption of GDP. The data show that the main technology achievements are technology reformation and absorption, and the output capacity of technology and patents are very low in Shanghai. The negative correlation between number of patent applications and energy consumption of GDP is not significant. Similarly, the effect of independent innovation capability on improving energy utilization efficiency is not significant. Therefore, conclusions of this research are as follows: the tactics of imported technology and foreign direct investment can improve energy utilization efficiency in the early stage of industrialization, but they cannot improve energy utilization efficiency sustainably. In advanced stages of industrialization, technological progress tactics must include not only R&D investment increases, but also R&D investment structure optimization. Moreover, of greatest importance is to rely on independent technological innovation to improve energy utilization efficiency.

2. Literature Review

2.1. Study on the Evolving Relationship between Technological Progress Tactics and Energy Utilization Efficiency

Energy utilization efficiency has two aspects: physical efficiency and economic efficiency. Typically, the former is used in microscopic analysis, while the latter is employed in macroscopic analysis [4,5]. Economic efficiency can also be divided into energy intensity and energy productivity, which are reciprocal. We use the rate of energy consumption per GDP to represent the energy use intensity (EUI). It is generally believed that two factors can increase energy efficiency. One is to let energy be consumed in high-efficiency industry instead of low-efficiency industry. The second factor is to increase energy utilization efficiency through technological progress. Both analysis and experience have proved that energy utilization efficiency can be increased by adjusting the industrial structure [6,7,8,9,10,11,12,13,14,15,16,17]. However, few studies have examined the impact of technological progress on energy utilization efficiency using theoretical and empirical analysis. On the one hand, Sagar, Ambuj D., and Bob Van der Zwaan claimed that public R&D deployment and learn-by-doing contribute to technological progress and in result, technological innovation is fundamental for rendering the energy economy cleaner and more efficient with concomitant economic ,developmental, and environmental benefit [18]. On the other hand, when it comes to the topic of the asymmetric energy policy shocks in EU, Brada, J.C. examined the technological progress and factor utilization in Eastern European economic growth and revealed the fact that the slowdown in industrial growth in these countries is due to a decline in the efficiency or intensity of factor utilization rather than to decline rates of growth of technological progress [19]. Last but not the least, Foxon, T.J., Gross, R., Chase, A., Howes, J., Arnall, A., and Anderson, D. analyzed current innovation systems in the UK for a range of new and renewable energy technologies, and generate policy recommendations for improving the effectiveness of these innovation systems [20]. The study reinforced the importance of policy incentives to overcome specific system failures, particularly those created by “gaps” between policy measures, such that technologies cannot progress easily from one stage to the next within the UK.
The study by Xu and Jiang showed that there are connections between energy utilization efficiency and technological progress [21]. The industrial structure and the price of energy are also two causes of the change of energy utilization efficiency. After analyzing the United States information fixed assets investment and R&D investment, Zhang and Xiao find that increasing R&D investment and information technological progress can enhance energy utilization efficiency [22]. Further, in Jacobsen’s opinion, we must analyze the impact of the contemporary technology progress and related policies on energy consumption while analyzing long-term energy requirements [23]. In summary, technological progress can increase energy utilization efficiency by affecting the energy system directly and indirectly. In theory, whether technological progress can increase energy utilization efficiency still remains uncertain because of the rebound effect: more energy resources will be consumed as the economy increases due to technological progress. This rebound effect is raised by Khazzoom [24], and means that on the one hand, technological progress saves energy by increasing energy utilization efficiency, while on the other hand, it prompts the economy and causes new demands for energy; hence, it partially offsets the saved energy [25]. The rebound effect has made it more complicated to analyze the impact of technological progress on energy utilization efficiency. Thus, the mechanism and theories of the impact of technological progress on energy utilization efficiency remain imperfect for the time being.

2.2. Study of Chinese Technological Progress and Energy Utilization Efficiency

With respect to energy consumption, China is second in the world (after the United States). However, the country’s energy utilization efficiency is very low. Its energy use intensity is twice that of the United States, four times that of Japan, and higher than the average global level [26,27,28]. Yet its macro economy strategic goals and shortage of energy require China to decrease its energy intensity as soon as possible. However, improving the industrial structure to increase energy utilization efficiency may make it hard to fulfill demand. The impact of industrial structure on energy utilization efficiency is disappearing, and even has a negative effect. Technological progress becomes the only viable method to decrease energy intensity [29] hence; closely analyzing the impact of technological progress on energy utilization efficiency is highly necessary.
In recent years, the analysis of Chinese energy utilization efficiency has gained more widespread attention. Technological progress is a major cause of the change in Chinese energy utilization efficiency. Therefore, many researchers have studied the relationship between technological progress and Chinese energy utilization efficiency. Research has shown that the main cause of the decrease in Chinese energy consumption of GDP (i.e., energy intensity) from 1987 to 1992 [30] is technological progress. Zhang arrive at the same conclusion in studying the period from 1990 to 1997 [31]. Empirical analysis demonstrated that the price of energy, R&D and the industrial structure are the three main causes of the decrease in Chinese energy intensity [32]. Fisher-Vanden et al. note that investment in R&D and training employees to promote production and innovation has decreased energy consumption intensity by 16.9% [33]. Empirical analysis of data from 29 industries shows that investment in science and technology increased energy efficiency in high energy consumption industries [34]. Zhu and Teng use the DEA method to calculate data from 29 provinces in China for the period from 1995 to 2007 [35]. Studies have also shown that the impact of technological progress and technological efficiency on energy utilization efficiency has regional disparity. The largest impact is in East China, the second-largest impact is in the West area and the lowest impact is in Central China. Li and Zhou use data from 35 industries as samples and find that technology efficiency is the main reason for the increase of energy utilization efficiency [9]. Wu and Cheng show that technological progress in industry affects energy consumption intensity greatly [36]. Chen analyzes the macro energy intensity from 1980 to 2003 in China, as well as the reasons for the decrease in energy intensity from 1993 to 2003. He concludes that technological progress is the key factor in the increase of energy utilization efficiency [37]. Xuan and Zhou find that the re-innovation of Chinese industry is positively related to energy utilization efficiency [38]. R&D contributes to Chinese energy utilization efficiency most, followed by human capital and, finally, FDI, which contributes the least [39].
As we can see in the articles mentioned above, researchers have traditionally adopted statistical methods to study technological progress and energy utilization efficiency, but they did not discriminate according to stages of industrialization. There is no research regarding technological progress and energy utilization efficiency for a specific region in China yet. There is also no research on the changing relationship between regional energy efficiency and factors such as technical activities, input and output of R&D, investment of technology import, foreign direct investment and contribution rate of technology progress. Our study explains the evolving relationship between technological progress and energy utilization efficiency in detailed analysis, as well as promoting its theoretical research.

3. Case Background and Research Method

The background of this paper is the 32-year development of Shanghai. This period is divided into early stage (1978 to 1998, R&D/GDP 0.5%–1.5%) and intermediate stage (1992 to 2009, R&D/GDP 1.5%–2.8%) of industrialization in the standard of R&D/GDP [40]. We use grounded theory and data research to analyze the relationship between R&D, technology import, FDI and other important indicators of technological progress and energy utilization efficiency.

3.1. Case Choice and Data Sources

As one of the most developed regions in China, Shanghai is the most open city in China and attracts the most direct investments from other countries. At present, all of the Fortune 500 companies have invested in Shanghai, and the region’s composite index of technological progress and energy utilization efficiency are in the leading position in China. Therefore, using Shanghai as an example in order to analyze technological progress and energy utilization in developed regions in China is justified.
Our data and information are taken primarily from the Statistic Yearbook of Shanghai, the Shanghai Technology Statistic Yearbook and other statistical information from 1978 to 2010, articles about Shanghai’s technological progress and other public reported articles [41,42].

3.2. Case Background

Located in the Yangtze River Delta in Eastern China, Shanghai sits at the mouth of the Yangtze River in the middle portion of the Chinese coast. The municipality borders the Jiangsu and Zhejiang Provinces to the west, and is bounded to the east by the East China Sea. Its convenient location has always made Shanghai a good seaport. Except a few monadnocks to the southeast, Shanghai is flat and the average altitude is around four meters. The area of Shanghai is 6340.5 square kilometers and its length from east to west is 100 kilometers. It has a subtropical monsoon climate and has four distinct seasons. There are 19 administrative areas in Shanghai. The permanent resident population is 19.21 million, the registered permanent resident population is 13.79 million and the population density is 2798 per square kilometer. Shanghai is the most crowded city in China, as well as the most important base of technology and industry, and the center of business, transport and economy.
Today, Shanghai’s six focal industries are: the manufacturing of electronic information products, the manufacturing of cars, petroleum chemicals and fine chemicals, the manufacturing of fine steel, the manufacturing of complete sets of equipment and biological medicine.
In 2009, Shanghai’s GDP, 1504.645 billion RMB, constituted 4.5% of China’s overall GDP. The average growth of GDP from 1991 to 2009 was 12%. The city’s 2009 GDP per capita was 11,563 US dollars and in the same year, direct investments inflow totaled 10,538 billion US dollars, which accounted for 11.7% in the whole country; R&D/GDP ratio reached 2.81%. The amount of imported equipment totaled 26,758,480,000 dollars. The 2009 level index of comprehensive technological progress of Shanghai was 78.8%, which made it first in China. The GDP energy intensity was 0.727% —third in the country.
In recent years, Shanghai made structural adjustments as its main effort to accelerate the change of economic development.

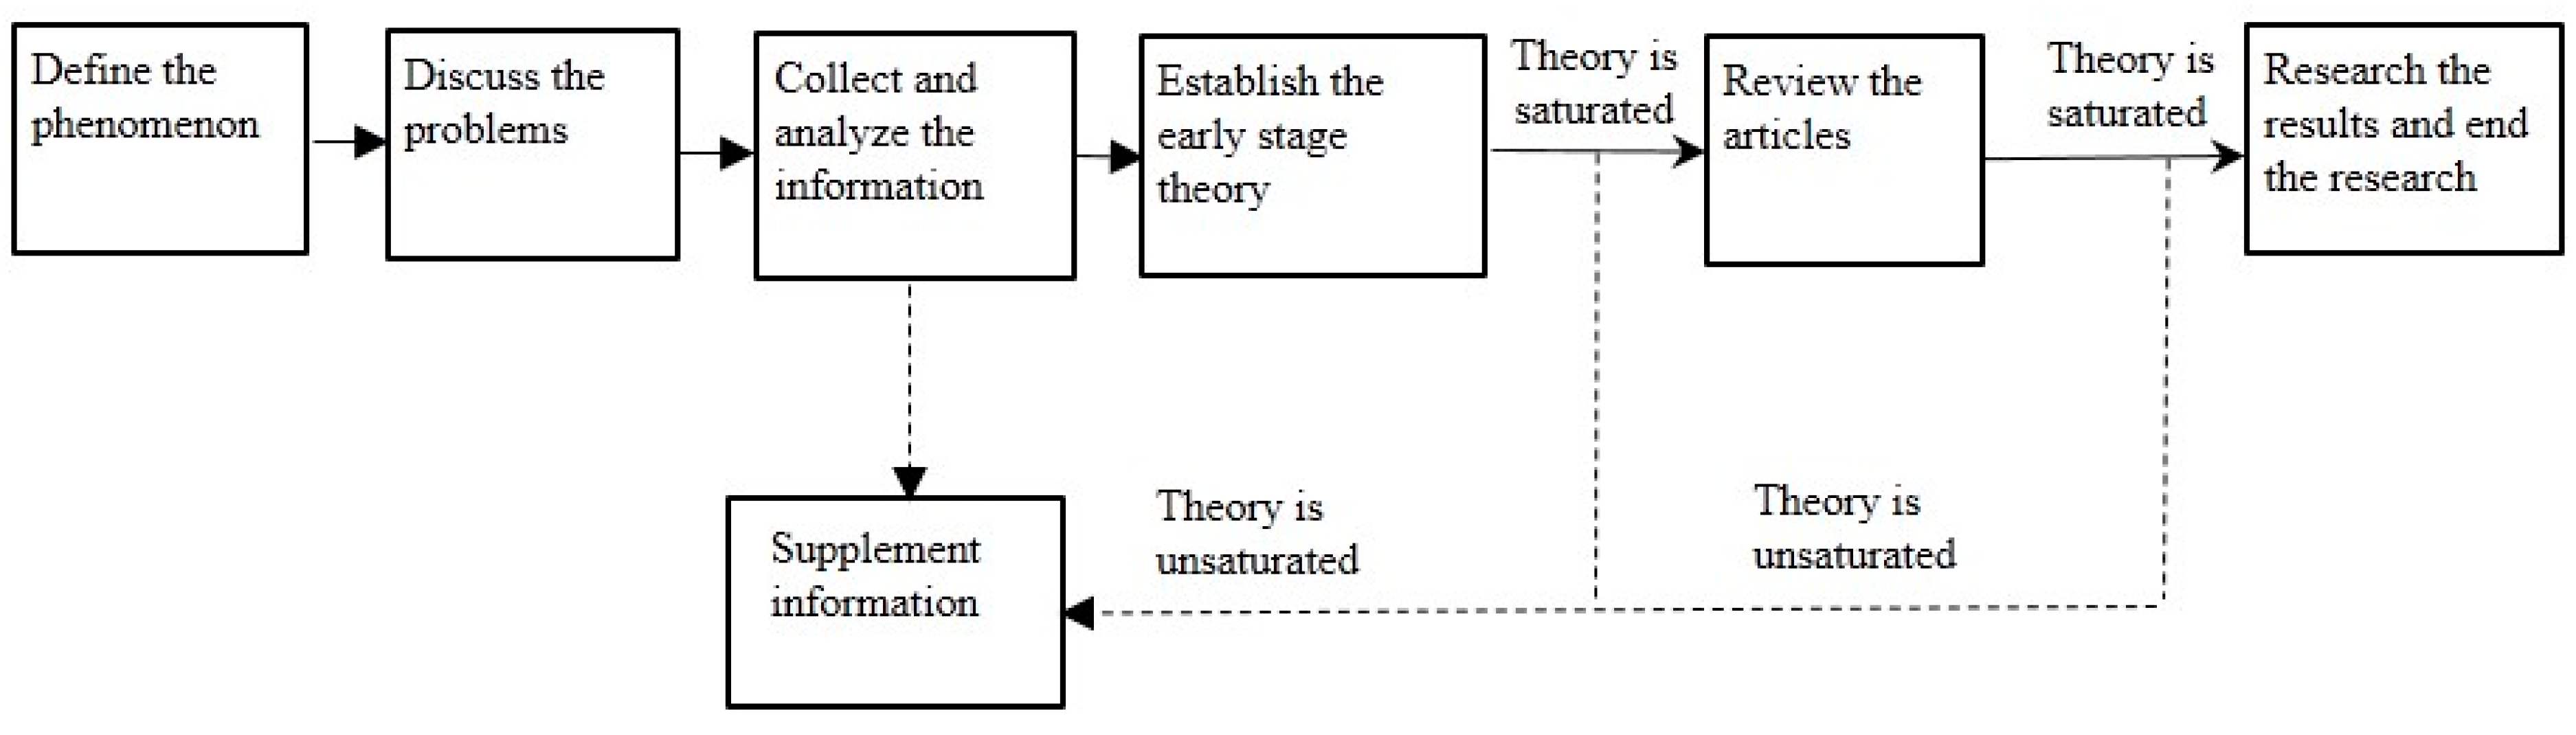
3.3. Method of Case Analysis

The goal of grounded theory is to describe the meaning and essence of a phenomenon and establish a theory that is suitable for explaining that information. Grounded theory is a process of comparing, thinking, analyzing and transferring information into a concept to establish a theory. The result is a conclusion that has been developed by analyzing information systemically and has been proved temporarily. This makes the analysis procedure academically rigorous. The grounded theory emphasizes theory development, and the theory roots in actual information and continued interaction of information and analysis [43,44].
Firstly, we affirm our research problem: the relationship between the investment of technological progress and the GDP energy consumption. According to the research problem, we collect data and information. After analyzing technological progress and GDP energy consumption in Shanghai from 1978 to 2009, we analyze the technological progress and GDP energy consumption in the early stage (1978 to 1998) and intermediate stage (1999 to 2009), respectively.
We analyze the data and information strictly by using grounded theory. First, we code openly the main factors and actions that can affect technological progress and conceptualize the data. We then code them relatively, analyzing the conceptions which have already formed. In this step, we establish that the relationship between the factors of technological progress and GDP energy consumption intensity is the most important. Next, we do core coding and core the attribute concepts related to second-level codes. Finally, we raise the research propositions and establish the theory based on grounded theory.
The process of coding and analyzing the data and information can be found in Appendix Table A1, Table A2, and Table A3. The whole research process is shown in Figure 1.

4. Research Results

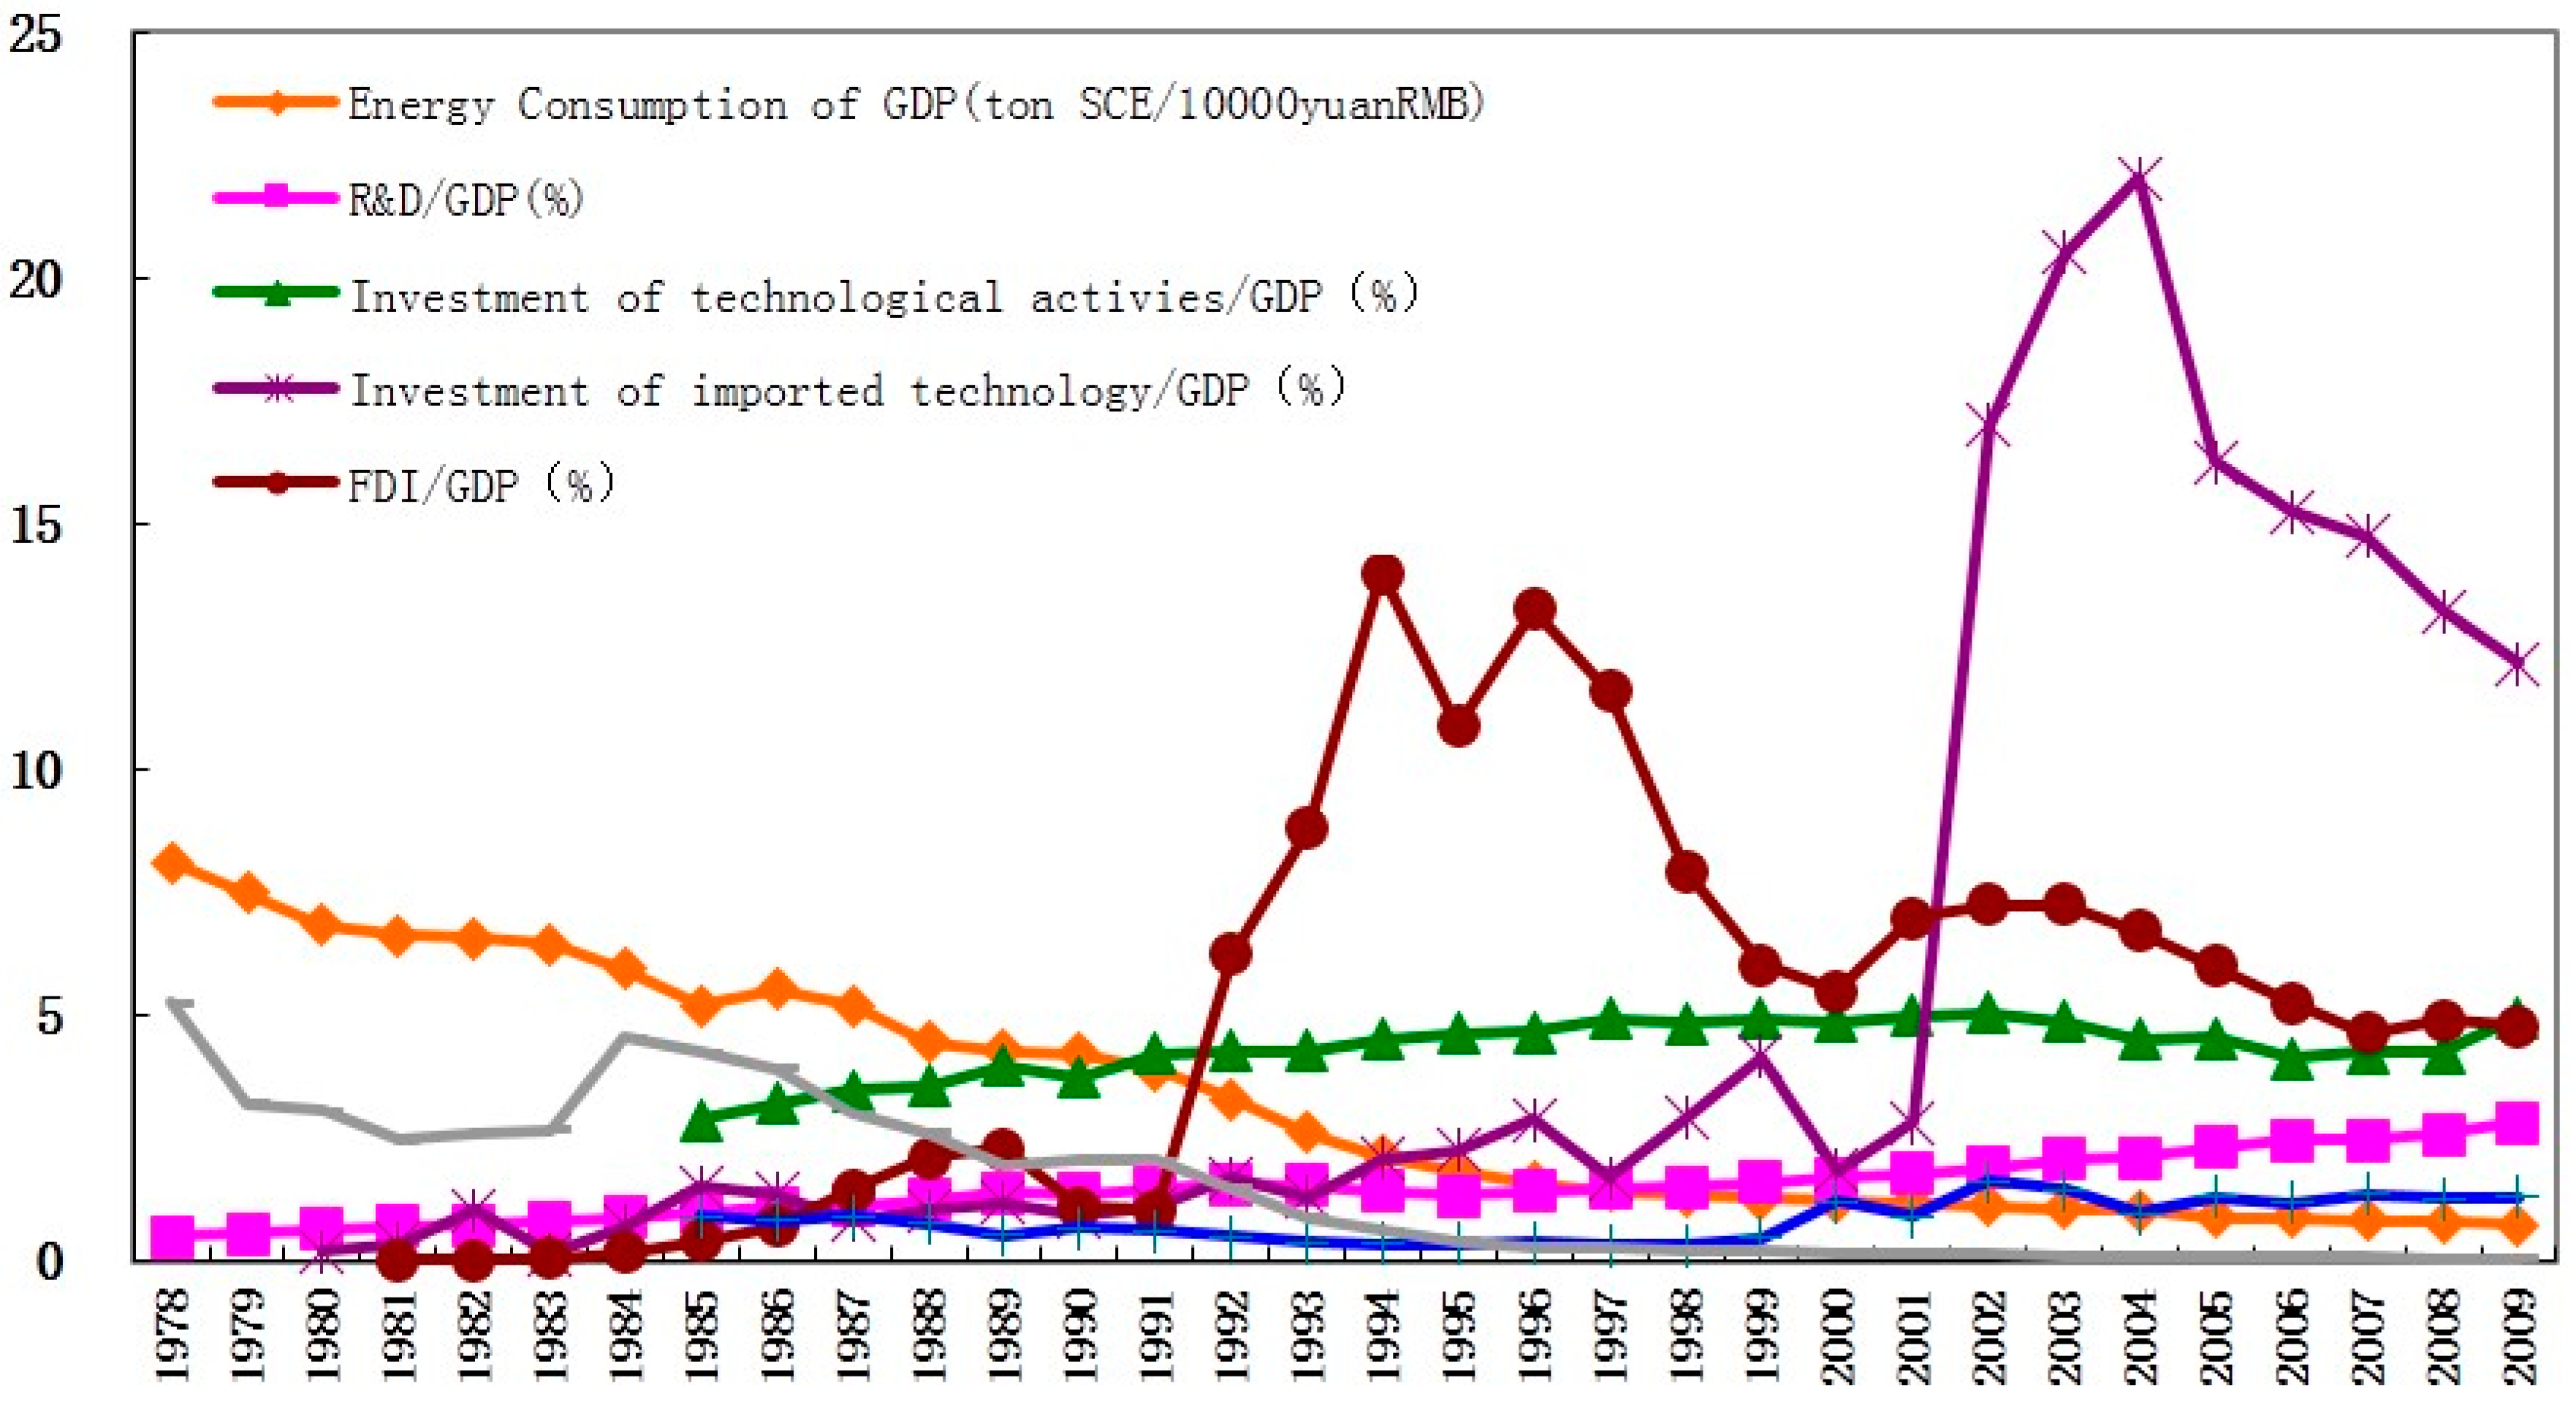
4.1. The Relationship of Technological Progress and GDP Energy Consumption

We analyze the investment and output indicators of technological progress and GDP energy consumption in Shanghai (1978 to 2009) to observe the evolving relationship between technological progress and GDP energy consumption in the past 32 years. The time series relationship of the main investment of technology and GDP energy consumption is shown as Figure 2, and the related coefficient is in Table 1. As imported technology and investments from foreign companies increased, GDP energy consumption decreased from 6.8 tons of coal per 10,000 yuan in 1980, to 4.2 tons of coal per 10,000 yuan in 1990. During 1990 to 2001, Shanghai did more to import technology and attract indirect investment from foreign companies. GDP energy consumption continued to decrease and dropped to 1.2 tons of coal per 10,000 yuan in 2001. However, from 2002 to 2009, though imported technology and investment from foreign companies continued to increase greatly, GDP energy consumption still remained at 1 ton of coal per 10,000 yuan, and had a convergent tendency.

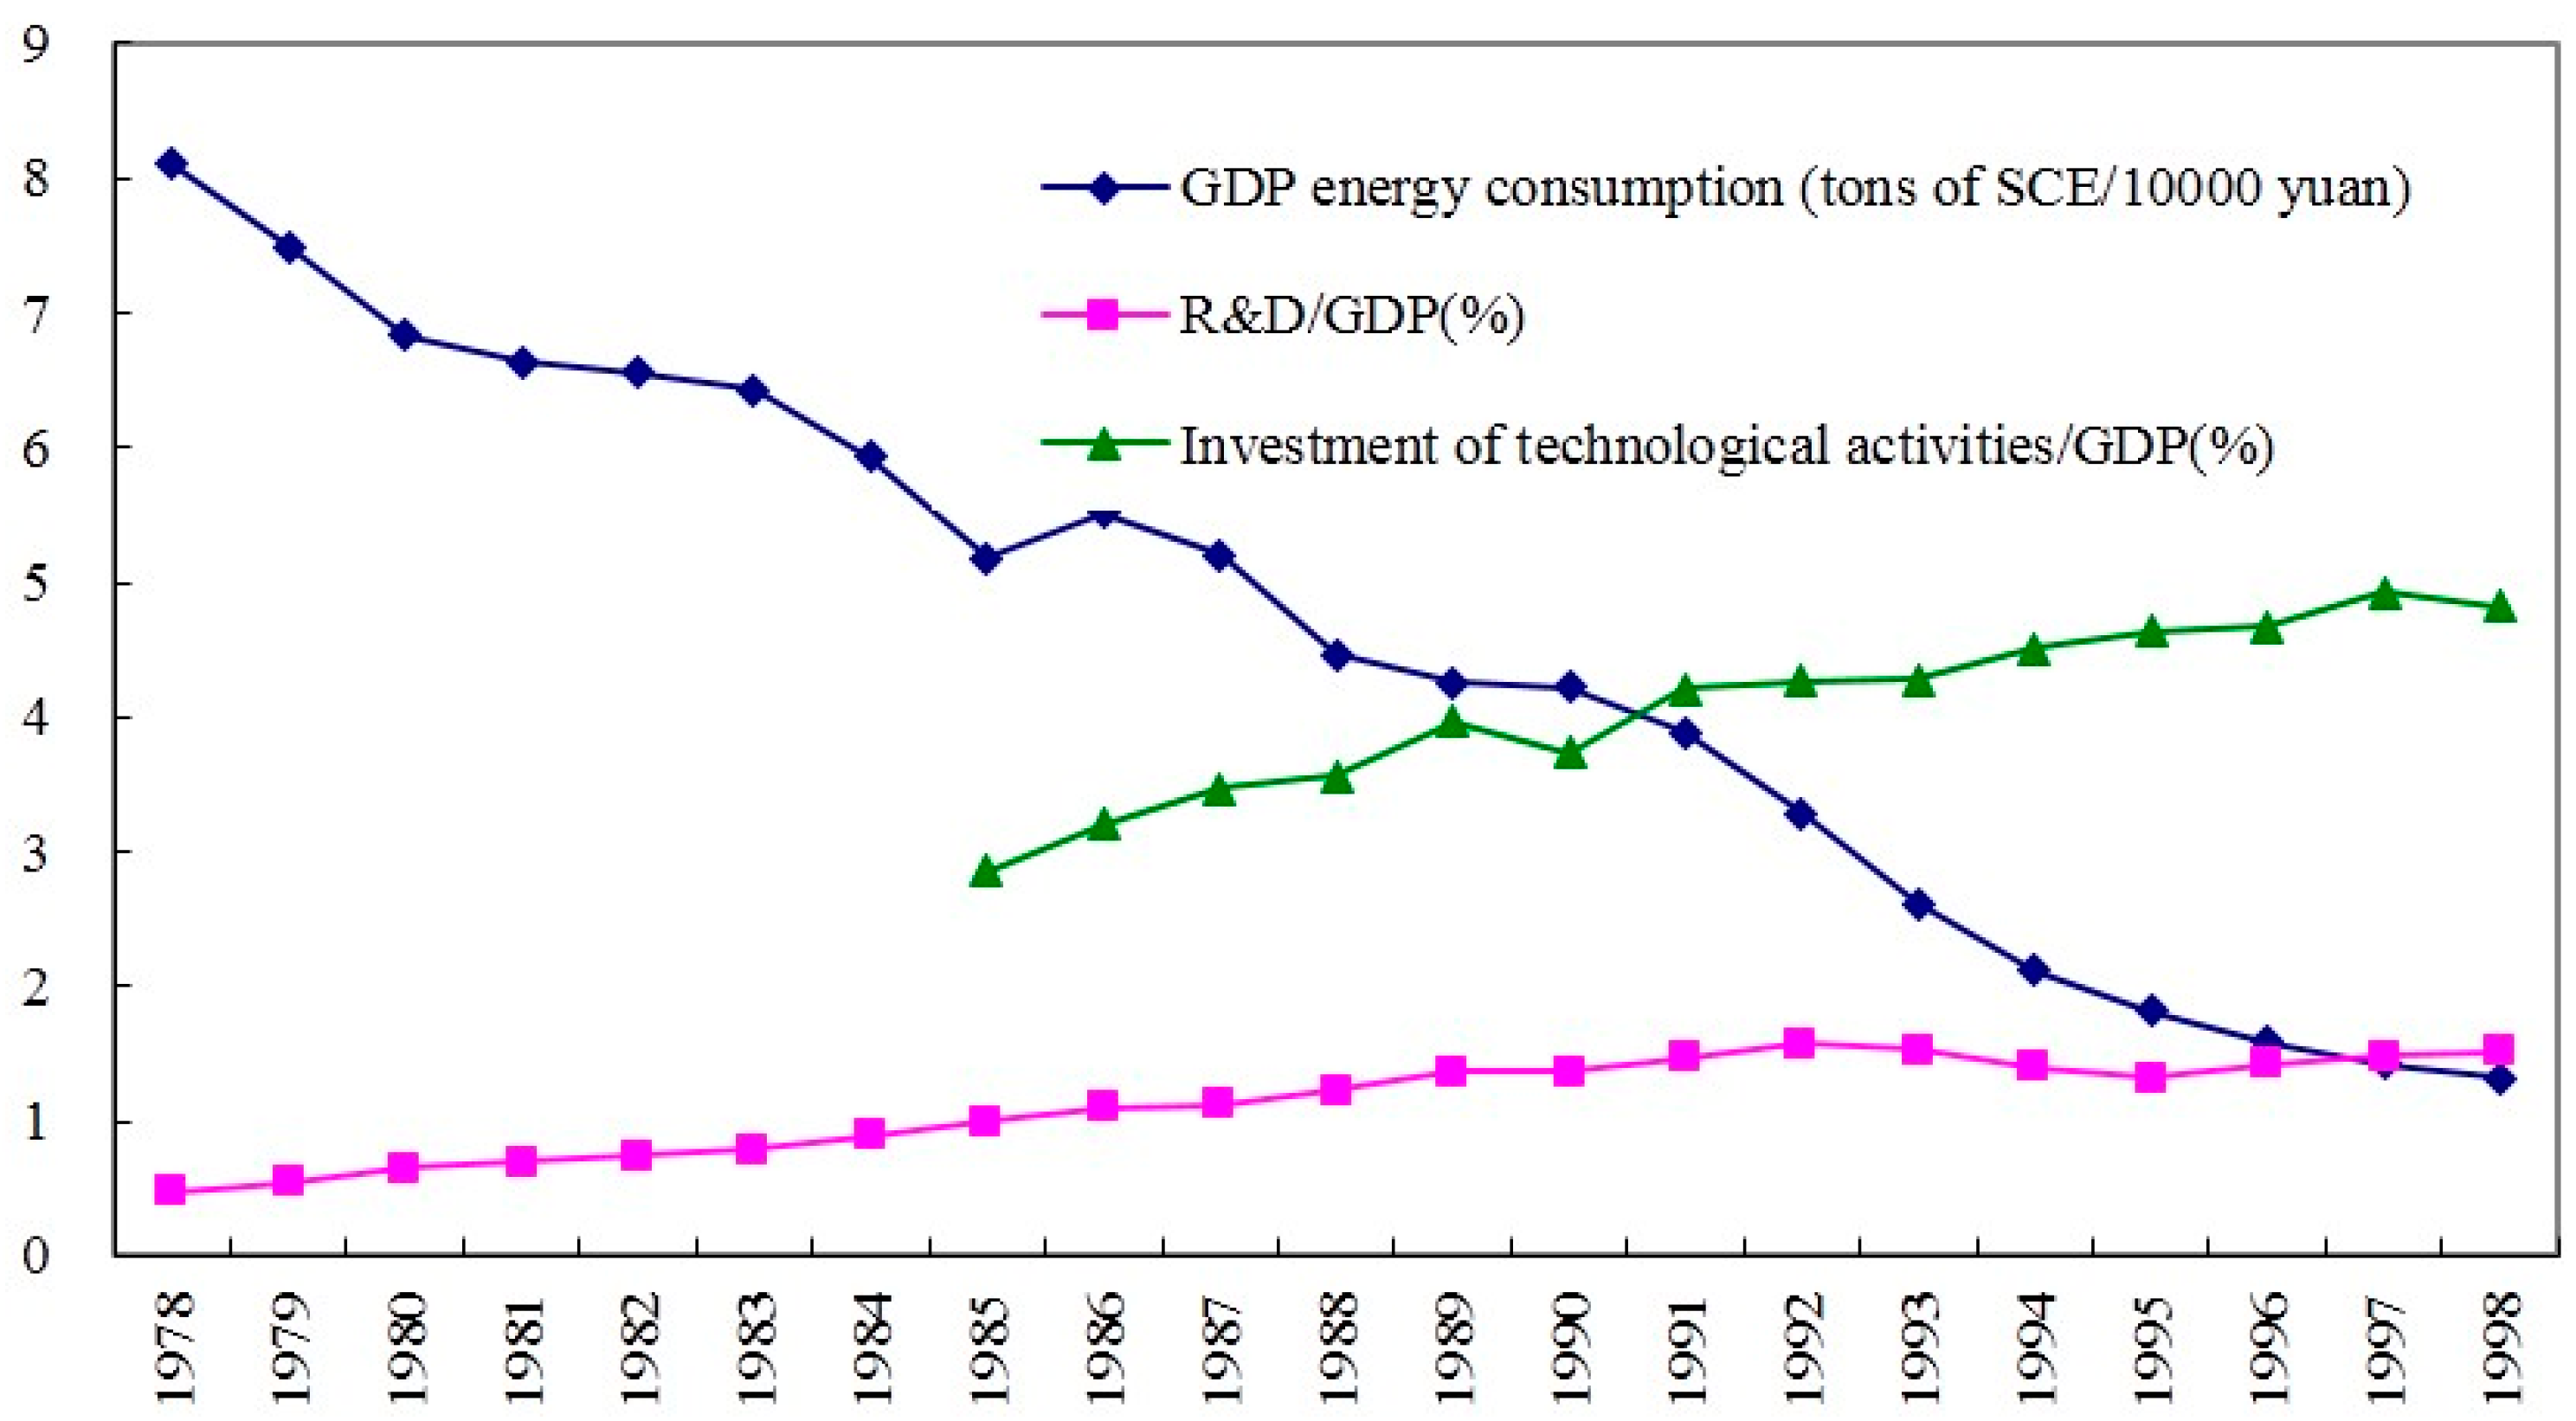
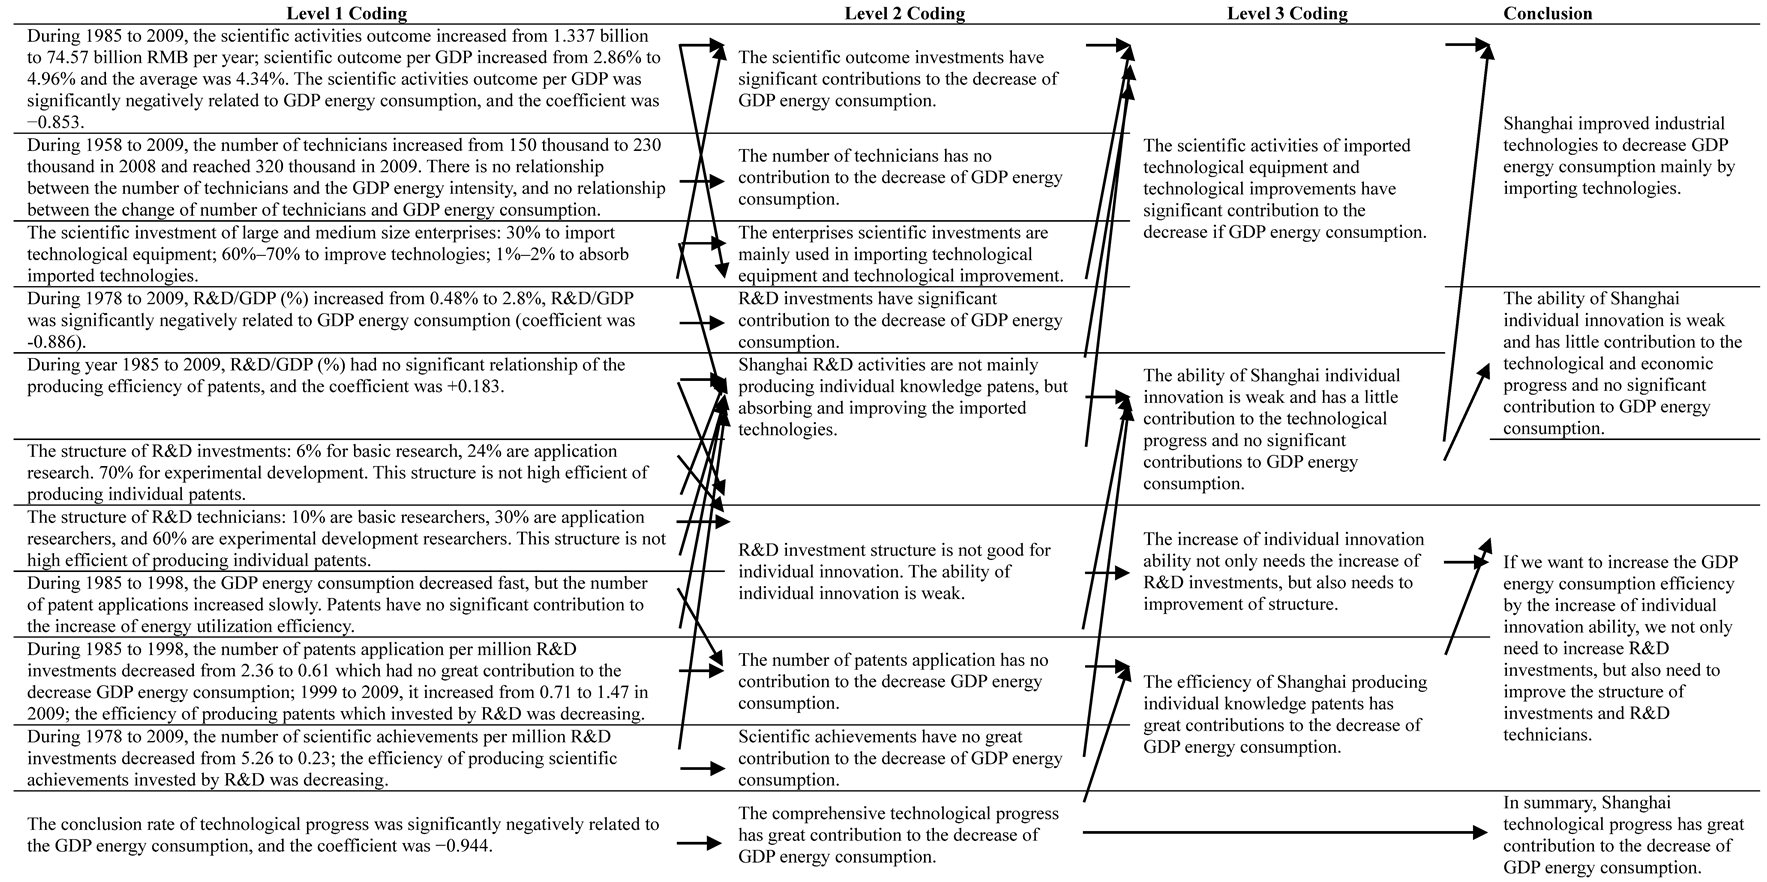
4.1.1. The Relationship between Technological Activities and GDP Energy Consumption

Through the analysis of how much technological activity costs GDP intensity and GDP energy consumption, we discovered that investment in technological activities is increasing and the average cost of scientific activities intensity is 4.34%, which is negatively related to the GDP energy consumption, and the coefficient is -0.853. Before 1979, China’s R&D investment intensity as below 0.5%, and it increased from 0.55% in 1979, to 2.81% in 2009. From 1978 to 2009, R&D investment intensity was negatively related to the GDP energy consumption, and the coefficient is −0.886. This demonstrates that during these 32 years, scientific activities and R&D investment contributed greatly to the decrease of GDP energy consumption.
From 1985 to 2008, number of researchers in Shanghai totaled about 170,000 to 220,000 and the average number was 186,000. It increased to 430,000 in 2009. From 1985 to 2009, there was no significant correlation between the number of researchers in Shanghai and GDP energy consumption; the coefficient is −0.19. To some extent, Shanghai’s technological progress mainly depended on equipment technology and other embodied technologies.

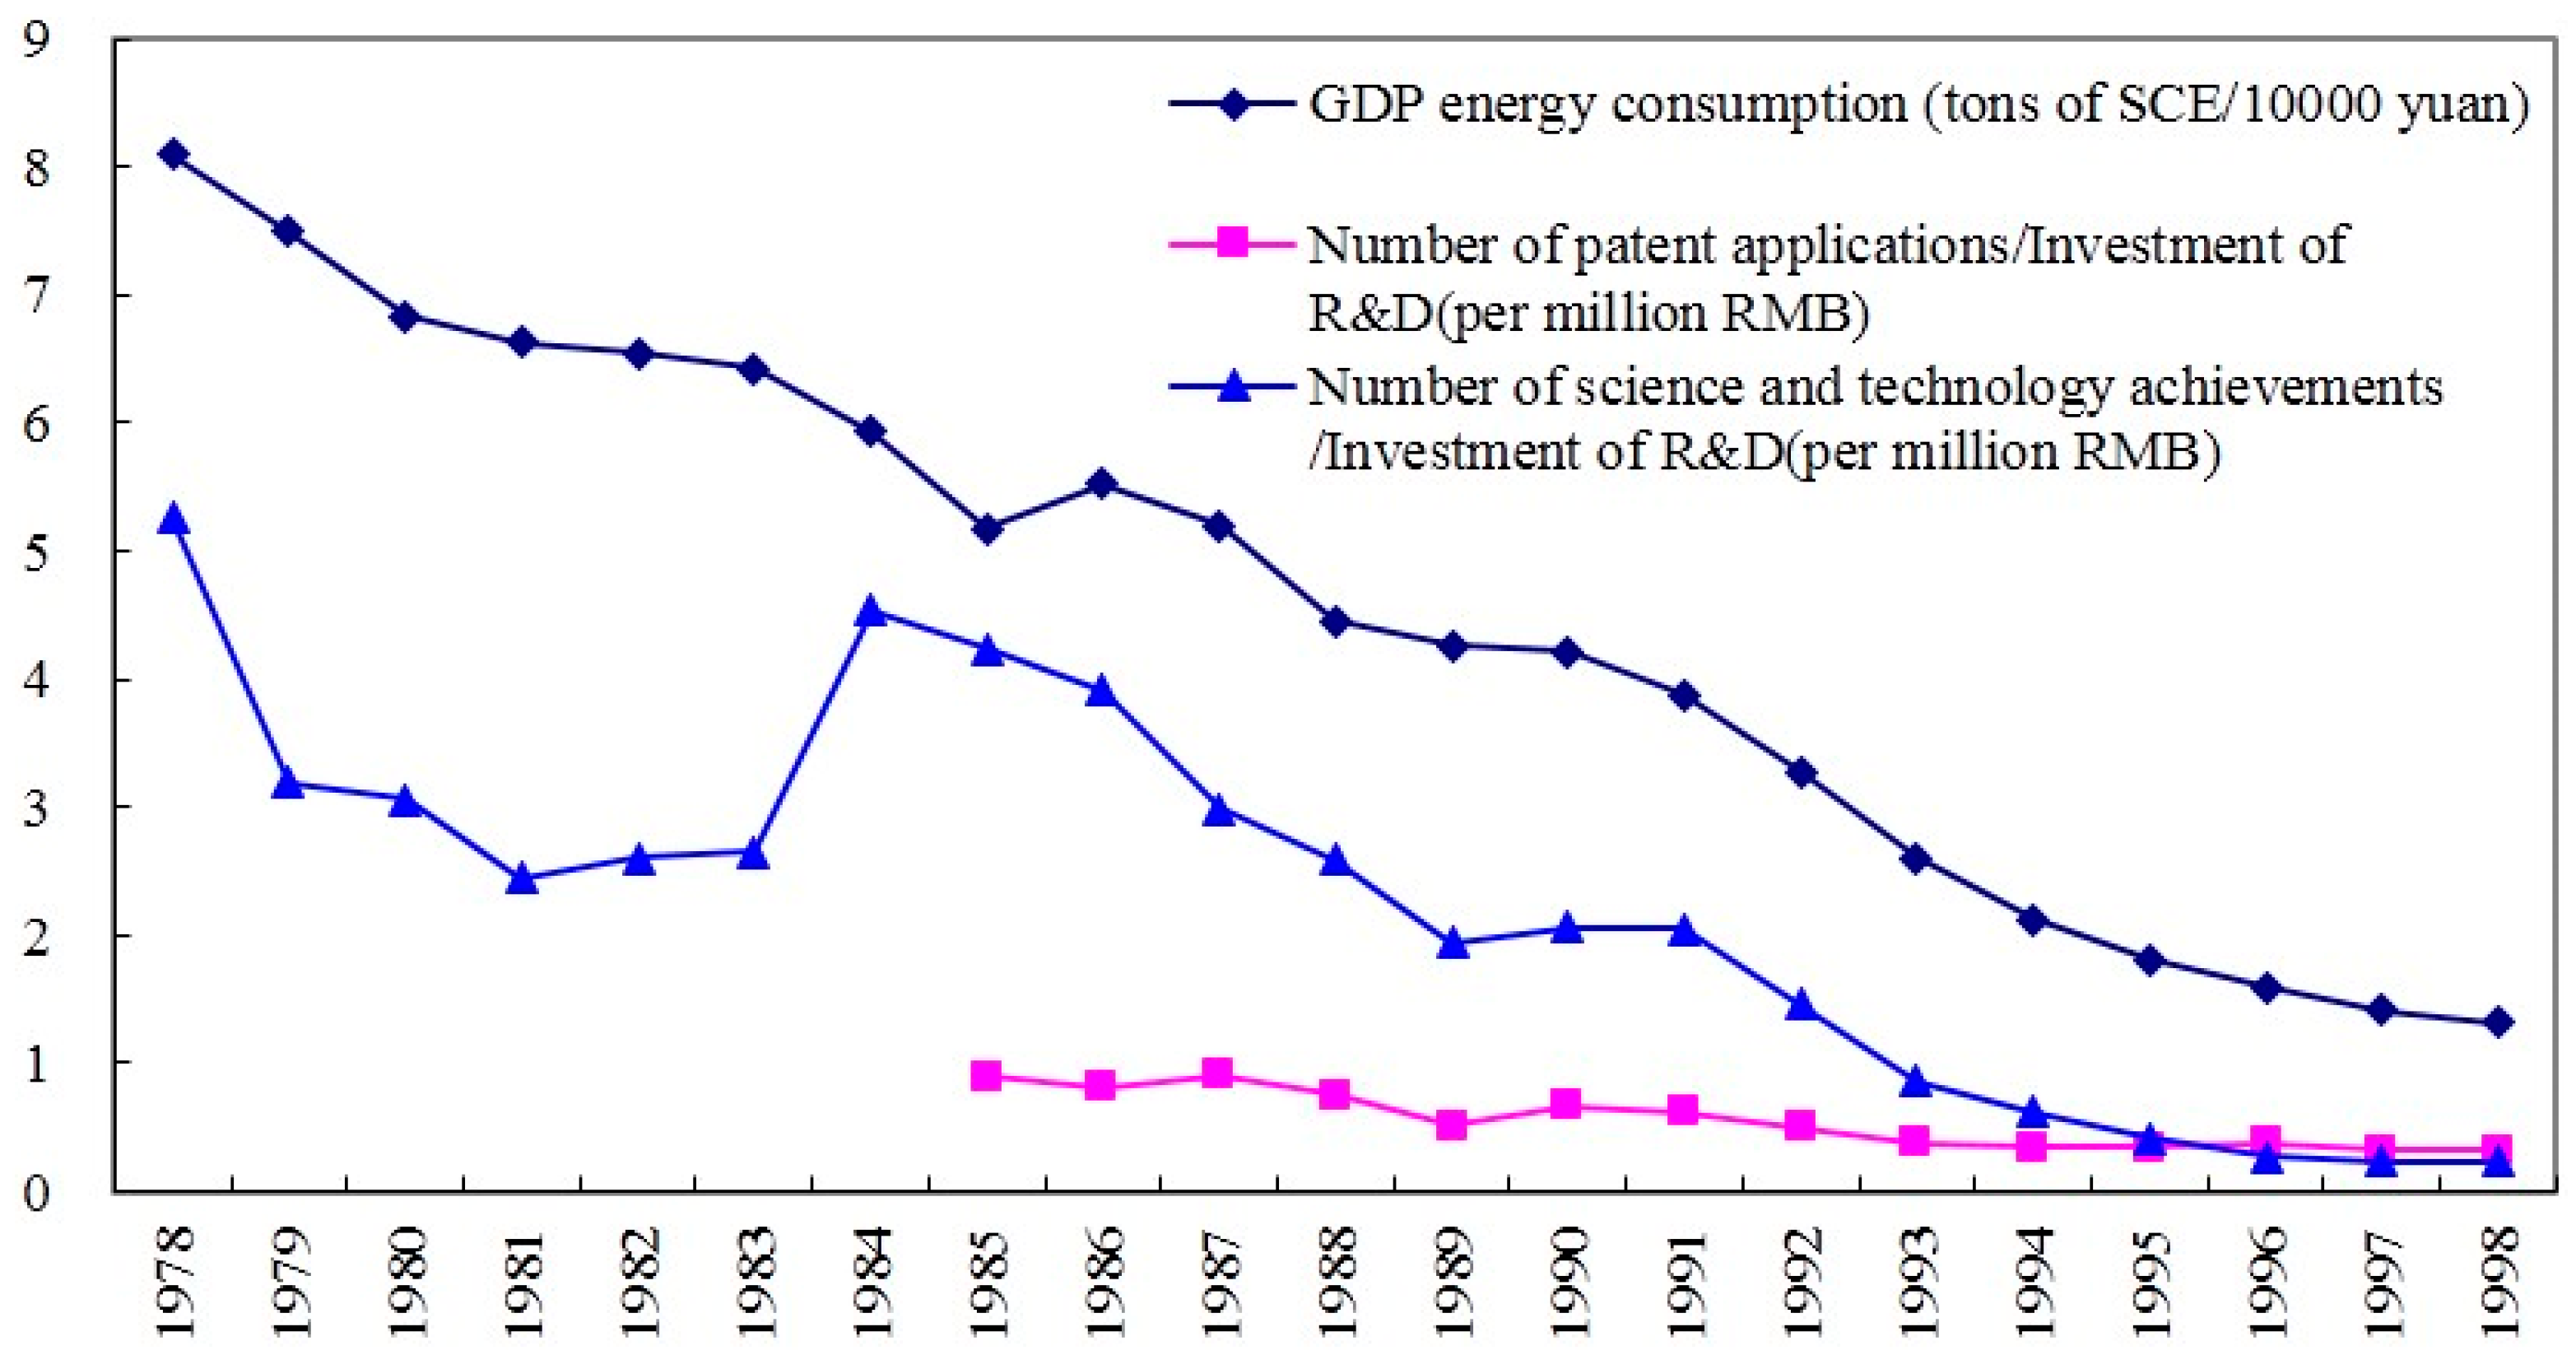
4.1.2. The Relationship between the Science and Technology Achievements, and GDP Energy Consumption

The number of Shanghai major science and technology achievements increased from 694 in 1978, to 2166 in 2009, and the average was 1547 per year. Among those achievements, about 500 a year reached the advanced international standard, while others reached the advanced internal standard. From 1978 to 2009, the number of Shanghai major science and technology achievements related to GDP energy consumption is insignificant, and the coefficient is −0.396. Technological achievements and investments in R&D, measured as 1 million RMB of R&D spending, are positively related to GDP energy consumption, and the coefficient is +0.930, indicating that Shanghai’s scientific achievements have no effect on the decrease of GDP energy consumption.
During the 25 years from 1985 to 2009, the number of applications for patents increased every year (average 14,306 per year). Among those, patents numbered 4326 per year. The number of patents resulted per million RMB of R&D spending decreased (from 0.9 in 1985) and reached its lowest point (0.32) in 1999. After that, the number increased from 0.45 in 2000, to 1.3 in 2009. During the same period, the patents efficiency that R&D invested is not significantly related to GDP energy consumption; the significance is 0.114 and the coefficient is −0.324.

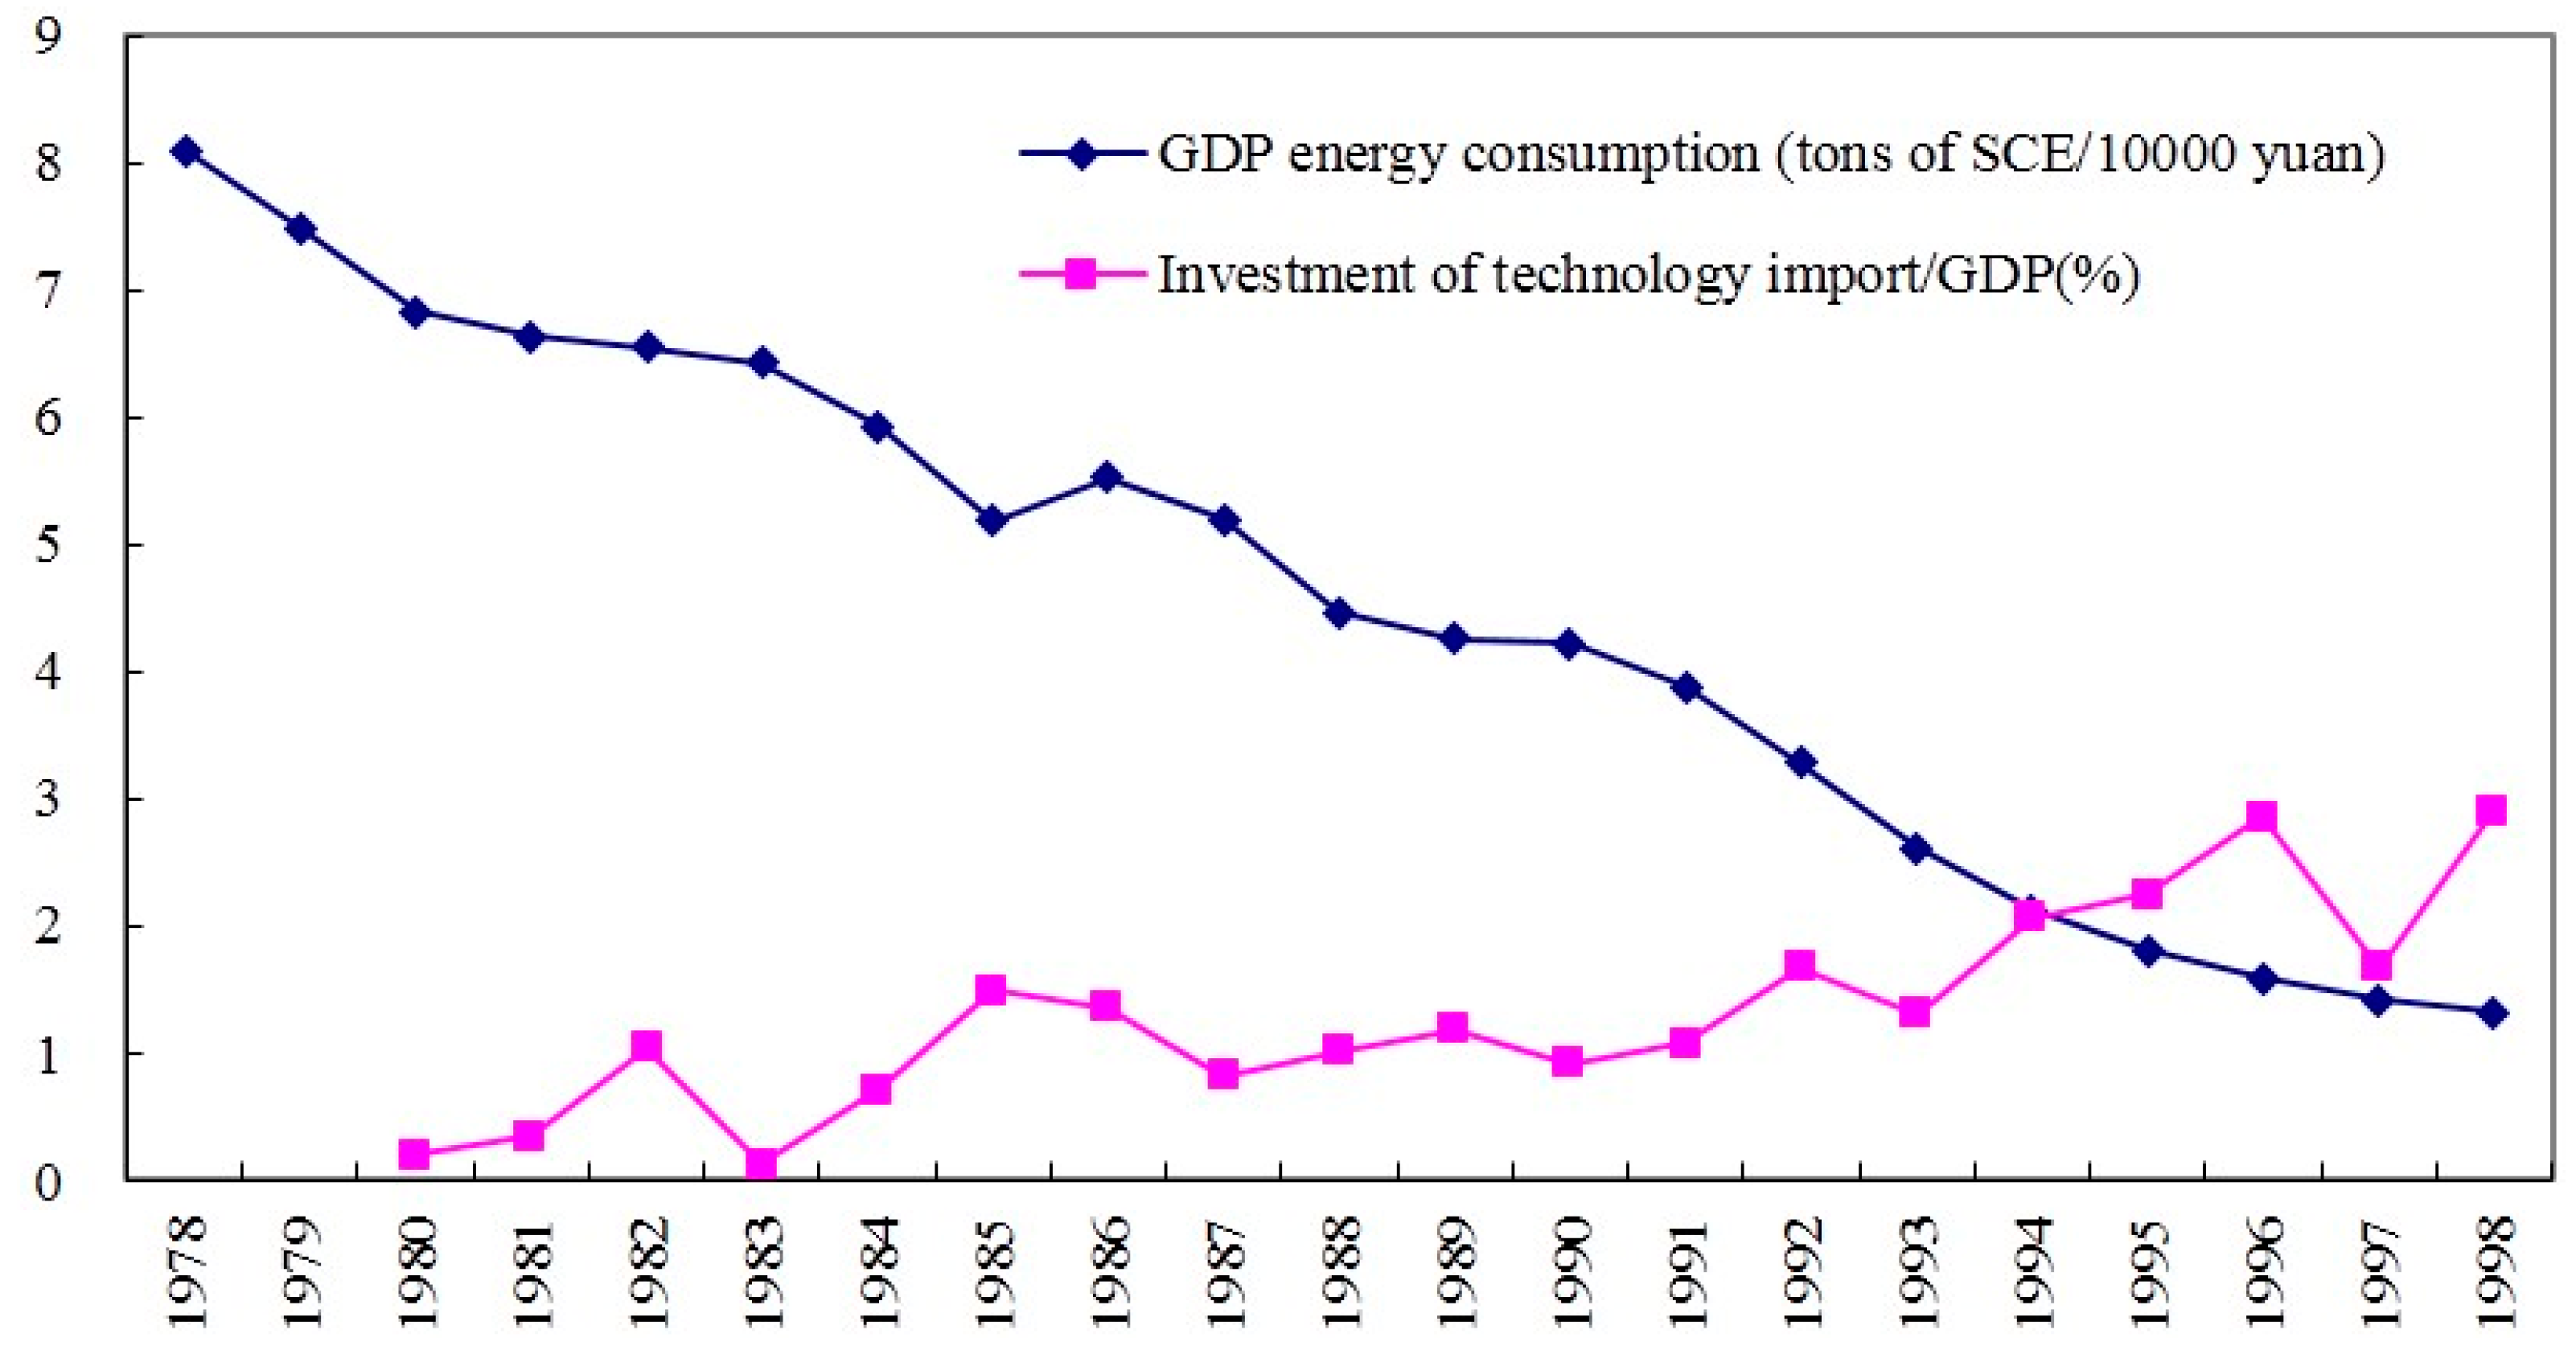
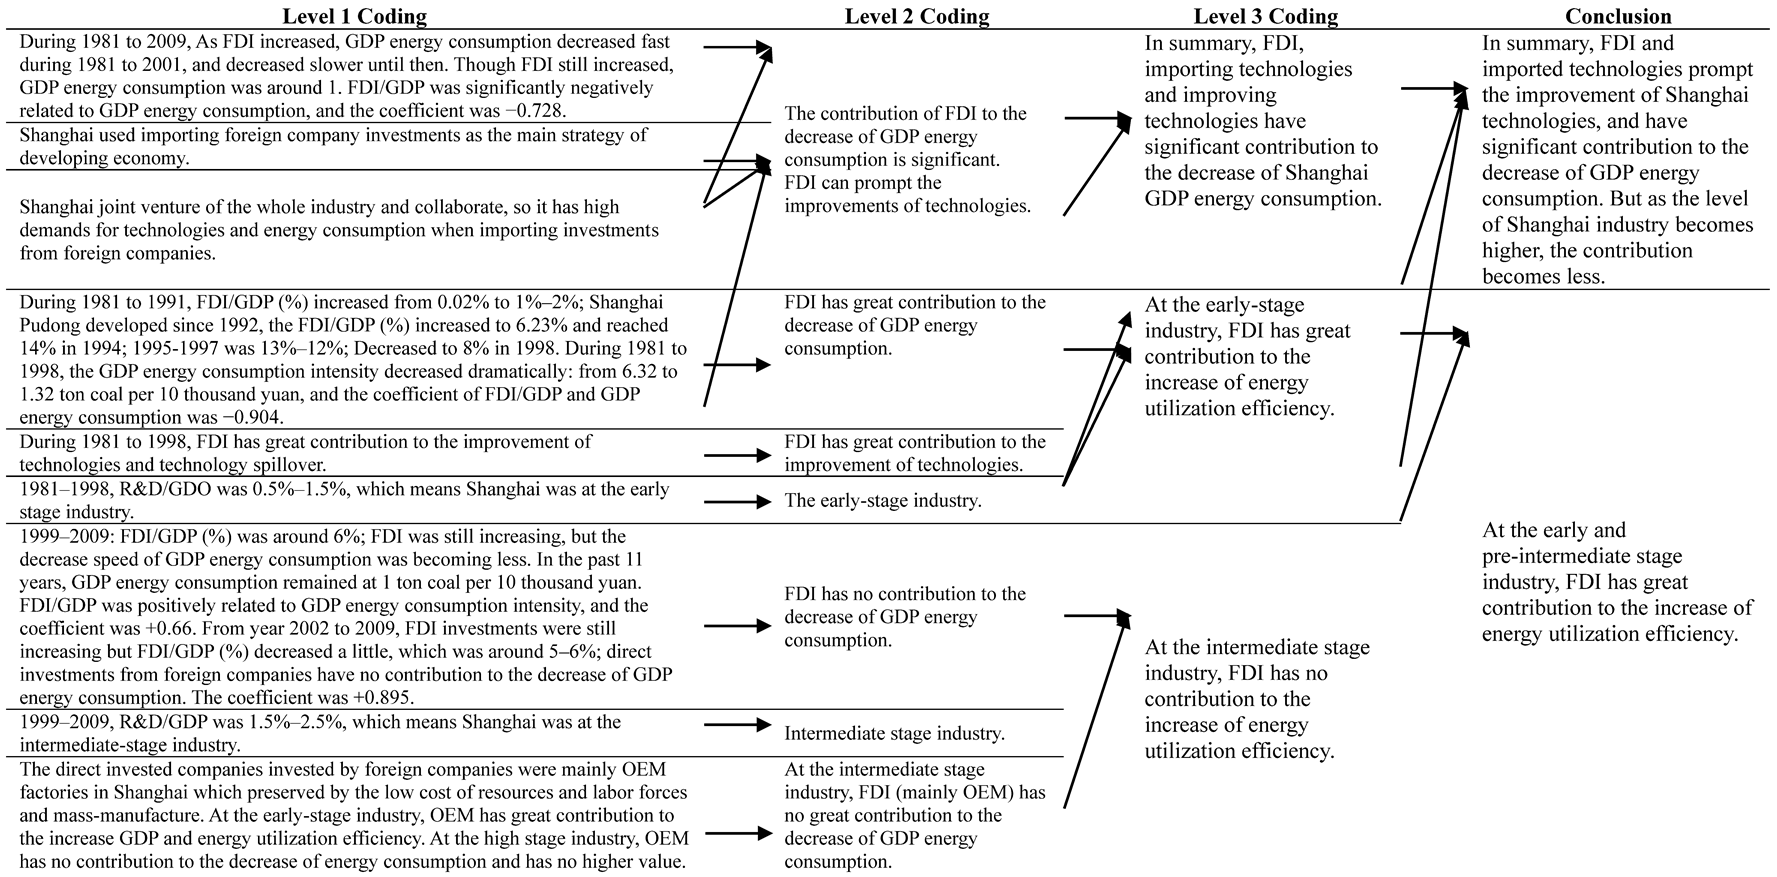
4.1.3. The Relationship between Imported Technologies, Direct Investments from Foreign Companies and GDP Energy Consumption

Shanghai started to import technological equipment in 1980, and increased investment in imported technological equipment in 1983, while simultaneously reforming the industry. From 1980 to 2009, the intensity of imported technological equipment investment is significantly negatively related to GDP energy consumption (shown in Table 1), and the coefficient is −0.644; FDI/GDP (%) is significantly related to GDP energy consumption (shown in Table 1), and the coefficient is -0.727. This research indicates that imported technology contributed greatly to the decrease of FDI and GDP energy consumption.
In the same 30-year period, Shanghai’s science and technology progressed, and the contributions to the city’s economic development increased. The contribution rate rose from less than 30% to 63.8% in 2009, which is negatively related to GDP energy consumption, and the coefficient is −0.944.
In summary, investment in Shanghai’s science and technology and technological activities had significant effects on the decrease of GDP energy consumption.
To understand the relationship between Shanghai’s technological progress and the GDP energy consumption, we divided our analysis into the two sections below.

4.2. The Relationship between Early-Stage the Technological Progress and GDP Energy Consumption

We divided the industrialization stages according to the R&D intensity, and R&D intensity from 0.5% to 1.5% is classified as early stage. This early stage for Shanghai is represented by the period from 1978 to 1998. Indicators of major technological progress and related data of GDP energy consumption are listed in Table 2.

4.2.1. The Relationship between Technological Activities, R&D Investments, Science and Technology Achievements, and GDP Energy Consumption

As seen, the technological activities investments per GDP have increased dramatically, from 2.86% in 1985 to 4.82% in 1998; GDP energy consumption has decreased from 5.52 tons of coal per 10,000 yuan in 1986, to 1.32 tons of coal per 10,000 yuan in 1998. Their related coefficient is −0.951, and they are greatly negatively related.
From 1978 to 1998, R&D/GDP ranges from 0.5% to 1.5%. And that represents early-stage industrialization. The intensity of R&D investments is significantly negatively related to GDP energy consumption, and the coefficient is −0.916.
These data indicate that at the early stage, scientific activities contribute substantially to the decrease of GDP energy consumption.
The time-scale relationship of the intensity of scientific activities, intensity of R&D investments and GDP energy consumption is listed in Figure 3. The time-scale relationship of the efficiency of producing patents, the efficiency of producing scientific achievements and the GDP energy consumption is shown in Figure 4.
The number of applications for patents per million RMB of R&D spending decreased from 0.9 in 1985, to 0.32 in 1998. The number of major scientific products decreased from 5.26 per million RMB in 1978, to 0.23 per million RMB in 1998. However, the number and intensity of R&D investments are increasing every year. The data show that during this period, the main application of Shanghai’s R&D investments is towards not innovating technological and producing independent intellectual technologies, but towards improving imported technology. The efficiency of producing scientific achievements is positively related to GDP energy consumption; the coefficient is +0874.
It is evident that at the early stage, the patents and scientific achievements have no direct effect on the decrease of GDP energy consumption.
Proposition 1: At the early stage of industrialization, science and technology and R&D spending contribute to the decrease of GDP energy consumption primarily through absorbing and updating the imported technologies, not through patents and S&T (science and technology) achievements.

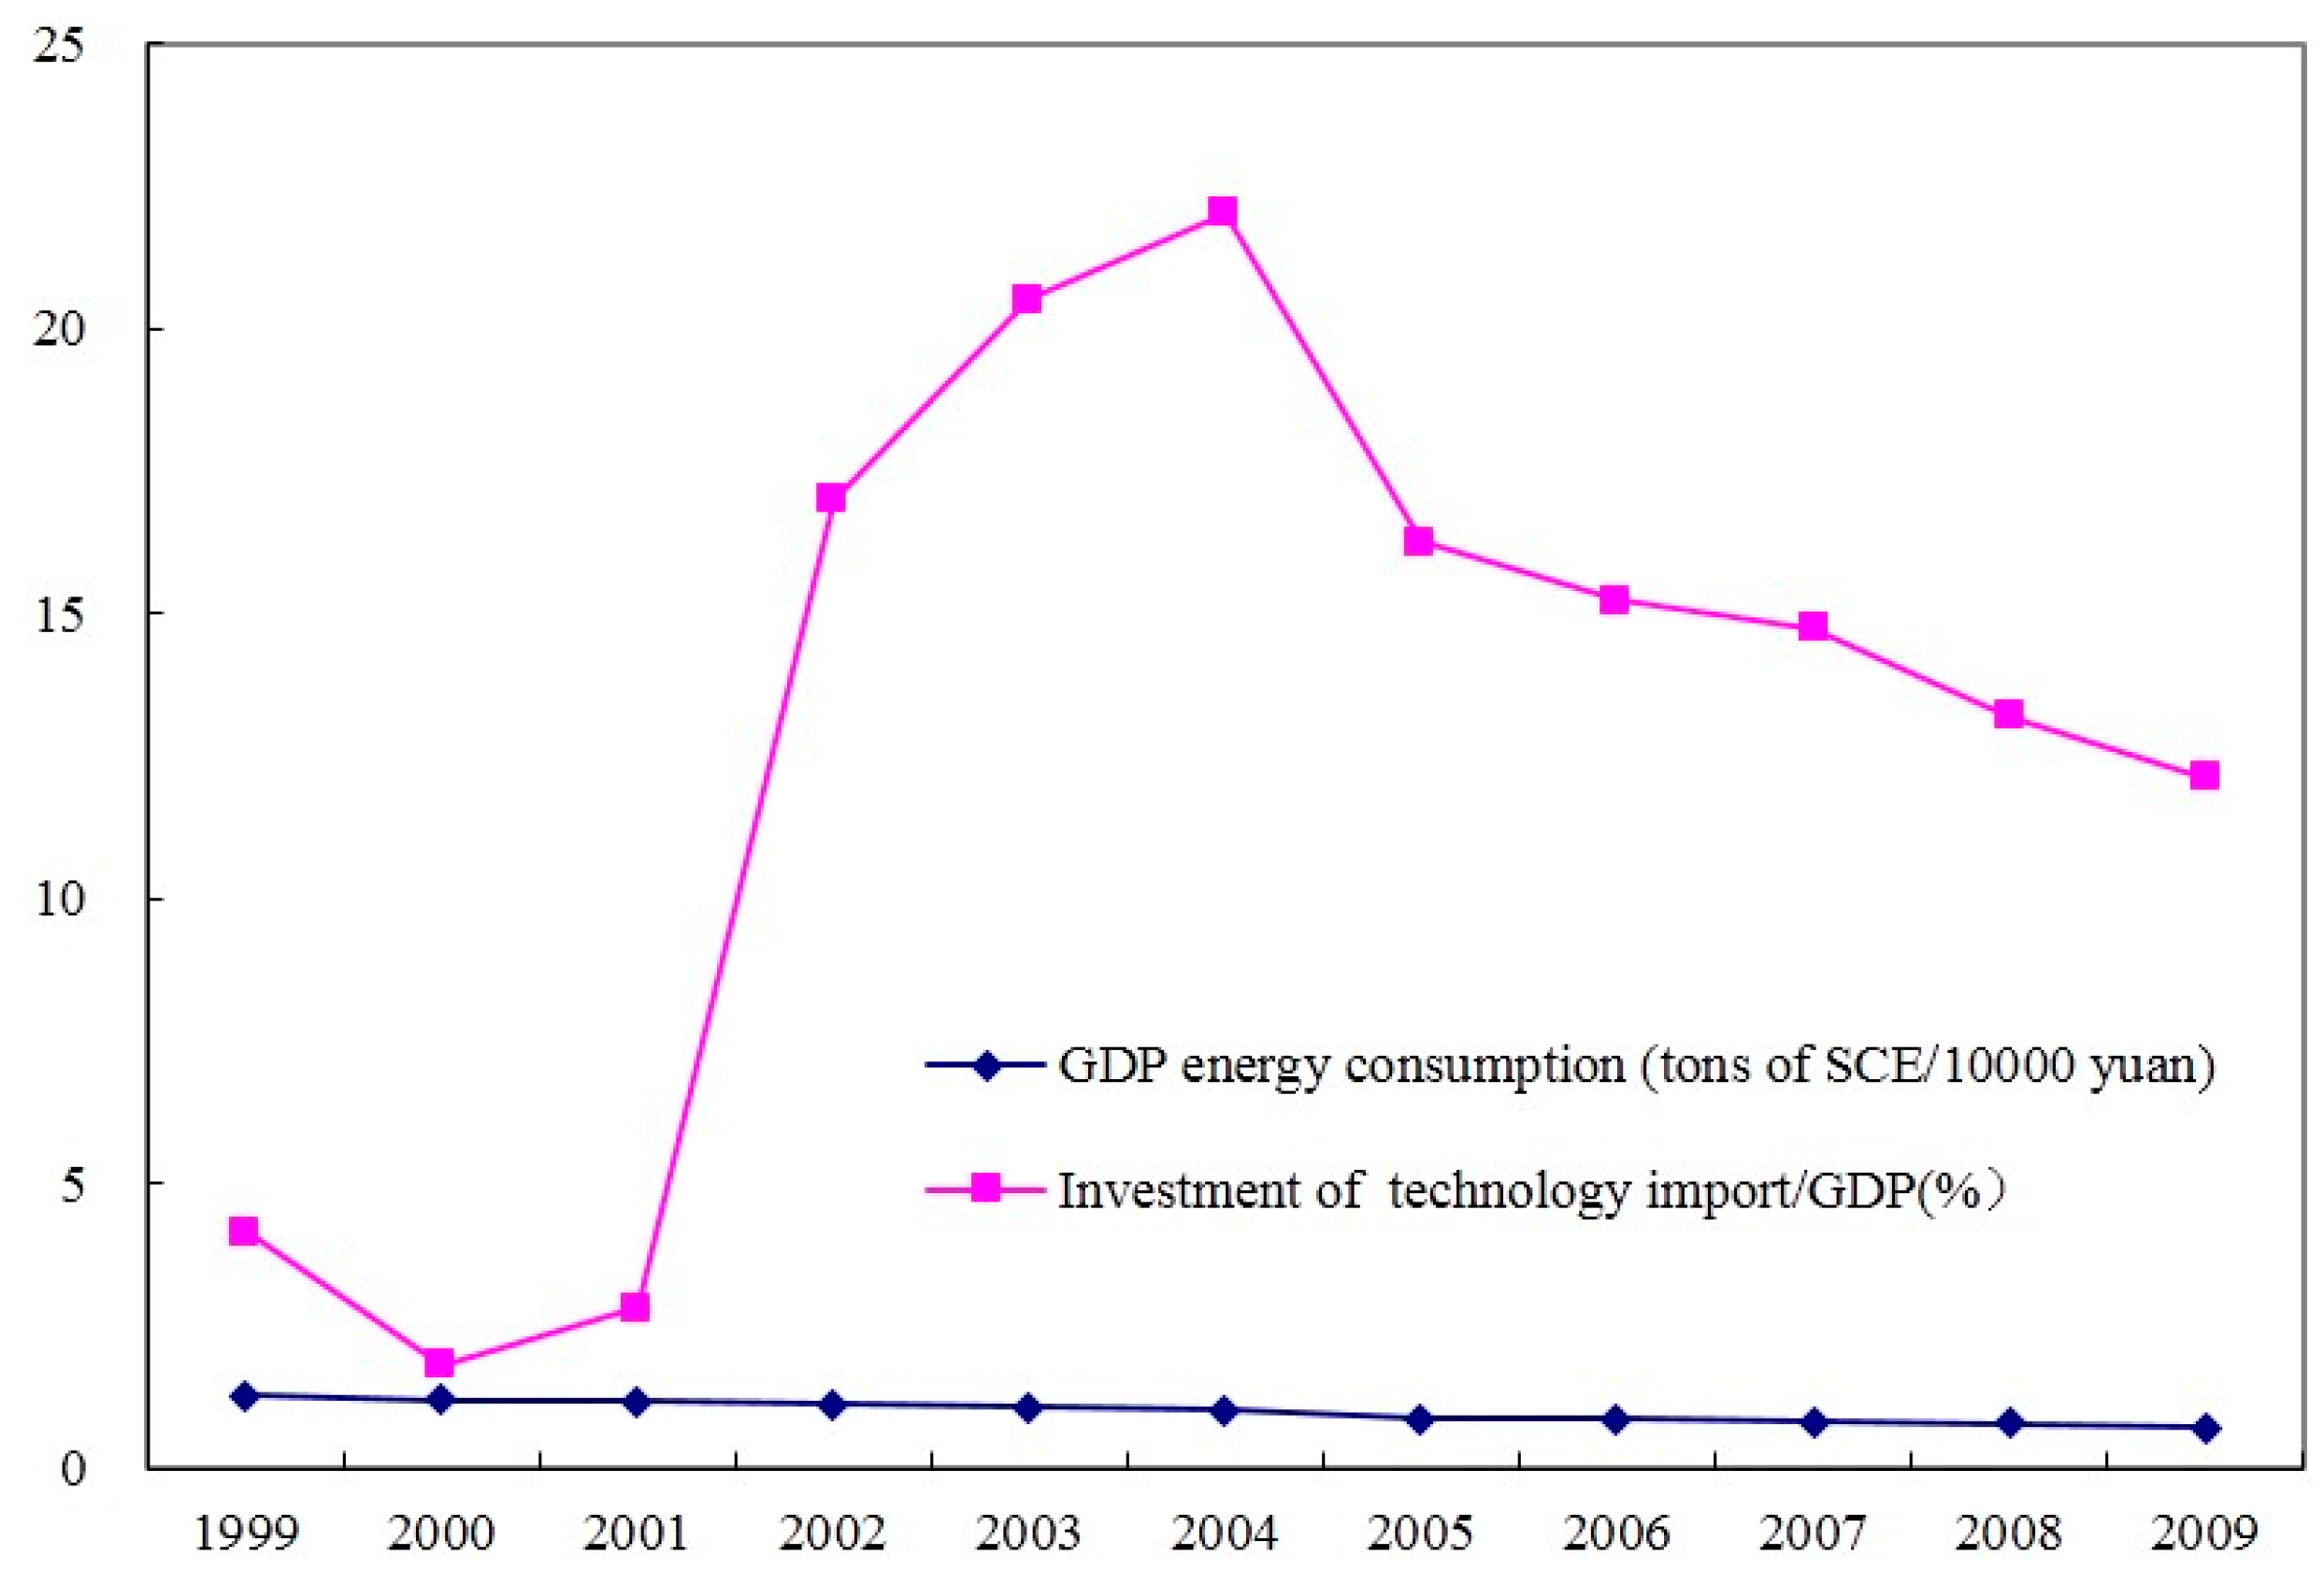
4.2.2. The Relationship between Technology Import Investments and GDP Energy Consumption

As we can see in Figure 5, from 1980 to 1998, GDP energy consumption was very sensitive to the increase of investment in imported technology; they were significantly negatively related, and the coefficient is −0.866.
Shanghai has imported key technologies and reformed traditional industrial technologies since 1983. The level of industrial technologies has increased from the level of the period from 1950 to 1960, to the level of the period from 1970 to 1980. GDP energy consumption increased from 9.1 tons of coal per 10,000 yuan in 1978, to 1.3 tons of coal per 10,000 yuan in 1998; the decreasing amplitude was 6.8 tons of coal per 10,000 yuan. Based on the data analysis and concluding information (Affix 1), we believe:
Proposition 2: At the early stage of industrialization, importing and improving key technologies can have significant effect on the decrease of GDP energy consumption, while simultaneously increasing the industrial technological level and economic development.

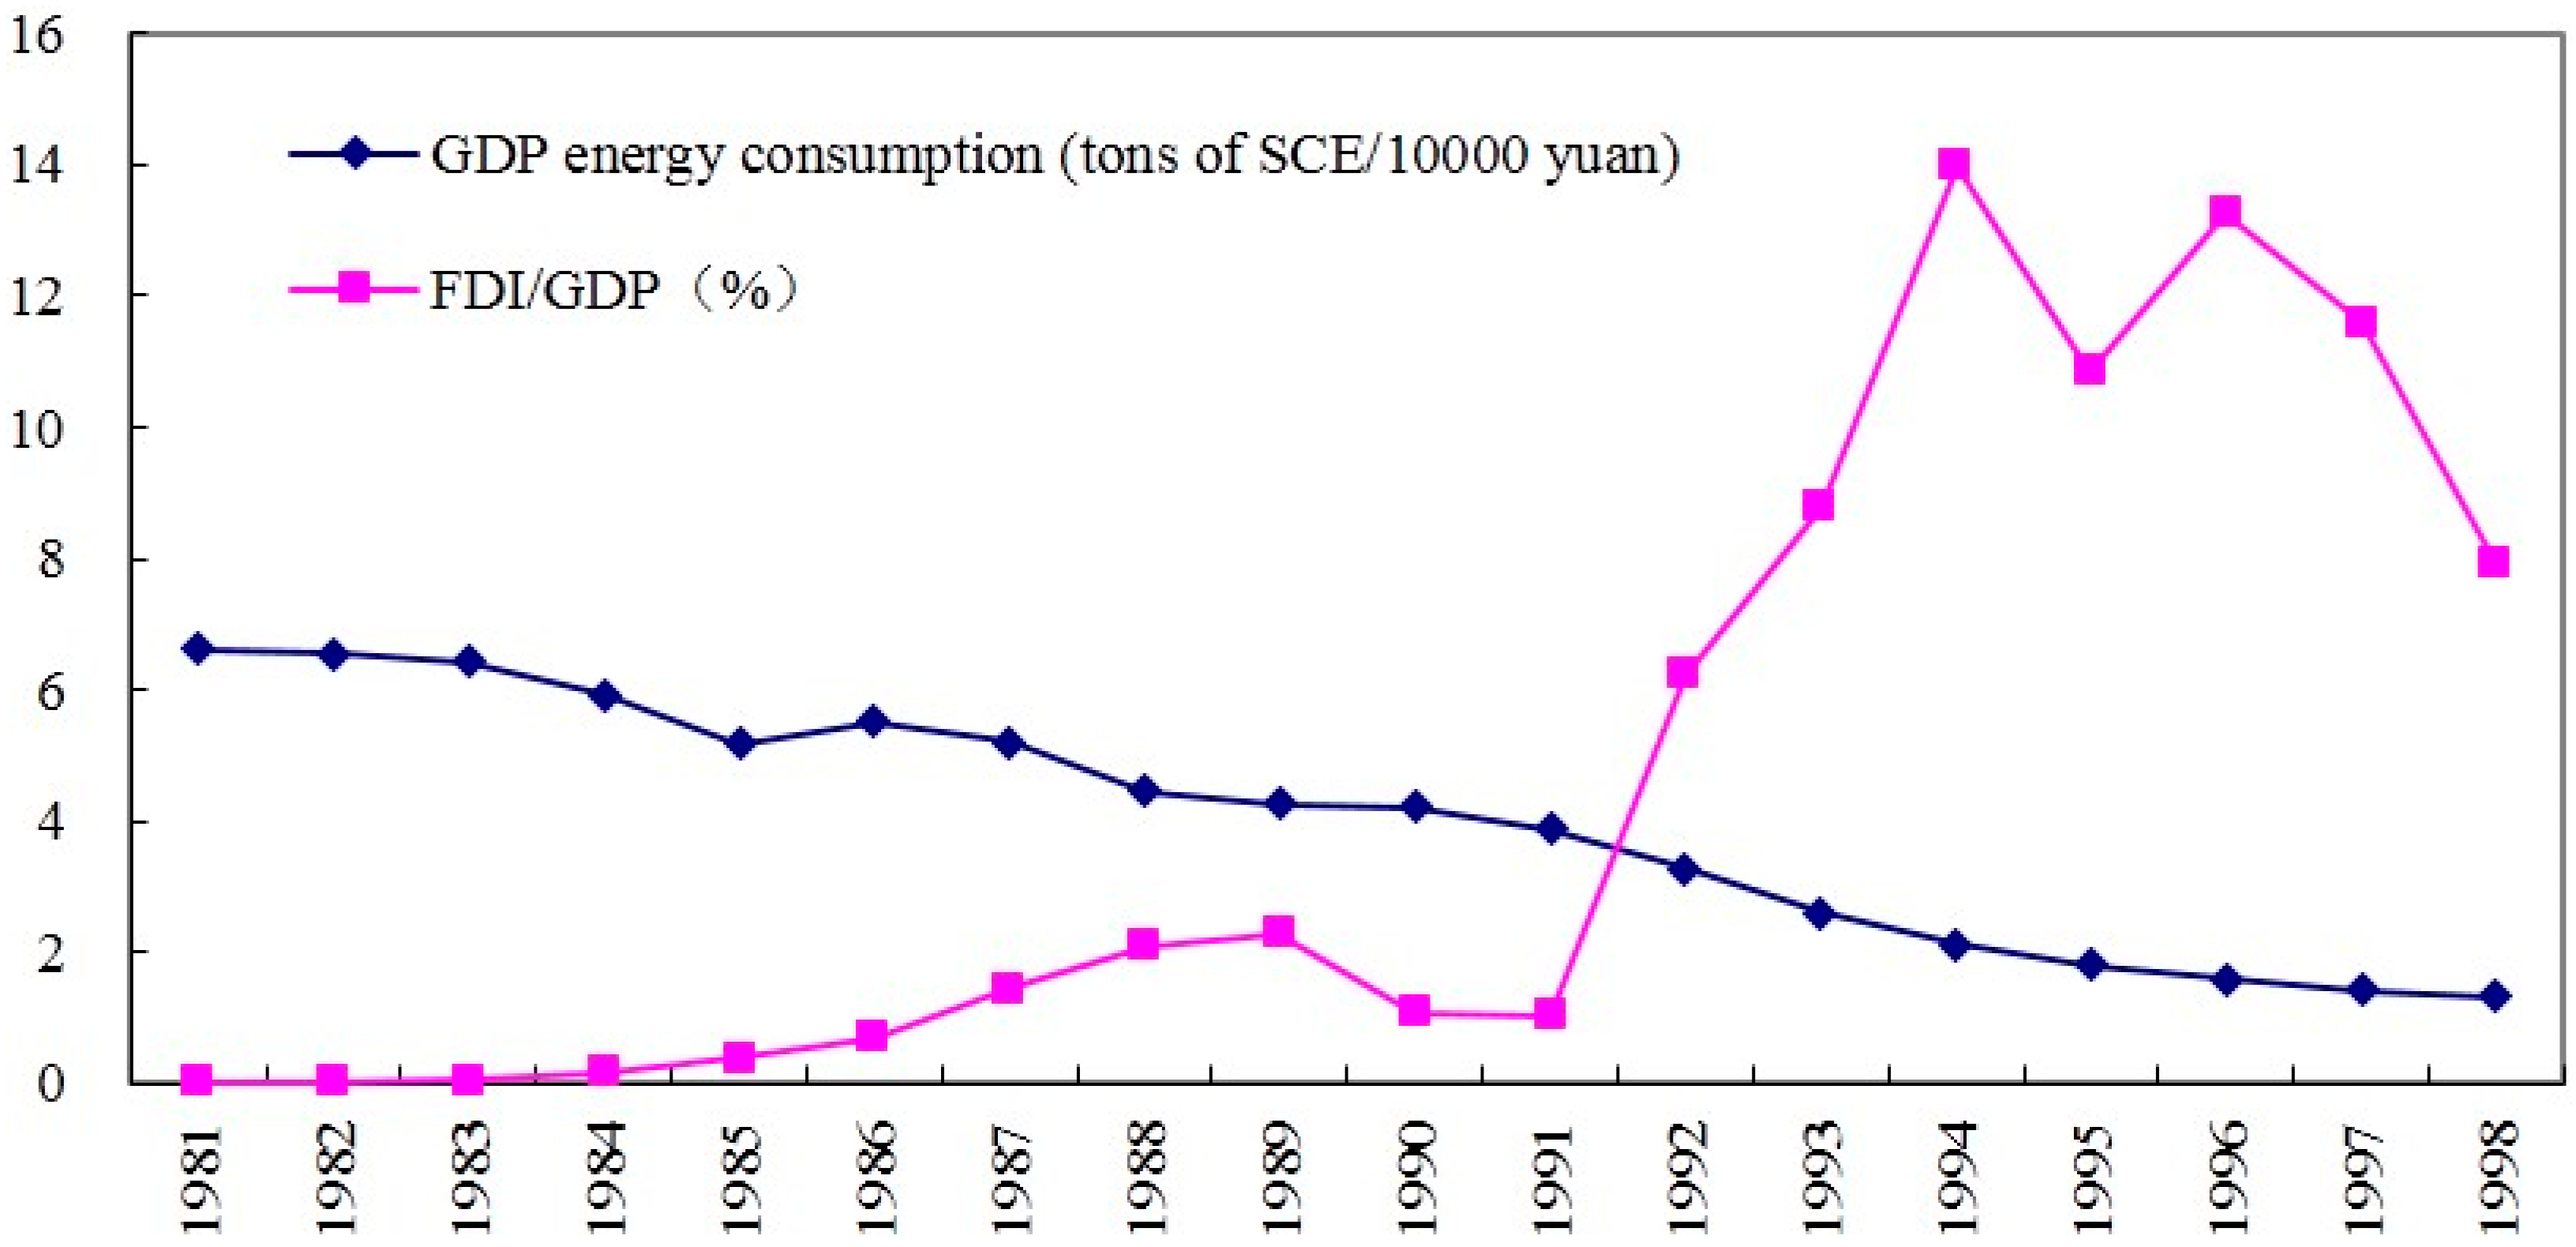
4.2.3. The Relationship between FDI and GDP Energy Consumption

Shanghai has attracted direct investments from foreign companies since 1981. From 1981 to 1998, FDI/GDP is greatly negatively related to GDP energy consumption (See Figure 6), and the coefficient is −0.904. Table 2 shows that direct investments from foreign companies have direct and significant effect on the efficiency of energy utilization.
In the process of industrialization in China since 1980, the strategy was to exchange markets to technologies, which meant improving technologies while importing technologies by collaborating with foreign companies. At the same time, Shanghai attracted foreign companies that had advanced technologies to invest in sole proprietorship. Shanghai made improving technologies a top priority, while attracting foreign companies to invest directly establish joint ventures, thereby improving its industrial technologies in general. To increase production efficiency and decrease energy consumption, it increased the level of industrial technologies by collaboration and joint ventures. Foreign sole proprietorship companies contributed to the decrease of GDP energy consumption because of their high technological equipment and high production efficiency, whether they had technology spillover or not. Therefore, we believe:
Proposition 3: At the early stage of industrialization, foreign direct investments greatly contribute to the decrease of GDP energy consumption intensity.

4.3. The Correlation between Technological Progress at the Intermediate Industry Level and GDP Energy Consumption

Shanghai R&D investment intensity has reached 1.5 since 1998, and entered the intermediate stage in 1999. We analyzed the technological progress and GDP energy consumption from 1999 to 2009; the results are listed in Table 3.

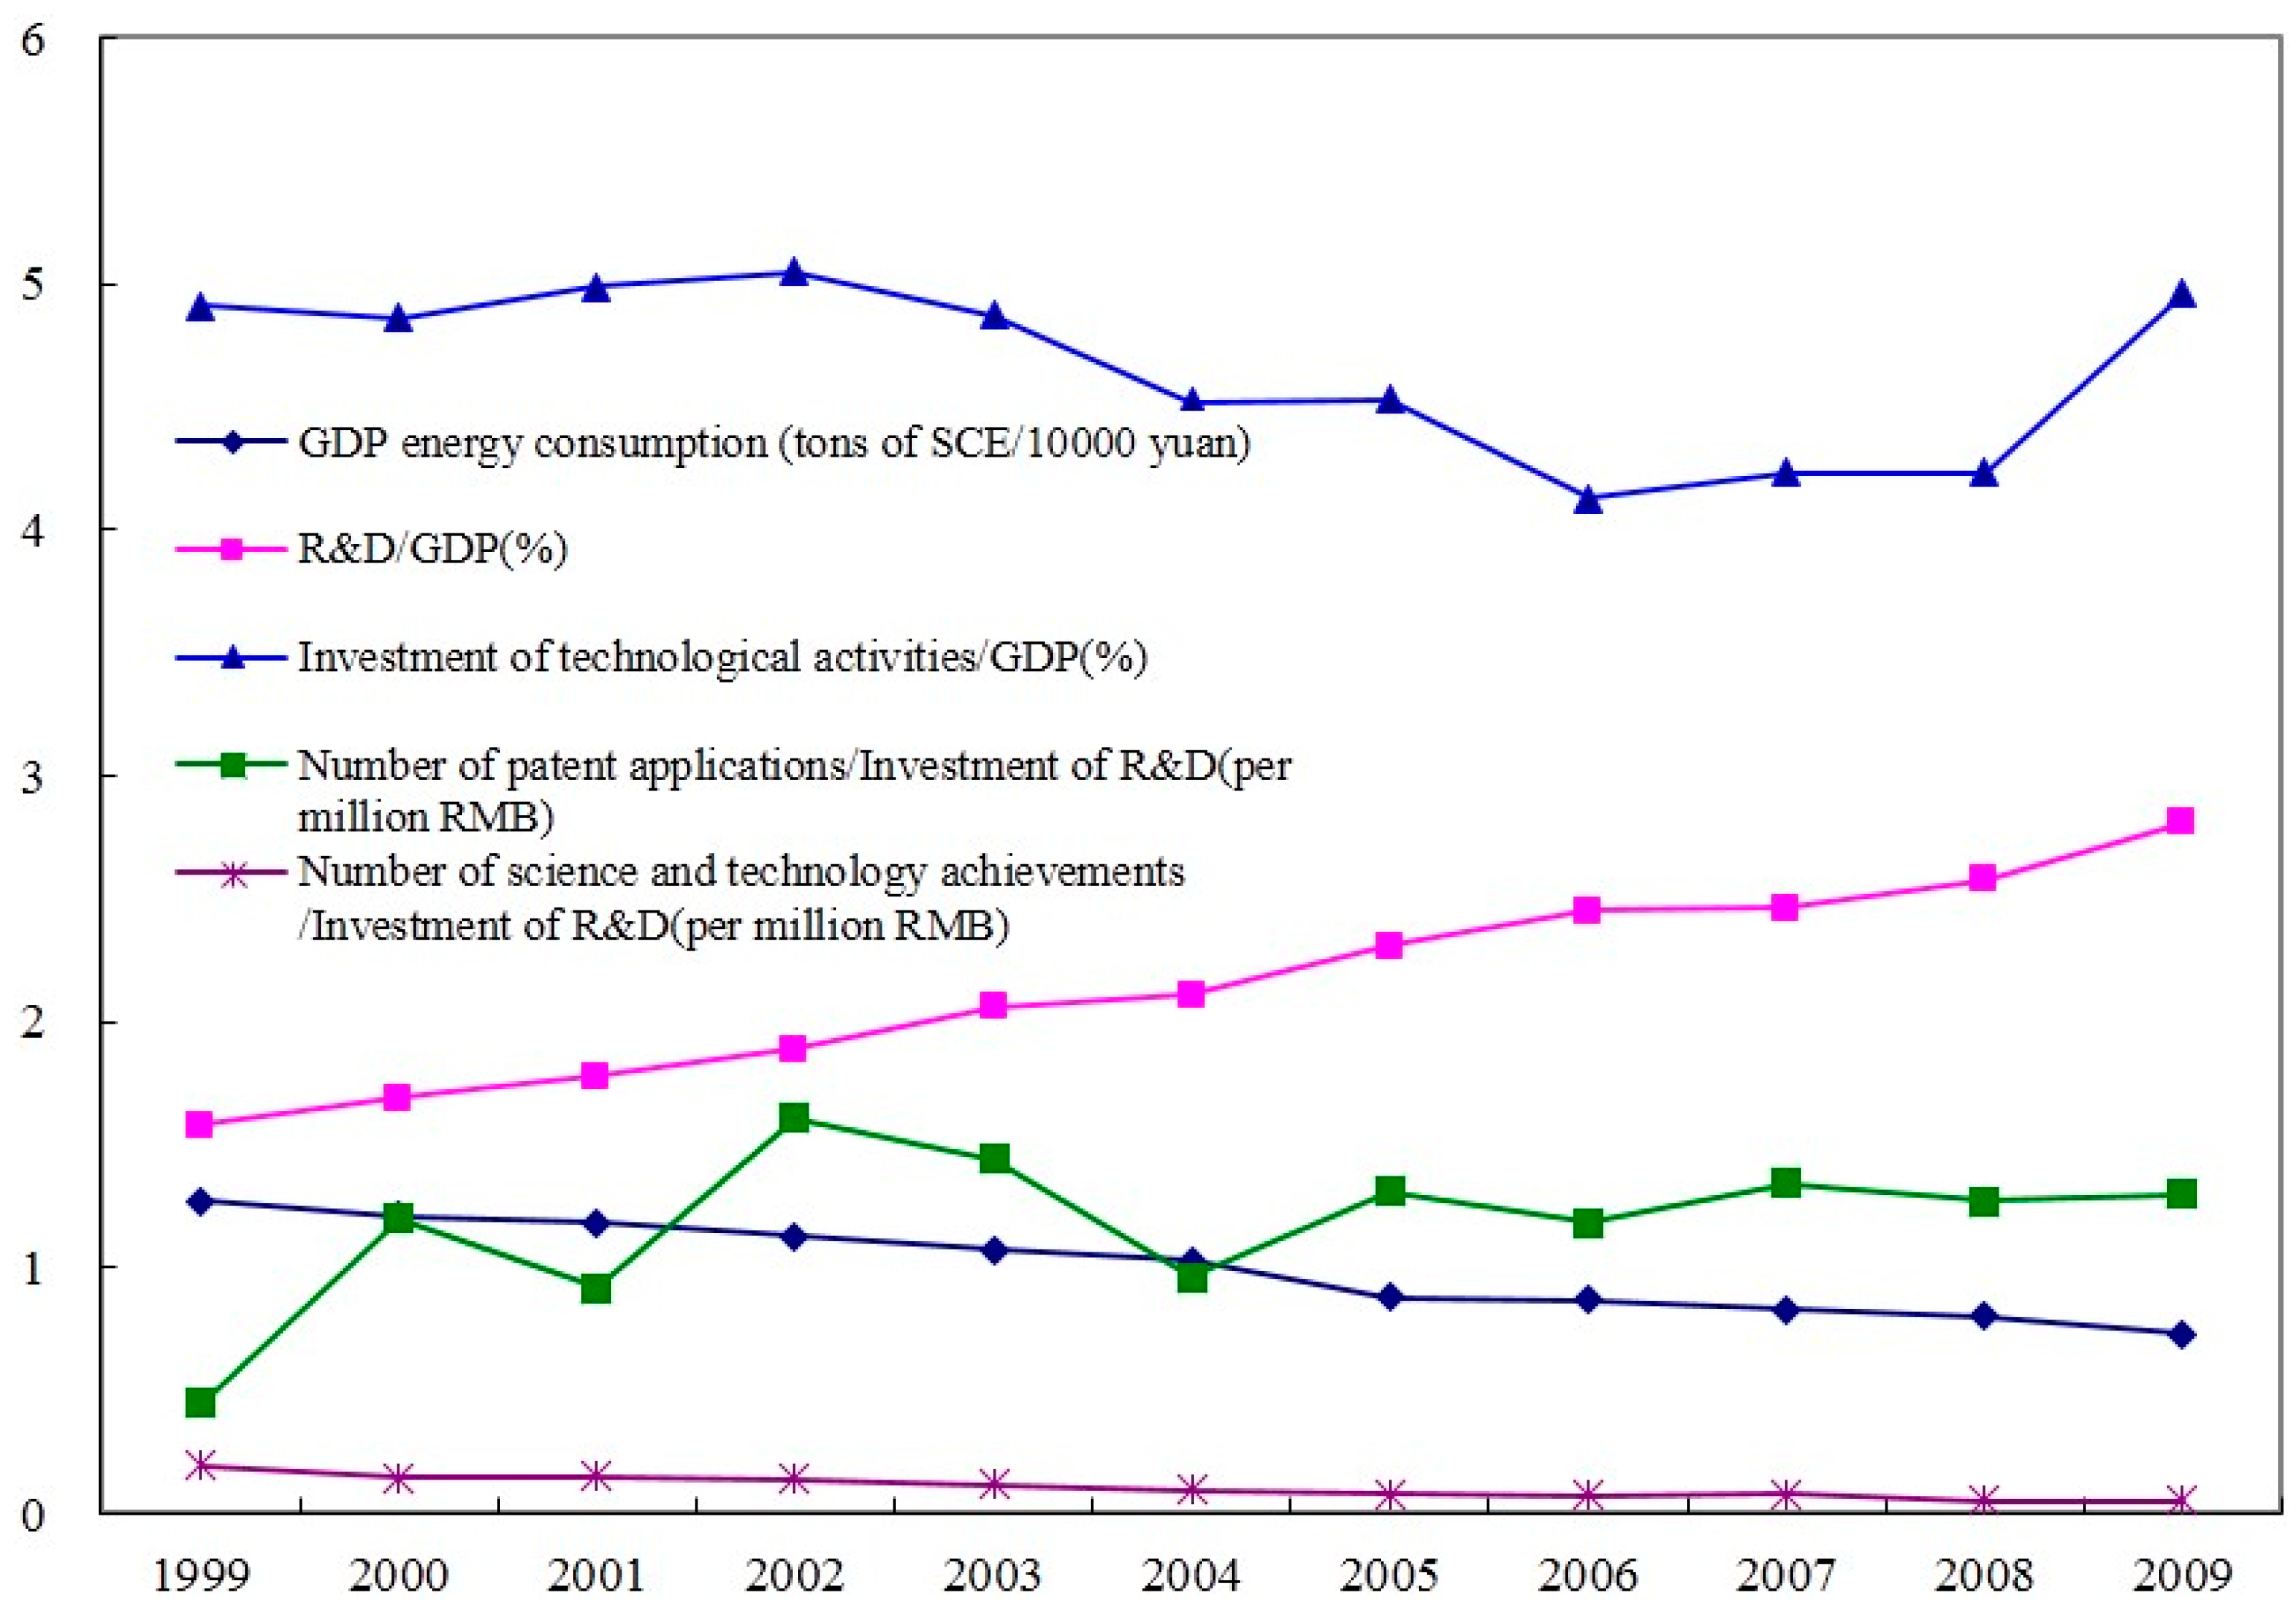
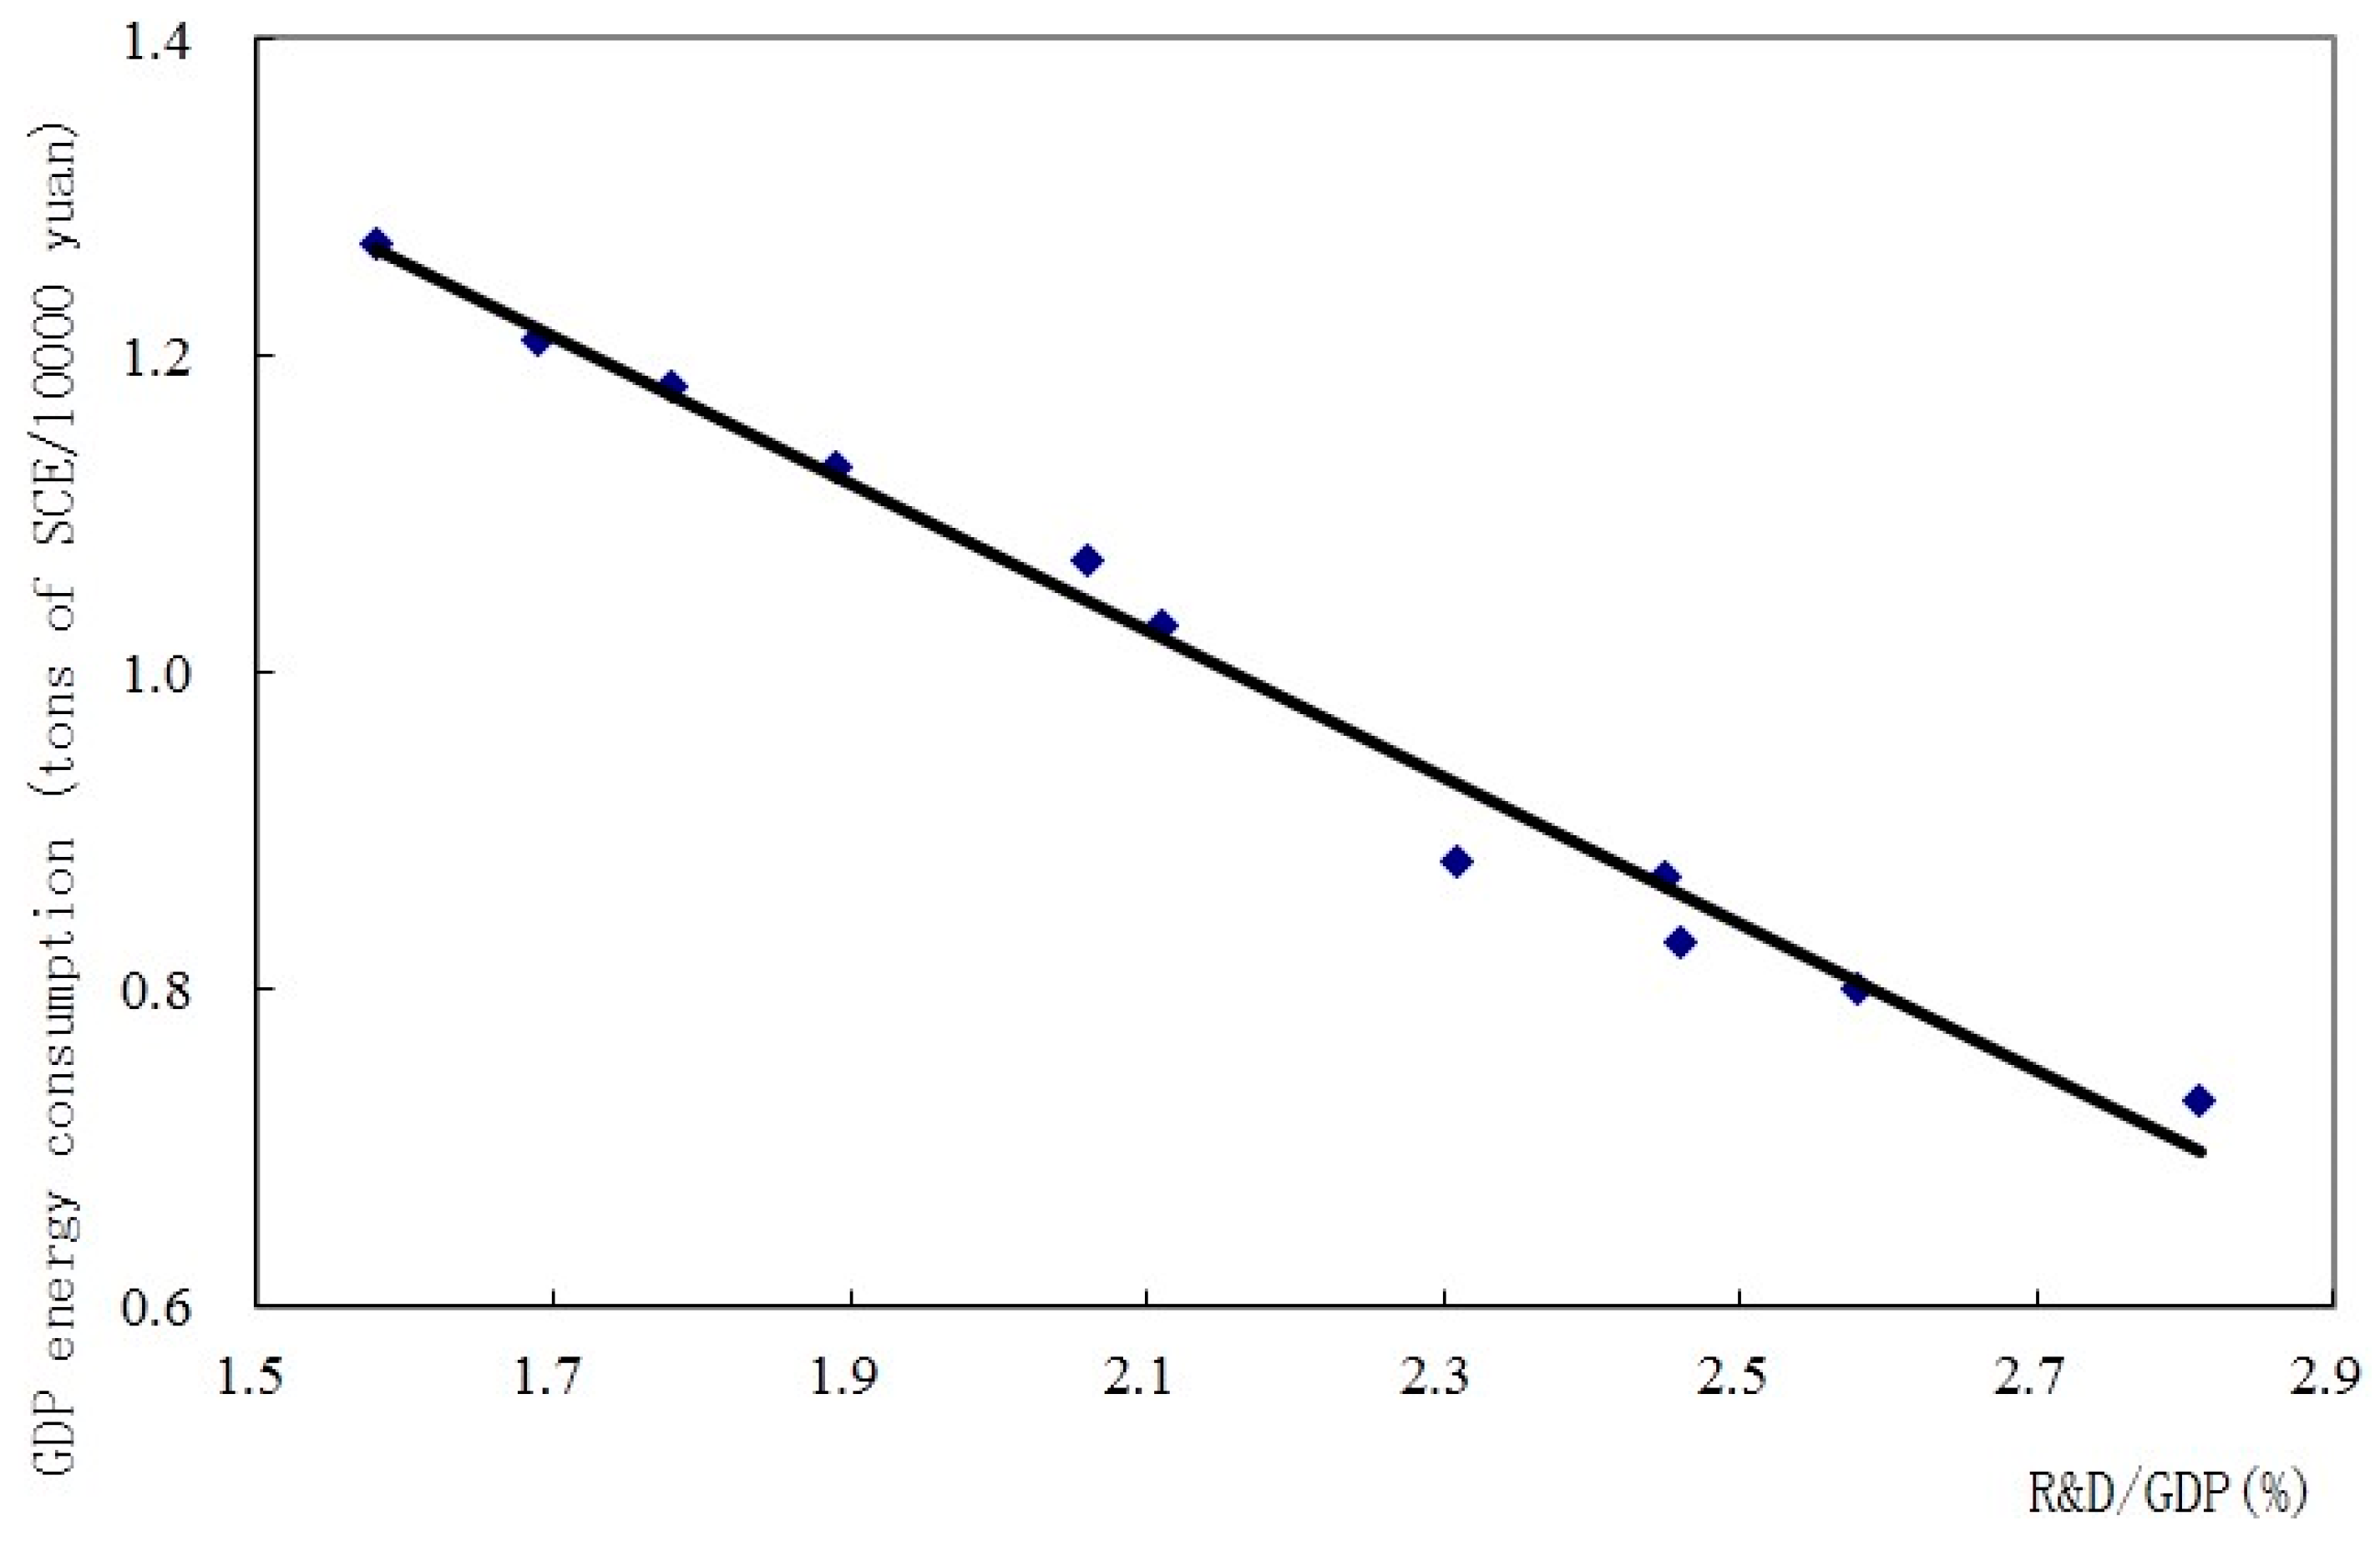
4.3.1. The Relationship between Technological Activities, R&D Investments, Science and Technology Achievements, and GDP Energy Consumption.

From 1999 to 2009, the analysis of scientific activities investment intensity and GDP energy consumption showed the significance is 0.044, under 5% two-tailed test, and the coefficient is +0.614. At the same time, the scientific activities investment intensity started to decrease after remaining the same for three years. Therefore, their directions were the same and they were positively related. From this point of view, from 1999 to 2009, Shanghai’s technological activities investment intensity made no significant contribution to GDP energy consumption.
During the same period, R&D investment intensity is greatly negatively related to GDP energy consumption, and the coefficient is −0.992. The scatter diagram of R&D investment intensity and GDP energy consumption intensity (see Figure 7) showed that they had great linear relationships. However, the decreasing range of GDP energy consumption was very small and GDP energy consumption remained at one ton of coal per 10,000 yuan during these 11 years.
The efficiency of producing R&D patents has no great impact on GDP energy consumption intensity; the efficiency of producing R&D scientific achievements was positively related to GDP energy consumption, and the coefficient is +0.965. The number of Shanghai scientific achievements per million RMB of R&D spending was decreasing every year, and R&D investment intensity is significantly negatively (see Figure 8) related to the efficiency of producing scientific achievements. The data indicated that Shanghai’s R&D investments were not used for independent patents and developing scientific achievements. Therefore, we believe:
Proposition 4: At the intermediate stage of industrialization, if R&D still mainly invests in absorbing and imitating imported technologies then the contribution to the decrease of GDP energy consumption is not significant.

4.3.2. The Relationship between the Investments of Imported Technologies and GDP Energy Consumption

The intensity of imported technological investments has decreased to 1.82% in 2001 since 1999, and has increased since 2002 because of the increase of imported technological investment, but GDP energy consumption was decreasing very slowly. From 1999 to 2009, the relevance between imported technological investment intensity and GDP energy consumption was not significant. However, from 2004 to 2009, the imported technological intensity was decreasing every year; it had not contributed to the decrease of GDP energy consumption (See Figure 9).
Technological investments constituted 29% of enterprises’ special technology expenses (almost the same figure as in 1998). The coefficient of technological improvement costs was decreased to 62%, the coefficient of buying internal technologies cost and absorbing costs was increased, and the average was 4%.
Proposition 5: At the intermediate stage of industrialization, the effect of imported technological investments on GDP energy consumption is not significant.

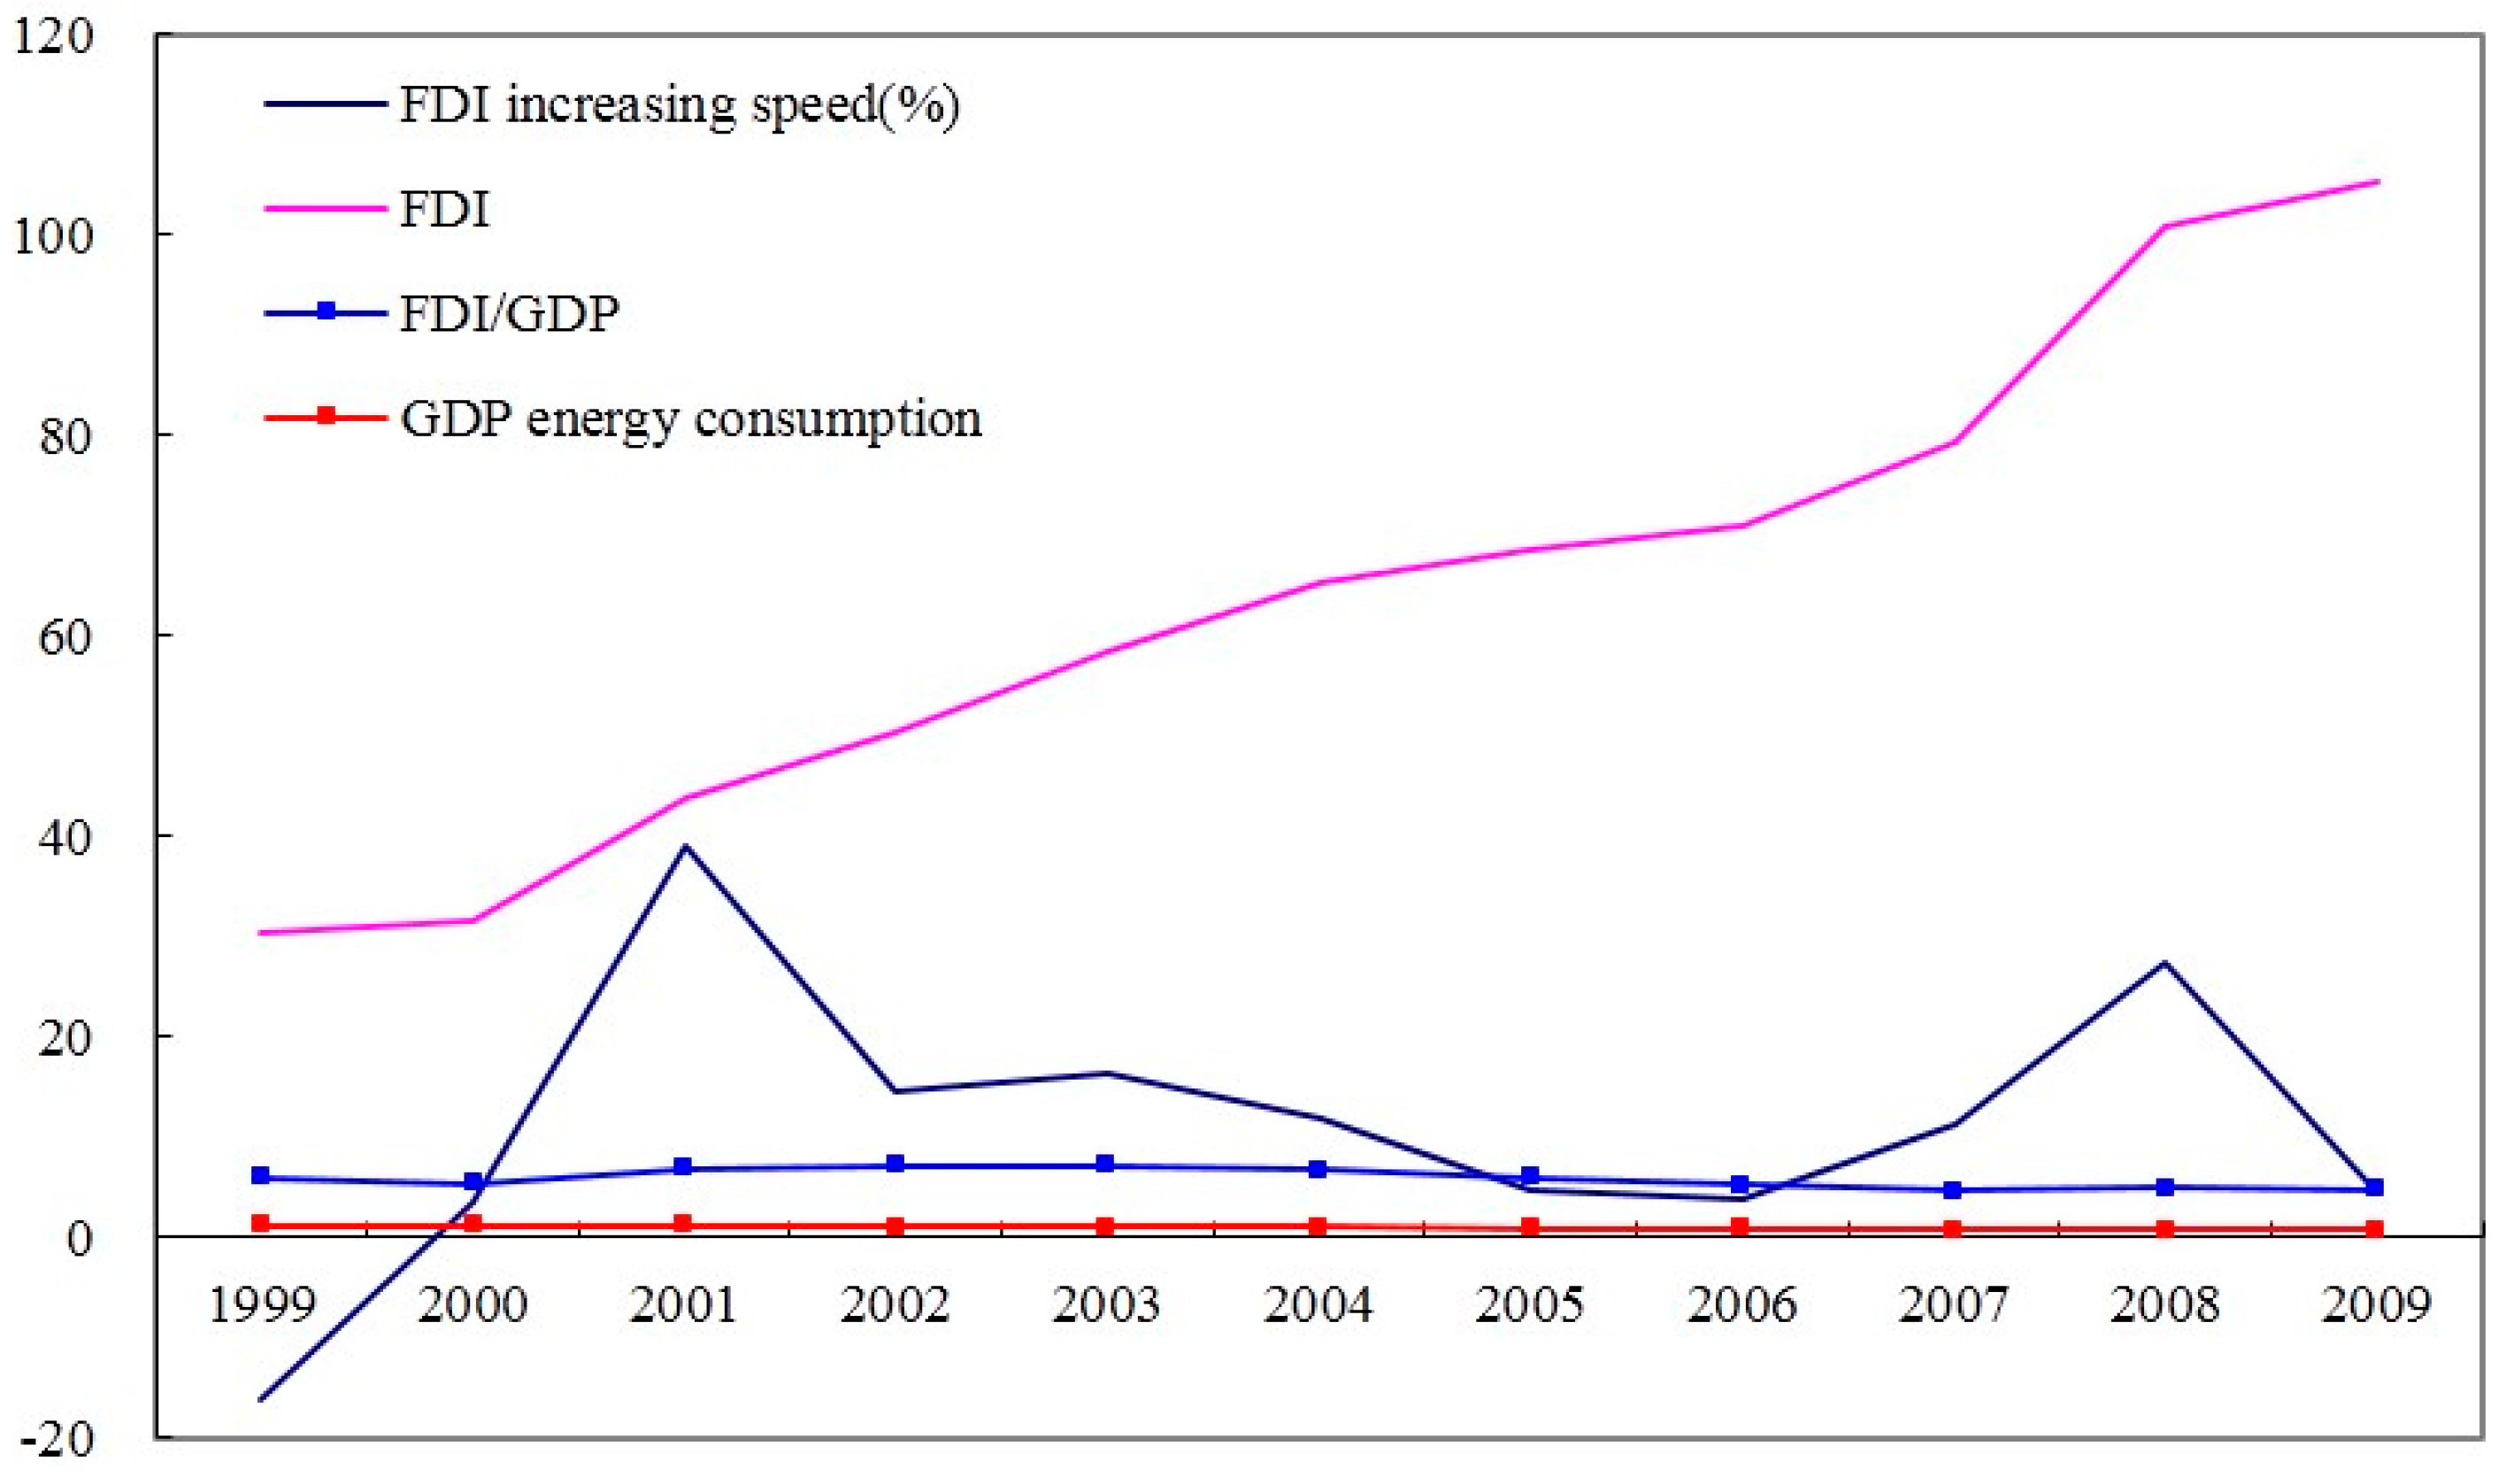
4.3.3. The Relationship between FDI and GDP Energy Consumption

In 1998, the inflow of direct investments in Shanghai started to decrease (−24% in 1997), dropping to −16.22% because of the Southeast Asia economic crisis in 1997. In 1999, FDI inflow started to increase, reaching 4.38 billion dollars in 2001, which was slightly less than 4.7 billion dollars in 1997.
In 2002, because of the further development in Pudong, FDI began to grow, totaling 5 billion dollars in 2002, 10 billion dollars in 2008, and 10.5 billion dollars in 2009. Although direct investment continued to increase, the coefficient of FDI and GDP was decreasing slowly. Intuitively, FDI had no significant effect on the decrease of GDP energy consumption (See Figure 10).
The Shanghai companies that foreign firms chose to invest in were mainly original equipment manufacturer (OEM) production factories: the primary costs of labor and resources were low and depended on producing in large quantities. These OEMs contribute significantly to the increase of GDP and energy utilization efficiency at the early stage. Notably, OEMs’ low-end products have no effect and no more value at the intermediate stage.
Proposition 6: At the intermediate stage of industrialization, direct investments from foreign companies have no significant effect on technological progress and the decrease of GDP energy utilization consumption intensity.

5. Discussions

5.1. Improving Technologies by Importing Technologies and Decreasing GDP Energy Utilization Consumption

During the 1970s, the technological level in Shanghai was much lower than the international advanced level. Most industrial equipment was from the 1950s (or even the 1940s). In suburban areas, agriculture and sideline industries were mainly done by hand. Accordingly, nearly 70% to 80% of Shanghai’s traditional industrial technological equipment needed to be reformed, and there was no emerging industry. Shanghai has imported technologies since 1980, and the government approved a plan to put more effort on importing technologies in 1983. It mainly imported steel, petrol, mechanical and electronic applications, productions of cars and accessories, and other heavy industries. By importing key technological equipment, Shanghai focused on improving technologies, including decreasing energy utilization consumption and improving those companies that wasted energy. Through the fast and large-scale reform of company technologies by importing technologies, the level of Shanghai’s industry increased rapidly. The region concluded the early stage and started to develop into the intermediate stage in 1998. The GDP energy consumption intensity decreased from 8.1 tons of coal per 10,000 yuan in 1978, to 1.2 tons of coal per 10,000 yuan in 1998. Importing key technologies and reforming traditional industrial technologies contributed significantly to the decrease of GDP energy consumption. Accordingly, we believe that Proposition 1 and Proposition 2 are correct.
After the improvement of its industrial technological level and economic development, Shanghai started to enter the intermediate stage of industrialization and the gap between Shanghai and more developed countries began to lessen. However, it was harder to import the most advanced technologies due to the level of control over these technologies in developed countries. Hence, the effect of imported technologies on Shanghai’s technological progress was not as significant as it had been at the early stage of industrialization. At the same time, Shanghai reached the intermediate stage by innovating technologies and started to develop towards an advanced stage of industrialization. Shanghai needs to depend on its ability to innovate independently. Therefore, imported technologies made no significant contribution to Shanghai’s technological progress and the decrease of GDP energy consumption. In this way, we believe that Proposition 5 is correct.

5.2. The Relationship between FDI and GDP Energy Consumption

While importing technologies, Shanghai also simultaneously attracted direct investments from foreign countries. During the development of the past 30 years, direct investments from foreign companies and imports helped to establish advanced technologies from developed countries. Through importing advanced technologies and attracting direct investments from foreign countries, Shanghai not only improved its technologies but also decreased GDP energy consumption and increased energy utilization efficiency, while prompting the GDP to develop. As the analysis indicated, from 1980 to 1998, GDP energy consumption was very sensitive to importing technological intensity and foreign company investment intensity and the speed of decrease was rapid. GDP energy consumption decreased from 1.23 tons of coal per 10,000 yuan in 1980, to 1.23 tons of coal per 10,000 yuan in 1998, and the scope was 5.6 tons of per 10,000 yuan. The average was 0.4 tons of coal per 10,000 yuan per year. At the early stage, the direct investments from foreign companies contributed greatly to GDP energy consumption intensity. Hence, we believe that Proposition 3 is correct.
Foreign companies invested in China because of the abundance of cheap labor and resources (including water, electricity and other resources), as well as China’s loose and munificent FDI policies. Accordingly, these companies moved their productions that required substantial labor forces and resources to China by opening OEM factories, and tightly controlled prime costs and efficiency. This action contributes heavily to the development of economy and industry when a country is at the early stage of industrialization. It has great effect on the decrease of GDP energy consumption while prompting economic development; however, when a country reaches the intermediate stage of industrialization, the contribution of direct investments from foreign companies (OEMs) to the decrease of GDP energy intensity becomes less and less significant. Data showed that from 1999 to 2009, although direct investments were still increasing, the GDP energy consumption intensity decreased from 1.27 tons of coal per 10,000 RMB in 1999, to 0.80 in 2009. The average was 0.05 tons of coal per 10,000 RMB, so the contribution was not significant. Hence, Proposition 6 is correct.

5.3. The Relationship between Science and Technology, R&D Investments and GDP Energy Consumption

China has propelled new policies of independent intellectual property since 2000, and imported more technologies and valuable investments from foreign companies. Although the number of imported technologies and investments is still increasing, the investment intensity started to decrease. There are two reasons for this decrease of GDP energy consumption. Firstly, since 2002, Shanghai has reached the intermediate stage, and the benefits of the heavy industry, which has low-cost labor forces, were no longer as significant. Further, OEM factories, which Shanghai used to import technologies and attract direct investments from foreign companies, had reached the limit of GDP energy consumption. The world had stepped into the age of knowledge, but the higher-level technologies were more difficult to import. Hence, the contribution of imported technologies and direct investments from foreign companies was becoming less important. Secondly, the government (indeed the whole society) depended on the imported technologies and direct investments for the development of the economy. In addition, over the past 20 years, talent was often attracted to foreign companies and it was therefore hard to foster independent innovation in a short time in Shanghai. Independent innovation has no significant impact on technological progress and GDP energy consumption. Thus, Proposition 4 is correct.
In summary, when a society reaches the intermediate stage of industrialization, technological progress mainly depends on independent technological innovation, but this ability has not formed yet in Shanghai. Hence, importing technology and direct investments do not contribute at the intermediate stage, so GDP energy consumption decreased slowly.

6. Conclusions and Contributions

This study used the grounded theory method and 32 years of Shanghai’s development as case background, dividing this period into an early stage and an intermediate stage of industrialization based on R&D investment intensity. It showed the relationship between technological progress and GDP energy consumption at different stage of industrialization, arriving at conclusions which have both theoretical and practical value.

6.1. The Relationship between Imported Technologies and GDP Energy Consumption

At the early stage, Shanghai used imported technology as a main strategy for technological progress and improved its industry by improving technological equipment. These acts can increase the regional industrial level and decrease GDP energy consumption.
Once it passed the early stage of industrialization and after the technological improvements, the region reached at the intermediate stage of industrialization. The development of technology required not only advanced equipment but also the ability to produce and design new products. Hence, imported technologies cannot merely motivate technological progress and the decrease of GDP energy consumption.

6.2. The Relationship between FDI and GDP Energy Consumption

After the early stage of industrialization, Shanghai can reach the intermediate stage of industrialization immediately by attracting foreign companies to invest directly and collaborate, improving traditional equipment and the industrial chain while importing advanced technological equipment. As a result, the GDP energy consumption in Shanghai decreased.
At the intermediate stage, the superiority of low-cost labor and cheap resources are less important, so direct investments (mainly OEMs) have no significant impact on technological progress. Therefore, there is no great contribution to GDP energy consumption.

6.3. The Relationship between Technological Investments and GDP Energy Consumption

Technological investments include scientific activity investments and R&D investments. At the early stage, scientific activities are mainly about improving industrial technologies. In large and medium enterprises, technological improvements are mainly undertaken by importing technological equipment, and require need substantial investment in science and technology. Hence, the impact of scientific investments on the decrease of GDP energy consumption is significant.
Once in the intermediate stage, the main thrust of scientific progress turns to independent innovation. Accordingly, the R&D investments of re-innovations that are based on absorbing imported technologies contribute greatly to the decrease of GDP energy consumption.

6.4. The Relationship between Independent Innovation and GDP Energy Consumption

At the early stage of industrialization, industrial technologies are at a very low level generally, and the ability to innovate independently is weak, hampering industrial scientific progress. Therefore, the patents of independent knowledge and major technology achievements make no great contribution to the decrease of GDP energy consumption.
Once a region progresses to the early stage of industrialization from pre-industrialization, which mainly depends on FDI and imported technologies, and develops into the intermediate stage of industrialization, the struggle for talent and resources by way of FDI and imported investments means that the country cannot cultivate independent innovation. If it depends mainly on imported tech and FDI, a country enters the intermediate stage of industrialization. The structure of company R&D personnel and the structure of R&D are not suitable for independent innovation. Therefore, the patents of independent innovation and scientific achievements do not contribute significantly to the decrease of GDP energy consumption.

6.5. Conclusions

Since increasing energy utilization efficiency is a strategic issue for economic development, this study on energy utilization efficiency is crucial not only for today, but also for the future. Depending on importing technologies and attracting direct investments from foreign countries can increase the energy utilization efficiency quickly and significantly at the early stage of industrialization. However, depending solely on importing technologies and direct investments from foreign countries cannot increase energy utilization efficiency continually. When on the path to the advanced stage of industrialization, we not only need to increase R&D investments, but also improve investment structures. To increase energy utilization efficiency is to depend on independent innovation.
The research achievements and major conclusions of this study develop the theory of the relationship between technological progress and energy utilization efficiency, and provide new knowledge for further theoretical research. At the same time, they also provide information for China and other developing countries regarding regional technological progress and the increase of energy utilization efficiency.
This paper only analyzes one region (Shanghai). Its conclusions are based on historical resources and data from the past 30 years of Shanghai’s development. The limitations of regional differences and circumstances are inevitable. In the future, we will strengthen this proposition and further our theories by choosing more regions to analyze.

Acknowledgments

This paper is supported by Nature Science Foundation of China (Project No. 71172132) and Institute of Asia Pacific Studies, Grant MacEwan University Business School.

Author Contributions

Dezhi Chen designed research; William X. Wei, Dezhi Chen and Daiping Hu performed research; William X. Wei, Dezhi Chen and Daiping Hu analyzed data; and William X. Wei, Dezhi Chen and Daiping Hu wrote the paper. All authors read and approved the final manuscript.

Conflicts of Interest

The authors declare no conflict of interest.

Appendix

Table A1. The analysis process of the relationship between scientific activities, R&D investment and GDP energy consumption.
Sustainability 08 00457 i001
Table A2. The analysis process of the relationship between imported technology investments and GDP energy consumption.
Sustainability 08 00457 i002
Table A3. The analysis process of FDI and GDP energy consumption.
Sustainability 08 00457 i003

References

  1. Wu, Q.; Wu, C.Y. Empirical research on key influencing factors of energy efficiencies in China. Sci. Res. Manag. 2010, 31, 164–170. (In Chinese) [Google Scholar]
  2. Qu, L.Q. Chinese economy depending much on foreign. Merch. Wkly. 2005, 3, 17. (In Chinese) [Google Scholar]
  3. Qiu, Y.; Wu, J.J. Foreign direct investment, technology spillovers and China’s economic growth. J. Hunan Univ. Sci. Technol. (Soc. Sci. Ed.) 2006, 9, 74–79. (In Chinese) [Google Scholar]
  4. Hu, L.J.; Wang, S.C. Total-factor energy efficiency of regions in China. Energy Policy 2006, 34, 3206–3217. [Google Scholar] [CrossRef]
  5. Li, J.; Zhang, S.; Deng, S.J. An overview of research on energy efficiency. J. Shaoyang Univ. (Soc. Sci. Ed.) 2010, 9, 33–37. (In Chinese) [Google Scholar]
  6. Ang, B.W. Decomposition of industrial energy consumption: The energy intensive approach. Energy Econ. 1994, 16, 163–174. [Google Scholar] [CrossRef]
  7. Farla, U.J.; Cuelenaere1, R.; Blok, K. Energy efficiency and structural change in the Netherlands, 1980–1990. Energy Econ. 1998, 20, 1–28. [Google Scholar] [CrossRef]
  8. Jiang, L.; Ji, M.H. On relationship between technological progress, industry structure, energy consumption structure and energy efficiency in China. Contemp. Econ. Manag. 2011, 33, 13–16. (In Chinese) [Google Scholar]
  9. Li, L.S.; Zhou, Y. Can technological progress improve energy efficiency? Based on the empirical test of industries in China. Manag. World 2006, 10, 82–89. (In Chinese) [Google Scholar]
  10. Li, J.K. Empirical analysis on influence of industrial structure on energy consumption: Based on panel data models. Stat. Inf. Forum 2008, 23, 30–35. (In Chinese) [Google Scholar]
  11. Liu, X.Q.; Ang, B.W.H.; Ong, L. The application of the divisia index to the decomposition of changes in industrial energy consumption. Energy J. 1992, 13, 161–177. [Google Scholar] [CrossRef]
  12. Lu, Z.N. An empirical analysis of impact of adjustment in Chinese industry structure to energy consumption. J. Quant. Tech. Econ. 1999, 12, 53–55. (In Chinese) [Google Scholar]
  13. Shi, D. Lower energy consumption: How to realize China’s higher economy development. Energy China 2002, 11, 8–11. (In Chinese) [Google Scholar]
  14. Wang, Q.B. Industrial energy efficiency and industrial structure upgrading. J. Quant. Tech. Econ. 2010, 10, 49–63. (In Chinese) [Google Scholar]
  15. Yin, J.D.; Dai, X.M. Unit GDP energy consumption and industrial structure of Jiangsu. Ind. Econ. Res. 2009, 5, 67–73. (In Chinese) [Google Scholar]
  16. Zhou, Y.; Li, L.S. The action of structure and efficiency on Chinese energy intensity: An empirical analysis based on AWD. Ind. Econ. Res. 2006, 4, 68–74. (In Chinese) [Google Scholar]
  17. Zhou, M.; Liu, W. On the relation between energy industry and industrial structure in China. Reform. Strategy 2008, 24, 159–164. (In Chinese) [Google Scholar]
  18. Sagar, A.D.; Van der Zwaan, B. Technological innovation in the energy sector: R&D, deployment, and learning-by-doing. Energy Policy 2006, 34, 2601–2608. [Google Scholar]
  19. Brada, J.C. Technological progress and factor utilization in Eastern European economic growth. Economica 1989, 56, 433–448. [Google Scholar] [CrossRef]
  20. Foxon, T.J.; Gross, R.; Chase, A.; Howes, J.; Arnall, A.; Anderson, D. UK innovation systems for new and renewable energy technologies: drivers, barriers and systems failures. Energy Policy 2005, 33, 2123–2137. [Google Scholar] [CrossRef]
  21. Xu, G.Q.; Jiang, Z.H. The relationship among technology progress, structure change and energy efficiency of US. Sci. Manag. S&T 2007, 3, 104–107. (In Chinese) [Google Scholar]
  22. Zhao, S.; Xiao, H.J.; Jiang, Z.H. The analysis of American information fixed assets investment R&D and energy efficiency. Ecol. Econ. 2008, 10, 67–70. (In Chinese) [Google Scholar]
  23. Jacobsen, H.K. Technology diffusion in energy-economy models: The case of Danish vintage models. Energy J. 2000, 21, 43–72. [Google Scholar]
  24. Khazzoom, J.D. Economic implications of mandated efficiency standards for household appliances. Energy J. 1980, 1, 21–40. [Google Scholar]
  25. Birol, F.; Keppler, J.H. Prices, technology development and the rebound effect. Energy Policy 2000, 28, 457–469. [Google Scholar] [CrossRef]
  26. Shi, Q.F. The preliminary analysis of change of elasticity coefficient of energy consumption and the relevant causes of China. Stat. Res. 2005, 5, 8–11. (In Chinese) [Google Scholar]
  27. Wang, Q.Y. Evaluation of energy efficiency in China. Energy Conserv. Environ. Prot. 2011, 1, 38–42. (In Chinese) [Google Scholar]
  28. Zhao, J.W.; Fan, J.T. Empirical research on the inherent relationship between economy growth and energy consumption in China. Econ. Res. J. 2007, 8, 31–42. (In Chinese) [Google Scholar]
  29. Shi, D. China’s economic structure, growth pace and energy efficiency. Int. Pet. Econ. 2007, 7, 7–15. (In Chinese) [Google Scholar]
  30. Garbaccio, R.F.; Ho, M.S.; Jorgenson, D.W. Why has the energy-output ratio fallen in China? Energy J. 1999, 20, 63–91. [Google Scholar] [CrossRef]
  31. Zhang, Z.X. Why did the energy intensity fall in China’s industrial sector in the 1990s? Energy Econ. 2003, 25, 625–638. [Google Scholar] [CrossRef]
  32. Fisher-Vanden, K.; Jefferson, G.H.; Ma, J.K.; Xu, J.Y. Technology development and energy productivity in China. Energy Econ. 2006, 28, 690–705. [Google Scholar] [CrossRef]
  33. Fisher-Vanden, K.; Jefferson, G.H.; Liu, H.; Tao, Q. What is driving China’s decline in energy intensity? Resour. Energy Econ. 2004, 26, 77–97. [Google Scholar] [CrossRef]
  34. Liu, C.; Kong, X.L.; Gao, T.M. Empirical analysis of changes in China’s industrial sector energy consumption intensity and influential factors. Resour. Sci. 2008, 30, 1290–1299. (In Chinese) [Google Scholar]
  35. Zhu, Y.F.; Teng, Y.H. Technology progress, technology efficiency and regional energy efficiency. Dong Yue Tribune 2010, 31, 42–46. (In Chinese) [Google Scholar]
  36. Wu, Q.S.; Cheng, J.H. Changes and factors decomposition of Chinese energy consumption intensity: 1980–2004. Econ. Theory Bus. Manag. 2006, 10, 34–40. (In Chinese) [Google Scholar]
  37. Qi, Z.X.; Chen, W.Y. Structural adjustment or technique improvement? Factor analysis of Chinese energy productivity's improvement after the reform and open policy. Shanghai Econ. Rev. 2006, 6, 8–16. (In Chinese) [Google Scholar]
  38. Xuan, Y.; Zhou, S.D. Technology innovation, rebound effect and energy efficiency of Chinese industry. Finance Trade Econ. 2011, 1, 116–121. (In Chinese) [Google Scholar]
  39. Chen, J.; Xu, S.Y. The impact of technical progress over China’s energy efficiency: 1972–2006. Sci. Manag. Res. 2008, 26, 9–13. (In Chinese) [Google Scholar]
  40. Tan, W.H.; Zeng, G.P. The “S” curve of R&D/GDP and thoughts on steady growth of China’s R&D. China Soft Sci. 2005, 1, 94–98. (In Chinese) [Google Scholar]
  41. Statistical Yearbook of Shanghai (1978–2010); China Statistical Publishing House: Shanghai, China, 1978–2010.
  42. The Shanghai Technology Statistics Yearbook (1978–2010); Shanghai Statistical Publishing House: Shanghai, China, 1978–2010.
  43. Fei, F. Grounded theory methodology: Tenets, procedures and criteria for evaluation. J. Public Adm. 2008, 1, 23–43. (In Chinese) [Google Scholar]
  44. Heatha, H.; Cowley, S. Developing a grounded theory approach: A comparison of Glaser and Strauss. Int. J. Nurs. Stud. 2004, 41, 141–150. [Google Scholar] [CrossRef]
Figure 1. The Research Process.
Sustainability 08 00457 g001
Figure 2. Time series of main investment indicators of technology and GDP energy consumption.
Sustainability 08 00457 g002
Figure 3. Intensity of science & technology activities, R&D and GDP energy consumption.
Sustainability 08 00457 g003
Figure 4. Output efficiency of patient, science &technology achievements & GDP energy consumption.
Sustainability 08 00457 g004
Figure 5. Investment of imported technology and GDP energy consumption in early stage.
Sustainability 08 00457 g005
Figure 6. Investment of FDI and GDP energy consumption.
Sustainability 08 00457 g006
Figure 7. Investment of science & technology and GDP energy consumption in intermediate stage of industrialization.
Sustainability 08 00457 g007
Figure 8. Correlation curve of R&D/GDP and GPD energy consumption (1999–2009).
Sustainability 08 00457 g008
Figure 9. Intensity of import technology and GDP energy consumption.
Sustainability 08 00457 g009
Figure 10. FDI and GDP energy consumption (1999–2009).
Sustainability 08 00457 g010
Table 1. Data Summary and the Pearson Correlation between Explanatory Variables and GDP Energy Consumption.
SamplesMinimumMaximumAverageVarianceCorrelation of GDP Consumption
SignificancePearson
1. GDP energy consumption (ton SEC/10,000 yuan)320.738.103.315.810.0001.000
2. R&D/GDP (%)320.482.811.480.380.000−0.886 **
3. Investment of technological activities/GDP (%)252.865.054.330.360.000−0.853 **
4. Contribution rate of technological progress (%)1637.4763.8950.9882.670.000−0.944 **
5. Investment of imported technology/GDP (%)300.1322.025.5048.160.000−0.644 **
6. FDI/GDP (%)290.0213.995.0716.680.000−0.727 **
7. Number of patent application/Investment of R&D (per million RMB)250.321.610.080.170.114−0.324
8. Number of science & technology achievements /Investment of R&D (per million RMB)320.055.261.532.520.0000.930 **
**: Significant correlation at significant level 0.01 (double sides); *: Significant correlation at significant level 0.05 (double sides).
Table 2. The correlation between indicators of technological progress and GDP energy consumption in the early stage of industrialization
SamplesMinimumMaximumAverageVarianceCorrelation of GDP Energy Consumption
SignificancePearson
GDP energy consumption (ton SEC/10,000 yuan)211.328.104.524.5190.0001.000
R&D/GDP (%)210.481.571.130.1280.000−0.916 **
Investment of technological activities/GDP (%)142.864.934.080.4040.000−0.951 **
Investment of imported technology/GDP (%)190.132.901.320.6230.000−0.866 **
FDI/GDP (%)180.0213.994.5526.1340.000−0.904 **
Number of patent application/Investment of R&D (per million RMB)140.100.310.190.0060.0000.945 **
Number of science & technology achievements /Investment of R&D (per million RMB)210.235.262.272.2160.0000.874 **
**: Significant correlation at significant level 0.01 (double sides); *: Significant correlation at significant level 0.05 (double sides).
Table 3. Data Summary and the Pearson Correlation between Explanatory Variables and GDP Energy Consumption for Intermediate Industry Period (year 1999–2009).
Number of SamplesMinimumMaximumAverageVarianceCorrelation of GDP Energy Consumption
significancePearson
GDP energy consumption (ton SEC/10,000 yuan)110.731.271.000.0350.0001.000
R&D/GDP (%)111.582.812.160.1580.000−0.992 **
Investment of technological activities/GDP (%)114.135.054.660.1180.044+0.614 *
Investment of imported technology/GDP (%)111.8222.0212.7247.9540.145−0.469
FDI/GDP (%)114.637.255.930.9890.026+0.663 **
Number of patent application/Investment of R&D (per million RMB)110.451.611.180.0970.155−0.459
Number of science & technology achievements/Investment of R&D (per million RMB)110.050.200.110.0020.000+0.965 **
Contribution rate of technological progress (%)1147.1663.8056.0929.4140.000−0.987 **
**: Significant correlation at significant level 0.01 (double sides); *: Significant correlation at significant level 0.05 (double sides).

