Abstract
This paper introduces an expanding research frontier in the landscape architecture discipline, landscape performance research, which embraces the scientific dimension of landscape architecture through evidence-based designs that are anchored in quantitative performance assessment. Specifically, this paper summarizes metrics and methods for determining landscape-derived economic benefits that have been utilized in the Landscape Performance Series (LPS) initiated by the Landscape Architecture Foundation. This paper identifies 24 metrics and 32 associated methods for the assessment of economic benefits found in 82 published case studies. Common issues arising through research in quantifying economic benefits for the LPS are discussed and the various approaches taken by researchers are clarified. The paper also provides an analysis of three case studies from the LPS that are representative of common research methods used to quantify economic benefits. The paper suggests that high(er) levels of sustainability in the built environment require the integration of economic benefits into landscape performance assessment portfolios in order to forecast project success and reduce uncertainties. Therefore, evidence-based design approaches increase the scientific rigor of landscape architecture education and research, and elevate the status of the profession.
1. Introduction
Recognizing and quantifying the economic benefits of landscape performance demonstrates the fiscal argument for considered landscape designs. These benefits have their foundations in the use of cost/benefit analyses that allow researchers to assess the landscapes in question and compare them in time or space based on their economic impact for clients and surrounding areas. These benefits are demonstrated as monetary savings, profits, and other results (e.g., job creation) that are widely considered to be positive economic outcomes.
Economic benefits are defined through their intimate connections with nature, justice, and time [1]. This definition demonstrates how economic benefits exist in concert with environmental and social benefits (nature and justice), but that they also must be lasting and sustainable. As one of the three pillars of sustainable development (environmental, social, and economic), economic benefits have been examined by a number of studies within the landscape architecture discipline [2,3,4]. For instance, an urban forest provides multi-faceted environmental benefits (e.g., improved air quality, reduced urban heat island effect, better urban habitat) and these ecosystem services generate economic benefits. Other observable economic outcomes would also benefit local businesses, who may see more customers as a result of their business’ proximity to the urban oasis [5]; may attract qualified workers who appreciate clean air and recreation opportunities; and may find that their property value has increased.
Advancing research into landscape economic performance is essential for scholars and practitioners to close the gap between science and practice [6] and to advocate for the economic relevancy of the discipline [7,8,9]. In a broader context of advancing research in the landscape architecture discipline, various studies have suggested the importance of post-occupancy evaluation of built works [10,11]. For instance, van den Brink and Bruns [12] suggest three types of research in landscape architecture and advocate research-in-design as a means to invigorate the scientific dimension of education and practice. Some scholars further argue that it is important to assess project performance at every stage of its development [13], and monitoring and assessment should be integrated with project implementation [14].
In 2010, the Landscape Architecture Foundation (LAF) in the United States launched a seminal research program—the Landscape Performance Series (LPS)—whose goal is to showcase exemplary built projects with quantified landscape performance benefits [15]. Its purpose is to “fill a critical gap in the marketplace and make the concept of landscape performance and its contribution to sustainability as well-known as building performance is today”. Each LPS case study includes a study of environmental, social, and economic benefits, along with a method document explaining how these benefits are determined [16]. The reporting format and structure of LPS cases are built upon the case study method that Mark Francis developed for the LAF [17], while quantitative performance assessment is required in the LPS.
Although economic considerations are included as a crucial component of the LPS research, little progress has been made towards evaluating the rich LPS database in order to identify trends (or pitfalls) and best practices in economic benefits assessment. The study objectives are to perform a comprehensive analysis of the current status of LPS research, economic performance assessment in particular, and to summarize metrics and methods used for the assessment based on published LPS cases. Academic institutions and design firms may incorporate lessons learned from empirical analyses of built projects in order to optimize landscape designs for better performance outcomes.
2. Economic Benefits Categories and LPS Assessment Status
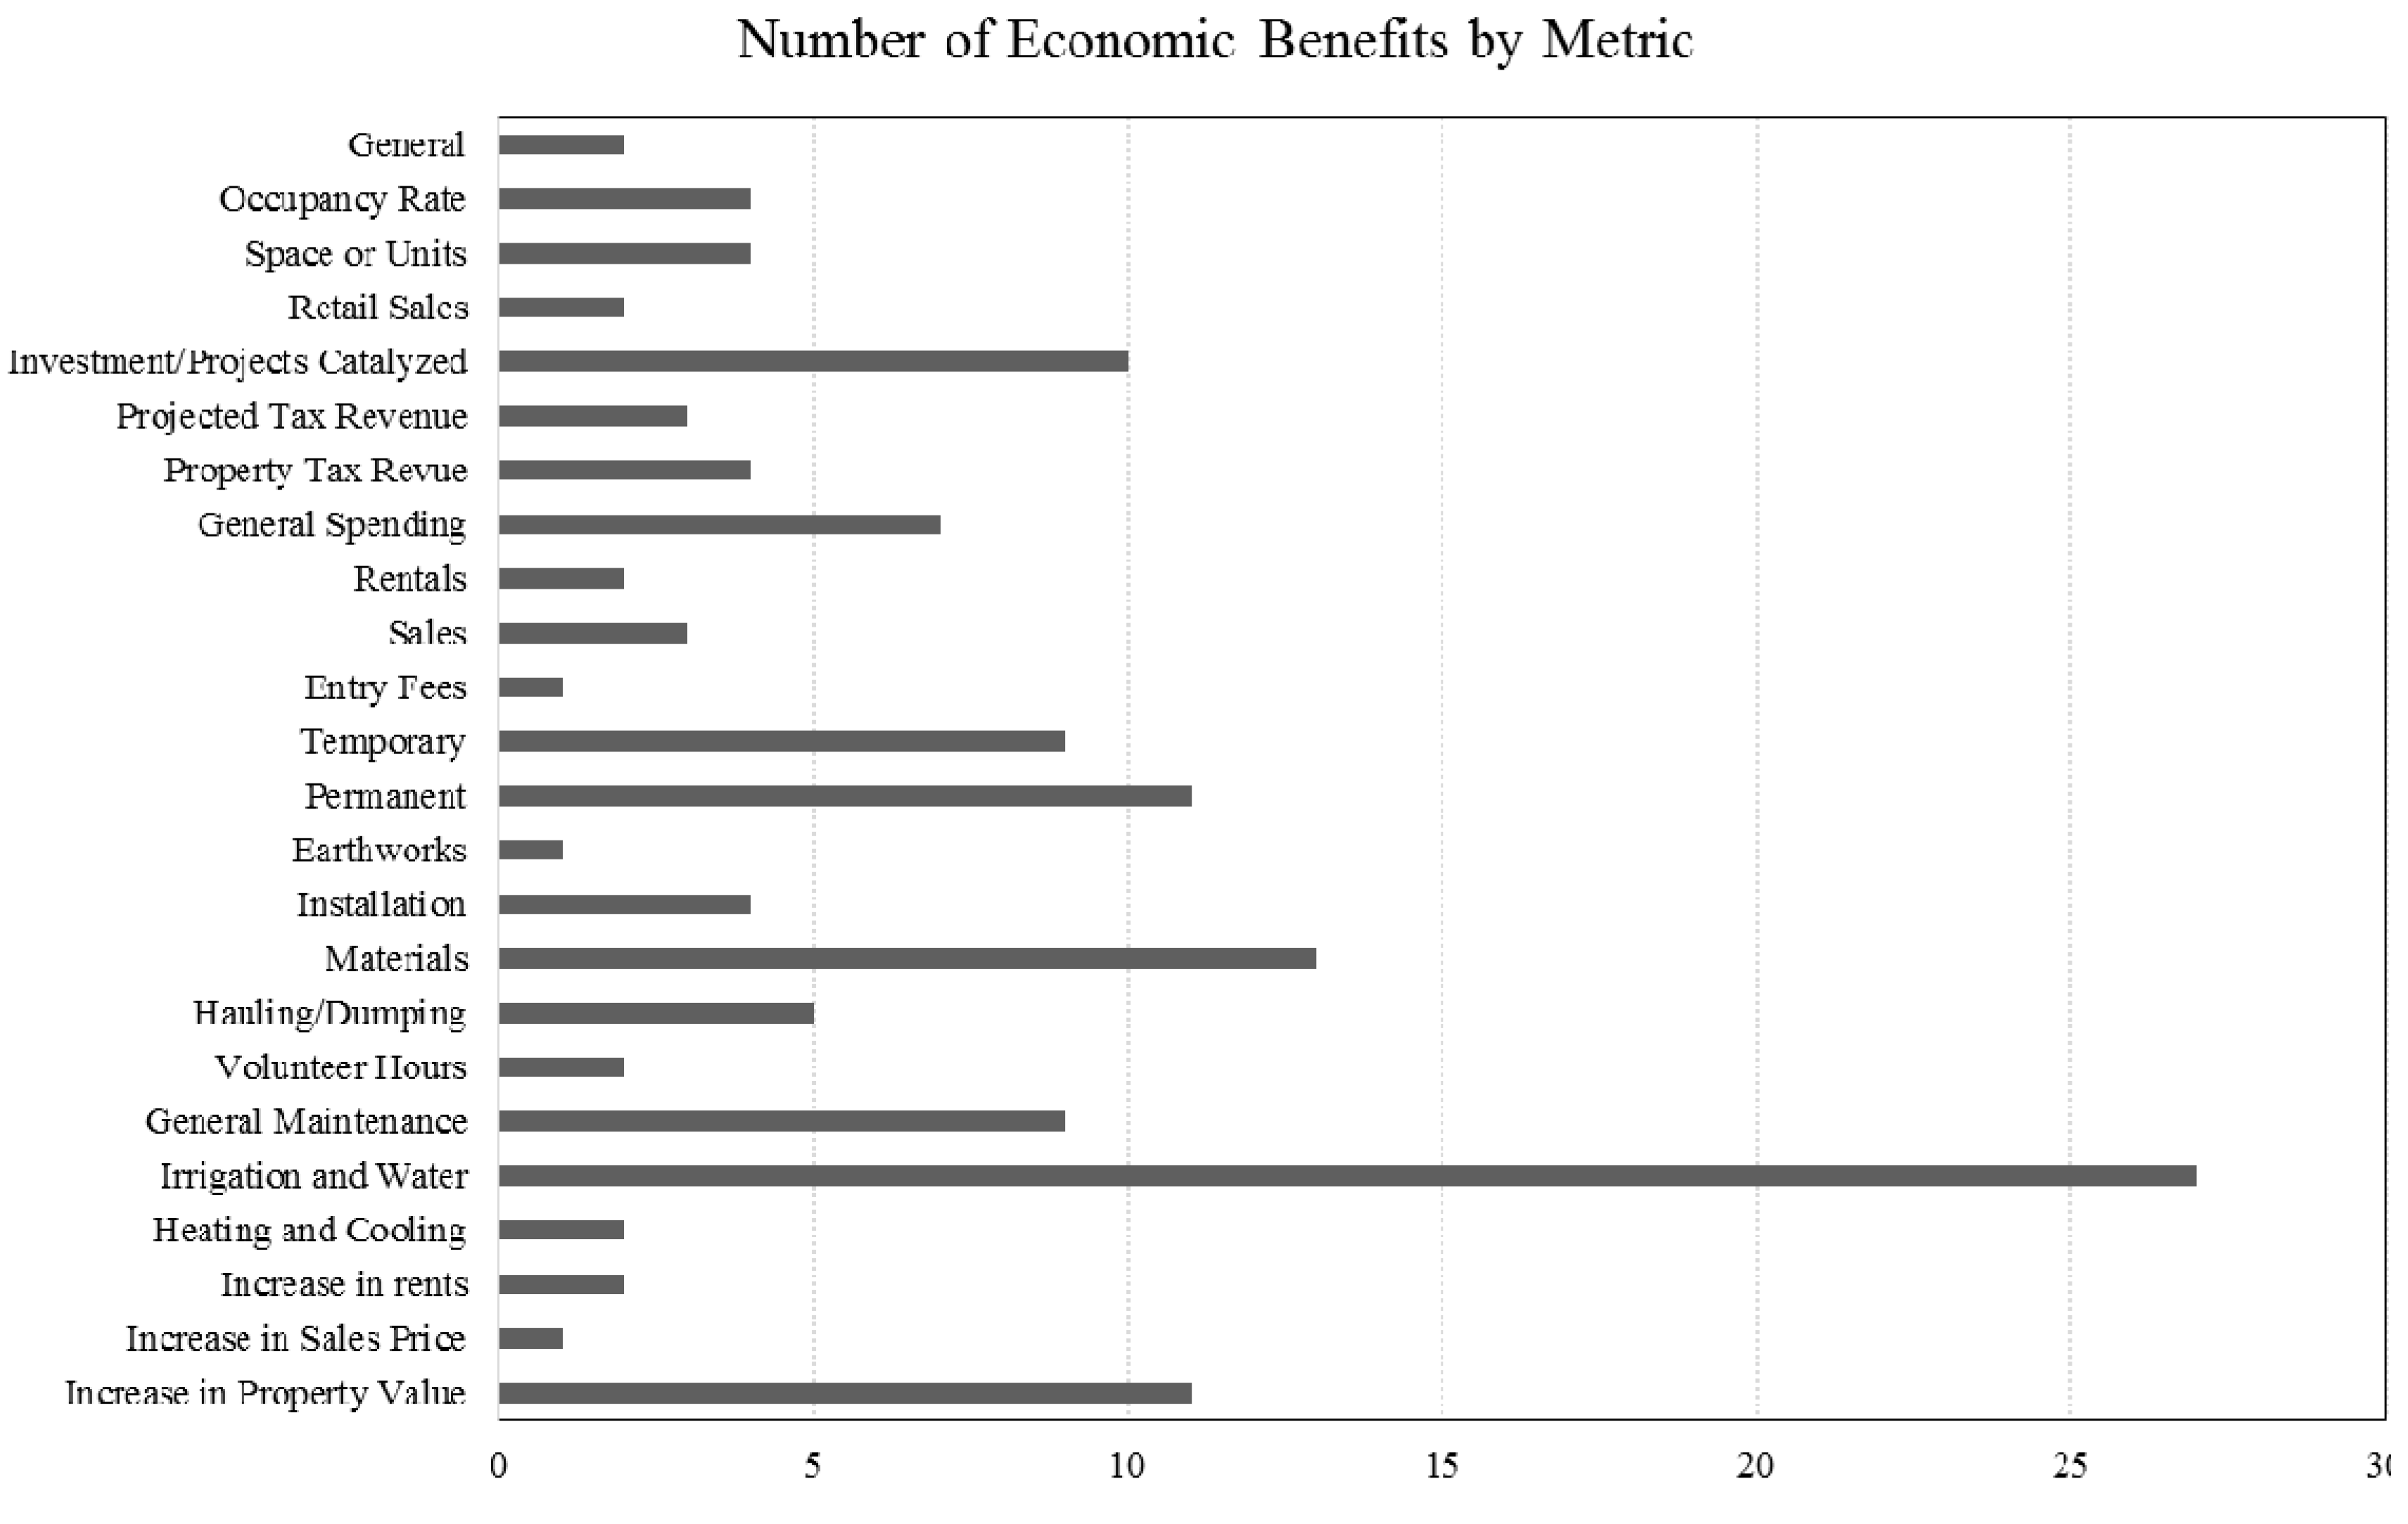
We outline the results of a comprehensive analysis of the LPS research approaches, as organized following the seven economic performance categories established by the LAF: (1) property value, (2) operations-and-maintenance savings, (3) construction cost savings, (4) job creation, (5) visitor spending, (6) increased tax base/revenue, and (7) economic development (Table 1). Figure 1 is an overview of the percentages of economic benefit categories in LPS. There are 24 detailed metrics under these seven categories. Figure 2 shows the benefit breakdowns per metric.

Table 1.
Categories and metrics for economic benefits assessment in the Landscape Architecture Foundation’s Landscape Performance Series.
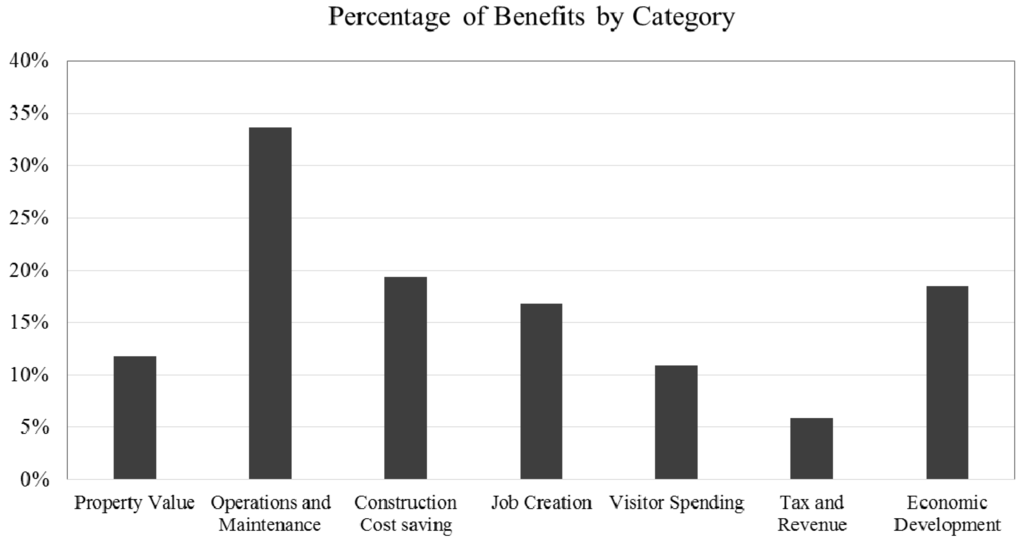
Figure 1.
Percentage of economic benefits by category in the Landscape Architecture Foundation’s Landscape Performance Series.
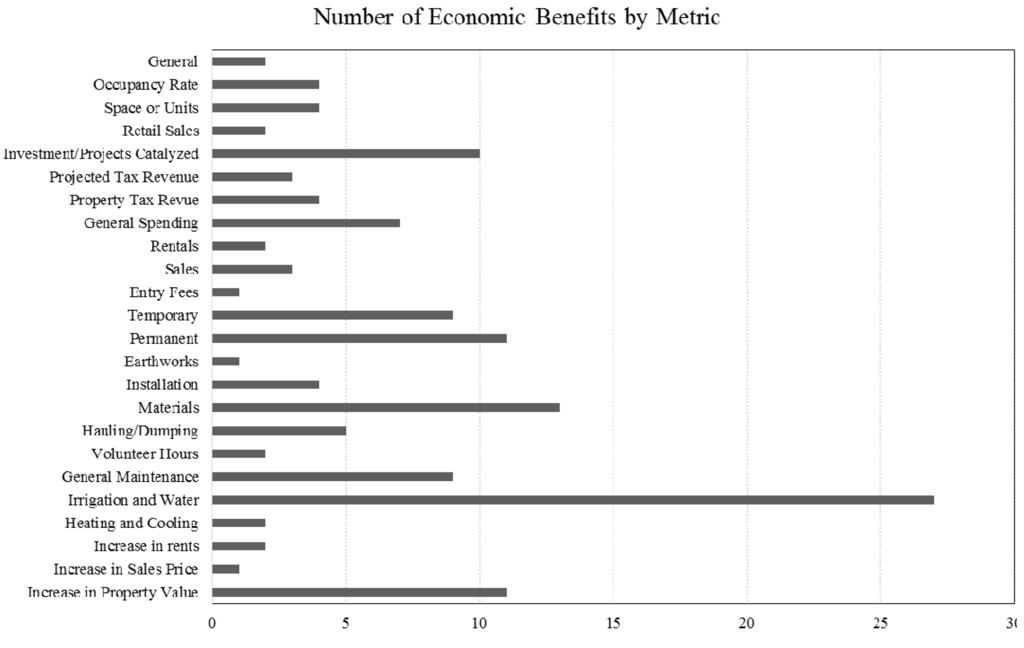
Figure 2.
Economic benefits assessed by metric categories in the Landscape Architecture Foundation’s Landscape Performance Series.
As shown in Figure 1, the top three assessed economic benefit categories are: operations-and-maintenance savings (34%), construction cost savings (19%), and economic development (18%). The sum of these three totals is 71% of the total cases evaluated. In addition, 68% of the cases that fall under the operations-and-maintenance savings category belong to the metric of irrigation-and-water. The disparity is apparent with respect to benefit categories and associated metrics being assessed, while suggesting room for improvement in other less-evaluated areas. It is apparent that the top-assessed categories and metrics (see Figure 1 and Figure 2) are directly related to the design process (e.g., site inventory, planning/design, and construction) and, as a result, designers and researchers find first-hand data readily accessible. On the other hand, in benefit categories that designers encounter less in their daily practice, or when designers/researchers need to rely on additional information or expertise to perform the assessment (e.g., tax revenue, visitor spending), the numbers of reported LPS cases decrease substantially. The section below provides a detailed account on possible metrics and methods for economic benefits assessment as synthesized from the LPS database.
3. Existing Metrics and Methods in LPS
Table 2 presents a comprehensive list of metrics and methods used in LPS economic benefit research. For most of the metrics, project performance may be obtained remotely using secondary data. Regarding the metric of construction cost savings, data may be available from contractors, clients, municipalities, or other sources. In other cases, such as for the metrics of visitor spending and increased tax base/revenue, it would be necessary to review receipts or financial records in order to assess visitor spending and tax revenue data. No specialized or expensive equipment is necessary to perform the methods recommended in Table 2. Below is a description of the seven LAF-defined economic benefit categories.
Table 2.
Metrics and methods used in landscape performance assessment in the Landscape Architecture Foundation’s Landscape Performance Series.
3.1. Property Values
Property values are a benefit concerned with measuring the increase in real estate value derived from a landscape design. Property value increases are perhaps the most tangible indicators of landscape economic performance, and are highly relevant to real estate developers and others who often fund the development of green spaces [19]. At times, the landscape project may be the only change which occurred in an area, showing a direct impact on property values. At other times, the project may have occurred in conjunction with a rezoning, additional development, or other relevant factors. In the latter cases, the landscape intervention can be framed as a contributor to increased property values rather than the sole driver.
3.2. Operations and Maintenance Savings
By creating a resilient and self-sustaining landscape that requires fewer inputs of time, money, and resources than are traditionally required, landscape design can result in significant long-term savings over the entire life of a project. The savings that accrue fall into the category of operations-and-maintenance savings.
3.3. Construction Cost Savings
LPS categorizes one-time savings that result from reducing the expenses associated with implementing a landscape design as construction cost savings. The construction phase of landscape design can be planned in such a manner that it results in significant cost savings for the client [20]. In turn, many of these cost saving measures also provide environmental benefits. For example, reusing concrete from a demolished building on a site not only obviates the need to purchase new concrete, it also reduces the project’s environmental impact by diminishing the materials and energy needed to produce new concrete and aggregate. Demonstrating construction cost savings can be a valuable tool in persuading clients of the value of sustainable landscape practices, such as demonstrated through the Sustainable Sites Initiative (SITES) [21,22]. Calculating the value of materials and the costs of hauling and dumping are based on local prices for landfill access, gasoline, and other factors.
3.4. Job Creation
Landscape development projects can often result in the creation of full-time permanent employment for land managers, support staff, maintenance crews, and others. In addition, projects may contribute to the local economy by indirectly creating jobs in nearby areas that serve visitors, residents, or others who are drawn to the area by the landscape development [23]. Finally, all projects not undertaken entirely by volunteers will also create temporary jobs during the construction and implementation of the design. These facets of economic growth fall under the category of job creation, including direct and indirect permanent jobs. Job creation is a key indicator of economic health and can be a powerful tool for researchers quantifying landscape performance.
3.5. Visitor Spending
Visitor spending refers to the amount of money spent by visitors to a designed landscape. This spending is derived from landscape design projects that have the ability to draw local, regional, national, and international visitors. Depending on the type of landscape, there may be entrance fees, membership fees, or other types of visitor spending that can be quantified and analyzed. Particularly large and well-known sites that may draw hundreds of thousands or even millions of visitors per year can have a significant impact on the visitor spending within a city or a region. These projects can be treated as having enough impact on larger trends to derive information about their contribution from city- or region-wide data on visitor spending and other activity.
3.6. Increased Tax Base/Revenue
Measuring the tax revenue generated for towns, municipalities, or other governments through landscape improvements falls into the category of increased-tax-base/revenue. An increase in tax base can be seen as the public-sector equivalent benefit that derives from increased property values. This information can be enormously valuable to municipal partners investing in parks, open spaces, business improvement districts, and other landscape projects. Investment in landscape projects can lead to a broader tax base, which may lead to increased revenue district-wide as an area becomes a more popular and active destination.
3.7. Economic Development
Finally, landscape design can have a profound influence on overall economic development of a site, neighborhood, or region [24]. Economic development is a catch-all category that concerns benefits that assess the impacts on spending and occupancy derived from landscape projects. Economic development can be indicated by measurements of spending, growth, and increased revenue in areas directly affected by landscape development projects. Typologies such as streetscapes, transit-oriented developments, and waterfront redevelopments are particularly suited to this category of benefit quantification.
4. Case Studies
LAF’s case study method involves the collection and analysis of different kinds of information, including (1) baseline data, (2) role of key project participants, (3) financial aspects, (4) project goals, (5) design and decision-making processes, (6) use and perceptions, (7) unique constraints, and (8) project successes and limitations [17,25]. The intent is to provide in-depth analyses of cases that would warrant replicable solutions to complex problems
In this study, three case studies are chosen, each representing a good example for one of the top three economic benefit categories assessed. These three categories are: operations-and-maintenance savings, construction cost savings, and economic development (see Figure 1). The specific benefit shown for each case study is chosen because its method is highly replicable in similar projects. Table 3 summarizes the basic information of the three cases and the corresponding economic benefits.
Table 3.
Select cases for the top three reported economic benefits categories in the Landscape Architecture Foundation’s Landscape Performance Series.
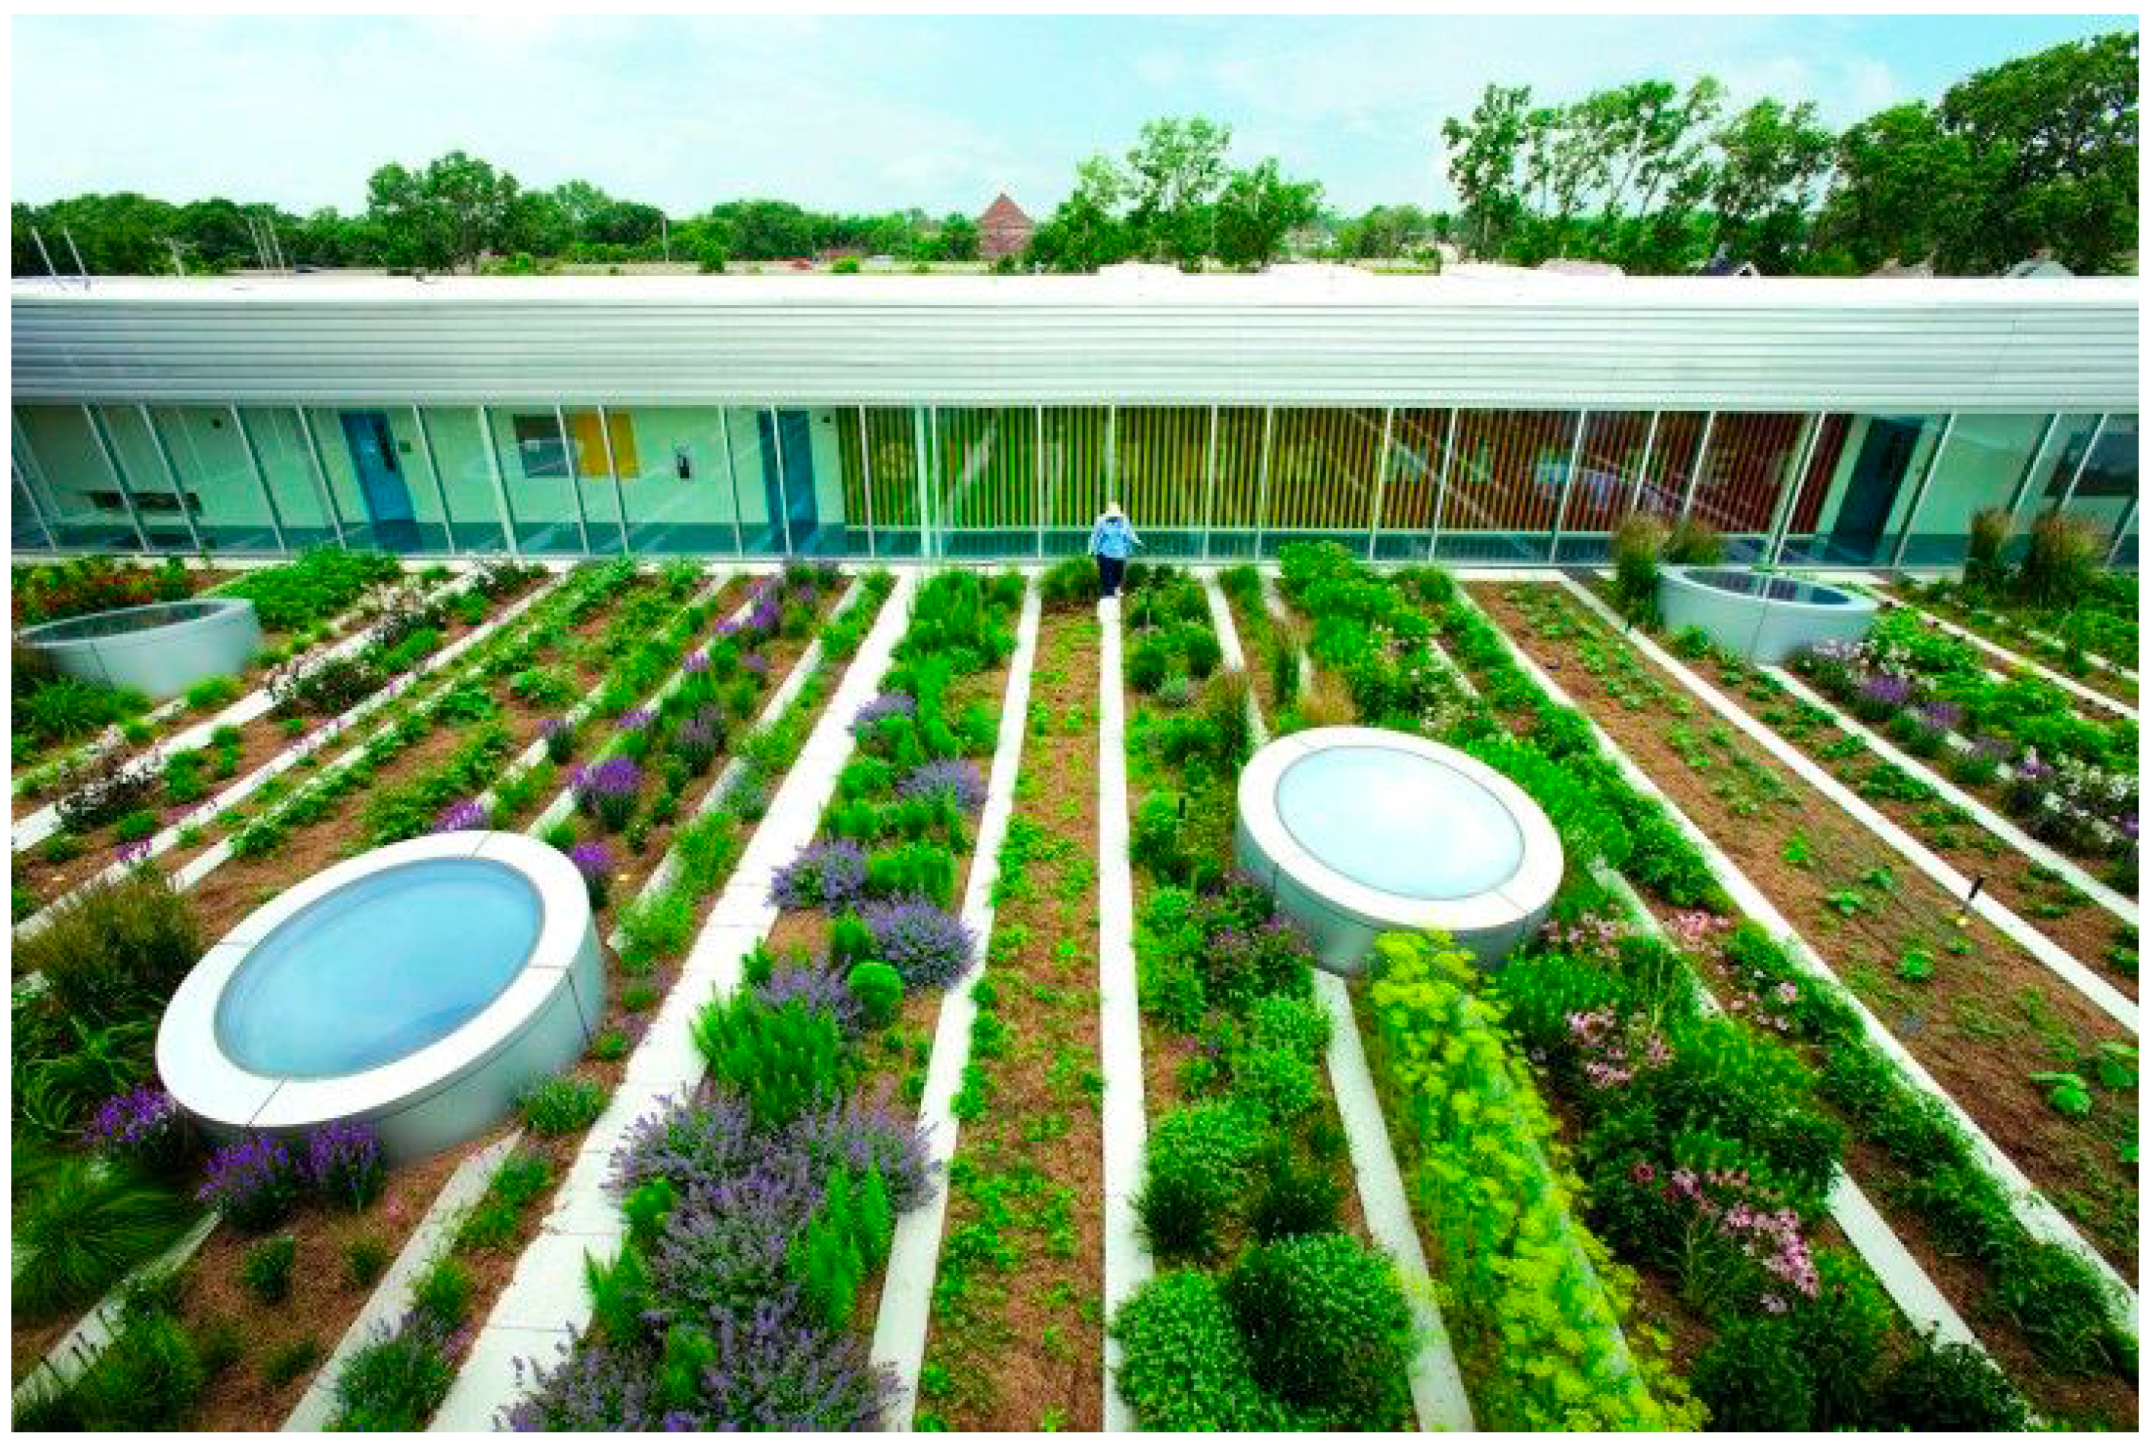
4.1. Gary Comer Youth Center—An Example of Operations-and-Maintenance Savings
The Gary Comer Youth Center (GCYC) is located on Chicago’s south side. It offers extracurricular activities and hands-on learning opportunities in a safe environment. Its economic benefit assessment offers an example of operations-and-maintenance-savings because of an intensive green roof design (Figure 3) [26].

Figure 3.
Gary Comer Youth Center Roof, Chicago, Illinois (photo courtesy: Scott Shigley. Hoerr Schaudt, Chicago, USA).
Energy savings from this green roof are calculated based on the Green Roof Calculator developed by the Portland State University Green Building Research Laboratory. The Green Roof Energy Module estimates the combined energy savings (cost/therms and cost/kWh) compared to a conventional roof. This module is based on the type and location of the building, roof surface area, growing media depth, leaf area index, and percentage of plant coverage [27].
Electricity rates for the state of Illinois are based on the U.S. Department of Energy’s Average Retail Price [27]. The average cost of natural gas is 121.8 cents/therm and 9 cents/kWh [28]. The total amount of energy saved is based on GCYC roof specifications and averaged energy costs. The energy savings are then used to calculate the corresponding monetary savings. The estimated savings of 642.58 kWh and 156.53 therms, would generate an annual savings of $248.80 [26].
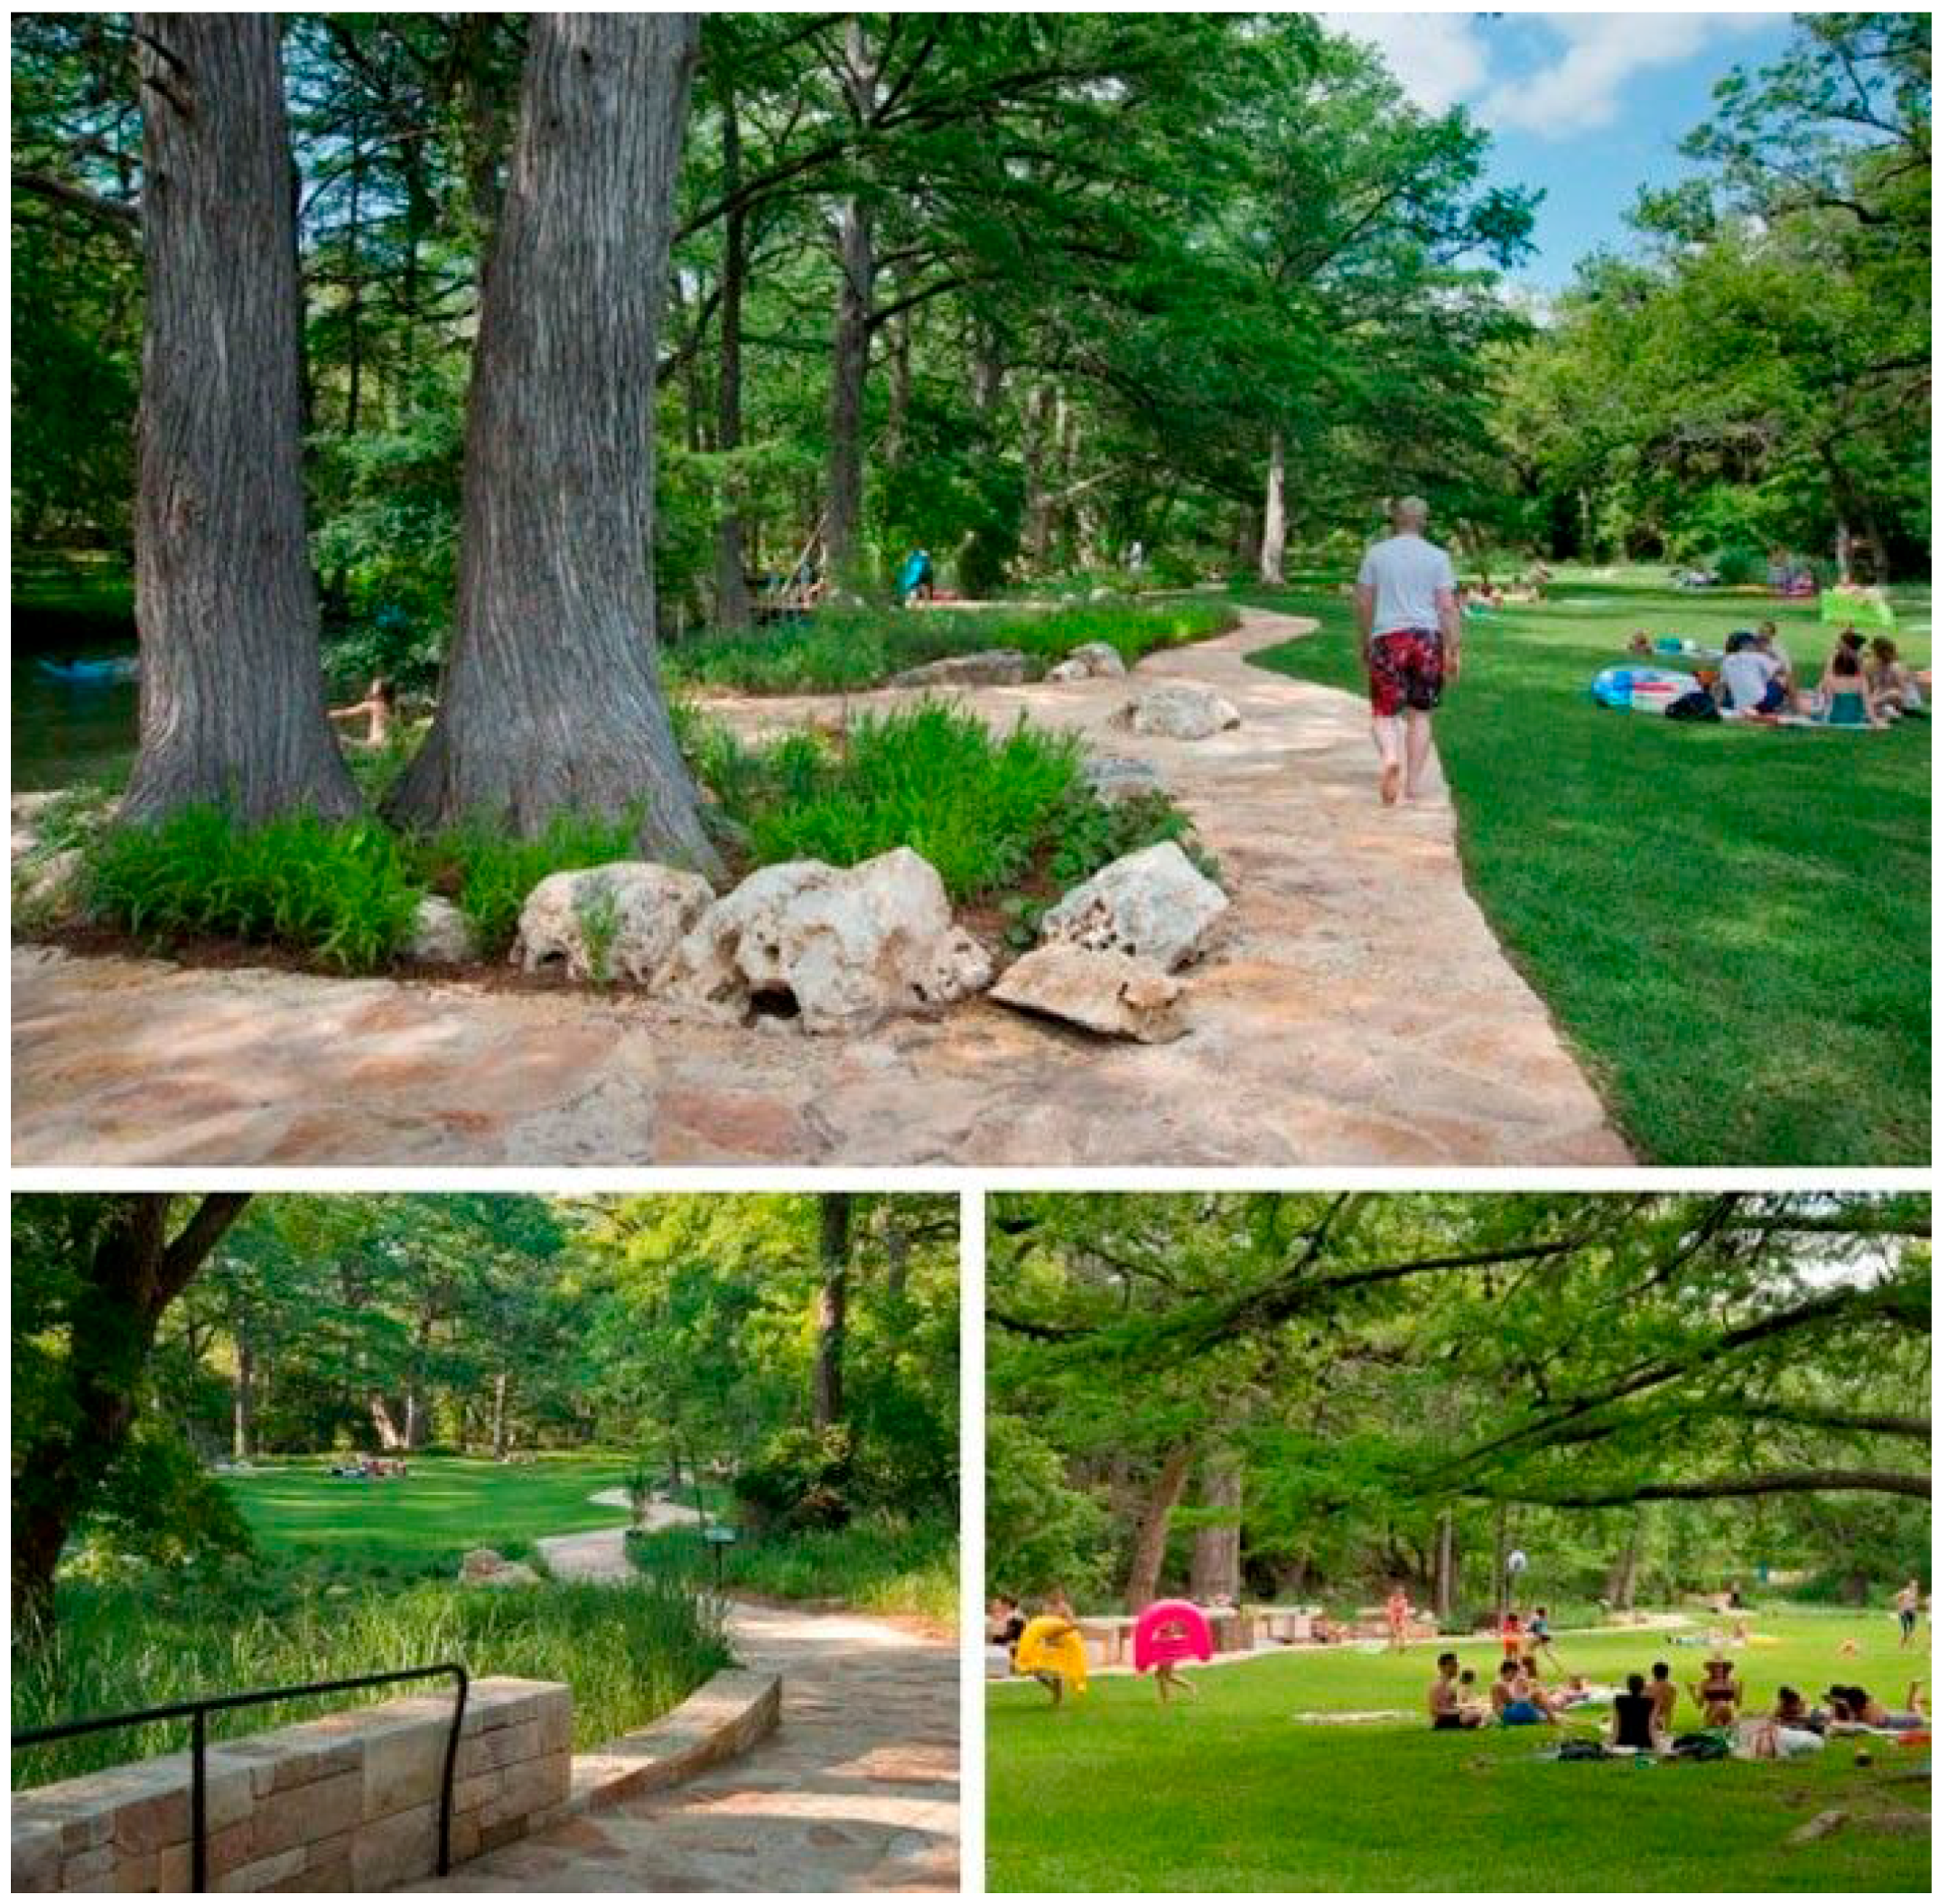
4.2. Blue Hole Regional Park—an Example of Construction-Cost Savings
The Blue Hole Regional Park is located in the heart of the rugged Texas Hill Country in Texas (Figure 4). In 2005, the city of Wimberley purchased the “Blue Hole” swimming area and surrounding 126 acres (50.99 ha) in order to protect the pristine waters [29]. According to the construction documents, nearly 5 acres (2.02 ha) of the park receives mulch. This area is multiplied by a 5-inch (13 mm) average depth (number confirmed by the landscape contractor). The total volume is multiplied by the average cost of local mulch (c.a., $70/cubic yard ($92/cubic meter)) [29].

Figure 4.
Blue Hole Regional Park, Wimberley, Texas (photo © D.A. Horchner. Design Workshop, Inc., Denver, USA).
Construction savings are calculated as follows: 4.957 acre (23,992 square yard) (2 ha) of mulch used on site; 23,992 square yard @ average 5-inch depth = 3332 cubic yard (2547 cubic meter); 3332 cubic yard @ $69/cubic yard = $229,908 saved [29].
Enough cedar mulch is created to cover all designed mulch areas plus an additional 1–2 inch (2.54−5.08 mm), and to create a stockpile on site for future freshening of the mulch areas [29]. Limitations of this method include fluctuating mulch prices and an assumption that the mulch is spread at a uniform thickness throughout all mulched areas of the park.
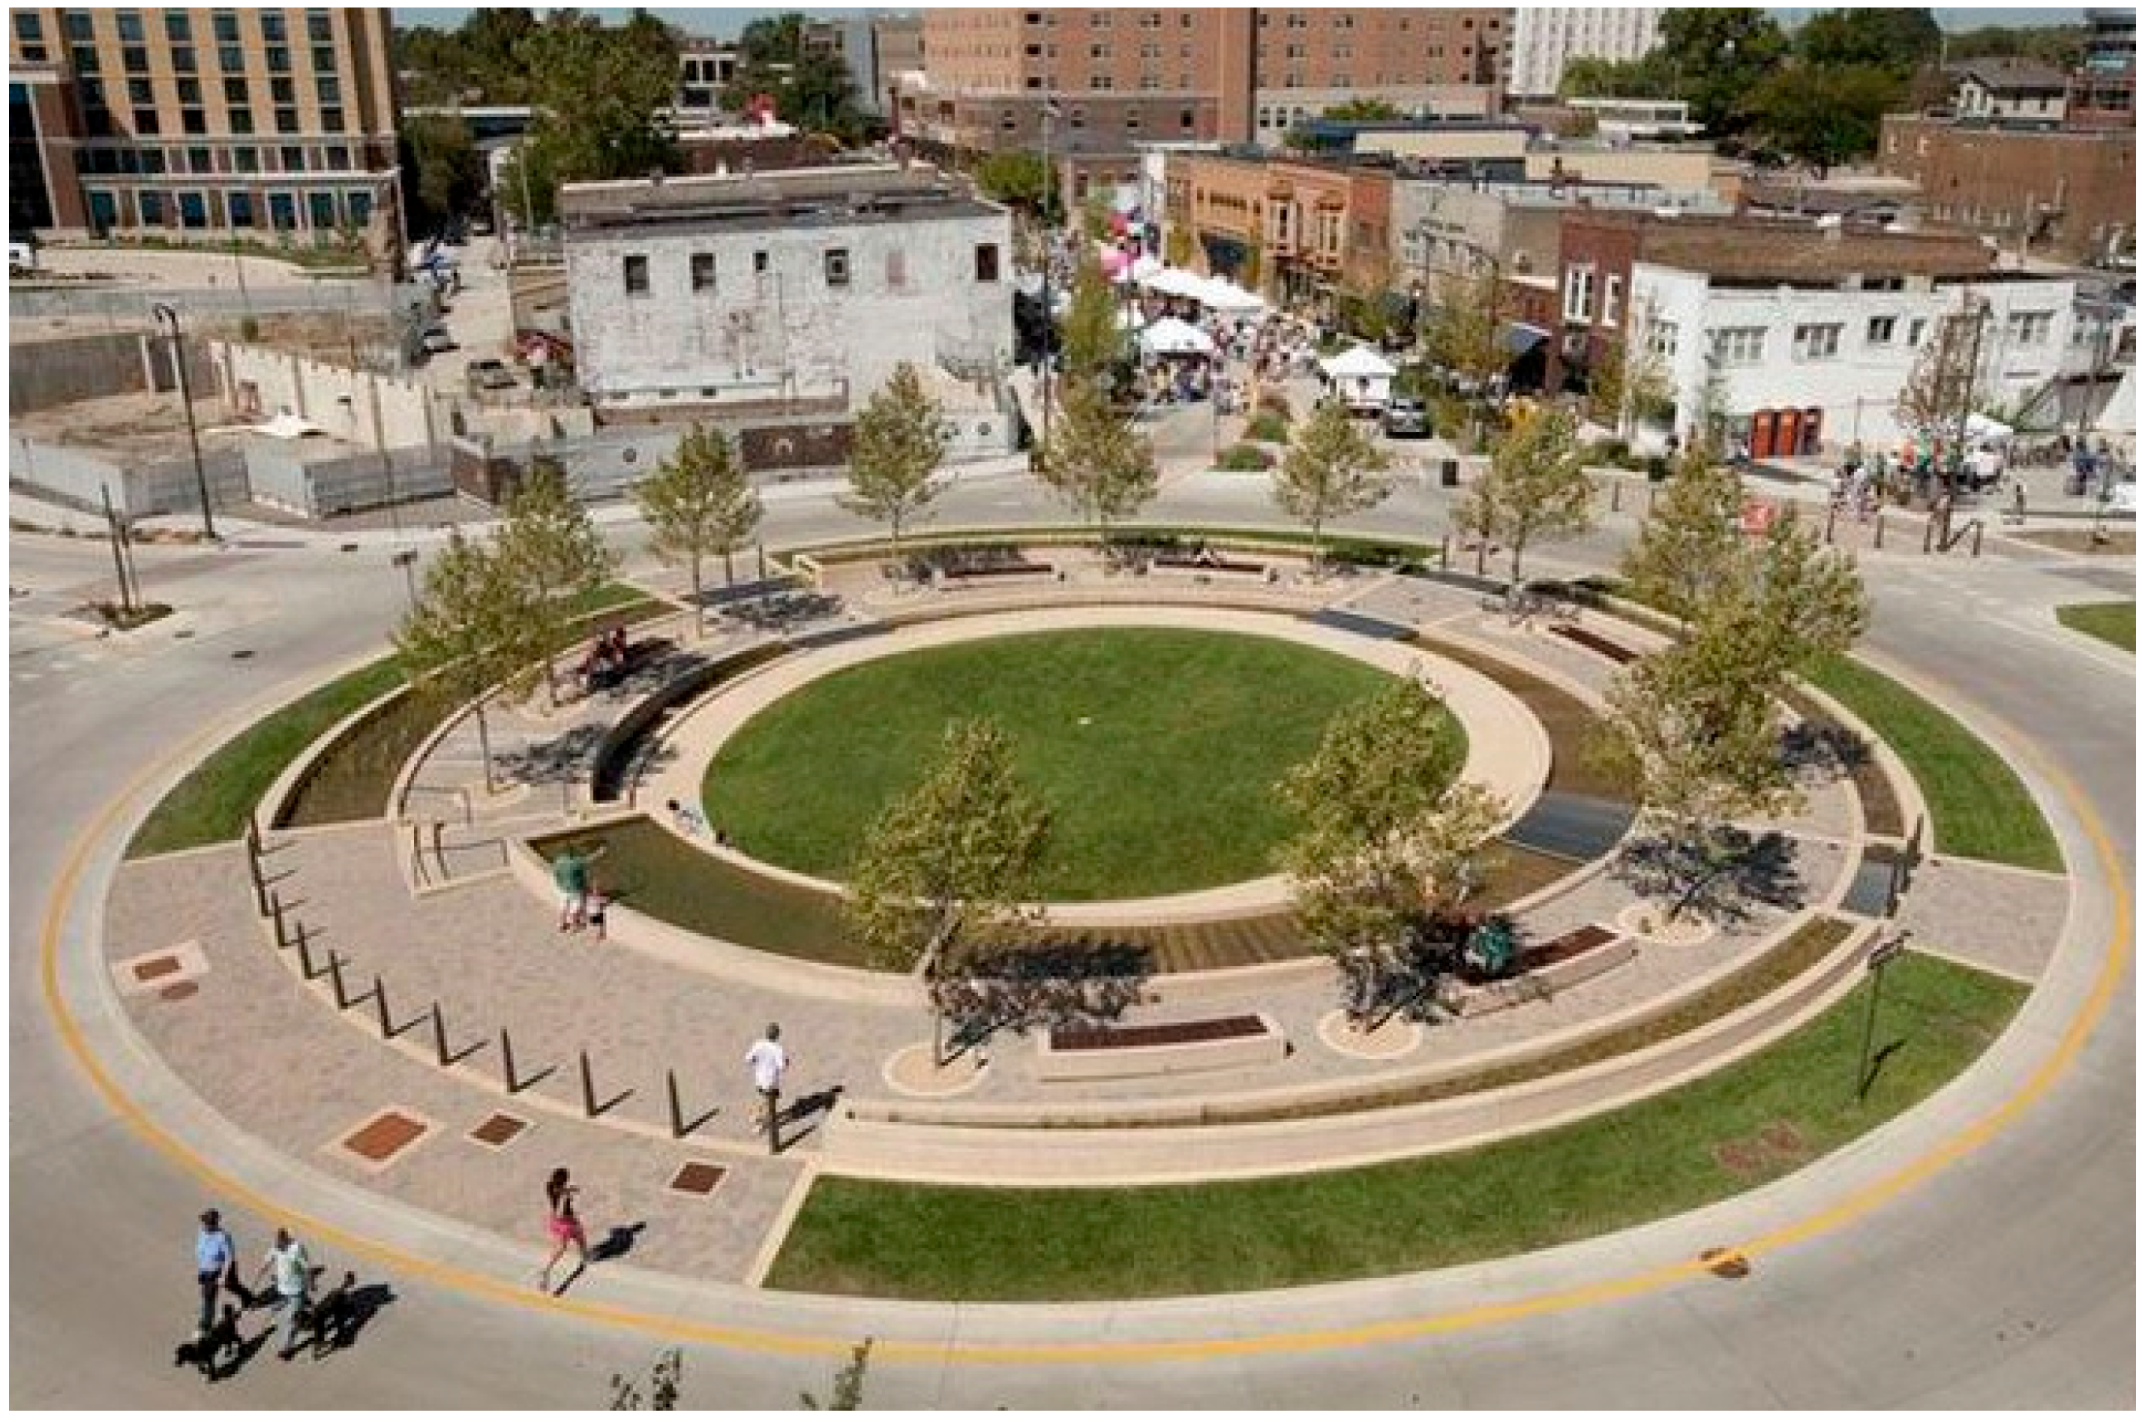
4.3. Uptown Normal Circle and Streetscape—an Example of Economic Development
This streetscape retrofit project incorporates stormwater management and public recreation into a vibrant gathering space that also encourages economic development (Figure 5). Researchers’ communication with the Bloomington-Normal Marriott hotel indicated that there have been four professional conferences held in Normal because of the completion of the traffic circle (AIA Illinois Chapter, Illinois Association for Floodplain and Stormwater Management, Illinois Association of Wastewater Agencies, Illinois City/County Management Association, and Illinois Chapter American Planning Association) [30].
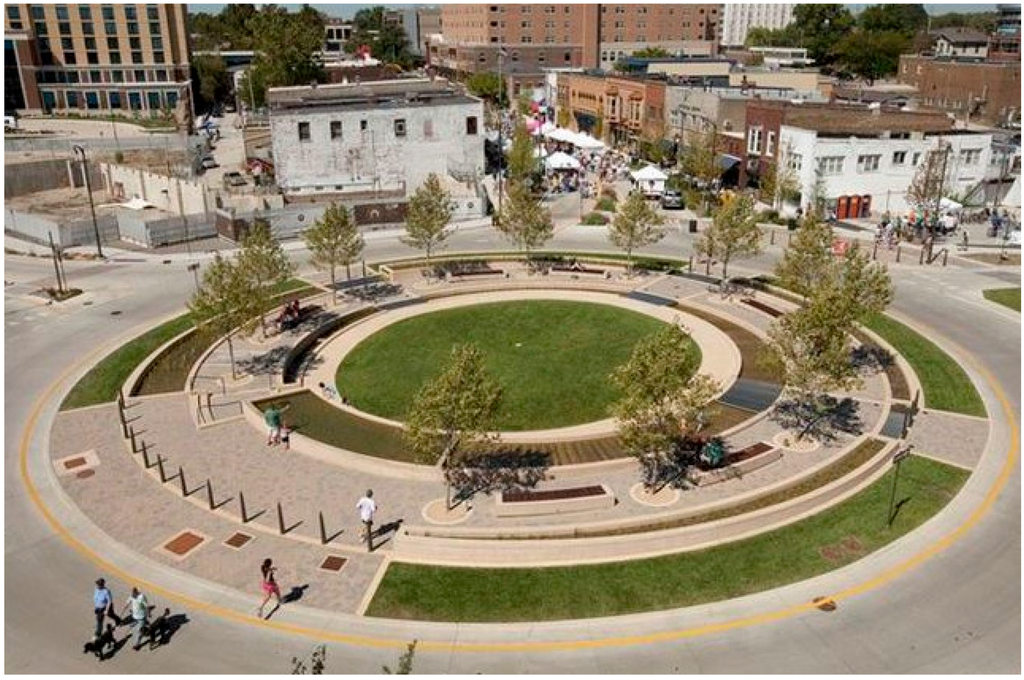
Figure 5.
Uptown Normal Circle and Streetscape, Normal, Illinois (photo courtesy: Hoerr Schaudt. Hoerr Schaudt, Chicago, USA).
Researchers then contacted the organizations holding the conferences to obtain data on attendance, hotel room rates, registration fees, and other economic impacts. As a result, the approximate amount of revenue generated is determined: number of participants × registration fees + cost of hotel rooms (assuming $119 per night per person, the conference rate) + a $46 per diem per day (based on the federal per diem rate for Illinois). For these four conferences, the estimated revenue generated totals $681,398 [30]. Limitations of this method include an inability to determine further impacts that conference attendees may have had while dining in restaurants, using local transportation, and other spending.
5. Discussion
Compared with other allied disciplines, scholarly productivity in United States within the field of landscape architecture remains low, although with steady improvements in the past decades [31,32,33,34]. In this sense, landscape performance assessment would be an actionable agenda item that contributes to landscape research and practice. Supported by empirical examinations, such as cases from the LPS database, landscape architecture, as a discipline, would gain a better status in society.
5.1. Considerations for Improvement
The need of demonstrating economic benefits of landscape performance is clear, while some considerations are key to the success of performance assessment. Temporal scale is one of them. Landscapes are dynamic systems; hence, the reported benefits are arguably temporary, given that no tree or other landscape modification will last forever without maintenance. A tree, itself, needs time to reach maturity in order to provide the expected benefits. Therefore, truly sustainable economic benefits must be more than simply the construction of a beneficial landscape—they must also include a long-term plan for the upkeep and continued viability of that landscape that is self-sustaining and able to carry the current benefits into the future.
Another important consideration is to contextualize economic analysis and report the direct impacts from the project under investigation, rather than encompassing the spillover effects. For the metric of job creation, for instance, it is cautionary to attribute job creation in nearby developments as being caused by the landscape project. There must be a direct and identifiable link between the landscape project and the jobs created in order to create a defensible benefit. Similarly, for the metric of economic development, the size of the project and its impact on the area must be accounted for and noted in reporting benefits. It may be advantageous to state that the landscape project contributed to certain increases rather than to say they it caused them as there are likely many variables at play.
Finally, the robustness of the method and validity of data sources in LPS, in general, need improvement. Using the metric of property values as an example, one should be careful not to substitute one metric with another, as oftentimes data are reported in different forms, such as a total value, a percentage change in value for the entire assessed area, or a percentage change per property in relation to the city median. It is also recommended that researchers collect first-hand data whenever possible and develop hypotheses that directly examine the research questions, and reduce the instances where proxy data or information are relied upon.
5.2. Implications to Landscape Architecture Education and Design Process
Although economic benefits are often considered as project priorities in professional practice [35,36,37], the assessment of these benefits in education needs to be better emphasized, as it is not a strength area in the current curricula. Most curricula put emphasis on environmental benefits. When economic benefits are addressed, few courses illustrate a procedure that can effectively measure or assess them.
Compared with environmental benefits which may be predicted in the design phase, many economic benefits aforementioned (e.g., visitor spending, increased tax base/revenue) are not easy to predict at this phase. Landscape architects are either not acquainted with ways to access these benefits, or they do not normally perform a follow-up analysis after the project is built. On other occasions where economic benefits could be assessed during project design and construction, designers are recommended to document evidence. For example, the reuse of materials will generate construction cost savings, a metric that can be assessed rather accurately through construction documentation (e.g., delineate areas where reused materials are applied).
In short, integrating economic benefits assessment in the design process, and in-studio teaching in particular, would help instill a culture of performance assessment for the next generation of practitioners, in the enterprise of achieving (better) sustainable design solutions anchored in empirical evidence. It takes time for a project’s economic benefits and fiscal impacts to become observable and measurable. Long-term and short-term economic benefits need to be gauged for benefit optimization. So doing will enhance designers’, decision-makers’, and the general public’s confidence in the level of services that landscape designs can provide.
6. Conclusions
This paper introduces a research and practice frontier in landscape architecture, landscape performance research, and reviews the current status of economic benefits assessment in the LPS. The grand sustainable challenges that we face today cannot be solved by a single design profession. Resilient landscape design calls for (quantitatively) demonstrated project performance in order to reduce uncertainties, and whole-systems designs, from site to regional scales, are essential. Central to this endeavor is the integration of landscape architecture with allied professions, and through evidence-based designs that are informed by science.
Acknowledgments
We thank Katharine Burgess, Heather Whitlow, Barbara Deutsch, Allyson Mendenhall, and Kurt Culbertson for their indispensable help with this research. We also thank Di Wang for preparation of an early version of the database. This research was supported by the Landscape Architecture Foundation (LAF) Landscape Performance Analysis Grant, the California Landscape Architectural Student Scholarship Fund (CLASS Fund), the Utah Agricultural Experiment Station, Utah State University (approved as journal paper number 8731), the NSF EPSCoR grant EPS 1208732 awarded to Utah State University, as part of the State of Utah Research Infrastructure Improvement Award, the National Natural Science Foundation Project of China (grant number: 51008135), and the Fundamental Research Funds for the Central Universities, HUST (grant number: 2015QN060). Any opinions, findings, and conclusions or recommendations expressed are those of the authors and do not necessarily reflect the views of the LAF, the CLASS Fund, the Utah Agricultural Experiment Station, the National Science Foundation, the National Natural Science Foundation of China, or the Fundamental Research Funds for the Central Universities, HUST.
Author Contributions
The authors have contributed equally in the research design and development, the data analysis and the writing of the paper. The authors have read and approved the final manuscript.
Conflicts of Interest
The authors declare no conflict of interest.
Abbreviations
The following abbreviations are used in this manuscript:
| LPS | the Landscape Performance Series |
| LAF | the Landscape Architecture Foundation |
| GCYC | The Gary Comer Youth Center |
References and Notes
- Faber, M. How to be an ecological economist. Special section: Integrated hydro-economic modelling for effective and sustainable water management. Ecol. Econ. 2008, 66, 1–7. [Google Scholar] [CrossRef]
- Luo, Y.; Li, M.-H. A study of landscape performance: Do social, economic and environmental benefits always complement each other? Landsc. Resear. Rec. 2013, 1, 566–577. [Google Scholar]
- Yang, B.; Zhang, Y.; Blackmore, P.; Zhang, Y.; Blackmore, P. Performance and economic benefits of four streetscape renovations: A comparative case study investigation. Landsc. Resear. Rec. 2014, 2, 300–309. [Google Scholar]
- Ozdil, T.R.; Stemart, D.M.; Feng, Y.-J.; Ren, W. Assessing economic performance of landscape architecture projects: Lessons learned from texas case studies. Landsc. Archit. 2015, 1, 70–86. (In Chinese) [Google Scholar]
- Ioppolo, G.; Cucurachi, S.; Salomone, R.; Saija, G.; Shi, L. Sustainable Local Development and Environmental Governance: A Strategic Planning Experience. Sustainability 2016, 8, 180. [Google Scholar] [CrossRef]
- Wang, Z.; Tan, P.Y.; Zhang, T.; Nassauer, J.I. Perspectives on narrowing the action gap between landscape science and metropolitan governance: Practice in the us and china. Landsc. Urban Plann. 2014, 125, 329–334. [Google Scholar] [CrossRef]
- Canfield, J.; Yang, B. Reflections on developing landscape performance case studies. Landsc. Resear. Rec. 2014, 2, 310–317. [Google Scholar]
- Canfield, J.; Yang, B.; Whitlow, H.; Burgess, K.; Koudounas, A. Landscape Performance: A Guidebook for Metric Selection; Landscape Architecture Foundation: Washington, DC, USA, 2015. [Google Scholar]
- Ndubisi, F.; Whitlow, H.; Deutsch, B.; Duan, S.-L.; Zhang, X.-W. Landscape performance: Past, present, and future. Landsc. Archit. 2015, 1, 40–51. (In Chinese) [Google Scholar]
- Preiser, W.F.E.; Rabinowitz, H.Z.; White, E.T. Post-Occupancy Evaluation; Van Nostrand Reinhold company: New York, NY, USA, 1988. [Google Scholar]
- Brown, R.D.; Corry, R.C. Evidence-based landscape architecture: The maturing of a profession. Landsc. Urban Plann. 2011, 100, 327–329. [Google Scholar] [CrossRef]
- Brink, A.V.D.; Bruns, D. Strategies for enhancing landscape architecture research. Landsc. Resear. 2014, 39, 1–14. [Google Scholar]
- Ervin, J.; Mulongoy, K.J.; Lawrence, K.; Game, E.; Sheppard, D.; Bridgewater, P.; Bennett, G.; Gidda, S.B.; Bos, P. Making protected areas relevant: A guide to integrating protected areas into wider landscapes, seascapes and sectoral plans and strategies. In CBD Technical Series No. 44; Convention on Biological Diversity: Montreal, Canada, 2010; p. 94. [Google Scholar]
- Felson, A.J.; Pickett, S.T. Designed experiments: New approaches to studying urban ecosystems. Front. Ecol. Environ. 2008, 3, 549–556. [Google Scholar] [CrossRef]
- Mission of the Landscape Architecture Foundation (LAF). Available online: http://landscapeperformance.org/about-landscape-performance (accessed on 10 August 2014).
- Yang, B.; Li, S.; Binder, C. A research frontier in landscape architecture: Landscape performance and assessment of social benefits. Landsc. Resear. 2016, 41, 314–329. [Google Scholar] [CrossRef]
- Francis, M. A case study method for landscape architecture. Landsc. J. 2001, 20, 15–29. [Google Scholar]
- Green Roof Energy Calculator. Available online: http://greenbuilding.pdx.edu/GR_CALC_v2/grcalc_v2.php#retain (accessed on 5 December 2014).
- Tyrväinen, L.; Miettinen, A. Property prices and urban forest amenities. J. Environ. Econ. Manag. 2000, 39, 205–223. [Google Scholar] [CrossRef]
- Thompson, J.W.; Sorvig, K. Sustainable Landscape Construction: A Guide to Green Building Outdoors; Island Press: Washington, DC, USA, 2000; Volume 91, pp. 82–83. [Google Scholar]
- Calkins, M. The Sustainable Sites Handbook: A Complete Guide to the Principles, Strategies, and Best Practices for Sustainable Landscapes; John Wiley & Sons: Hoboken, NJ, USA, 2012. [Google Scholar]
- Steiner, F.; Simmons, M.; Gallagher, M.; Ranganathan, J.; Robertson, C. The ecological imperative for environmental design and planning. Front. Ecol. Environ. 2013, 11, 355–361. [Google Scholar] [CrossRef]
- Hubbard, P. Urban design and local economic development: A case study in birmingham. Cities 1995, 12, 243–251. [Google Scholar] [CrossRef]
- Shafik, N. Economic development and environmental quality: An econometric analysis. Oxford Econo. Papers 1994, 46, 757–773. [Google Scholar]
- Francis, M. Village homes: A case study in community design. Landsc. J. 2002, 21, 23–41. [Google Scholar] [CrossRef]
- Yocom, K.; Lacson, D. Gary Comer Youth Center. Available online: http://landscapeperformance.org/case-study-briefs/gary-comer-youth-center (accessed on 5 August 2015).
- Electricity rates for the state of Illinois are based on the U.S. Department of Energy’s Average Retail Price for Consumers by Sector, Census Division and State. 2009. Available online: http://www.eia.doe.gov/cneaf/electricity/esr/table4.xls (accessed on 15 January 2015).
- The Average Cost of Natural Gas. Available online: http://www.npga.org/i4a/pages/index.cfm?pageid=914 (accessed on 8 March 2014).
- Canfield, J.; Fagan, E. Blue Hole Regional Park. Available online: http://landscapeperformance.org/case-study-briefs/blue-hole-regional-park (accessed on 1 October 2013).
- Ellis, C.D.; Kweon, B.-S.; Alward, S.; Burke, R.L. Uptown Normal Circle and Streetscape. Available online: http://landscapeperformance.org/case-study-briefs/uptown-normal-circle-and-streetscape (accessed on 15 November 2011).
- Milburn, L.; Brown, R.D.; Mulley, S.J.; Hilts, S.G. Assessing academic contributions in landscape architecture. Landsc. Urban Plann. 2003, 64, 119–129. [Google Scholar] [CrossRef]
- Milburn, L.; Brown, R.D. Research productivity and utilization in landscape architecture. Landsc. Urban Plann. 2016, 147, 71–77. [Google Scholar] [CrossRef]
- Gobster, P.H.; Nassauer, J.I.; Nadenicek, D.J. Landscape journal and scholarship in landscape architecture: The next 25 years. Landsc. J. 2010, 29, 52–70. [Google Scholar] [CrossRef]
- Christensen, K.M.; Michael, S.E. Quantifying scholarship production among recently tenured landscape architecture faculty. Landsc. Resear. Rec. 2014, 2, 31–39. [Google Scholar]
- Simon, H.A. Models of Bounded Rationality: Behavioral Economics and Business Organization; MIT Press: Cambridge, MA, USA, 1982; Volume 2. [Google Scholar]
- Simon, H.A. Models of Bounded Rationality: Economic Analysis and Public Policy; MIT Press: Cambridge, MA, USA, 1982; Volume 1. [Google Scholar]
- Hack, G.; Birch, E.L.; Sedway, P.H.; Silver, M.J. Local planning: Contemporary Principles and Practice; ICMA: Washington, DC, USA, 2009. [Google Scholar]

© 2016 by the authors; licensee MDPI, Basel, Switzerland. This article is an open access article distributed under the terms and conditions of the Creative Commons Attribution (CC-BY) license (http://creativecommons.org/licenses/by/4.0/).