Article

A Comprehensive Study of Agricultural Drought Resistance and Background Drought Levels in Five Main Grain-Producing Regions of China

1
Key Laboratory of Land Surface Pattern and Simulation, Institute of Geographic Sciences and Natural Resources Research, Chinese Academy of Sciences, Beijing 100101, China
2
University of Chinese Academy of Sciences, Beijing 100049, China
*
Author to whom correspondence should be addressed.
Sustainability 2016, 8(4), 346; https://doi.org/10.3390/su8040346
Submission received: 20 January 2016 / Revised: 28 March 2016 / Accepted: 5 April 2016 / Published: 8 April 2016
(This article belongs to the Section Sustainable Agriculture)

Abstract

:
Drought control and resistance affect national food security. With this in mind, we studied five main grain-producing regions of China: Sanjiang Plain, Songnen Plain, Huang-Huai-Hai Plain, the middle Yangtze River and Jianghuai region and Sichuan Basin. Using GIS technology, we evaluated the comprehensive agricultural drought situation based on major crops, the basic drought resistance by integrating multiple indicators and the comprehensive drought resistance against background agricultural drought. We chose spring wheat, winter wheat, early rice, late rice, single-season rice and maize as the research objects and calculated a crop composite drought index to determine that the agricultural drought degree was highest in the Huang-Huai-Hai Plain and slightly lower in the Sanjiang and Songnen Plains. The drought degree was relatively low in the middle Yangtze River and Jianghuai region and the Sichuan Basin. A remarkable difference was observed in agricultural drought resistance among the grain-producing areas. The entire Sanjiang Plain had the lowest agricultural drought resistance, and that of the Songnen Plain was slightly higher. In the Sichuan Basin, many areas had lower and intermediate values of drought resistance. In the Huang-Huai-Hai Plain and middle Yangtze River and Jianghuai region, resistance was stronger. The ranking of comprehensive drought resistance from strongest to weakest was Huang-Huai-Hai Plain > middle Yangtze River and Jianghuai region > Sichuan Basin > Songnen Plain > Sanjiang Plain. Finally, the sensitivity analysis was carried out to discuss the sensitive factors significantly affecting the agricultural drought resistance.

1. Introduction

Owing to the impacts of climate change and increasing human activities, global drought events have become larger and more frequent [1]. As a large, agricultural country, China’s agricultural production and food security are directly threatened by drought [2]. Statistics from the Bulletin of Flood and Drought Disasters in China show that, from 1950 to 2007, national agricultural drought disasters affected an average of 21.73 million ha per year, and annual food losses due to drought were up to 15.8 billion kg, accounting for more than 60% of total grain losses from all natural disasters combined. It is clear that worsening drought has become a major threat to China’s sustained, stable, high agricultural yields and an important factor constraining the sustainable, rapid and healthy development of its agriculture [3,4].
Due to the negative impacts of droughts and comprehensive understanding of the concepts, definitions of drought have caused extensive concern [5,6,7,8,9,10]. The various descriptions all directly or indirectly reveal water deficit as the essence of drought. However, there is no consensus definition of drought. The current drought is regarded as natural factors and human activities, rather than a single natural phenomena. Drought tends to be the deficiency of precipitation causing a side impact on the society, economy and environment in a period of time [11]. On this occasion, drought is generally classified into four categories, including meteorological drought, hydrological drought, agricultural drought and socio-economic drought [12]. In order to quantitatively analyze and predict drought, models applied in monitoring and forecasting have been developed [13,14,15,16,17,18,19,20,21,22], as well as land data assimilation systems for drought modeling [23,24]. Among the four types of droughts mentioned above, agricultural drought is influenced by natural factors, as well as human factors, becoming one of the most complex kinds of drought. In this paper, drought refers to a period with declining soil moisture and consequent crop failure without any reference to surface water resources [12].
Agricultural drought monitored by remote sensing monitoring and meteorological monitoring is a major field of current study. The remote sensing approach plays an important role for a wide range, long period and dynamic drought monitoring. Related studies achieved agricultural drought monitoring in a large scale through using a remote sensing inversion model based on the moisture in the soil and vegetation [25,26,27,28]. The meteorological monitoring method is performed by statistically analyzing the meteorological data from meteorological sites [29,30], in order to describe the time succession characteristics and development trends of agricultural drought according to the statistical characteristics of drought. Drought indexes, such as the Palmer drought severity (PDSI) [31,32], a standardized precipitation index (SPI) [33,34], the relative moisture index [35] and negative precipitation anomaly percentage [36], are used to analyze and monitor both the meteorological characteristics of agricultural droughts and the regularity of agricultural drought disasters. On this basis, some scholars have concluded that crops are directly threatened by agricultural drought [37,38,39]. Moreover, with the further cognition of the crop drought mechanism, crop model research has made considerable progress in aspects of quantitative evaluation of agricultural drought [40,41,42,43]. Such studies essentially examine natural background conditions. At the same time, human activities increase, ameliorating or preventing drought, making drought an event that is heavily affected by social factors. As a result, many studies have evaluated agricultural drought and drought disasters considering both natural and socioeconomic factors. Wilhelmi et al. [22] selected multiple indicators, such as climate, soil, land use and irrigation, and adopted an improved numerical weighting method to evaluate the agricultural drought vulnerability in Nebraska and to create a vulnerability distribution map. Shang et al. [44] proposed diagnosing the agricultural drought system vulnerability and established a drought vulnerability evaluation index and model based on agricultural production processes to assess drought vulnerability, using Xingtai County as an example. Shang et al. [45] explored the issue of agricultural drought system recovery. They proposed a restoration evaluation framework, establishing a comprehensive index model by selecting factors, such as land resources, crop structure, rainfall, irrigation and productivity level, in order to evaluate the drought resilience in Xingtai, Hebei Province.
In China, scholars have emphasized an important concept in agricultural drought systems: agricultural drought resistance. This resistance is the ability of humans to prevent potential hazards for crop growth caused by drought through their own activities and to reduce the impacts of agricultural droughts [46]. There is relatively little international research on the assessment of agricultural drought. Most research focuses on the natural, social and economic factors affecting agricultural drought resistance, selecting several evaluation factors to build an index system and then conducting a quantitative evaluation of the agricultural drought resistance [47,48,49]. However, we believe that research into agricultural drought resistance still has some unresolved issues: (1) Studies on crop droughts have been extensive, but the diversity of crops and complex phenology mean that the study objectives have been too targeted. Temporal and spatial scale restrictions have made it inconvenient to carry out and promote research on a large, regional scale; (2) Of the current studies on agricultural drought resistance, some have quantitatively evaluated the risk of agricultural drought disasters using various factors, such as precipitation, evaporation and soil humidity, based only on natural conditions. Some have been confined to indexes related to regional conservancy projects to analyze and evaluate the drought resistance qualitatively or quantitatively. However, in studies that consider both natural and socioeconomic factors, the natural background of agricultural drought was brought into the evaluation index system only as a general indicator, which, to a certain extent, weakened the influence of natural elements on agricultural drought resistance; (3) Most research has selected only a single agricultural or administrative region at a small or medium-sized spatial scale as the study area; large-scale research has been rare. In particular, the evaluation of the agricultural drought resistance of the main grain-producing areas and comparative studies of multiple areas have seldom been reported.
In recent years, drought disaster areas have extended from western and northern regions to eastern and southern regions, covering several of the main grain-producing regions in China. The Sanjiang Plain (I), Songnen Plain (II), Huang-Huai-Hai Plain (III), middle Yangtze River and Jianghuai region (IV) and Sichuan Basin (V) are the five main grain-producing regions in China. These areas play a major role in Chinese agriculture, including the 12 main grain-producing provinces across the country. Statistics from the Chinese Farming Information Network (http://www.zzys.moa.gov.cn) [50] show that the crop planting area of these five regions accounts for 69.07% of all cropland in the country, and they produce more than 70% of the national yield. These regions account for 72.6%, 77.37% and 69.10% of the total planting area of the main food crops of wheat, rice and maize, respectively, and they account for more than 70% of total yields. Thus, crop growth and agricultural drought conditions in the main grain-producing areas directly affect national food security. The aim of this study was to conduct a comprehensive evaluation of the agricultural drought resistance of the five main grain-producing regions by building a suitable index system in order to completely and objectively depict the spatial differences in the comprehensive agricultural drought resistance of the five main grain-producing regions and to provide scientific information to formulate drought defense and relief for these areas.

2. Materials and Methods

2.1. Data Sources

(1)
Meteorological data: The meteorological data were obtained from China’s ground climate daily record dataset from 1982 to 2011 (including the average daily pressure, daily average wind speed, daily maximum temperature, daily minimum temperature, hours of sunshine, daily average relative humidity, etc.). We selected 583 sites with integrated time series for our study.
(2)
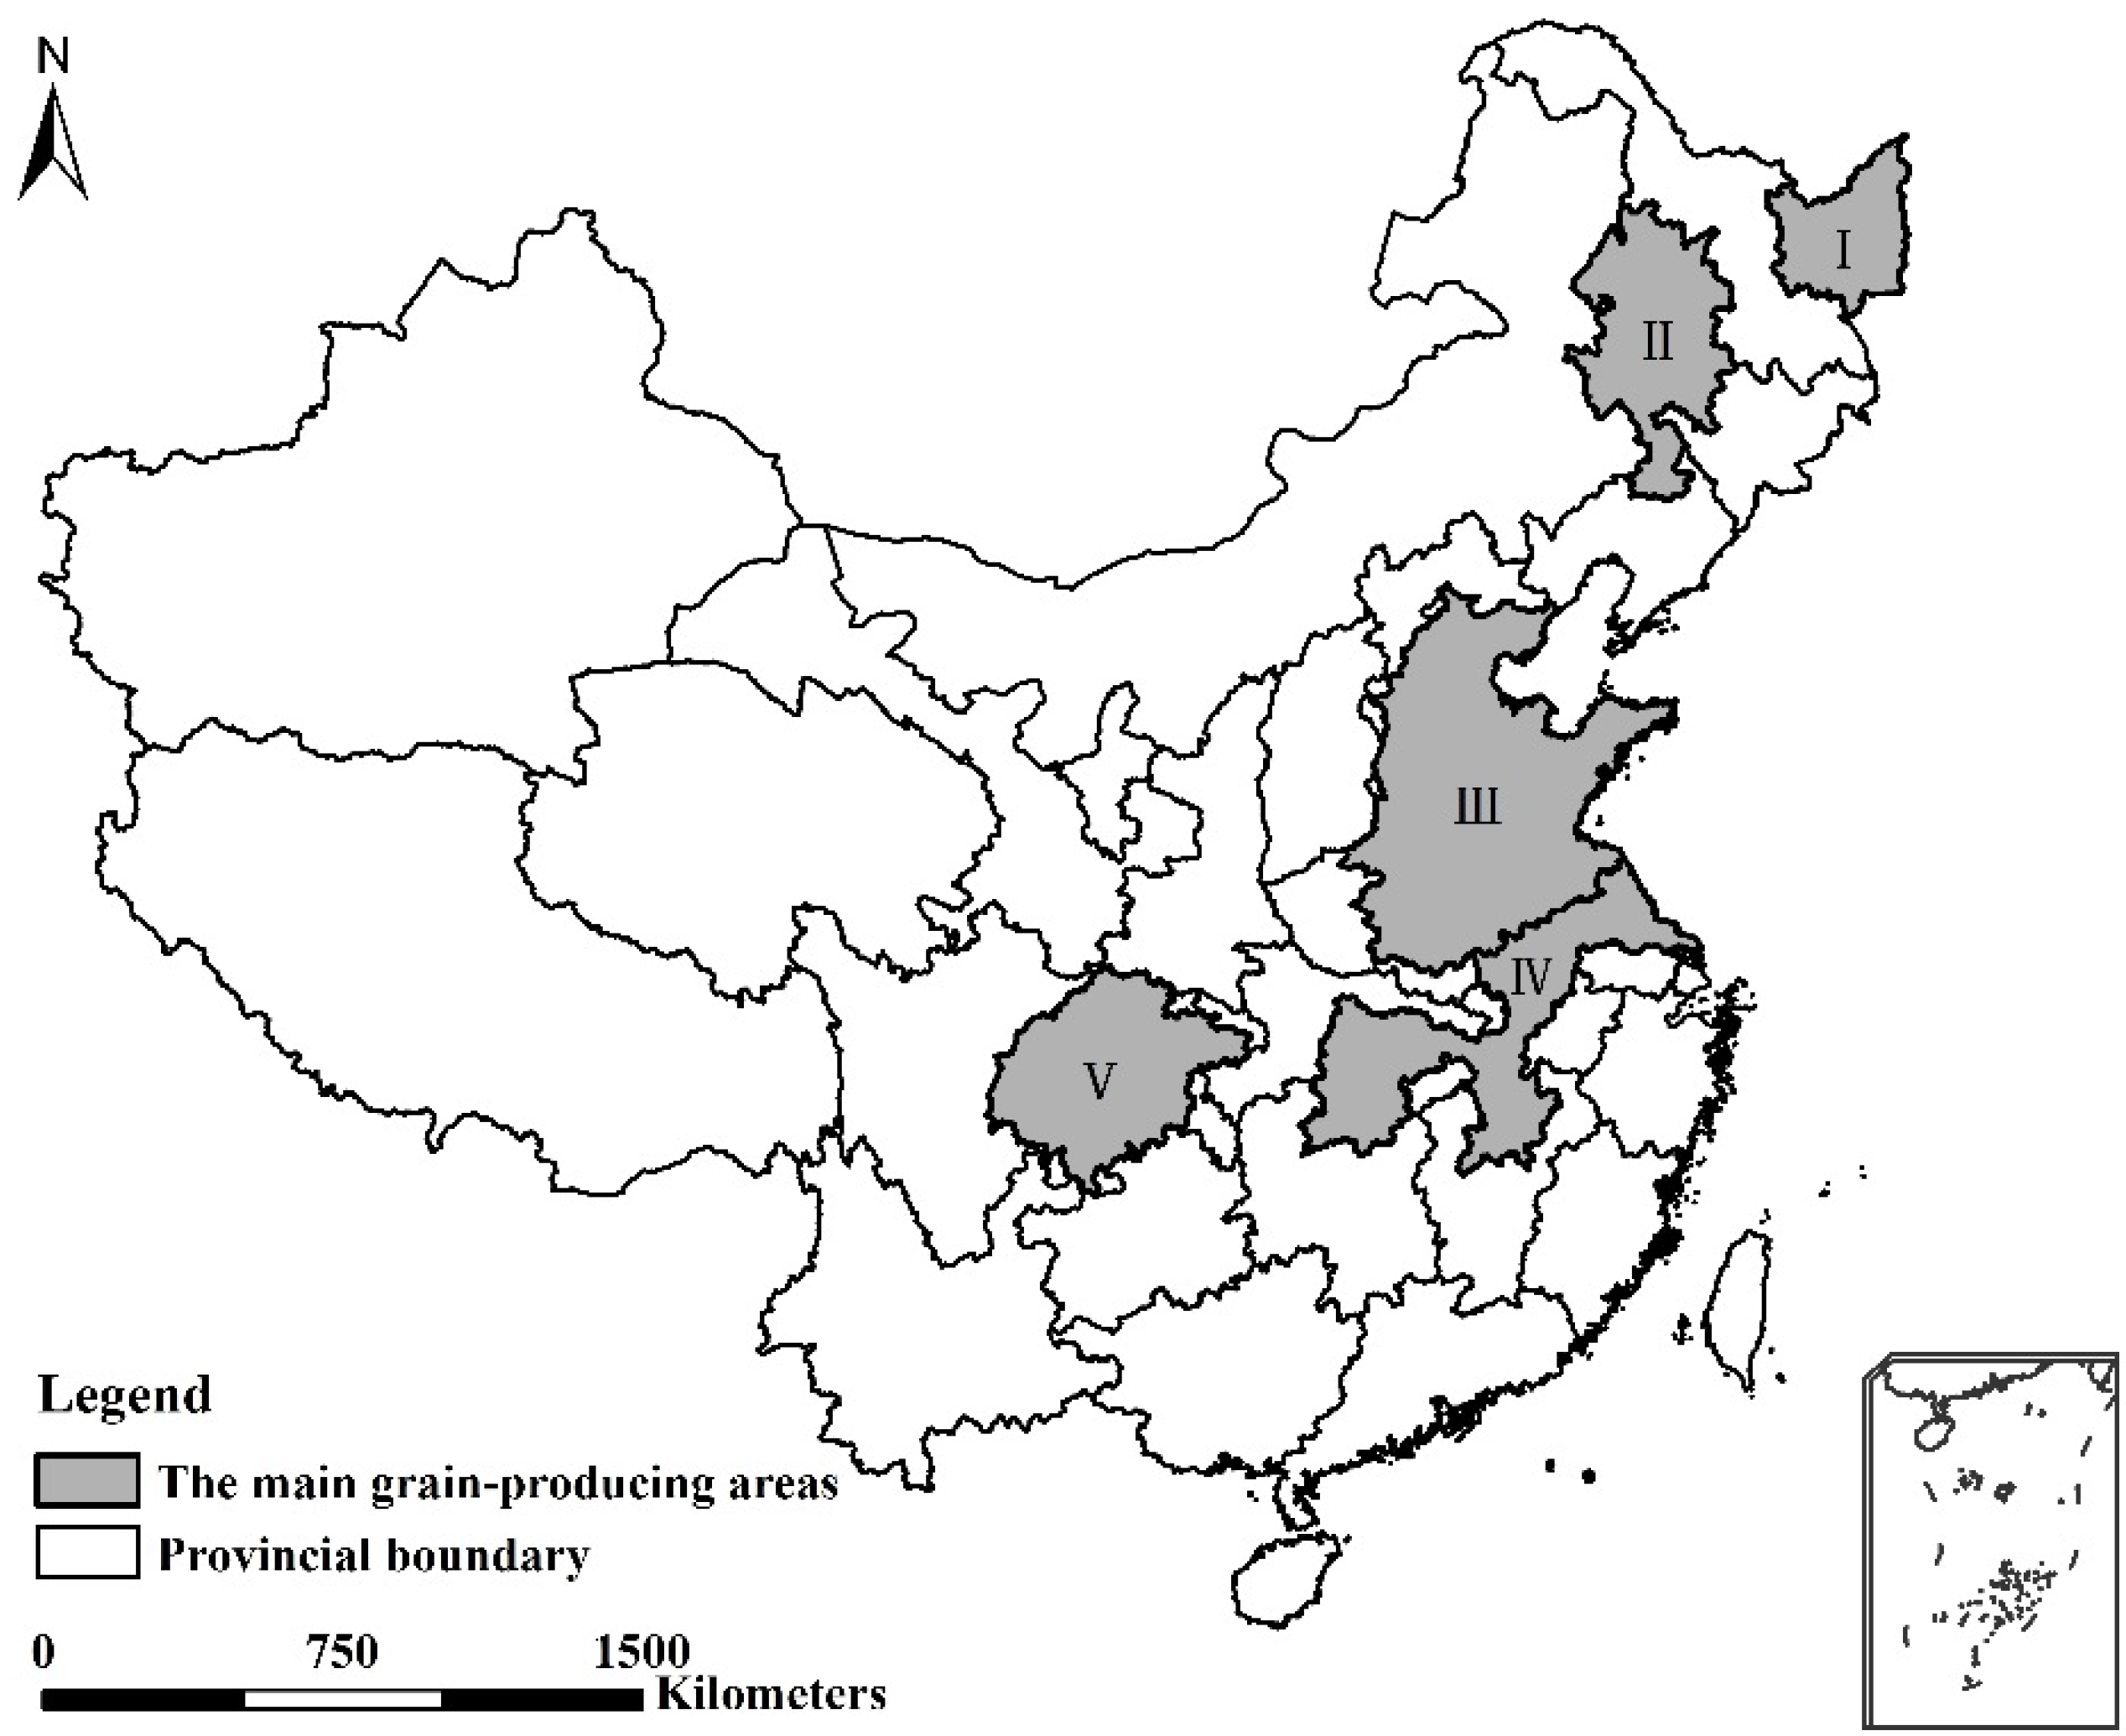
Crop distribution data: Based on Chinese vegetation distribution vector data with a scale of 1 to 1,000,000 for the year 2000 provided by the Data Sharing Infrastructure of Earth System Science, combined with relevant research results [51], we extracted the spatial distribution of spring wheat, winter wheat, maize, early rice and late rice in the five main grain-producing areas of the country.
(3)
Physical data: The content of clay particles was obtained from a Chinese soil characteristics dataset provided by the Environmental and Ecological Science Data Center in Western China of the National Natural Science Foundation of China (NSFC, Beijing, China; http://westdc.westgis.ac.cn).
(4)
Socioeconomic data: The socioeconomic data were retrieved from statistical yearbooks of various provinces and cities, the Rural Statistical Yearbook, China’s Regional Economic Statistical Yearbook published by the National Statistics Department in 2011 and national economic and social development statistical bulletins of various provinces and cities in 2010 issued by the China Statistical Information Network. Specific data included the area of cultivated land; the effective irrigation area; the planting area of rice, wheat, maize, soybean, cotton, oil crops, vegetables and other major crops; the total power of agricultural machinery; expenditures on forestry and water conservancy; and GDP per capita.

2.2. Research Methods

To fully determine the distribution characteristics and laws of agricultural drought resistance in the five main grain-producing areas (Figure 1), we first designated major crops as research objects to analyze the agricultural drought characteristics of the study areas at the crop level. Meanwhile, we explored and described the spatial differences between the study areas by building an agricultural drought resistance index. These two aspects of our study and the results, the natural background representing agricultural drought risk and the agricultural drought resistance reflecting the ability to endure drought, were overlaid to obtain the spatial distribution and characteristics of comprehensive drought resistance against the background of agricultural drought in the study areas.

2.2.1. Analysis of Agricultural Drought Degree Based on Crops

Agricultural drought typically refers to the phenomenon in which crop water consumption is greater than water absorption, which causes water deficits and crop damage due to a moisture imbalance [52]. A crop is the object directly affected by agricultural drought. We used the Penman–Monteith formula recommended by the Food and Agriculture Organization of the United Nations (FAO) [53,54] to calculate the daily reference evapotranspiration for each weather station from 1982 to 2011 based on meteorological data from the selected stations. The computation formula was as follows:
E T 0 = 0.408 Δ ( R n G ) + γ 900 T + 273 U 2 ( e s e a ) Δ + γ ( 1 + 0.34 U 2 )
In the formula, ET0 is the daily reference evapotranspiration (mm·day−1), Δ is the slope of the saturated vapor pressure-temperature curve (kPa·°C−1), Rn is the net radiation on the surface of the crops (MJ·m−2·day−1), G is the soil heat flux (MJ·m−2·day−1), γ is the dry-wet constant (kPa·°C−1), T is the average temperature (°C), U2 is the wind speed at a height of 2 m (m·s−1), es is the average saturated vapor pressure (kPa) and ea is the actual vapor pressure (kPa).
The reference evapotranspiration calculated using the Penman–Monteith formula only considered the influence of meteorological factors and assumed the evapotranspiration from the plant surface rather than using the actual evapotranspiration. Actual crop evapotranspiration can more objectively reflect the water shortage for crop growth and the agricultural drought risk. Therefore, this study further calculated the actual crop evapotranspiration based on Formula (1), using the following equation [55]:
E T c = E T 0 × K c
In the formula, ETc is the daily actual crop evapotranspiration (mm·day−1), ET0 is the daily reference evapotranspiration (mm·day−1) and Kc is the crop coefficient. The calculation of Kc is necessary to determine the water sensitivity period of crops and the corresponding crop coefficients. This study determined the water sensitivity period of major crops according to China’s Agricultural Phenology Atlas [56] and established the crop coefficients with reference to crop coefficients under standard conditions provided by the FAO [57] and existing research [58].
Based on the actual crop evapotranspiration, we computed the crop aridity index of the water sensitivity period [59] using Formula (3):
A I = E T c P
In the formula, AI is the crop aridity index, ΣETc is the annual average actual crop evapotranspiration during the water sensitivity period for nearly 30 years, from 1982 to 2011 (mm), and ΣP is the annual average precipitation of the water sensitivity period for nearly 30 years (mm).
A crop aridity index was determined with reference to related indicators from the Agricultural Drought Grade and Meteorological Drought Grade [60] and previous studies and in consideration of the sensitivity response of crops to drought throughout the growing period (Table 1).
A single crop drought cannot reflect the overall regional agricultural drought conditions. This study created a comprehensive crop drought index, which was the area-weighted average of the drought degree of all levels of various crops, to comprehensively express the regional agricultural drought situation. The index can reflect both the regional crop drought area and comprehensive agricultural drought degree under the influence of different levels of dryness. The calculation method was as follows:
I = i 6 M i × A i + B i + C i + D i + E i A a + B a + C a + D a + E a
In the equation, I is the comprehensive crop drought index; Mi is the weight of each drought degree; Ai, Bi, Ci, Di and Ei are the areas of crops A, B, C, D and E at the i-th drought degree, respectively; and Aa, Ba, Ca, Da and Ea are the sum of the areas of each crop with each drought level (total area of each type of crop in each region). This means that A a = i 6 A i (where B a , C a , D a and E a have the same calculation method as A a ), and i is the drought degree grade with an integer value of 1 to 6, representing, in order, no drought, mild drought, light drought, moderate drought, severe drought and extreme drought.

2.2.2. Assessment of Agricultural Drought Resistance

Agricultural drought resistance is influenced by natural conditions, agricultural production conditions and human activities. According to the basic principles for selecting an evaluation index [24,46] and the difficulty in data acquisition, we selected soil texture, the ratio of the areas of high and low water consumption crops, the rate of efficient irrigation, the agricultural machinery dynamic coefficient, expenditures on agroforestry and water transactions and per capita GDP to build the agricultural drought resistance evaluation index (Table 2).
This study used “municipal administration” as the unit of assessment, divided the single index into five values—lowest, lower, medium, higher and highest—to formulate a single-index evaluation and used the analytic hierarchy process (AHP) to identify the index weight. Next, we evaluated the agricultural drought resistance of the five main grain-producing areas with the weighted summation method using the following formula [61]:
A D I = i = 1 n F × w i
F i > 0 ; i = 1 n w i = 1
where ADI is the agricultural drought resistance index, n is the number of the index, F i is the quantitative value of the i-th index and wi is the weight of the i-th index.

2.2.3. Evaluation of Integrated Drought Resistance against the Background of Agricultural Drought

The agricultural drought degree can reflect the risk of drought based on meteorological conditions; the lower the agricultural drought degree, the smaller the natural drought risk and the stronger the drought resistance of the agricultural system. Our study used a comprehensive weighted evaluation method to superpose the agricultural drought degree and resistance to produce the comprehensive evaluation index of drought resistance using the following formula:
C A D I = a × I + b × A D I
In the formula, CADI is the comprehensive evaluation index of drought resistance, I is the quantitative level of agricultural drought degree, ADI is the quantitative level of agricultural drought resistance and a and b are the weights of the agricultural drought degree and agricultural drought resistance, respectively, determined by the expert scoring method. Since meteorological factors only provide the natural background for the drought, the drought-resisting factors have a significant impact on aggravating, relieving or avoiding drought. We ultimately determined the values of a and b to be 0.2 and 0.8, respectively.

2.2.4. Sensitivity Analysis for Evaluation Results

The comprehensive evaluation of agricultural drought resistance is a multiple objective decision-making issue with many uncertainties in the evaluation process. In order to clarify and quantitatively describe the degree of influence of the uncertain factors on results, we performed a sensitivity analysis for the agricultural drought resistance evaluation in terms of indicator selection, indicator weight and indicator integration, analyzed the influencing degree in the case of variations in the evaluation process and explored sensitive factors significantly affecting agricultural drought resistance.
First, this study discussed the degree of influence that the indicator selection had on the agricultural drought resistance ranking of the five main grain-producing areas in view of seven indicators. Specifically, after an equally-weighted comprehensive evaluation of all indicators, we eliminated one indicator at a time from the index system. Then, the remaining indicators were integrated with an equal weight to calculate the score of each region.
Second, this study tested the sensitivity of results to weights by means of the one-at-a-time method (OAT). We made the weights in the formula the same as the original weights and changed the weight value of only one indicator at a time, while the weights of the others remained relatively unchanged, so as to analyze the degree of influence and regularity of single indicator weight changes on the comprehensive drought resistance evaluation results [62,63].
Finally, this study used the method of multiplicative integration with weighted coefficients to evaluate the comprehensive agricultural drought resistance and compared it to the evaluation results from the linear weighted summation method (additive integration) to discuss how different index integration methods influence the evaluation results.

3. Results

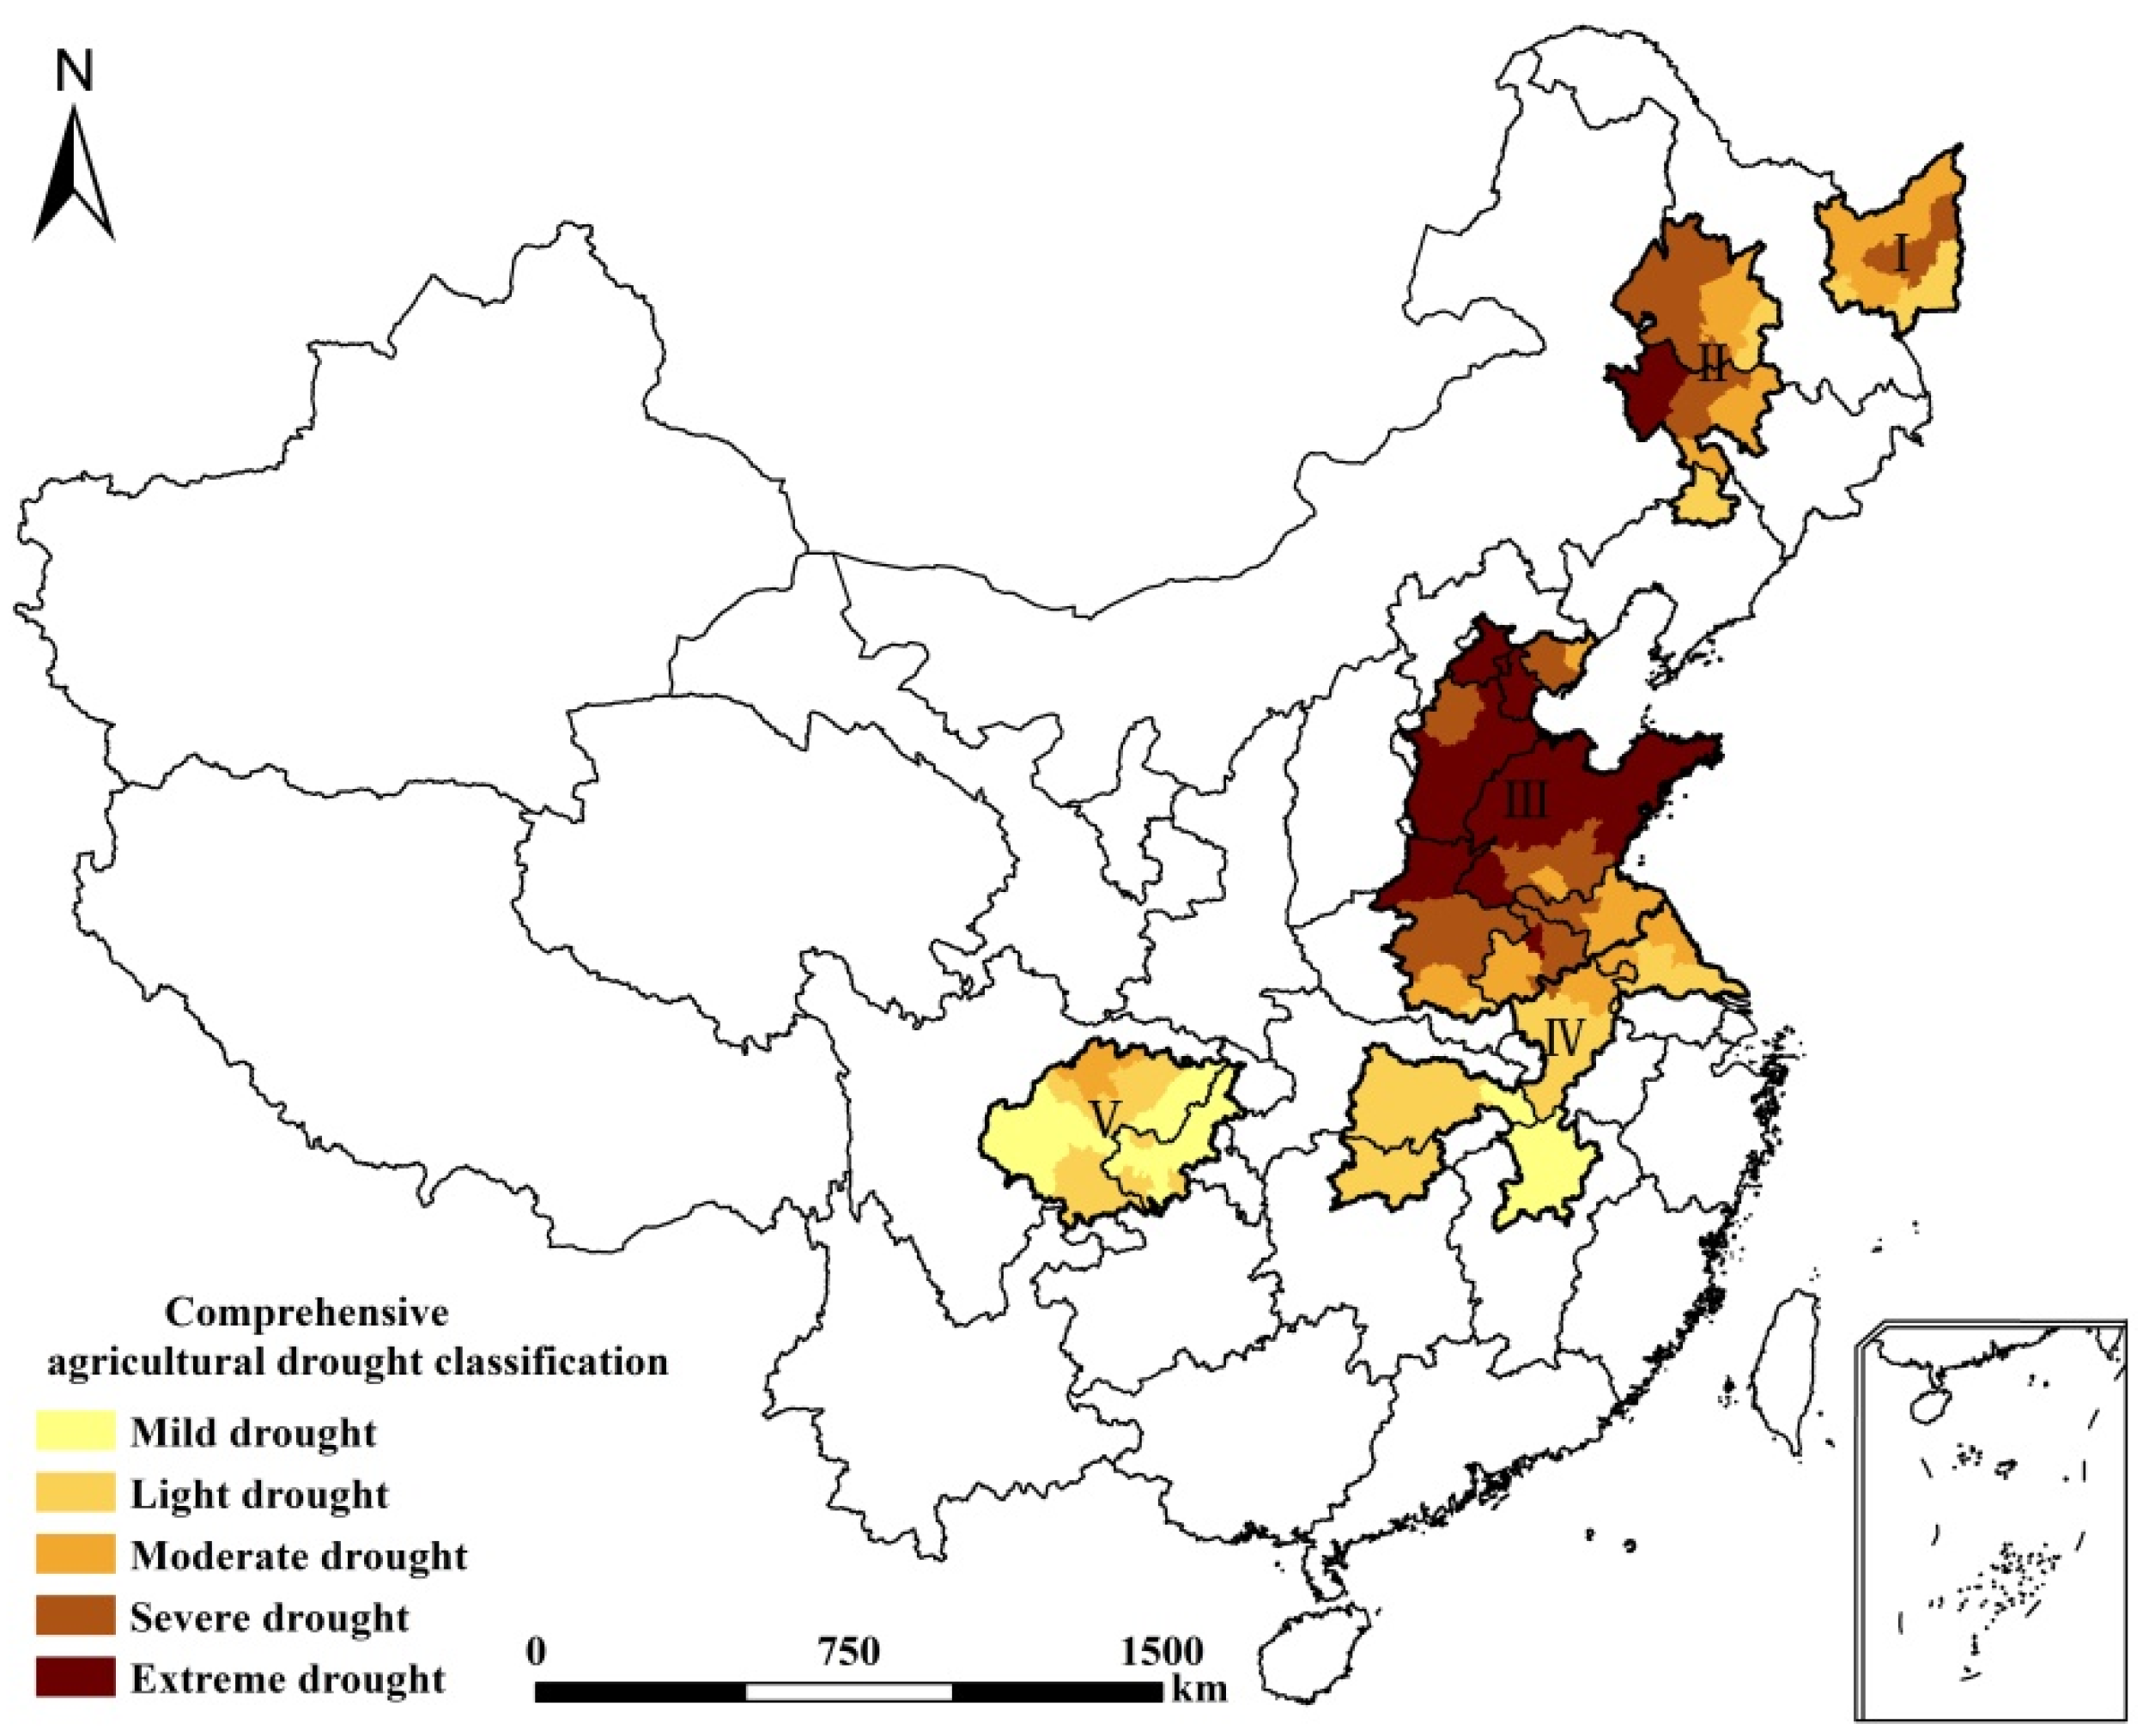
3.1. Comprehensive Analysis of Agricultural Drought Degree

The comprehensive agricultural drought situation of the five main grain-producing areas is shown in Figure 2 and Table 3. In the Sanjiang Plain, 55.33% and 24.74% of the area were defined as having moderate and light drought, respectively, and another 21.93% of the area had severe drought. In this region, the drought degree of wheat was most serious, experiencing primarily severe and extremely severe drought, and the drought degree of maize and rice was mainly moderate. Compared to the Sanjiang Plain, the drought degree of the Songnen Plain was more serious. In the Songnen Plain, more than 50% of the area experienced severe and extremely severe drought and 28.22% had moderate drought, and the drought degree of spring wheat and rice could not be overlooked. In the Huang-Huai-Hai Plain, where the drought degree was worst, more than 90% of the area had more than moderate drought, of which 29.98% was severe and 53.90% was extreme, all of which severely impacted crop growth. In addition, the drought degree of winter wheat was highest in the Huang-Huai-Hai Plain. The middle Yangtze River and Jianghuai region did not exhibit extreme drought; and more than 65% of the area had light drought, and less than 1% had severe drought. Moderate and light levels were the most common drought degree of winter wheat and late rice, and the lightest level was most common for early rice. In the Sichuan Basin, agricultural drought was the lightest of the five main grain-producing areas. It had only moderate and lighter drought, mainly mild, which comprised 55.72% of the area, and the drought degrees of all crops were mainly light or below light.

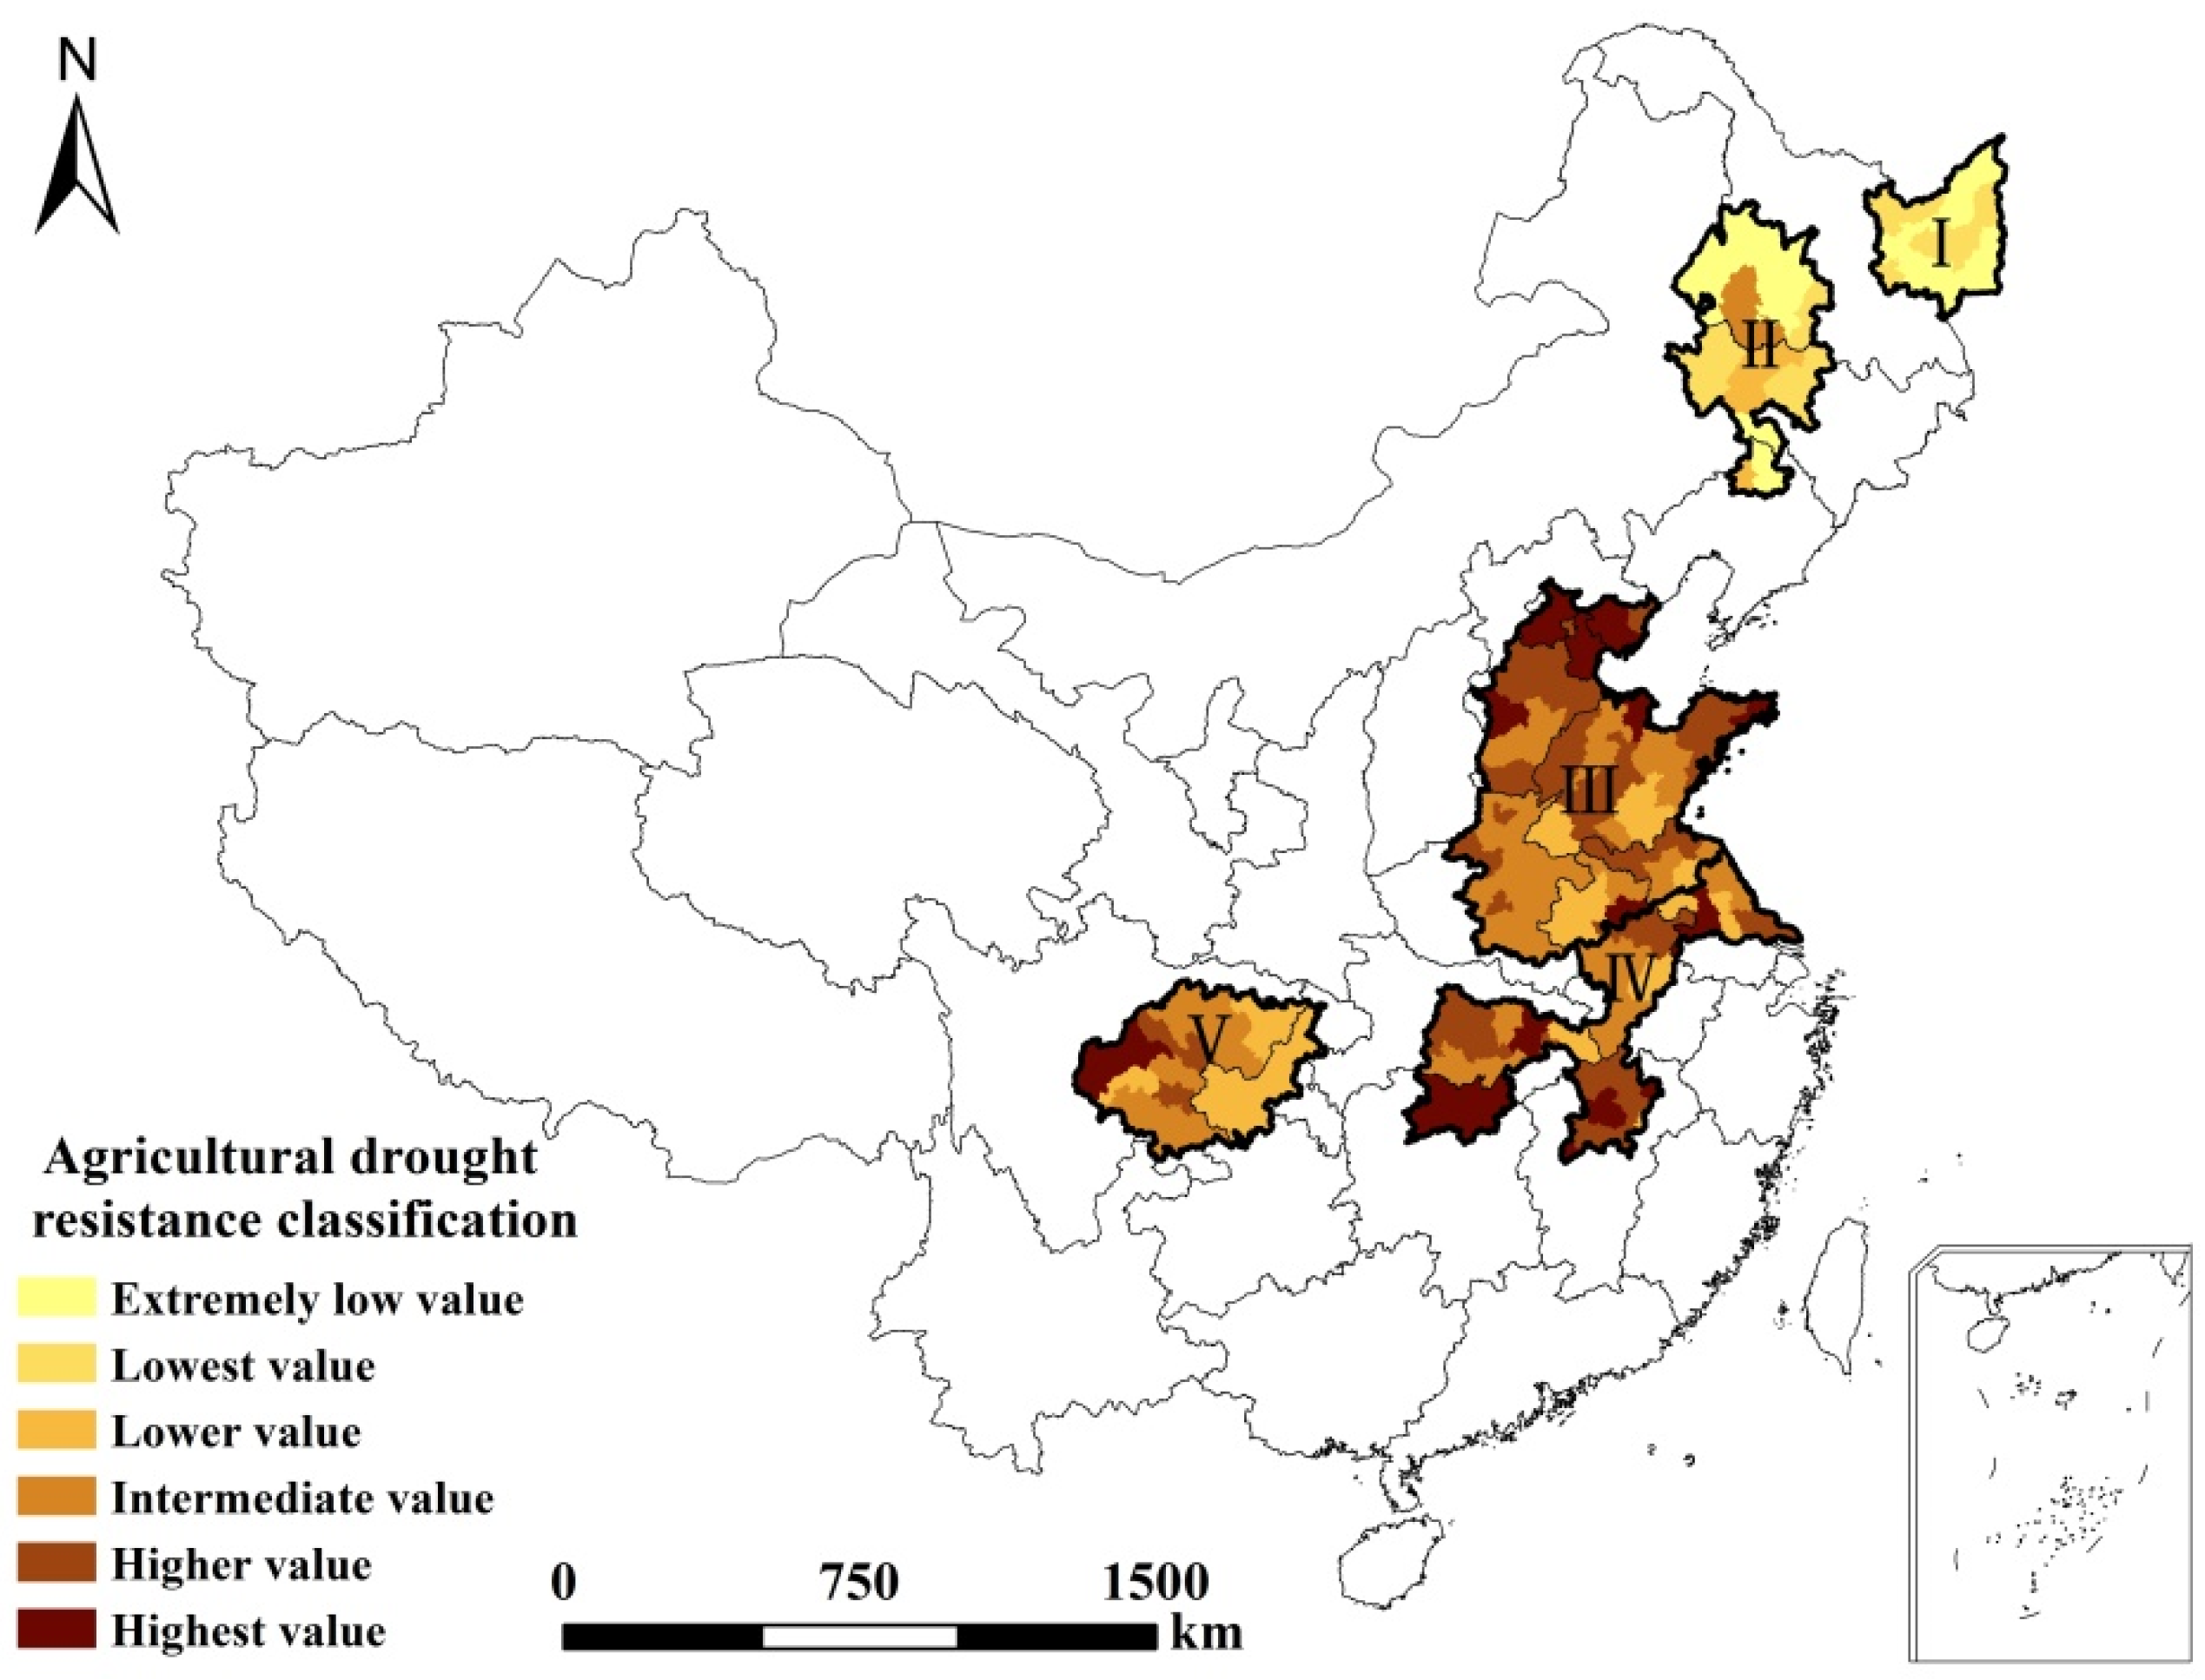
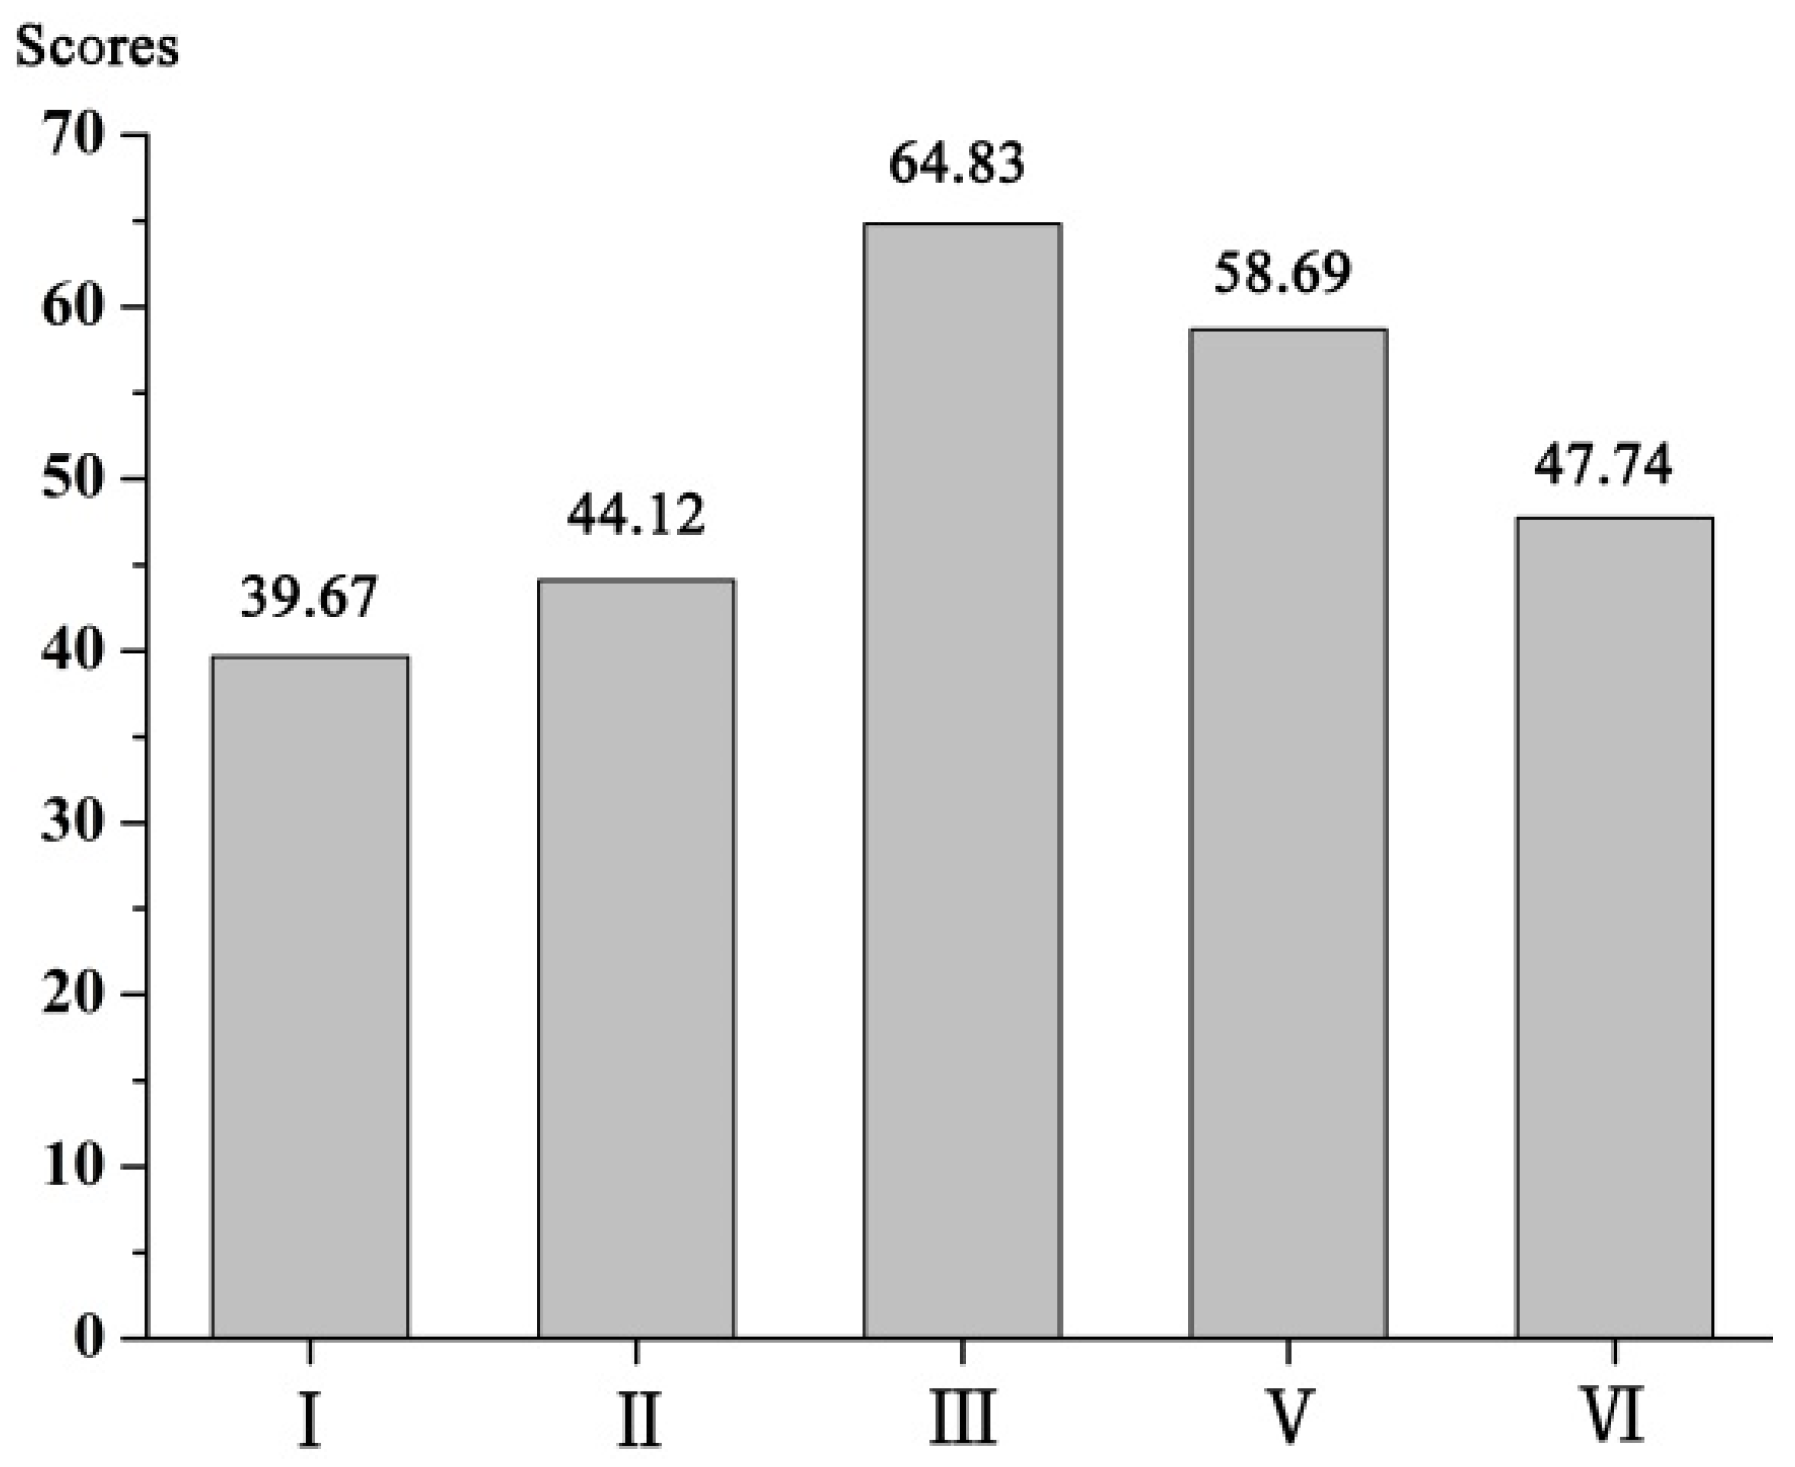
3.2. Evaluation of Agricultural Drought Resistance

According to our results, we statistically determined the hierarchical proportion of each indicator in the five main grain-producing areas to produce a map of agricultural drought resistance based on the comprehensive evaluation score of cities in the study area. The difference in agricultural drought resistance in the five areas was striking (Figure 3).
The agricultural drought resistance of the Sanjiang and Songnen Plains was clearly weaker than that of the other three areas. The entire Sanjiang Plain exhibited the lowest and extremely low drought resistance. In the Songnen Plain, the proportion of the area with resistance below average was more than 85%, forming a concentric distribution in the area. Neither region had areas with higher or the highest values. In both areas, the rate of efficient irrigation was less than 30%, the lowest rates among the five areas. The agricultural machinery dynamic coefficient and the expenditures on agroforestry and water transactions were also the lowest among the five areas. Meanwhile, the ratio of water-intensive crop area to low water-demand crop area was very high, and the pressure of agricultural water demands was the highest; thus, drought disasters were deemed most likely to occur in these two areas.
In the Sichuan Basin, the agricultural drought resistance was also weak. The proportions of areas with lower and intermediate resistance were 38.52% and 39.61%, respectively, dispersed mainly in the east and center of the basin. The areas with the higher and highest values were mainly concentrated in the middle and northwest of the basin, with proportions of 9.02% and 12.55%. The soil drought resistance of the Sichuan Basin was the strongest of the five areas, and there was less pressure from crop water demands. However, the rate of efficient irrigation and the agricultural machinery dynamic coefficient were lower than in other areas. The expenditures on agroforestry and water transactions totaled less than 10,000 yuan per ha, and the per capita GDP was the lowest among the five areas.
In the Huang-Huai-Hai Plain and the middle Yangtze River and Jianghuai region, the proportion of areas with higher and the highest agricultural drought resistance was more than 50%. In the Huang-Huai-Hai Plain, the areas with the highest agricultural drought resistance were mainly situated in the north, and there was a weakening trend from north to south. The middle Yangtze River and Jianghuai region had the strongest agricultural drought resistance among the five areas, due to the proportion of areas with the highest agricultural drought resistance reaching 25.76%. For the above two areas, the rate of efficient irrigation is generally high, and the agricultural machinery dynamic coefficient and level of GDP per capita are higher than in the other areas. In addition, the middle Yangtze River and Jianghuai region has a lower crop water demand and a higher expenditure on agroforestry and water transactions. In the Huang-Huai-Hai Plain, the soil drought resistance is weaker, and the pressure from agricultural water demands is higher, which adversely affects the overall agricultural drought resistance.

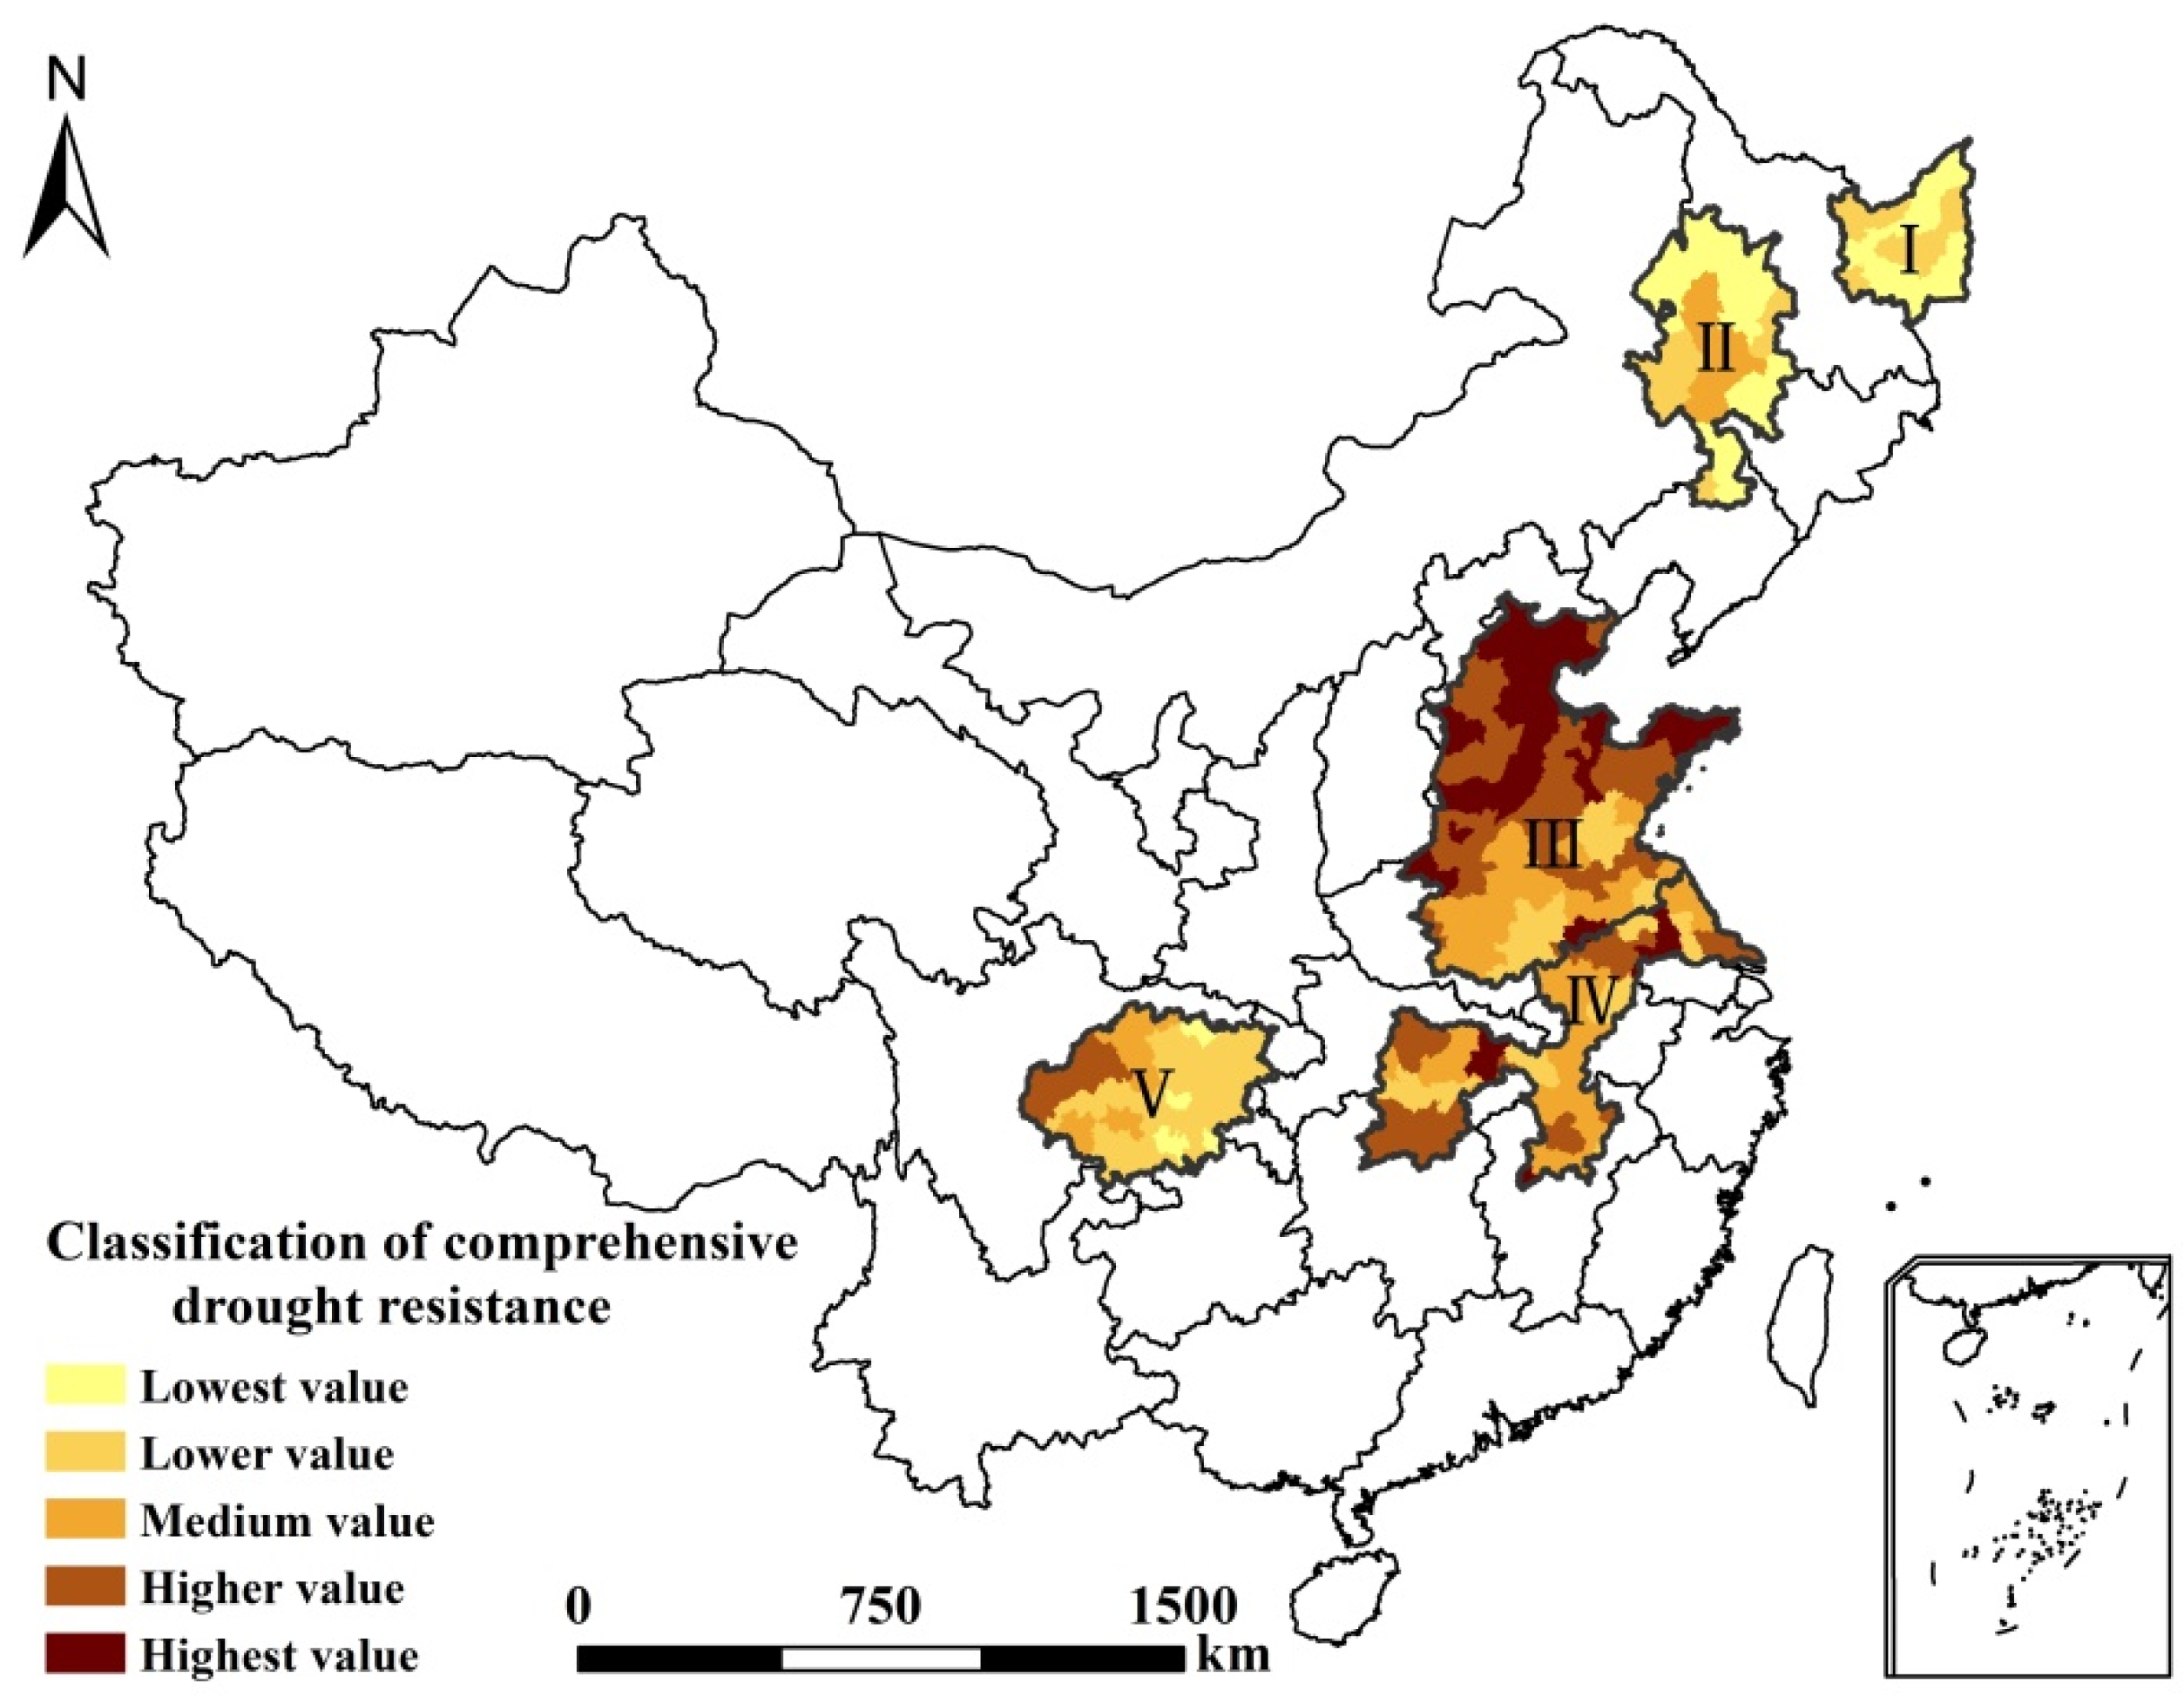
3.3. Analysis of Comprehensive Drought Resistance Based on Background Agricultural Drought Levels

We calculated the evaluation score of comprehensive drought resistance against the background agricultural drought in each city according to Formula (7), classified the score into five values—lowest, lower, medium, higher and highest—by means of natural breaks and produced a map of comprehensive drought resistance (CADI) (Figure 4). Next, we overlaid the space of the five main grain-producing areas with the scope of municipal administration and used the area-weighted method to calculate the score of comprehensive drought resistance in the main grain-producing areas as a basic statistical unit (Figure 5). The higher the score, the stronger the comprehensive drought resistance was determined to be.
According to the comprehensive evaluation results (Figure 5, Table 4), the drought resistance against background agricultural drought was, from strongest to weakest: Huang-Huai-Hai Plain > middle Yangtze River and Jianghuai region > Sichuan Basin > Songnen Plain > Sanjiang Plain. Areas with the lowest and lower values of comprehensive drought resistance were mainly concentrated in the Songnen and Sanjiang Plains. More than 58% of the area in Sanjiang Plain had the lowest value, and 41.08% had the lower value, mainly distributed in the middle of the plain. In the Songnen Plain, the proportions of areas with the lowest and lower comprehensive drought resistance were 56.04% and 21.51%, respectively, concentrated in the north and south of the plain. Only the center had 22.45% with middle values. In these areas, precipitation was scarce, the agricultural drought degree was high and the agricultural drought resistance was weak. Both the drought background and insufficient agricultural infrastructure significantly weakened agricultural drought resistance, which resulted in the Sanjiang and Songnen Plains having the weakest comprehensive drought resistance among the five regions. In the Sichuan Basin, the comprehensive drought resistance weakened from west to east. Nearly 70% of the basin had the lowest and lower values of comprehensive drought resistance, mainly distributed in the east, and 21.58% and 9.78% had middle or higher values, distributed in some parts of the west. In the Sichuan Basin, the agricultural drought degree was the lightest of the five regions, decreasing the risk of agricultural drought to a certain extent, but the underdeveloped social economy, the shortage of agricultural machinery and the low GDP per capita all adversely affect the agricultural drought resistance. In the middle Yangtze River and Jianghuai region, most areas exhibited medium comprehensive drought resistance. More than 40% of this region had higher or the highest comprehensive drought resistance levels, and only 18.64% of areas, distributed sporadically, had a lower value. Abundant precipitation, which provides this region with a lighter degree of agricultural drought, and stronger socioeconomic drought resistance resulted in a higher level of comprehensive drought resistance in the middle Yangtze River and Jianghuai region. The Huang-Huai-Hai Plain had the highest comprehensive drought resistance of the five regions, with more than 60% of the plain exhibiting higher and highest values, mainly in the north. There were no areas with the lowest value. In this region, the degree of agricultural drought was most severe, but the high socioeconomic level, agricultural modernization and rate of efficient irrigation all effectively improved the comprehensive drought resistance of the Huang-Huai-Hai Plain.

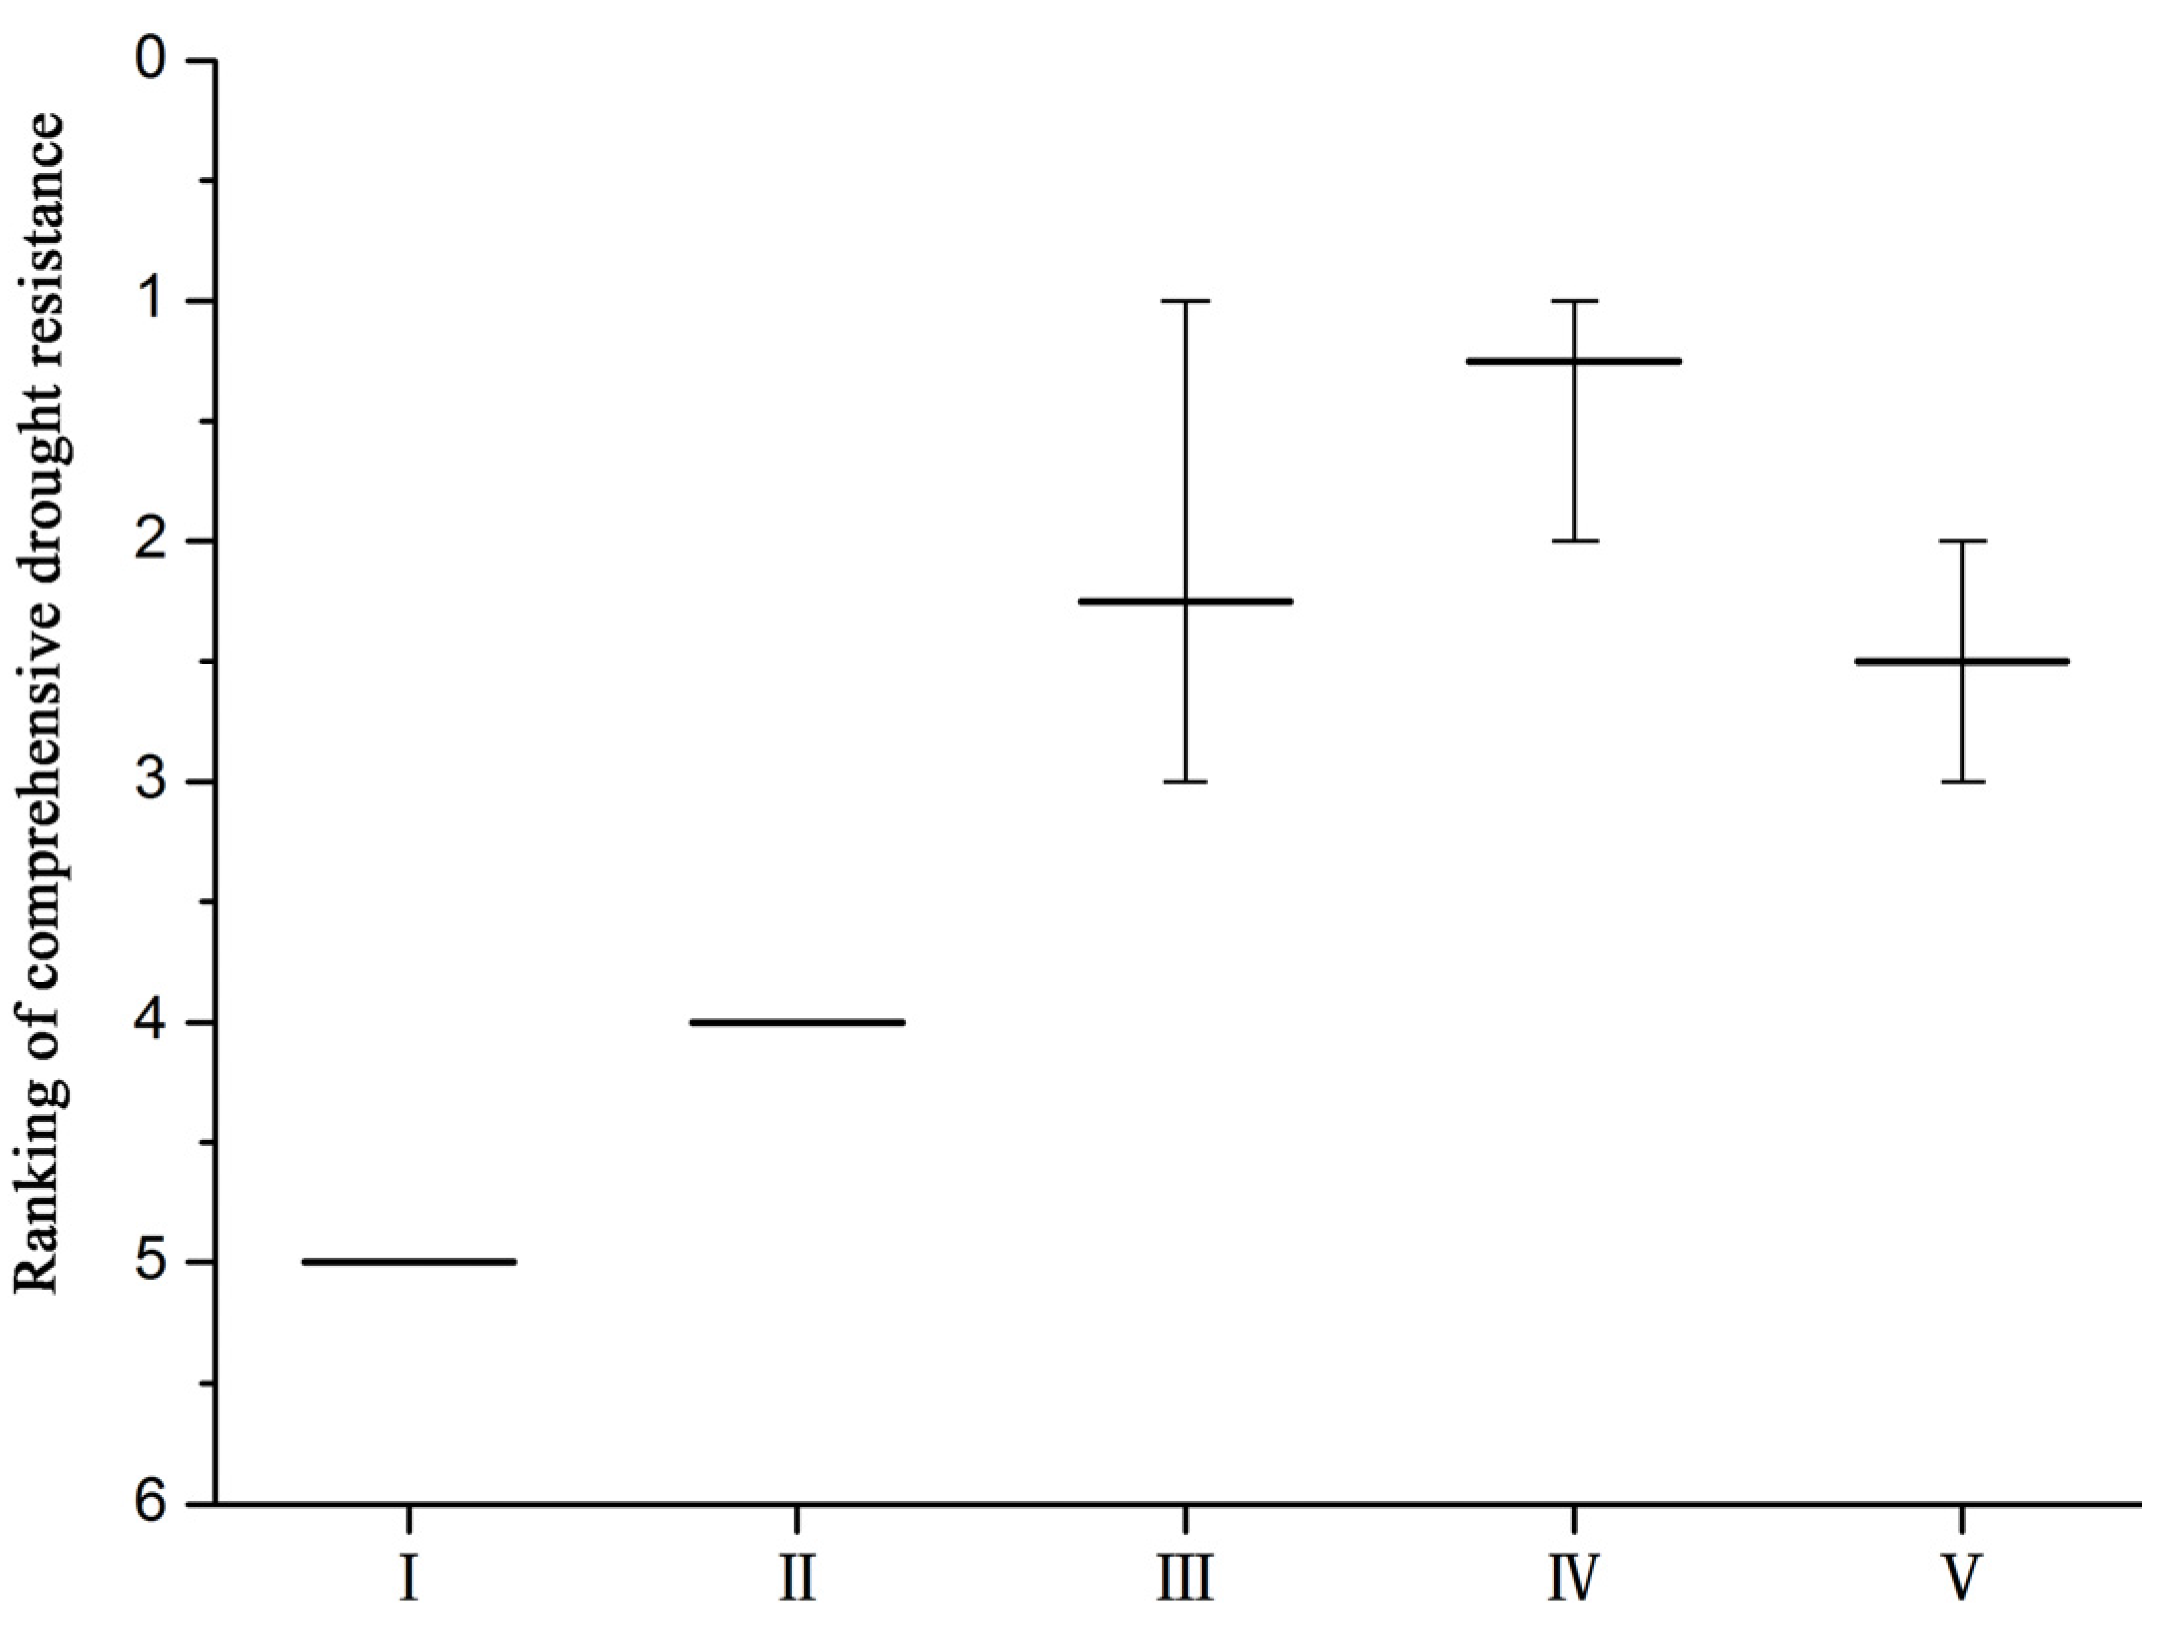
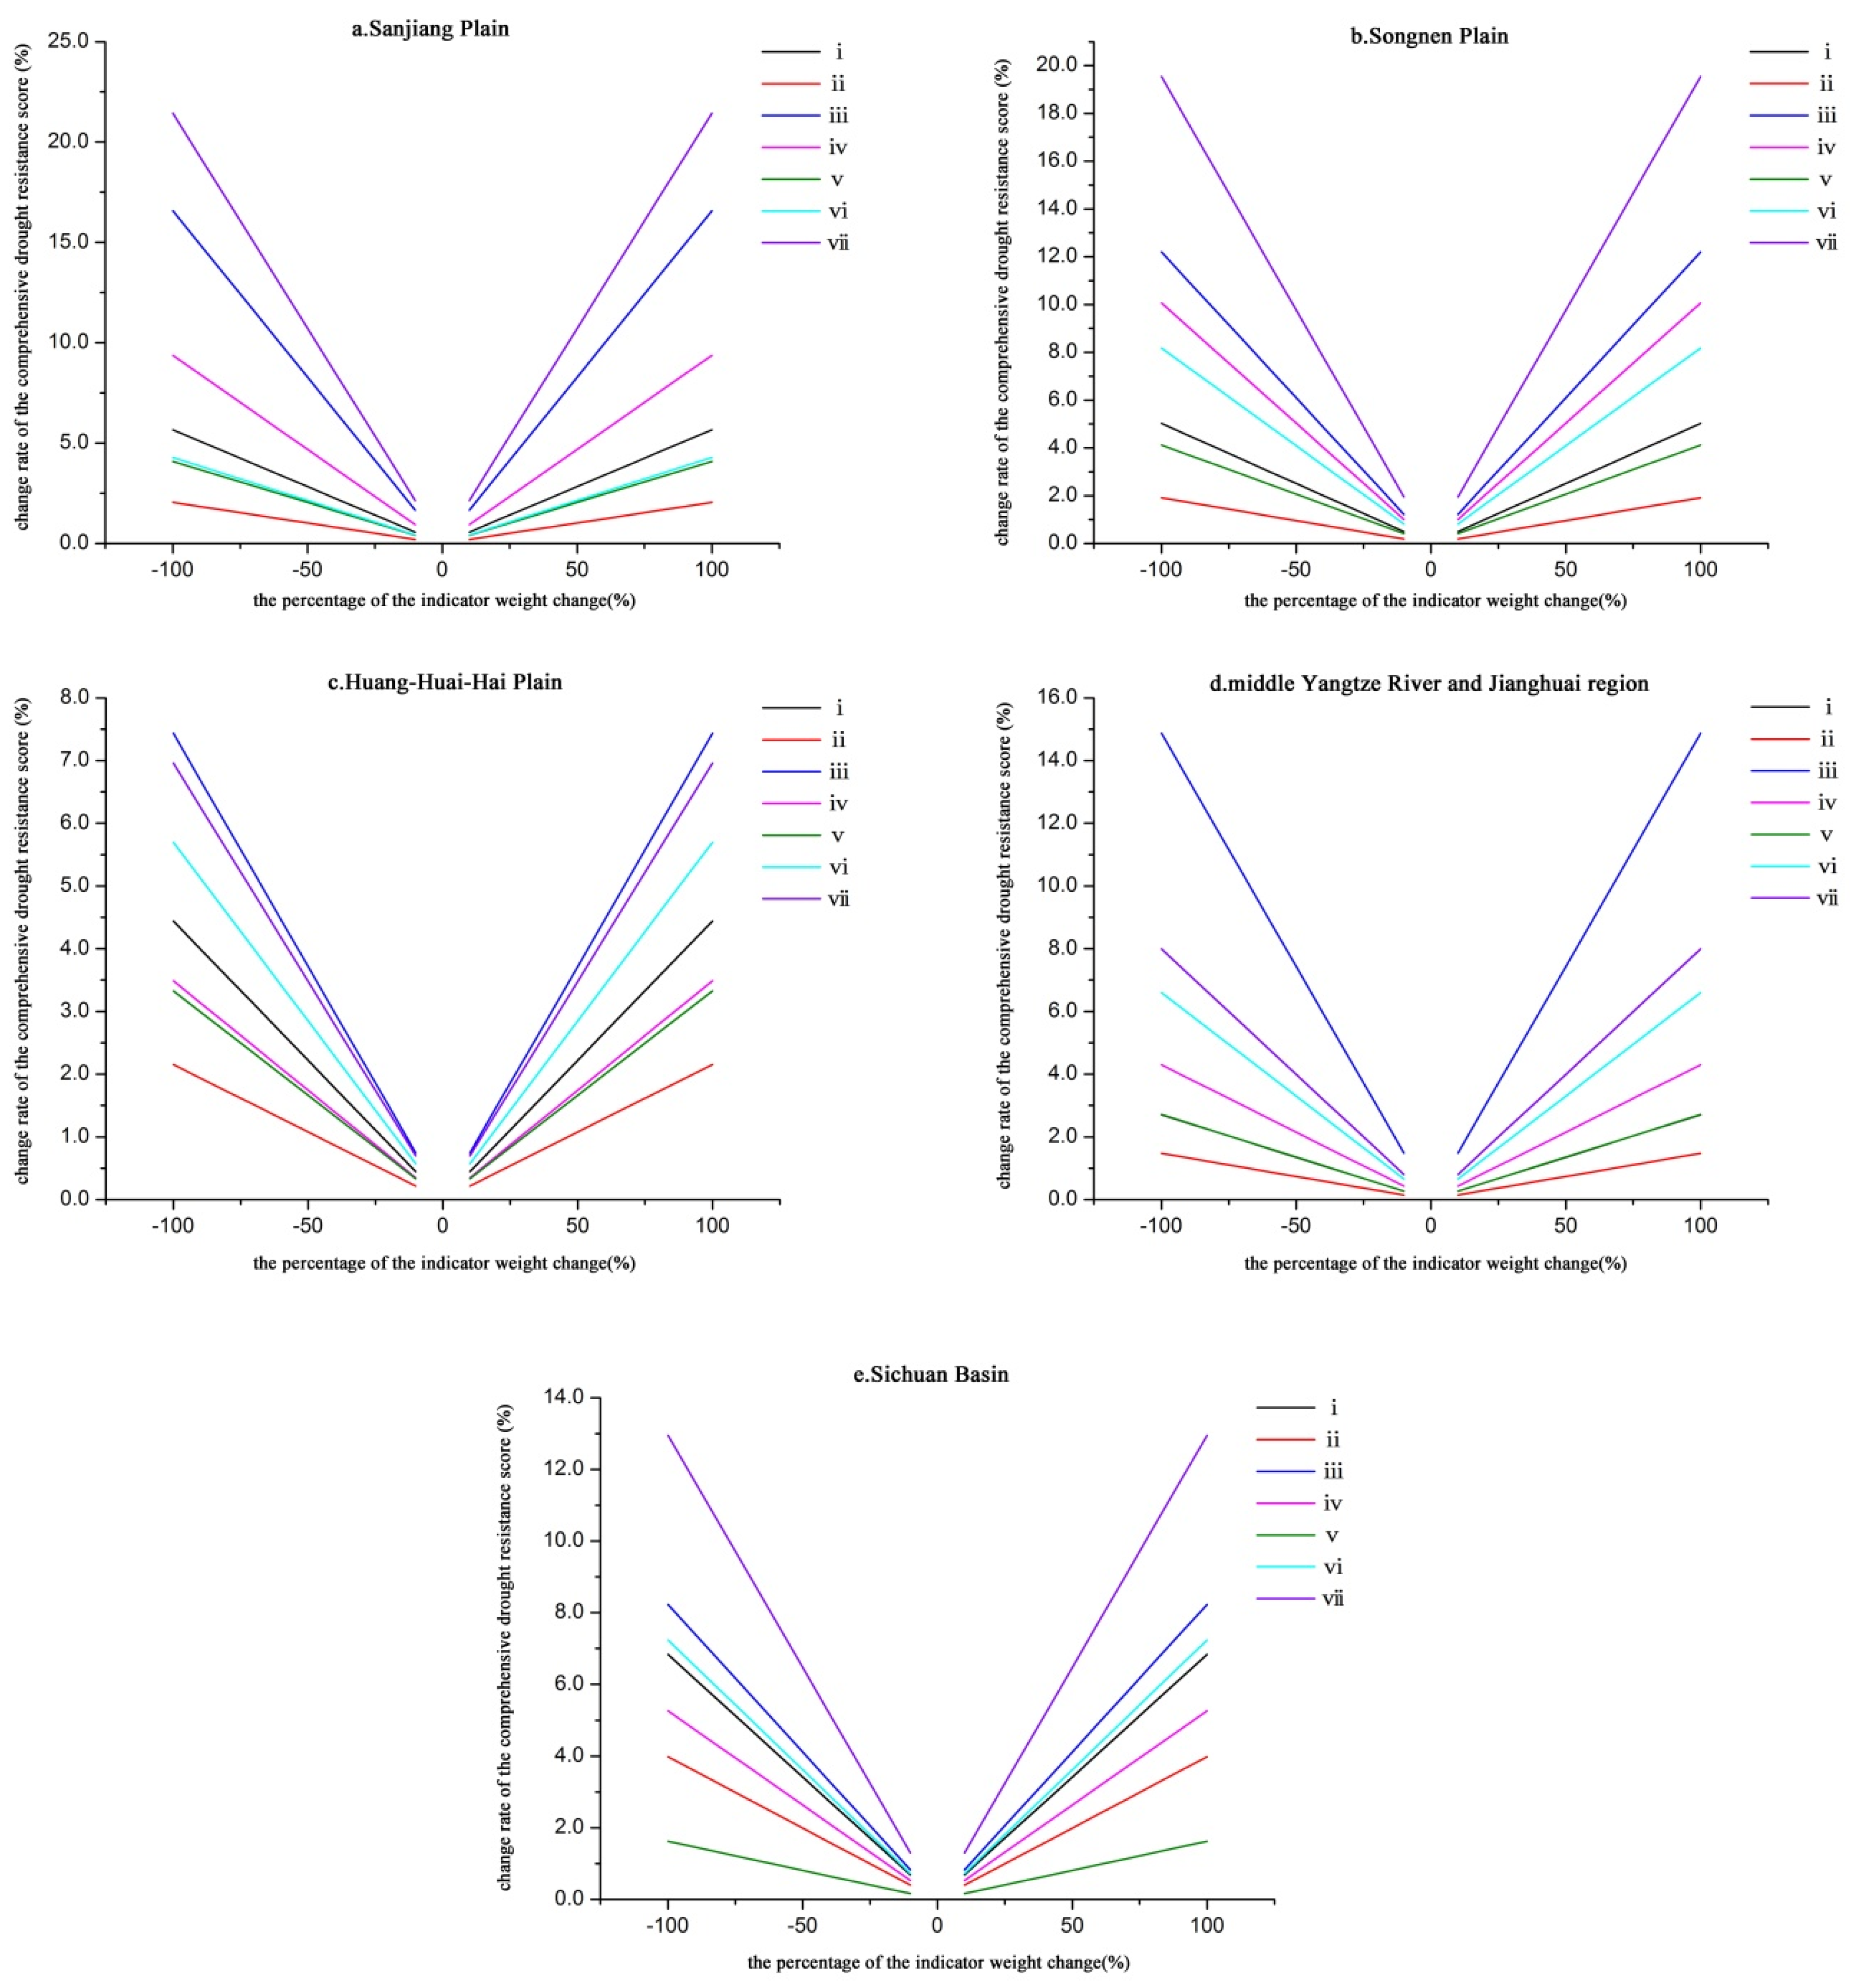
3.4. Sensitivity Analysis for Integrated Drought Resistance

The results of the sensitivity analysis from the perspective of indicator selection showed that the stronger the comprehensive drought resistance of an area, the more sensitive the results would be to indicator selection (Figure 6, Table 5). The comprehensive drought resistance ranking of the Huang-Huai-Hai Plain changed most significantly in the ranking from No. 1 to No. 3. The regions with the second most obvious ranking change were the middle Yangtze River and Jianghuai region and the Sichuan Basin, with the ranking shifting from No. 1 to No. 2 and from No. 2 to No. 3, respectively. The rankings of the Sanjiang and Songnen Plains did not change with indicator selection. In addition, as shown in Table 3, when excluding the Huang-Huai-Hai Plain, any one indicator among the rate of efficient irrigation, agricultural machinery dynamic coefficient and per capita GDP, the agricultural drought resistance of the region would change, indicating that the results are sensitive to these three indicators. The agricultural drought resistance of the middle Yangtze River and Jianghuai region had a certain degree of sensitivity to all indicators, except for the expenditure on agroforestry and water transactions. Each time an indicator was removed, the ranking would increase or decrease one place compared to the all-indicators’ evaluation results. For the Sichuan Basin, the result was more sensitive to the agricultural drought degree, rate of efficient irrigation, agricultural machinery dynamic coefficient and per capita GDP.
The comprehensive drought resistance will change with the change of indicator weight. Based on the OAT method, the figures for sensitivity analysis results in terms of indicator weight change were generated (Figure 7). The results show that the sensitivity of agricultural drought resistance evaluation results to indicator weights in the Sanjiang Plain was in the order of: agricultural drought degree > rate of efficient irrigation > agricultural machinery dynamic coefficient > soil texture > per capita GDP > expenditures on agroforestry and water transactions > ratio of areas of high and low water consumption crops. The results for the Songnen Plain were similar, only differing in the order of soil texture and per capita GDP. This shows that the agricultural drought degree, rate of efficient irrigation and agricultural machinery dynamic coefficient were the more sensitive indicators in these two areas, which have a greater influence on agricultural drought resistance. The influence of other indicators on the resistance declined with decreasing sensitivity. That is, changing the weight value of agricultural drought resistance, the rate of efficient irrigation and the agricultural machinery dynamic coefficient significantly influenced the comprehensive drought resistance evaluation results of these two areas. Thus, it is necessary to give due consideration to the weight settings of these sensitive indicators. In the Huang-Huai-Hai Plain, the most sensitive indicator was the rate of efficient irrigation, followed by the agricultural drought degree, per capita GDP, soil texture, agricultural machinery dynamic coefficient, expenditures on agroforestry and water transactions and the ratio of areas of high and low water consumption crops. For the middle Yangtze River and Jianghuai region, the sensitivity sequences of all indicators were in accordance with the Huang-Huai-Hai Plain, which shows that the weight changes for the rate of efficient irrigation, agricultural drought degree and per capita GDP significantly influenced agricultural drought resistance evaluation results, while the ratio of areas of high and low water consumption crops had the smallest influence. For the Sichuan Basin, the agricultural drought degree was the most sensitive indicator, followed by the rate of efficient irrigation, per capita GDP, soil texture, agricultural machinery dynamic coefficient, ratio of areas of high and low water consumption crops and expenditures on agroforestry and water transactions.
Finally, in terms of indicator integration, this study used the method of multiplicative integration with weighted coefficients to evaluate the comprehensive agricultural drought resistance (Table 6) and compared it to the evaluation results from the linear weighted summation method (additive integration) to discuss how different index integration methods influence the evaluation results. Through comparisons and analyses, the two-index integration methods did not change the overall drought resistance rankings of the five main grain-producing areas. However, the evaluation scores gained from the multiplicative integration method were obviously lower than those from the additive integration method. At the regional level, the more a region exhibited a weaker or stronger comprehensive drought resistance, the more significantly the results changed with different integration methods; this trend suggests a higher sensitivity to the indicator integration method. With further analysis, taking the Huang-Huai-Hai Plain as an example, two important indicators, the rate of efficient irrigation and the agricultural machinery dynamic coefficient, were significantly higher than in other areas. Based on the characteristics of multiplicative integration, the two indicators raised the comprehensive score level of drought resistance, so that the drought resistance tended to concentrate on the higher and highest values. Thus, it is evident that the multiplicative integration more sensitively reflects the differences in the levels of indicators and has higher sensitivity when distinguishing between the evaluated objects.

4. Discussion

4.1. Discussion on the Agricultural Drought Degree

The comprehensive agricultural drought situation of the Sanjiang and Songnen Plains was serious, and that of the Songnen Plain was the worst. The drought degrees of spring wheat, maize and rice deserve attention, as these two regions are important commodity grain production bases of China. The precipitation of the growing season in Northeast China, where the two plains are located, has a decreasing trend [64], but the potential evapotranspiration has increased significantly [65]. Both measurements determine the potential for natural conditions to create an agricultural drought. According to Yan [66], agricultural loss caused by drought disasters, especially maize yield loss, was most severe. Wang et al. [67] indicated that the northeast spring wheat zone was an area with a higher potential for a drought catastrophe for spring wheat. The Huang-Huai-Hai Plain was the region with the most serious agricultural drought situation, and the winter wheat drought in particular was most severe. Maize and single-season rice had generally light to moderate drought degrees. Due to the climate and natural conditions, the Huang-Huai-Hai Plain had the most frequent and strongest droughts [68]. Since the 1960s, the region has experienced decreasing precipitation and increasing temperatures, which have influenced local agricultural production [69]. The meteorological drought frequency, scope and intensity of winter wheat have increased in the Huang-Huai-Hai Plain [38,67]. Meanwhile, as the major summer maize producing area, the Huang-Huai-Hai Plain’s spatial-temporal variation in precipitation is large. The growth period of summer maize is short; the weather during its growing season is changeable; while maize requires more water during this period. Thus, a short-term drought would threaten the high, stable yield of summer maize [39,70]. In the Yangtze River and Jianghuai Plain region, the comprehensive agricultural drought situation was mainly light. The planting areas of winter wheat, early rice, late rice and single-season rice showed different degrees of drought. The winter wheat drought was the most severe, followed by late rice, and the early rice and single-season rice drought was relatively minor. Some studies have shown that the Yangtze River’s middle and lower reaches had frequent spring-to-summer continuous periods of drought [71], which had a significant effect on winter wheat growth. Moreover, in this region, a wide range of regional drought occurred mainly in summertime [72] during the late rice growing season, leading to late rice susceptibility to drought. The comprehensive agricultural drought situation of the Sichuan Basin was the lightest of the five areas based on the average case analysis of natural factors over the period of 1982 to 2011. However, in 2006, the Sichuan Basin suffered serious spring and summer droughts, causing widespread crop failures, a sharp reduction in grain yields and other negative effects [73]. The meteorological conditions, geographical environment and unreasonable human activities caused the drought disaster in the Sichuan Basin.

4.2. The Characteristics and Management Strategy of Agricultural Drought Resistance in Different Regions

The basic characteristics and restricting factors of various regions differ, so drought control and mitigation measures are not identical to all areas. Using the results of this study, we propose the following strategies to improve and strengthen drought resistance in view of problems existing in different regions: (1) The Sanjiang and Songnen Plains are areas with high degrees of agricultural drought and weak drought resistance. Therefore, the comprehensive drought resistance of both areas is weakest. In Northeast China, it has proven difficult to develop farmland water conservancy projects, and waterworks were developed later than in other parts of the country; thus, construction of water conservancy projects has remained relatively limited. Although the farmland irrigation level in Northeast China has increased significantly in recent years, the rate of efficient irrigation is still much lower than the national average, which makes the drought disaster prevention capability of the region very weak. When it suffers a drought, Northeast China’s hazard rate would become the most severe of all regions. Moreover, with adjustments to the planting structure, the planting area proportion of spring wheat, sorghum and grain, which do not require much irrigation, has significantly decreased. However, the proportion of rice, which requires a large amount of water and irrigation development, has increased sharply. This has intensified the urgency of strengthening farmland water conservancy construction in Northeast China; (2) The Sichuan Basin is an area with a low agricultural drought degree, but weak drought resistance. The agricultural drought degree of the basin was the lowest of the five regions. However, the underdeveloped socioeconomic conditions, the shortage of agricultural machinery and the low GDP per capita affect the regional agricultural drought resistance. The main limiting factors result from the underdeveloped socioeconomic conditions. Thus, it is necessary to increase agricultural investment, emphasize farmland water conservancy construction, improve the rate of efficient irrigation and the level of agricultural modernization, protect the environment and conserve water and soil to improve the comprehensive agricultural drought resistance; (3) The middle Yangtze River and Jianghuai region is an area with a low agricultural drought degree and a strong drought resistance. In this region, precipitation is abundant, the agricultural drought degree is generally light, the soil texture conditions are relatively good and the socioeconomic and agricultural modernization levels are high. Thus, the comprehensive drought resistance is stronger. However, agricultural construction should be further improved, and soil improvement should be emphasized to maintain and continue to improve the agricultural drought resistance; (4) The Huang-Huai-Hai Plain is an area with a high agricultural drought degree, but a strong drought resistance. In particular, the rate of efficient irrigation is higher to support the regional agricultural drought resistance. However, in Northeast China, where there are water resource shortages, an assurance of efficient irrigation is made at the expense of groundwater exploitation. Groundwater irrigation is key in ensuring stable agricultural production and increasing yields in the North China Plain [74]. Yet, the groundwater table has dropped dramatically, and massive cones of depression and ground subsidence have appeared. It would be beneficial to control groundwater exploitation and to develop water-saving irrigation technology to guarantee agricultural drought resistance [75].

4.3. Method of Comprehensive Drought Resistance

An agricultural drought is different from a general meteorological drought. It is largely influenced by the farmland water balance, including the water supply and water consumption. The direct hazard-affected body of agricultural drought is the crop. The drought degree of the crop is not only related to the meteorological drought degree, but also to the types and growth stage of crops. There are different sensitivities to drought in different growth stages [76]. Our study calculated the crop drought integrated index based on the analysis of the crop drought degree. The index was developed using the comprehensive area-weighted method, which took the area of the crop drought degree into account and could reflect the degrees of influence of different drought levels. Thus, we analyzed the agricultural drought situation of the five main grain-producing areas using the relative coverage of areas with different rankings and clarified the spatial distribution characteristics of agricultural drought severity. This method considered a number of factors, such as precipitation, evapotranspiration and the crop water sensitivity period, to calculate the crop drought degree, which has seldom been done in previous studies and is a good indication of significance for the agricultural drought situations of the main grain-producing areas.
This study has improved the method for evaluating comprehensive agricultural drought resistance. Past surveys have quantitatively analyzed the drought degree and drought spatial-temporal pattern from natural meteorological elements, only reflecting the meteorological background of agricultural drought. Likewise, some studies evaluated drought resistance by selecting multiple indexes from socioeconomic aspects, without considering the effects of meteorological conditions on drought resistance. Some research considering both natural and socioeconomic factors has emphasized agricultural drought resistance influenced by human activities and meteorological factors were only brought into the evaluation index system as a competing index. The agricultural drought degree, in contrast, is an agricultural drought risk indicator considering both meteorological conditions and crop factors. In recognizing the importance of socioeconomic factors on agricultural drought resistance, we believe that the higher the degree of agricultural drought, the higher the risk that crops will suffer from a drought and the weaker the agricultural drought resistance. The index focuses on how the agricultural drought degree would affect agricultural drought resistance as an important background and hazard-forming environment for agricultural drought systems.

5. Conclusions

In recent years, due to climate change, the drought situation in the main grain-producing areas in China has become more serious. The main grain-producing areas play an important role in national food production, so their drought resistance directly influences food security. Therefore, using GIS technology, this study selected five main grain-producing areas, Sanjiang Plain, Songnen Plain, Huang-Huai-Hai Plain, middle Yangtze River and Jianghuai region and Sichuan Basin, as study areas and evaluated and analyzed the comprehensive agricultural drought situation, basic drought resistance and comprehensive drought resistance against the background agricultural drought in the study areas.
The agricultural drought degree in the Huang-Huai-Hai Plain was the most serious, while it was slightly lower for the Sanjiang and Songnen Plains and was relatively light for the middle reach of the Yangtze River and Jianghuai region and the Sichuan Basin.
There was a significant difference in agricultural drought resistance among the areas. The entire Sanjiang Plain had an agricultural drought resistance at the lowest value. The Songnen Plain was slightly stronger than the Sanjiang Plain. In the Sichuan Basin, there were no areas with agricultural drought resistance at the lowest value, but there were many lower and mid-value areas. The basin’s basic drought resistance was mainly limited by the relatively low economic and social development of the region. In the Huang-Huai-Hai Plain and middle Yangtze River and Jianghuai region, the agricultural drought resistance was stronger, without any lowest value areas. Over 50% of areas had higher and highest values. The higher rate of efficient irrigation and agricultural machinery dynamic coefficient greatly improved the resistance of these two areas.
The ranking of comprehensive drought resistance from strongest to weakest was as follows: Huang-Huai-Hai Plain > middle Yangtze River and Jianghuai region > Sichuan Basin > Songnen Plain > Sanjiang Plain. Among them, the comprehensive drought resistance of the Sanjiang and Songnen Plains was comparatively weak. The drier agricultural conditions and inadequate agricultural infrastructure significantly weakened the agricultural drought resistance of these areas. In the Sichuan Basin, the agricultural drought degree was the lowest of the five areas. However, due to the underdeveloped socioeconomic levels and insufficient basic drought resistance development, the comprehensive drought resistance level was relatively low. The comprehensive drought resistance of the middle Yangtze River and Jianghuai region mainly had medium values. The Huang-Huai-Hai Plain had the strongest comprehensive drought resistance, without any lowest value areas.
Through the sensitivity analysis, it is found that the same indicator has influence to different degrees on the agricultural drought resistance. The rate of efficient irrigation and agricultural machinery dynamic coefficient and per capita GDP, each of these three indicators would cause the change of agricultural drought resistance of the Huang-Huai-Hai Plain, the middle Yangtze River and Jianghuai region and the Sichuan Basin. However, they had no effect on the ranking of the Sanjiang Plain and the Songnen Plain. Besides, the sensitive factors affecting the agricultural drought resistance in different regions are different. The agricultural aridity degree and the rate of efficient irrigation were both the most sensitive factors to agricultural drought resistance in five main grain-producing regions, but different regions showed different sensitivity to per capita GDP, the agricultural machinery dynamic coefficient and other indicators. Compared to the additive integration method, the multiplication integration method reflects the difference in the levels of indicators more sensitively. It could distinguish different evaluation objects more sensitively just in this task.

Acknowledgments

The authors acknowledge the contribution to the work by the mentors from the Institute of Geographic Sciences and Natural Resources Research, including Yunfen Liu and Lixin Wang.

Author Contributions

Lei Kang and Hongqi Zhang had the original idea for the study. Lei Kang was responsible for data collecting, data analysis and writing of the manuscript. Hongqi Zhang reviewed the manuscript.

Conflicts of Interest

The authors declare no conflict of interest.

References

  1. Wilhelmi, O.V.; Wilhite, D.A. Assessing vulnerability to agricultural drought: A Nebraska case study. Nat. Hazards 2002, 25, 37–58. [Google Scholar] [CrossRef]
  2. Quiring, S.M.; Papakryiakou, T.N. An evaluation of agricultural drought indices for the Canadian prairies. Agric. For. Meteorol. 2003, 118, 49–62. [Google Scholar] [CrossRef]
  3. Jiang, G.Q.; Yu, F.L.; Zhao, Y. An analysis of vulnerability to agricultural drought in China using the expand grey relation analysis method. Proced. Engin. 2012, 28, 670–676. [Google Scholar]
  4. Ni, S.H.; Gu, Y.; Wang, H.R. Study on frangibility zoning of agricultural drought in China. Adv. Water Sci. 2005, 16, 705–709. [Google Scholar]
  5. Linsley, R.K.; Kohler, M.A.; Paulhus, J.L. Applied Hydrology; McGraw-Hill: New York, NY, USA, 1949. [Google Scholar]
  6. Palmer, W.C. Meteorologic Drought. Available online: https://www.ncdc.noaa.gov/temp-and-precip/drought/docs/palmer.pdf (accessed on 30 March 2016).
  7. Food and Agricultural Organisation of United Nations. FAO Report of FAO-CRIDA Expert Group Consultation on Farming System and Best Practices for Drought-Prone Areas of Asia and the Pacific Region; Central Research, Institute for Dryland Agriculture: Hyderabad, India, 2002. [Google Scholar]
  8. World Meteorological Organization (WMO). Report on Drought and Countries Affected by Drought During 1974–1985; WMO: Geneva, Country, 1986; p. 118. [Google Scholar]
  9. UN Secretariat General. United Nations Convention to Combat Drought and Desertification in Countries Experiencing Serious Droughts and/or Desertification, Particularly in Africa. Available online: http://www.unccd.int/Lists/SiteDocumentLibrary/conventionText/conv-eng.pdf (accessed on 30 March 2016).
  10. Professional Standard of the People’s Republic of China. In Disaster Level of Wheat Drought Beijing; China Meteorological Administration: Beijing, China, 2007.
  11. Zhao, L.; Feng, B.; Zhang, S. Advance in the study on drought and drought index at home and abroad. Jiangsu Agric. Sci. 2012, 40, 345–348. (In Chinese) [Google Scholar]
  12. Mishra, A.K.; Singh, V.P. A review of drought concepts. J. Hydrol. 2010, 391, 202–216. [Google Scholar] [CrossRef]
  13. Mishra, A.K.; Singh, V.P. Drought modeling—A review. J. Hydrol. 2011, 403, 157–175. [Google Scholar] [CrossRef]
  14. Bian, C.; Huang, Y.; Shen, S.; Meng, Y. The drought model indexed by the soil moisture deficiency. Hydrology 2000, 20, 5–10. [Google Scholar]
  15. Sun, P.; Zhang, Q.; Bai, Y.G.; Zhang, J.H.; Deng, X.Y.; Liu, J.Y. Transitional behaviors of hydrometeorological droughts in Xinjiang using the Markov chain model. Geogr. Res. 2014, 33, 1647–1657. (In Chinese) [Google Scholar]
  16. Xu, J.; Yang, D. New model for drought estimation and prediction based on distributed hydrological simulation. J. Hydraul. Eng. 2010, 41, 739–747. [Google Scholar]
  17. Liu, W.; Negron-Juarez, R.I. ENSO drought onset prediction in northeast Brazil using NDVI. Rem. Sens. 2001, 22, 3483–3501. [Google Scholar] [CrossRef]
  18. Modarres, R. Streamflow drought time series forecasting. Stoch. Environ. Res. Risk Assess. 2007, 21, 223–233. [Google Scholar] [CrossRef]
  19. Han, P.; Wang, P.; Zhang, S.; Zhu, D. Drought forecasting based on the remote sensing data using ARIMA models. Math. Comput. Model. 2010, 51, 1398–1403. [Google Scholar] [CrossRef]
  20. Mishra, A.K.; Singh, V.P. Analysis of drought severity-area-frequency curves using a general circulation model and scenario uncertainty. J. Geoph. Res. Atmos. 2009. [Google Scholar] [CrossRef]
  21. Tase, N. Area-Deficit-Intensity Characteristics of Droughts. Available online: https://dspace.library.colostate.edu/bitstream/handle/10217/61848/HydrologyPapers_n87.pdf?sequence=1&isAllowed=y (accessed on 30 March 2016).
  22. Hallack-Alegria, M.; Watkins, D.W., Jr. Annual and warm season drought intensity-duration-frequency analysis for Sonora, Mexico. J. Clim. 2007, 20, 1897–1909. [Google Scholar] [CrossRef]
  23. McVicar, T.R.; Jupp, D.L. The current and potential operational uses of remote sensing to aid decisions on drought exceptional circumstances in Australia: a review. Agric. Syst. 1998, 57, 399–468. [Google Scholar] [CrossRef]
  24. Moradkhani, H. Hydrologic remote sensing and land surface data assimilation. Sensors 2008, 8, 2986–3004. [Google Scholar] [CrossRef]
  25. Van Dijk, A.I.J.M.; Renzullo, L.J. Water resource monitoring systems and the role of satellite observations. Hydrol. Earth Syst. Sci. 2011, 15, 39–55. [Google Scholar] [CrossRef] [Green Version]
  26. Li, H.; Dai, S.; Hu, S.; Tian, G.; Luo, H.X. Comprehensive monitoring model for agricultural drought and its application based on spatial information. Trans. CSAE 2012, 28, 181–188. (In Chinese) [Google Scholar]
  27. Liu, X.; Zhu, X.; Pan, Y.; Li, S.; Liu, Y. Agricultural drought monitor: Progress, challenges and prospect. Acta Geogr. Sin. 2015, 70, 1835–1848. (In Chinese) [Google Scholar]
  28. Tan, D.; Liu, L.; Yan, J.; Hu, Y. Research on drought monitoring model based on MODIS data. J. Yangtze River Sci. Res. Inst. 2004, 21, 11–15. (In Chinese) [Google Scholar]
  29. Xu, K.; Xu, X.; Li, A.; Yang, D. Assessing agricultural drought disaster risk in Chengde city using stochastic method. Trans. CSAE 2013, 29, 139–146. (In Chinese) [Google Scholar]
  30. Wang, C.; Wang, S.; Huo, Z.; Guo, J.; Li, Y. Progress in research of agro-meteorological disasters in China in recent decade. Acta Meteorol. Sin. 2005, 63, 659–671. (In Chinese) [Google Scholar]
  31. Liu, G.; Guo, A.; An, S. Research progress in Palmer drought severity index and it’s application. J. Natl. Disaster 2004, 13, 21–27. (In Chinese) [Google Scholar]
  32. Wu, P.; Zhao, X. Impact of climate change on agricultural water use and grain production in China. Trans. CSAE 2010, 26, 1–6. (In Chinese) [Google Scholar]
  33. Agnew, C. Using the SPI to identify drought. Drought 2000, 12, 29–42. [Google Scholar]
  34. Bonaccorso, B.; Bordi, I.; Cancelliere, A.; Rossi, G.; Sutera, A. Spatial variability of drought: an analysis of the SPI in Sicily. Water Res. Manag. 2003, 17, 273–296. [Google Scholar] [CrossRef]
  35. Ma, J.; Xu, Y.; Pan, J. Drought tendency based on standardized precipitation index (SPI) and relative moisture index over Northeast China from May to September during 1961–2009. J. Meteorol. Environ. 2012, 28, 90–95. (In Chinese) [Google Scholar]
  36. Kang, X.; Li, C.; Dai, L. Risk assessment of drought for winter wheat production in Hebei Province. Agric. Res. Arid Areas 2012, 30, 232–237. (In Chinese) [Google Scholar]
  37. Qi, S.; Zhang, X.; Sun, Y.; Li, D.; Li, Q.; Wang, M. Studies on the influence and countermeasures of drought and occurrence rule in wheat sowing time in Huaibei Area. Chin. Agric. Sci. Bull. 2012, 28, 46–53. (In Chinese) [Google Scholar]
  38. Li, J.; Yue, Y.; Lei, Y.; Wang, Z.; Wang, J. Spatial and temporal pattern of Huanghuaihai winter wheat meteorological drought risk based on SPI. In Proceedings of The 5th National Risk Annual Meeting (RAC-2012), Nanjing, China, 27–28 October 2012. (In Chinese)
  39. Li, S.; Liu, R.; Ma, Z. Impact of climate change on planting distribution of winter wheat in Shaanxi Province. Agric. Res. Arid Areas 2012, 30, 252–256. (In Chinese) [Google Scholar]
  40. Kang, X.; Li, C.; Ma, H.; Le, Z. Study on drought evaluation model of winter wheat based on crop water production function. Chin. Agric. Sci. Bull. 2011, 27, 274–279. (In Chinese) [Google Scholar]
  41. Sun, H.; Su, Z.; Qu, Y. Dynamic assessment of agricultural drought disasters risk based on crop growth model. Agric. Res. Arid Areas 2013, 31, 231–236. (In Chinese) [Google Scholar]
  42. Zhang, J.; Zhao, Y.; Wang, C.; Yang, X.; Wang, J. Evaluation technology on drought disaster to yields of winter wheat based on WOFOST crop growth model. Acta Ecol. Sin. 2013, 33, 1762–1769. (In Chinese) [Google Scholar] [CrossRef]
  43. Yan, L.; Zhang, J.; Wang, C.; Yan, D.; Liu, X.; Tong, Z. Vulnerability evaluation and regionalization of drought disaster risk of maize in Northwestern Liaoning Province. Chin. J. Eco Agric. 2012, 20, 788–794. (In Chinese) [Google Scholar] [CrossRef]
  44. Shang, Y.; Huang, D.; Yang, J. Diagnosis and assessment of agricultural drought system’s vulnerability in irrigated area-Taking Xingtai County of Hebei Province as an example. Areal Res. Dev. 2006, 25, 117–121. (In Chinese) [Google Scholar]
  45. Shang, Y.; Chen, J.; Zhang, R.; Li, M.; Zhou, F.; Shang, H. Assessment framework and method of agricultural system resilience to drought-A case study of Xingtai City, Hebei Province. Chin. J. Eco Agric. 2011, 19, 167–171. (In Chinese) [Google Scholar] [CrossRef]
  46. Gu, Y.; Ni, S.; Wang, H. Comprehensive evaluation on ability of coping with agriculture drought in China. Adv. Water Sci. 2005, 16, 700–704. (In Chinese) [Google Scholar]
  47. Zhang, D.; Wang, G.; Zhou, H. Assessment on agricultural drought risk based on variable fuzzy sets model. Chin. Geogr. Sci. 2011, 21, 167–175. (In Chinese) [Google Scholar] [CrossRef]
  48. Liu, L.; Liu, S.; Liu, P.; Tian, Y. Synthtic analysis and quantitative estimation of the agricultural vulnerability to drought disaster in Hunan Province. J. Natl. Disaster 2002, 1, 78–83. (In Chinese) [Google Scholar]
  49. Yang, Q.; Feng, F.; Chao, L. Comprehensive evaluation on ability of coping with agriculture drought by using multi-objective decision. J. Catastr. 2007, 22, 5–8. (In Chinese) [Google Scholar]
  50. Planting Industry Management Department, The ministry of agriculture of the People’s Republic of China. Available online: http://www.zzys.moa.gov.cn (accessed on 7 April 2016).
  51. Chad, M.; Ramankutty, N.; Foley, J.A. Geographic distribution of crop areas, yields, physiological types, and net primary production in the year 2000. Glob. Biogeochem. Cycl. 2008, 22, 71–86. [Google Scholar]
  52. Yang, Z.; Liu, L.; Cao, Y.; Yu, Y.; Yan, D. Advances in risk assessment and forecast warning of agricultural drought disasters. J. Econ. Water Res. 2011, 29, 12–17. [Google Scholar]
  53. Ni, G.; Li, X.; Cong, Z. Temporal and spatial characteristics of reference evapotranspiration in China. Trans. CSAE 2006, 22, 1–4. (In Chinese) [Google Scholar]
  54. Li, Y.; Cui, J.; Zhang, T. Comparative study on calculation methods of reference evapotranspiration. J. Desert Res. 2002, 22, 372–376. (In Chinese) [Google Scholar]
  55. Lv, H.; Qian, S.; Yang, F. Estimation of actural evaptranspiration for maize field in north China. J. Appl. Meteorol. Sci. 2003, 14, 722–728. [Google Scholar]
  56. Zhang, F.; Wang, D.; Qiu, B. China’s Agricultural Phenology Atlas; Science Press: Beijing, China, 1987. [Google Scholar]
  57. Allen, R.G.; Pereira, L.S.; Raes, D. Crop Evapotranspiration: Guidelines for Computing Crop Water Requirement; Food and Agriculture Organization of the United Nations (FAO) Irrigation and Drainage Paper No. 56; FAO: Rome, Italy, 1998. [Google Scholar]
  58. He, B. Quantitative Assessment and Spatial Characters Analysis of the Risk to Agricultural Drought in China; Institute of Geographic Sciences and Natural Resources Research, Chinese Academy of Sciences: Beijing, China, 2010. (In Chinese) [Google Scholar]
  59. Chen, L.; Fang, L.; Li, S. Study on drought trend of crop growing season in Northeast China in recent 50 years. J. Catastr. 2010, 25, 5–10. (In Chinese) [Google Scholar]
  60. General Administration of Quality Supervision, Standardization Administration of the People’s Republic of China. Classification of meteorological drought GB/T 2048006; General Administration of Quality Supervision, Standardization Administration of the People’s Republic of China: Beijing, China, 2006.
  61. Liu, L.; Yang, Z.; Xu, Z. Risk assessment of agricultural drought disaster in Liaoning Province. Water Res. Power 2013, 31, 1–4. (In Chinese) [Google Scholar]
  62. Zhang, Y. Evaluation on the Ecological Suitability of Urban Construction Land based on Weights Sensitivity Analysis for Junshan District of Yueyang City. Master’s Thesis, Hunan University, Changsha, China, 2012. [Google Scholar]
  63. Chen, Y.; Yu, J.; Khan, S. Spatial sensitivity analysis of multi-criteria weights in GIS-based land suitability evaluation. Environ. Model. Softw. 2010, 25, 1582–1591. (In Chinese) [Google Scholar] [CrossRef]
  64. Wang, H.; Gong, Q. Analysis of rainfall anomaly in growing season of crops in Northeast China. Meteorol. Sci. Technol. 2005, 33, 345–349. (In Chinese) [Google Scholar]
  65. Wang, Y.; Huang, Y.; Zhang, W. Variation and tendency of surface aridity index from 1960 to 2005 in three provinces of Northeast China. Adv. Earth Sci. 2008, 23, 619–627. (In Chinese) [Google Scholar]
  66. Yan, L. A study on Dynamic Risk Assessment of Maize Drought Disaster in Northwestern Liaoning Province. Master’s Thesis, Northeast Normal University, Changchun, China, 2012. [Google Scholar]
  67. Wang, Z.; He, F.; Li, J. Assessment on drought risk of typical wheat in China based on EPIC model. Agric. Res. Arid Areas 2012, 30, 210–215. (In Chinese) [Google Scholar]
  68. Zhao, L.; Wu, J.; Lv, A. Spatial and temporal analysis of drought over the Huang-Huai-Hai Plain and its surroundings based on the standardized precipitation index. Res. Sci. 2011, 33, 468–476. (In Chinese) [Google Scholar]
  69. Li, S.; Lv, H.; Zhang, Y. Spatial-temporal distribution characteristics of dryness/wetness over Huanghuaihai region from 1961 to 2006. Meteorol. Sci. Technol. 2008, 36, 601–605. (In Chinese) [Google Scholar]
  70. Lv, H.; Yang, F.; Qian, S. Study on water consumption in summer corn field under condition of drought. Meteorol. Month. 2002, 28, 38–41. (In Chinese) [Google Scholar]
  71. Zhang, H.; Qu, Y. Preliminary discuss on the drought mitigation strategy for the five provinces in the middle and lower reaches of the Yangtze River. Chin. Water Res. 2011, 13, 31–34. (In Chinese) [Google Scholar]
  72. Wang, W.; Cai, X. Analysis on variation feature of drought in mid-and lower-reaches of Yangtze River Basin. Plateau Meteorol. 2010, 29, 1587–1593. (In Chinese) [Google Scholar]
  73. Zhang, S.; Hou, M.; Wang, S. The drought assessment of Sichuan Basin based on information diffusion and the fuzzy comprehensive evaluation method. J. Nat. Res. 2008, 23, 713–723. (In Chinese) [Google Scholar]
  74. Zhuang, G.; Fei, Y.; Liu, C.; Yan, M.; Wang, J. Adaptation between irrigation intensity and ground water carrying capacity in North China Plain. Trans. CSAE 2013, 29, 1–10. (In Chinese) [Google Scholar]
  75. Yang, R.; Xiao, B.; Chen, Y.; Lu, B. The background of high efficiency utilization of agricultural climatic resources in Huang-Huai-Hai Plain and the main farming techniques. J. Arid Land Res. Environ. 2010, 24, 88–93. (In Chinese) [Google Scholar]
  76. Ma, X.; Yao, Y.; Xu, Y. A model for dynamic assessment of crop yield losses from drought and its tryout in Anhui Province. J. Catastr. 2010, 25, 13–17. (In Chinese) [Google Scholar]
Figure 1. Location of the five main wheat, rice and maize-producing regions in China.
Sustainability 08 00346 g001
Figure 2. The spatial distribution of the comprehensive agricultural drought situations of the five main grain-producing areas.
Sustainability 08 00346 g002
Figure 3. Distribution of the agricultural drought resistance classifications in the five main grain-producing areas.
Sustainability 08 00346 g003
Figure 4. Spatial distribution of the comprehensive drought resistance against the background agricultural drought in the five main grain-producing areas.
Sustainability 08 00346 g004
Figure 5. The comprehensive evaluation scores of the agricultural drought resistance of the five main grain-producing areas. Note: Ⅰ, Ⅱ, Ⅲ, Ⅳ and Ⅴ are, respectively, the Sanjiang Plain, Songnen Plain, Huang-Huai-Hai Plain, middle Yangtze River and Jianghuai region and Sichuan Basin. The y-axis represents scores of agricultural drought resistance.
Sustainability 08 00346 g005
Figure 6. The sensitivity schematic diagram of the evaluation results under different index selection conditions. Note: This diagram shows the changes in comprehensive drought resistance ranking under eight scenarios, including an all-indicators’ evaluation and an evaluation when removing one indicator at a time. Ⅰ, Ⅱ, Ⅲ, Ⅳ and Ⅴ are, respectively, the Sanjiang Plain, Songnen Plain, Huang-Huai-Hai Plain, middle Yangtze River and Jianghuai region and Sichuan Basin. The y coordinate represents the ranking of comprehensive drought resistance.
Sustainability 08 00346 g006
Figure 7. The sensitivity schematic diagram of the agricultural drought resistance evaluation under different index weight conditions. Note: In the figure, the line with each color represents one of the indicators. ⅰ, ⅱ, ⅲ, ⅳ, ⅴ, ⅵ and ⅶ respectively represent the soil texture, ratio of areas of high and low water consumption crops, rate of efficient irrigation, agricultural machinery dynamic coefficient, expenditures on agroforestry and water transactions, per capita GDP and agricultural drought degree. The changing gradients of the lines reflect how the comprehensive scores of drought resistance in each main grain-producing region change when the indicator weight changes according to a certain percentage. The x coordinate represents the percentage of the indicator weight change. In our study, the weight of each indicator changed from −100% to 100% with a step of 10%. The y coordinate represents the change rate of the comprehensive drought resistance score with the indicator weight change. A larger absolute value of the slope means the greater sensitivity of agricultural drought resistance evaluation results to indicator weights.
Sustainability 08 00346 g007
Table 1. Aridity index classification of crops in consideration of the sensitivity response of thegrowing period.
Aridity Index (AI)<0.50.5 to 0.80.8 to 1.01.0 to 1.61.6 to 1.8>1.8
Dry grade123456
Drought degreeNo droughtMild droughtLight droughtModerate droughtSevere droughtExtreme drought
Weight index (Mi)01.5361224
Table 2. Evaluation index with six indicators and their interpretation for agricultural drought.
Assessment TargetIndicatorsIndex CalculationIndex Interpretation
agriculture drought resistancesoil textureThe soil texture is divided into sandy soil, sandy loam, light loam, medium loam, heavy loam and clay, according to clay content in the soil layer of 0 to 30 cm The sandy soil is weak at storing water with poorer drought resistance. Clay soil can save a lot of water, but it also has poor drought resistance with low water infiltration and heavy loss. Loam soil has strong drought resistance due to the great capability of preserving water and nutrients.
area ratio of high and low water consumption cropsThe ratio of water-intensive crops area and low water-demand crops areaThe higher the value is, the greater are the regional planting water demand and irrigation pressure; thus, the agriculture drought resistance is relatively weaker.
rate of efficient irrigationThe ratio of effective irrigation area and arable land areaThe higher the value, the higher the degree of regional irrigation and the stronger the agriculture drought resistance.
agricultural machinery dynamic coefficientThe ratio of total agricultural machinery power and arable landThe higher the value, the more the agricultural inputs, the higher the agricultural mechanization degree and the stronger the agriculture drought resistance.
expenditure of agroforestry and water transactionDirectly obtained from the yearbookThe higher the value, the better improved is the agricultural production condition, which is more conducive to enhance the agriculture drought resistance.
per capita GDPThe ratio of regional GDP and populationThe higher the value, the higher the level of social economic development, the greater the drought control and engineering construction investment and the stronger the agriculture drought resistance.
Table 3. Area ratio statistics of different drought grades in the five main grain-producing areas (%).
Main Grain Producing AreaMild DroughtLight DroughtModerate DroughtSevere DroughtExtreme Drought
Sanjiang Plain0.0024.7453.3321.930.00
Songnen Plain0.0013.4228.2244.8013.56
Huang-Huai-Hai Plain0.000.7215.4029.9853.90
Yangzi River and Jianghuai Plain 21.2465.2812.670.820.00
Sichuan Basin55.7234.989.300.000.00
Table 4. Area ratio statistics of comprehensive drought resistance grades in the five main grain-producing areas (%).
Main Grain Producing AreaLowest ValueLower ValueMedium ValueHigher ValueHighest Value
Sanjiang Plain58.9241.080.000.000.00
Songnen Plain56.0421.5122.450.000.00
Huang-Huai-Hai Plain0.0010.7420.5735.5433.15
Yangzi River and Jianghuai Plain 0.0018.6439.0134.068.29
Sichuan Basin10.9257.7221.589.780.00
Table 5. The ranking statistics of each region under different index selection conditions.
All_IndexDel_ADIDel_SoilDel_CropDel_IrrigDel_PowerDel_AFWDEL_GDP
55555555
44444444
23113323
11221111
32332232
Note: The first column in the table represents the five main grain-producing areas, where Ⅰ, Ⅱ, Ⅲ, Ⅳ and Ⅴ are, respectively, the Sanjiang Plain, Songnen Plain, Huang-Huai-Hai Plain, middle Yangtze River and Jianghuai region and Sichuan Basin. “All Index,” “Del_ADI,” “Del_soil,” “Del_crop,” “Del_irrig,” “Del_power,” “Del_AFW” and “Del_GDP” in the first line respectively represent the all-indicators’ evaluation, excluding the agriculture degree, excluding the soil texture, excluding the ratio of the areas of high and low water consumption crops, excluding the rate of efficient irrigation, excluding the agricultural machinery dynamic coefficient, excluding the expenditures on agroforestry and water transactions and excluding per capita GDP, which represent eight different indicator selection scenarios. Figures in the table represent the rankings of each main grain-producing area under different indicator selection scenarios.
Table 6. The classification proportion of the agricultural drought resistance in the five main grain-producing areas based on the multiplication aggregation method (%).
Main Grain Producing AreaLowest ValueLower ValueMedium ValueHigher ValueHighest Value
Sanjiang Plain85.4614.540.000.000.00
Songnen Plain61.6115.9422.450.000.00
Huang-Huai-Hai Plain1.989.1017.1942.0829.65
Yangzi River and Jianghuai Plain0.0026.4631.1930.1912.16
Sichuan Basin38.2033.0819.778.940.00

