1. Introduction
People spend most of their time (
i.e., over 80%) indoors [
1]. Therefore, their health is dependent on the quality of the indoor environment [
1,
2], which includes the thermal environment [
3]. Studies show that improving the indoor environmental quality (IEQ) has an impact on health through decreasing building-related symptoms [
4].
Sick Building Syndrome (SBS) is commonly used to describe poor indoor air quality in office buildings [
5]. When the environment is considered unhealthy, parts of the body react to the phenomenon, whether it be coldness, overheating, or excessive draughts [
6]. As the threshold dose varies according to building user, symptoms range from tiredness, loss of concentration, and depression, to severe outcomes including Legionnaires’ disease and cardiovascular degeneration (not considered as part of Sick Building Syndrome) [
7]. In response to an unhealthy environment, infections and allergic reactions are reported, such as irritated skin, sore throat, and dry or watery eyes [
6]. Lethargy, headaches, dry skin, and nasal, eye, and mucus symptoms are the most common symptoms of Sick Building Syndrome [
8]. Migraine and elevated headache frequency are also related to the quality of the indoor environment [
9]. Eye and upper respiratory symptoms are reported to be related to a carbon dioxide concentration of over 800 ppm [
10]. Other research reports that lowering the concentration of carbon dioxide below 800 ppm reduces the risk of SBS [
11,
12,
13]. In many studies, 800 ppm is the limit for the impact of carbon dioxide level indoors [
14,
15,
16]. Most researchers agree that Sick Building Syndrome (SBS) describes a constellation of non-specific health symptoms that have no clear etiology and are attributable to exposure to a particular building environment [
17]. Irritations in indoor environments are reported with different frequency; one group of frequent symptoms has been identified as SBS. Since the early 1980s, the WHO has compiled the common symptoms reported in what was defined as SBS [
18].
Sick Building Syndrome was identified in the early 1980s, as health-related issues in the workplace intensified, particularly following the introduction of air conditioning in open plan offices [
19]. Therefore, there is a debate as to whether air conditioning is responsible for building-related symptoms. The recent energy crisis, along with environmental and economic challenges, has encouraged building construction to prioritize natural ventilation. There is an assumption that natural ventilation is the perfect solution for a sustainable, energy-efficient, and low-carbon design and there is a tendency to assume that it improves users’ health compared to the air-conditioned buildings. Studies investigated users’ health in air-conditioned and naturally ventilated buildings [
20], but contradictory results were reported [
21]. There is a disagreement between researchers on whether mechanical ventilation and air conditioning in particular are responsible for ill health in buildings. In this view the influence of other factors are ignored, such as the impact of the architectural design, which includes individual control over the thermal environment. This study investigated building-related symptoms in two workplace environments with high and low levels of thermal control: a Norwegian cellular and a British open plan office, respectively. The Norwegian practice was air conditioned, while the British practice was naturally ventilated. The building performance and occupants’ health in the two buildings were compared.
2. Previous Related Work
Rollins and Swift (1997) state that health is related to control: either to be “at the mercy of external forces” or to be in control of a surrounding environment [
15]. Lack of environmental control causes building-related symptoms [
22]. Rayner explains that “people with most symptoms have least perceived control over their environment” [
23].
The use of questionnaires is the most widely deployed method to investigate building-related symptoms. In their questionnaire, Raw
et al. (1995) include the identification of symptoms, such as “dry, itchy or watery eyes; blocked, stuffy or runny nose; and dry throat” [
24]. Leaman (1996) applies a similar questionnaire with additional probing regarding “skin irritation or rash; headaches; and lethargy” [
25]. Bluyssen’s survey (2009) includes additional questions for “chest tightness; pain in neck, shoulders or back” [
6]. Burge (2004) explains that a questionnaire is not always a useful tool to measure some symptoms, such as dry skin. In this case, the period away from work clarifies whether the symptom is related to the work conditions or not [
26].
In most work environments, there are occupants who complain about building-related symptoms [
27]. The reason for the debate over air conditioning being responsible for Sick Building Syndrome is that SBS was identified as a phenomenon after the application of air conditioning in the workplace in 1980s [
19]. Health issues have been compared in air-conditioned and naturally ventilated offices [
20]. However, there are contradictory reports on the relationship between health and the type of ventilation [
21]. Many researchers associate air conditioning with a higher risk of building-related symptoms [
8,
22,
28,
29], such as lethargy, ocular, nasal, and pharyngeal symptoms [
20], and problems with the skin, mucus membranes, and nervous system [
29].
In contrast, Rayner claims that if air conditioning systems are designed properly, they can be the best option, with the lowest rates of building-related symptoms [
16]. A research on Scandinavian offices reveals that air-conditioned buildings “when functioning properly” do not increase building-related symptoms [
28]. An increase in the ventilation rate is reported to reduce the symptoms [
28,
30]. Although many studies report lower symptoms in naturally ventilated buildings [
20], energy-efficient buildings are associated with a high risk of health-related issues [
24]. According to the World Health Organization, these buildings are “kept relatively warm and have homogeneous thermal environment” [
24,
31,
32], due to high levels of insulation and lack of ventilation to maintain the temperature [
24]. Fisk
et al. (2009) suggest a ventilation rate sufficient to obviate health-related issues [
33]. Overall, distinguishing healthy from unhealthy buildings is more complicated than anticipated [
27].
3. Methodologies
This study questioned whether air conditioning is responsible for ill health in the workplace. It investigated the impact of availability of thermal control on the frequency of building-related symptoms. Two contexts that provided high and low levels of control over the thermal environment were compared: Norwegian cellular and U.K. open plan offices, respectively. Air conditioning was deployed in the two Norwegian case study buildings, while displacement and natural ventilation systems were used in the two British open plan offices. All case studies had openable windows as part of the design, although the performance of the mechanically ventilated buildings did not depend on this feature compared to the naturally ventilated office. Field studies of thermal comfort were undertaken in the summer of 2012. This particular season was selected to reduce the impact of outdoor climatic conditions on the study, as the air temperature in Oslo (
i.e., 26 °C) was close to that in Inverness and Aberdeen (
i.e., 23 °C) during the fieldwork. The selected buildings were subject to peer review as to their skin and services design with a perceived high quality in the indoor environment. Mainly sedentary activities took place in the four buildings. Overall, 313 responses were included in this study, with 68 to 95 responses from each building from a good range of ages and genders, as presented in
Table 1. The number of workstations, their size, and the space per person are also shown in
Table 1. The size of the workstations and space per person were larger in the Norwegian practices compared to the British offices, as this was related to the actual size of the personal rooms.
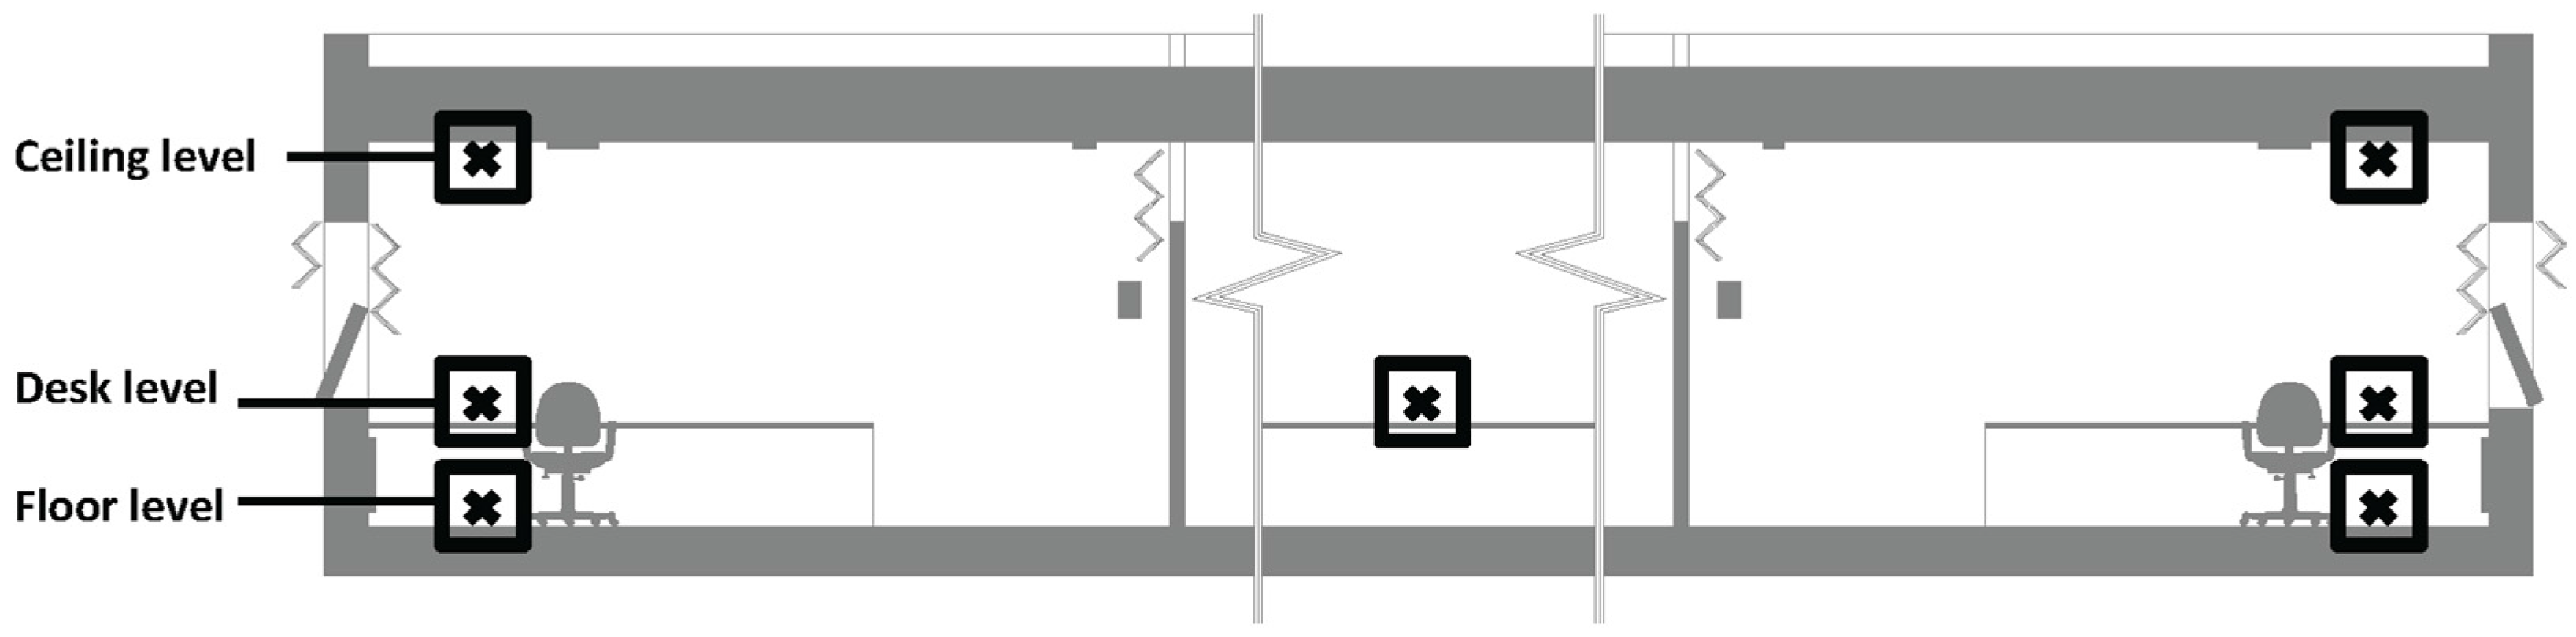
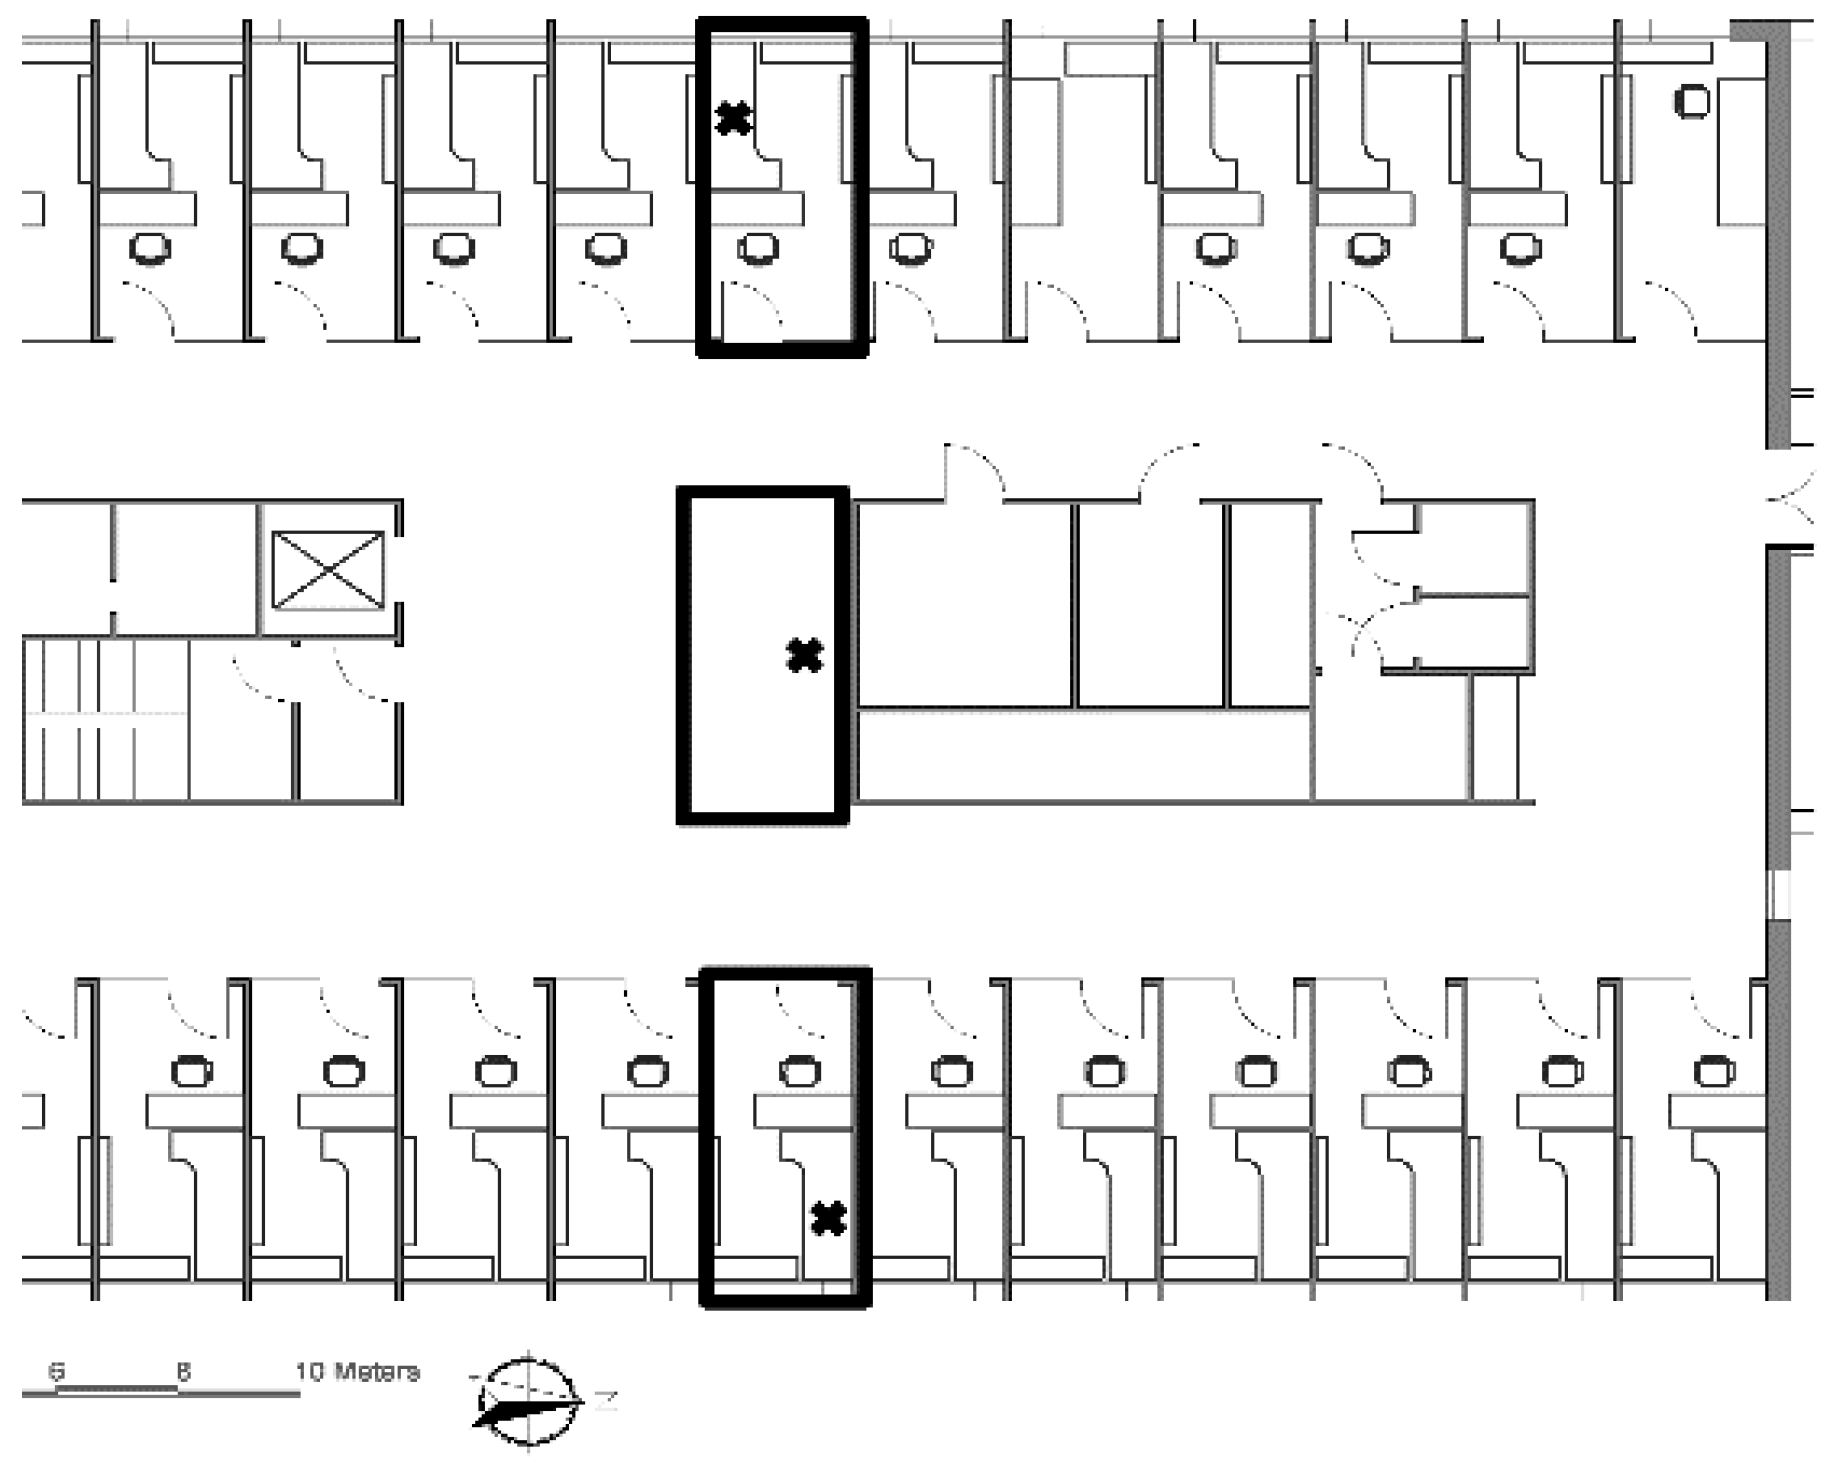
The building performance was evaluated using environmental measurements and in accordance with the ASHRAE standard, as presented in
Section 4. Environmental measurements were applied to measure the particular thermal environment at the surveyed workstations and to evaluate the overall building performance: instant and constant measurements, respectively. The instant measurement was applied on the desk level at the surveyed workstations. For the constant measurement, particular measuring points were selected in particular locations in the building on the floor, desk, and ceiling levels, as demonstrated in
Figure 1 and
Figure 2.
Humidity, temperature, and air monitoring equipment were used to measure the thermal environment, as presented in
Table 2. Mean radiant temperature was calculated by the ASHRAE Thermal Comfort Tool 2 [
34] and surface measurements using the constant measuring method.
Following the established practice in the field, a questionnaire (presented in
Table 3) was used to record the most common symptoms of Sick Building Syndrome [
8]. As explained in
Section 2, this questionnaire was mainly based on Raw
et al. (1995), Bluyssen (2009), and Leaman (1996). Symptoms that were not related to the work environment were discounted by asking the respondents, who reported any symptoms, if they felt it was related to the work environment and whether they experienced the symptom during the weekend or holidays. Overall, 264 out of 313 respondents completed all of the questions.
4. Building Performance
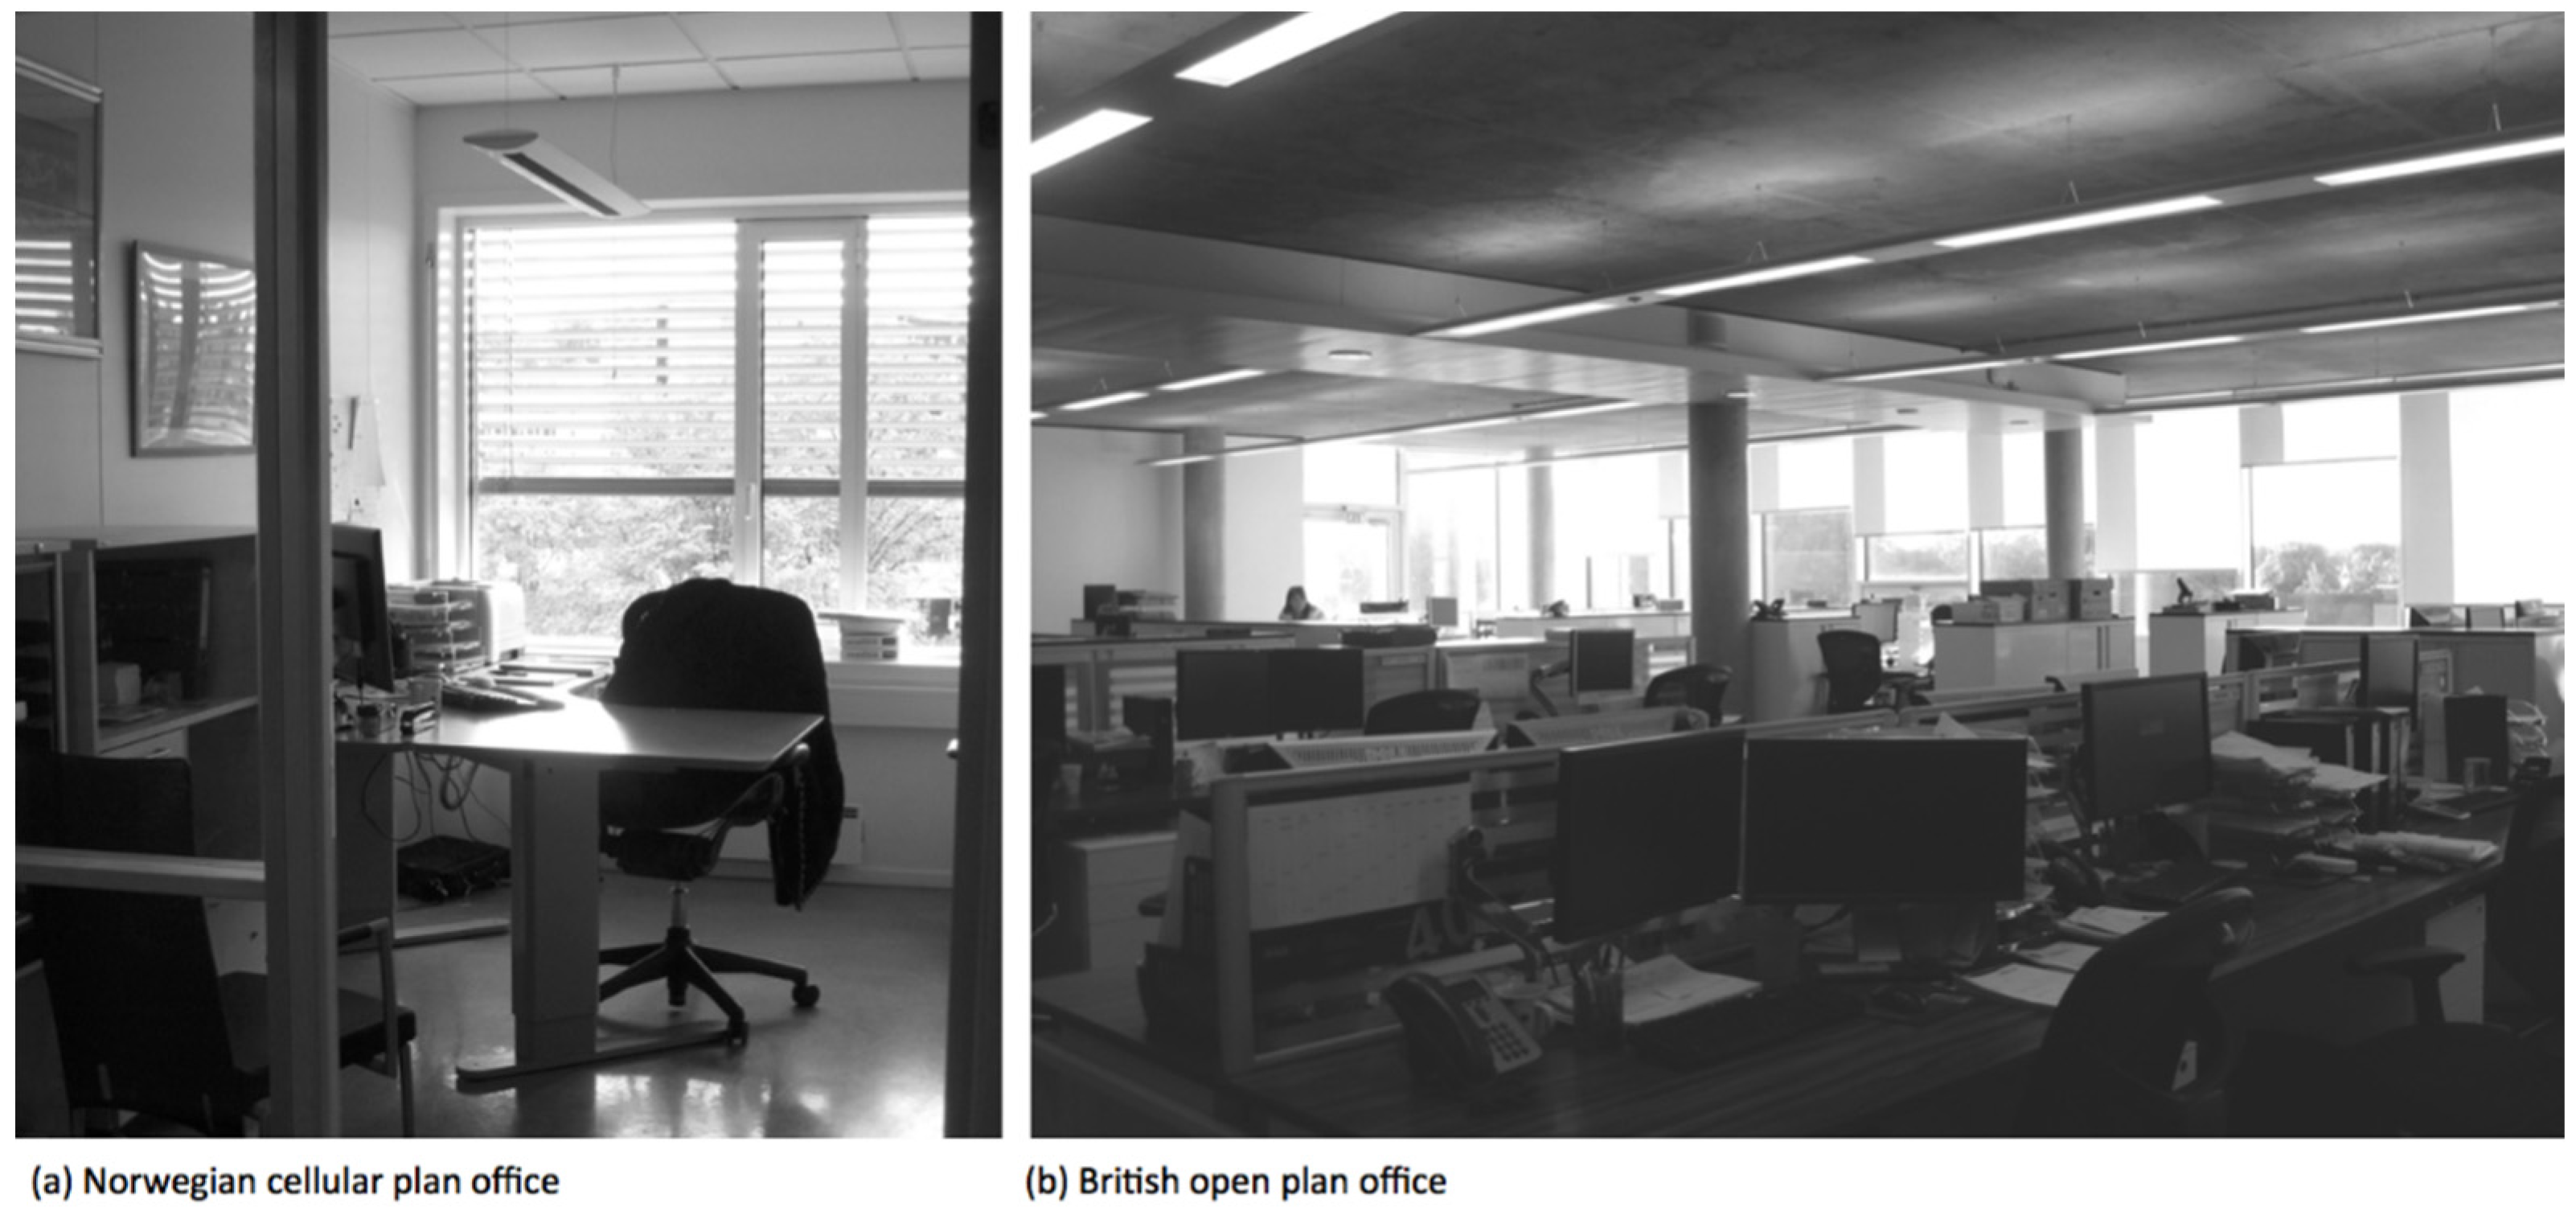
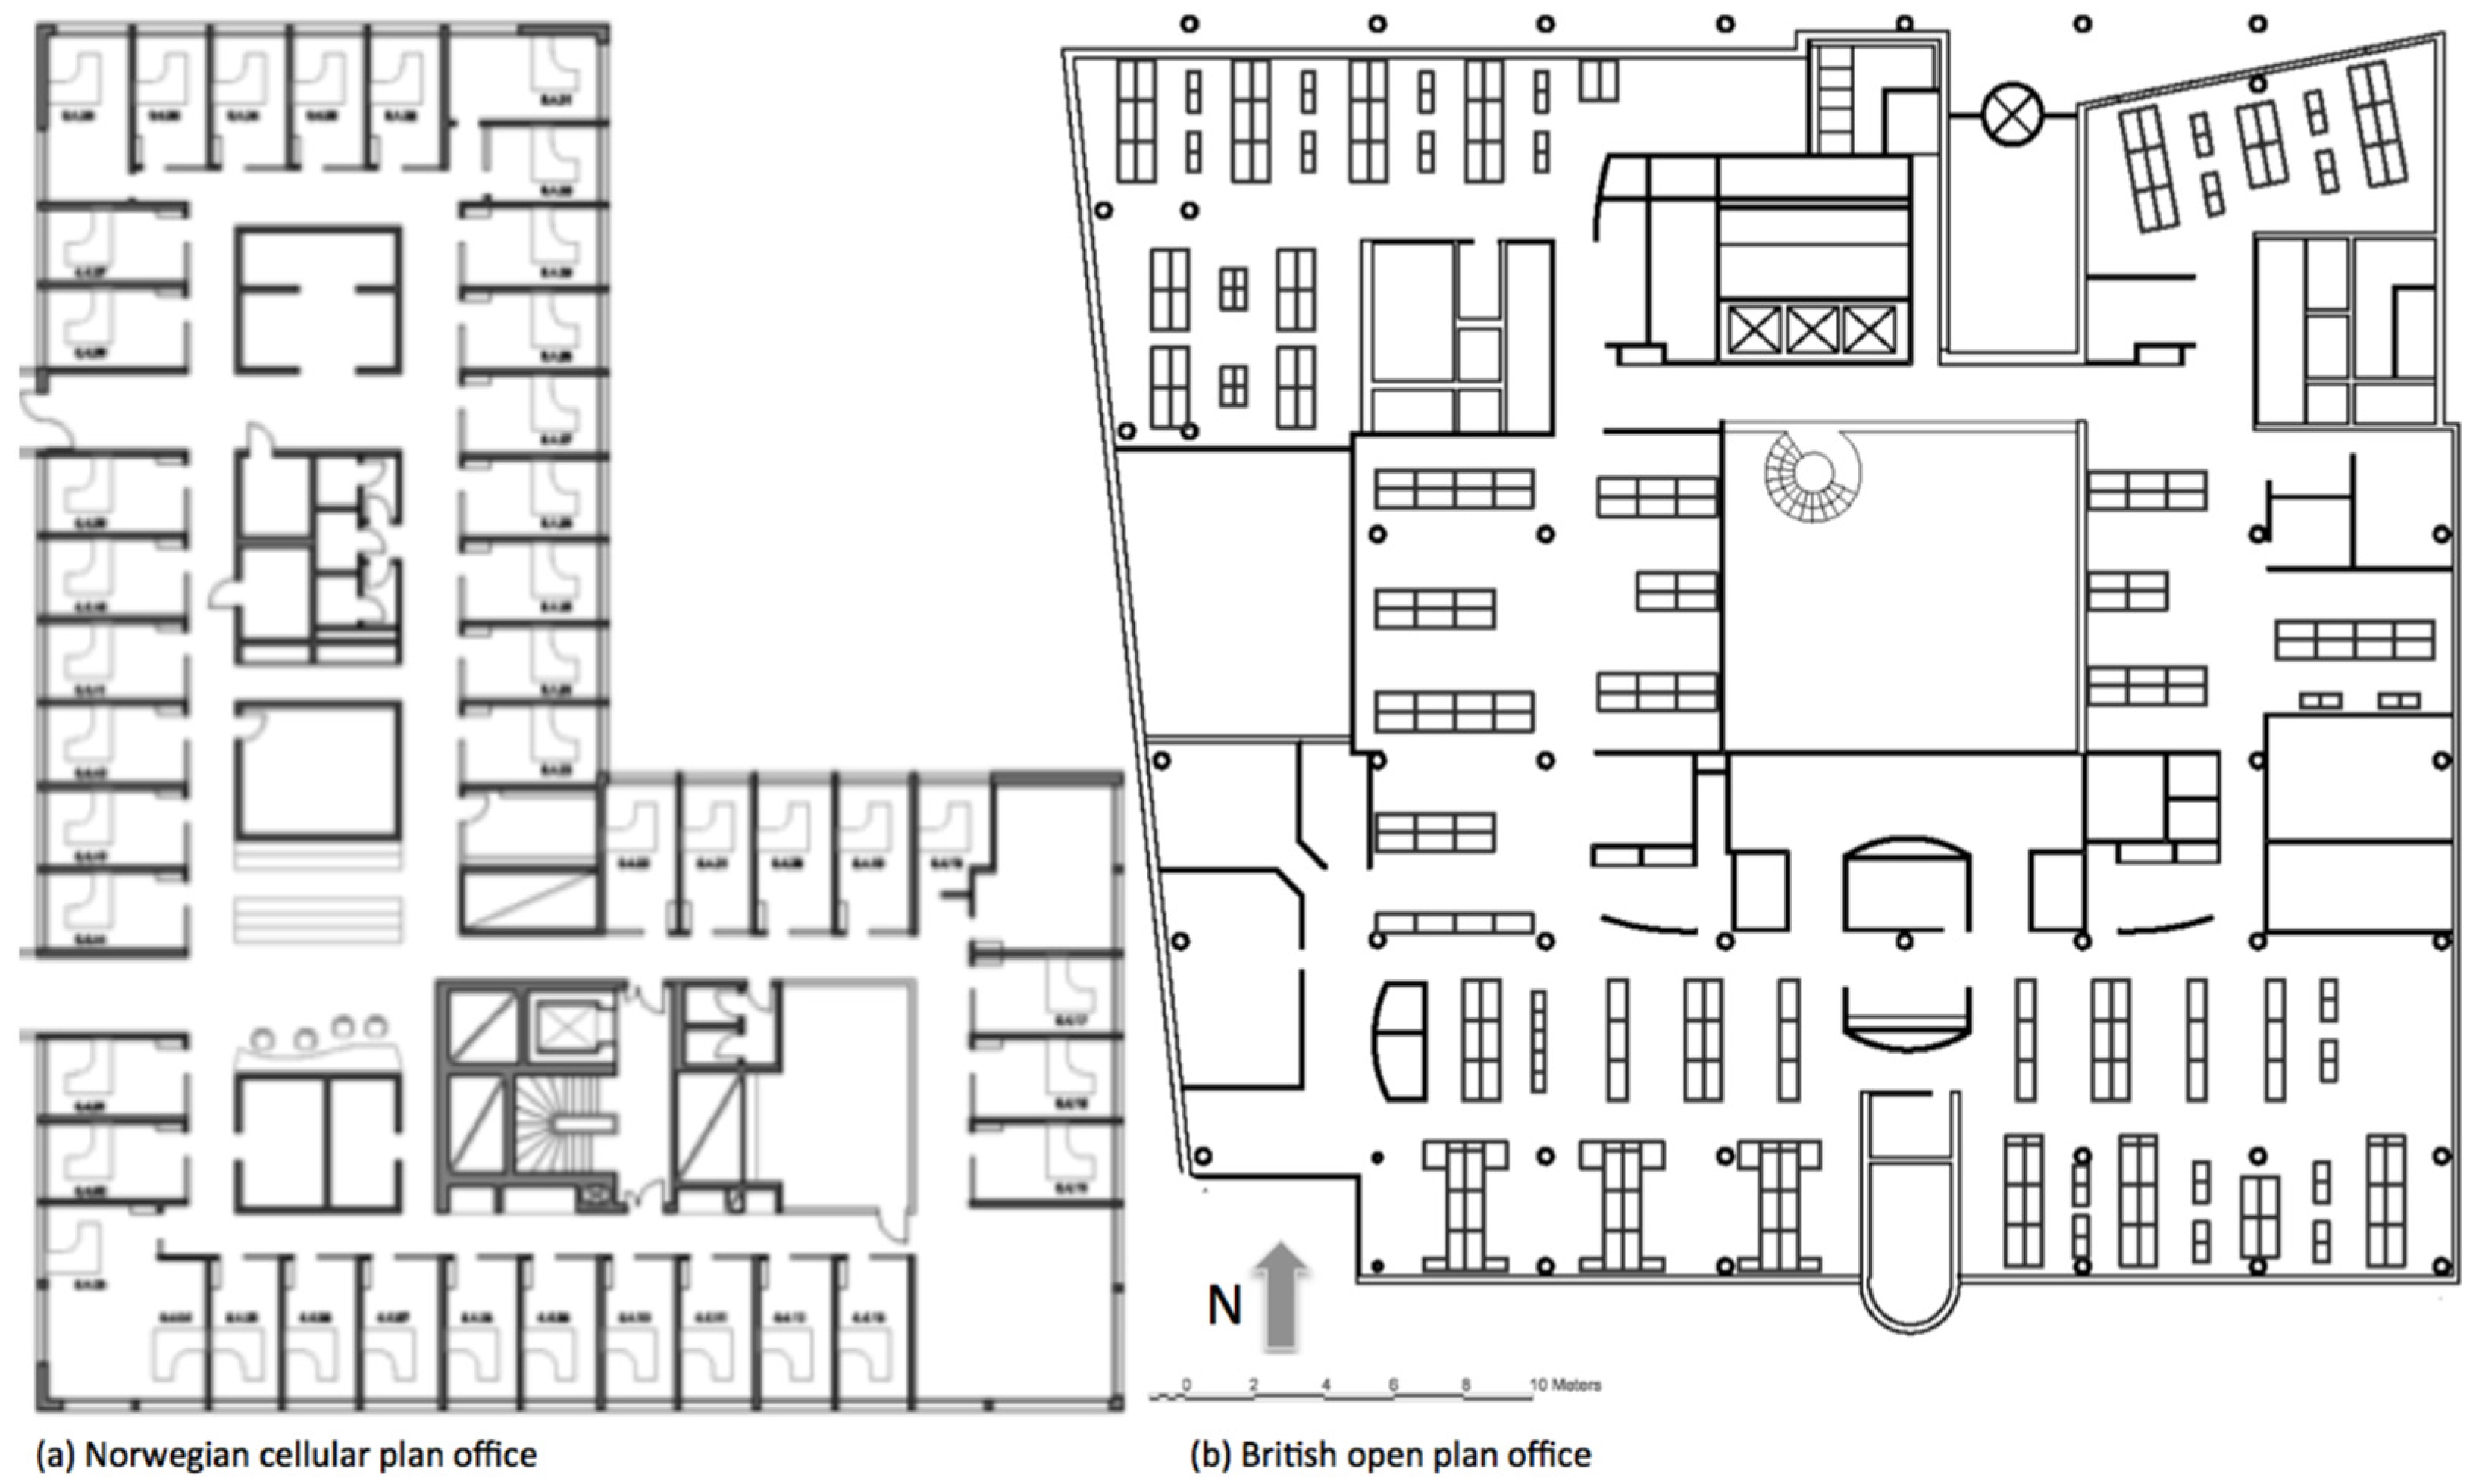
In this section, ventilation performance, thermal performance, light, and carbon dioxide levels are analyzed and compared to the standards. In the Norwegian offices, every occupant was provided with a personal office, which was located around the perimeter of the building in order to access a window with an outside view, natural light, and ventilation. Services, such as toilets, pantries, meeting rooms, and social spaces, were located in the center and a corridor connected them to the personal offices. Each office had a glass wall or door in order to improve the visual connection to the rest of the office, as presented in
Figure 3 and
Figure 4.
In the British offices, occupants shared an open plan office. In building D, a few personal offices were provided for the management. The quality of these personal offices was very different compared to the Norwegian cellular offices. They were spaces located in the center of the open plan offices with no window, outside view, or natural light or ventilation, simply separated from the open plan office through partitions and a glass door or wall. No means of environmental control was provided in the management offices in building D. In building C, desk level windows were openable by the occupants seated around the perimeter of the building. In building D, only a few relatively small windows were openable.
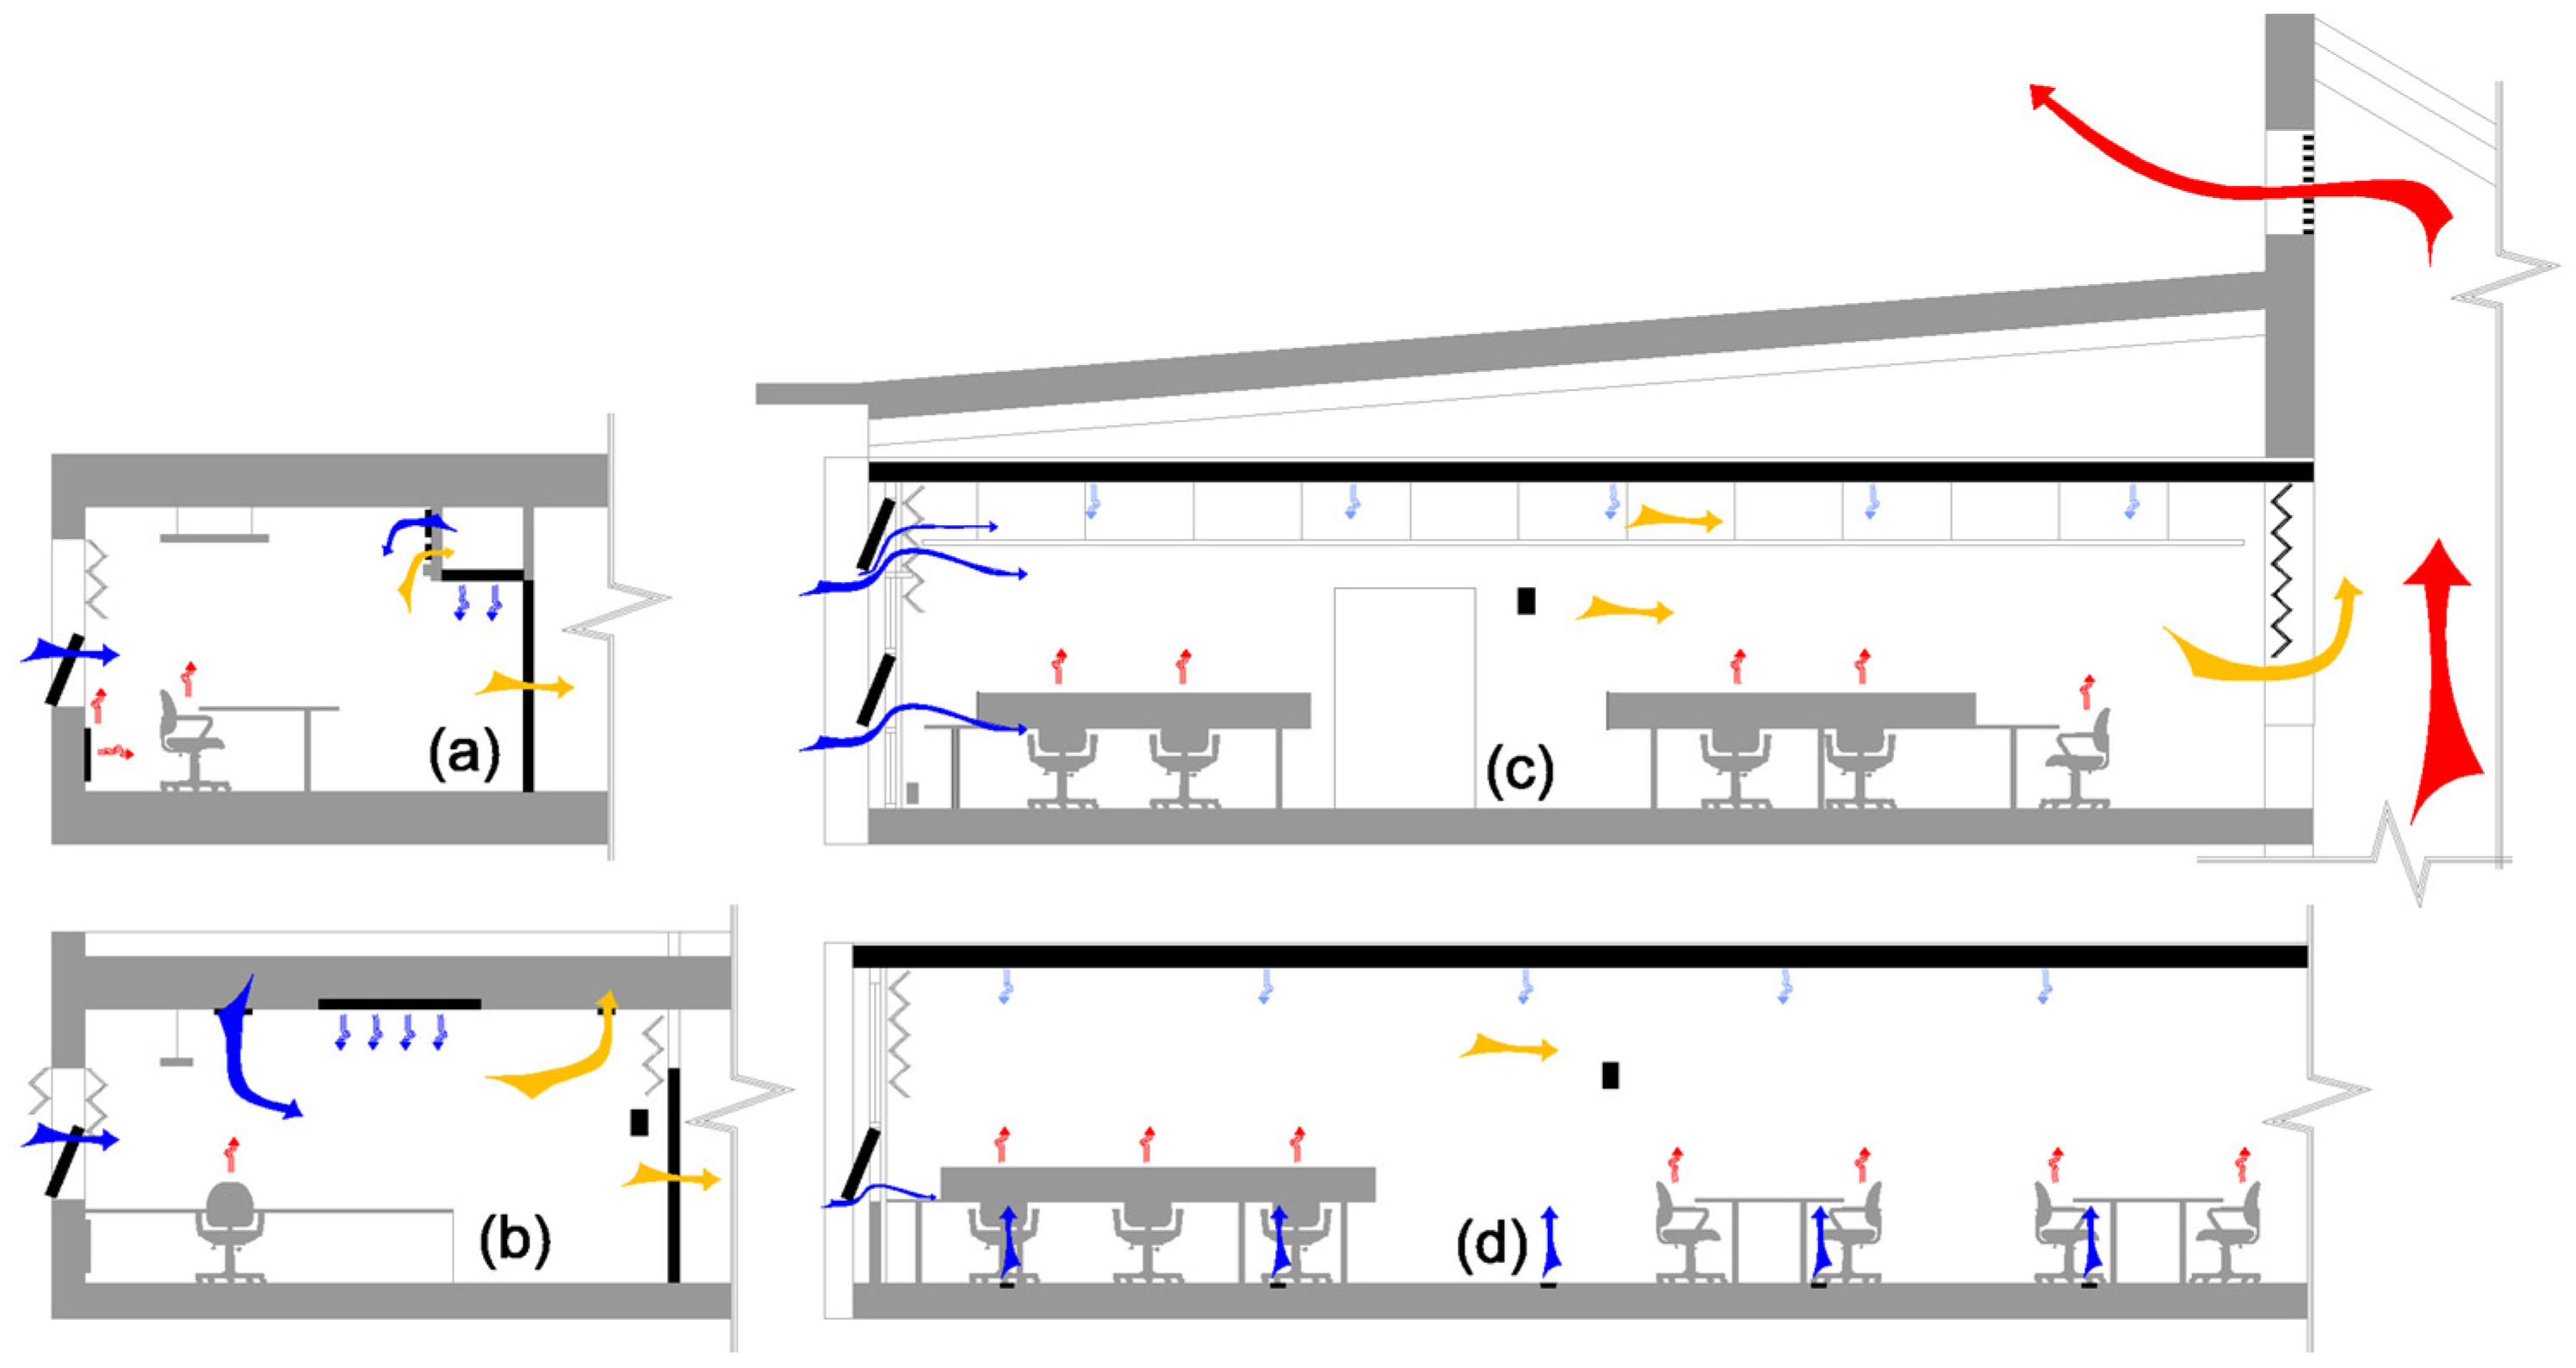
Air conditioning was in operation in the two cellular plan offices, as presented in
Figure 5. Displacement ventilation was used in one of the open plan offices (building D) and natural ventilation with automated windows and vents in the other (building C). The air conditioning and displacement ventilation systems were the source of cooling and fresh air using air-filtering and heat recovery. All four buildings had manually controlled openable windows as a source of natural ventilation.
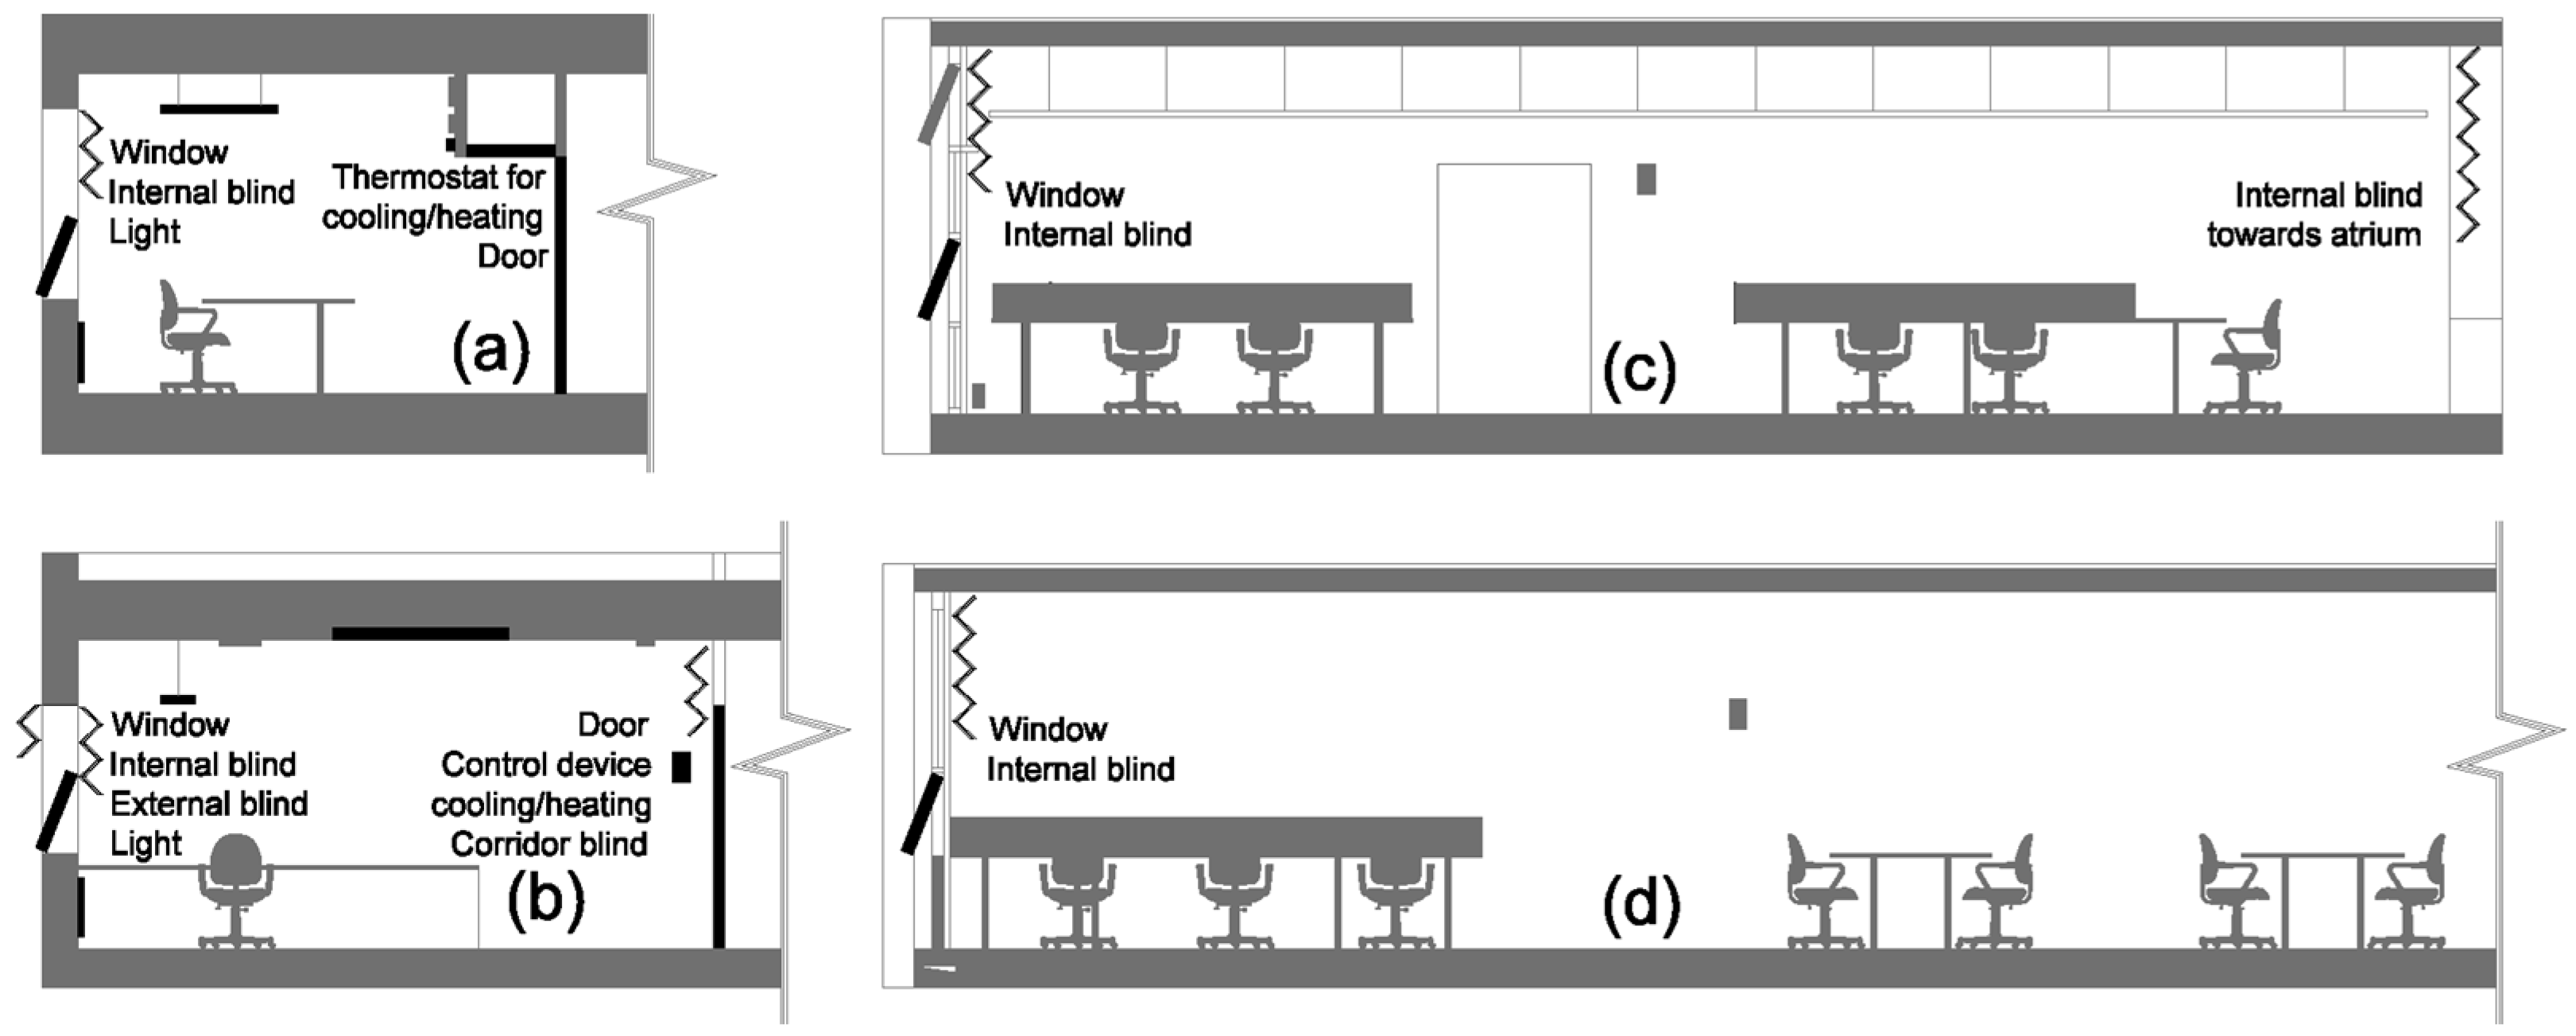
Norwegian offices provided every occupant with a personal room and a high level of thermal control, according to Norwegian work regulations [
35]. Every occupant was provided with an openable window, a door, thermostat, and blinds in the personal office. In contrast, the U.K. practices provided thermal control only for those occupants seated around the perimeter of the open plan offices. The majority of the occupants seated away from the windows had no access to any means of control over the thermal environment, as illustrated in
Figure 6.
Figure 5 also illustrates the summer day ventilation in the four buildings. In Building A, an openable window, mechanical ventilation, radiant cooling, and a radiator were in operation at the same time. This was the main cause for the high energy consumption in this building. Mechanical ventilation was centrally controlled and therefore, in order to allow the occupant to change the room temperature, a thermostat was available. It switched on either the radiator or the radiant cooling system in accordance with the current room temperature and the user’s demand. Therefore, in many offices the radiator was operating in the heat of summer while the window was left open to cool the room. In Building B, an openable window, mechanical ventilation, and radiant cooling were in operation and only air conditioning was centrally controlled. Building C was mainly a naturally ventilated building with automated top windows and vents to ensure good indoor air quality. The bottom windows were manually controlled by occupants. In Building D, openable windows and displacement ventilation were in operation. The former was controlled by occupants. This information is presented in
Table 4. Air velocity was detected at less than 0.1 m/s in all buildings, which was within the acceptable range.
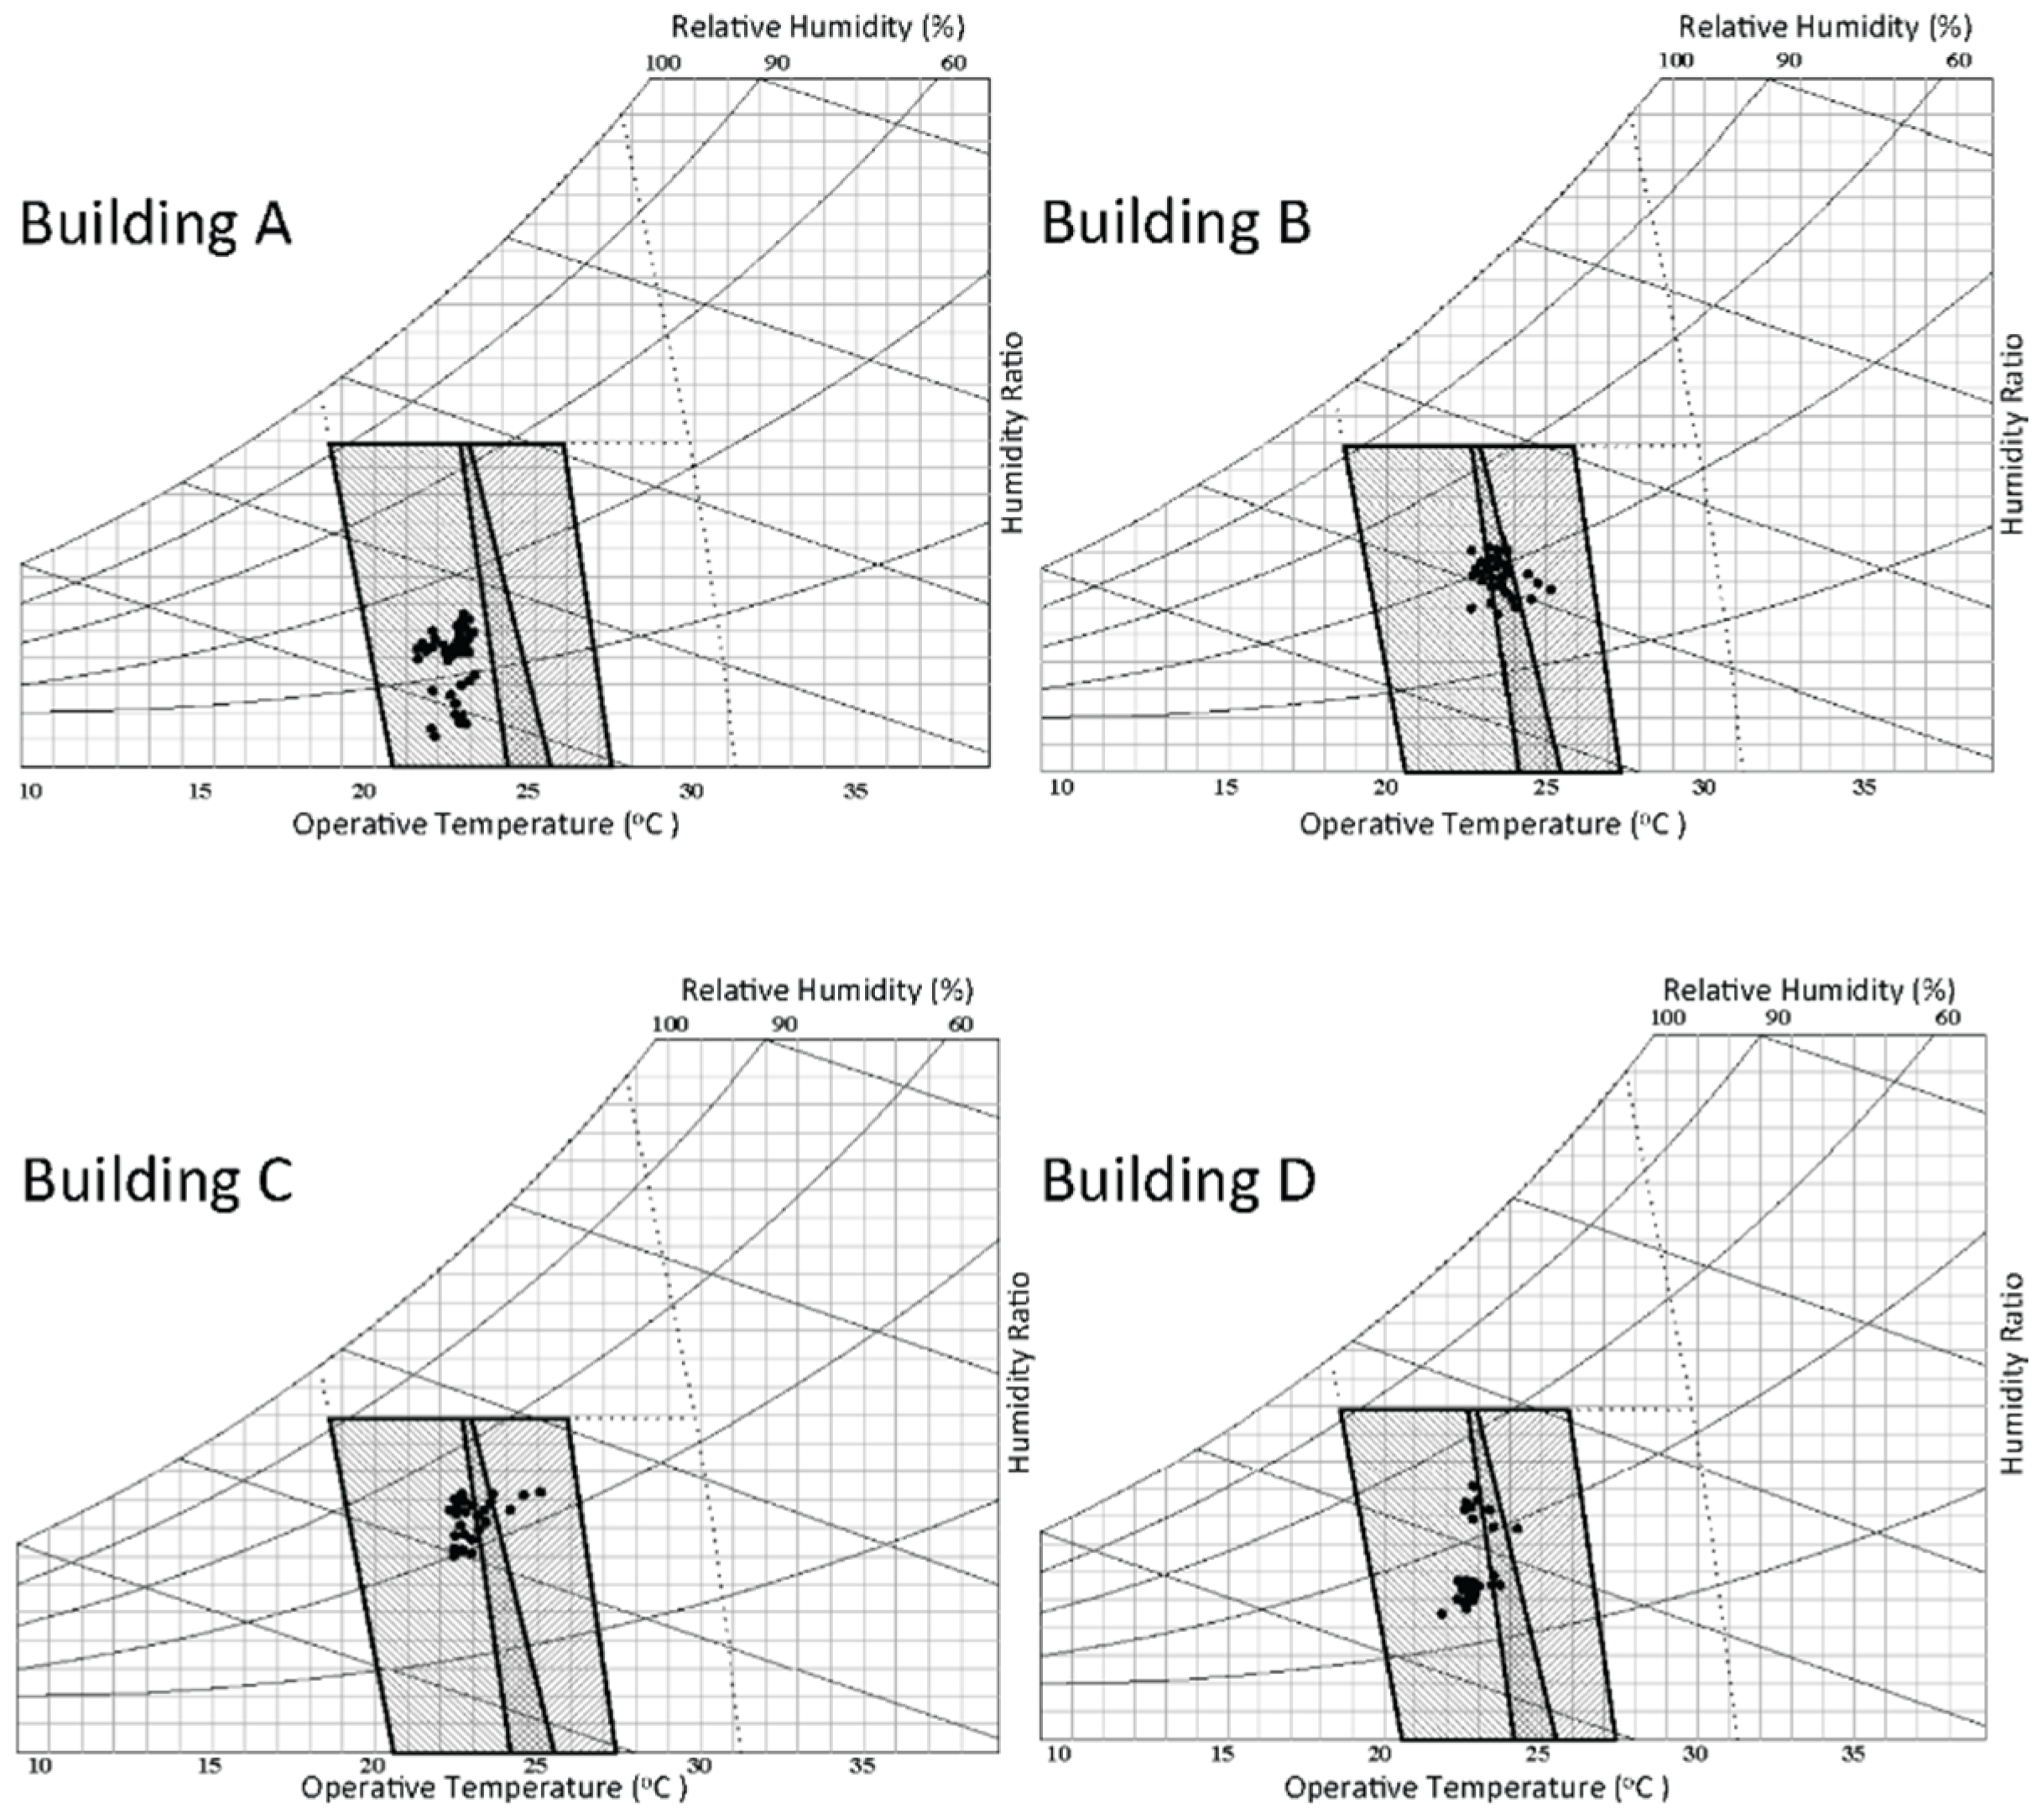
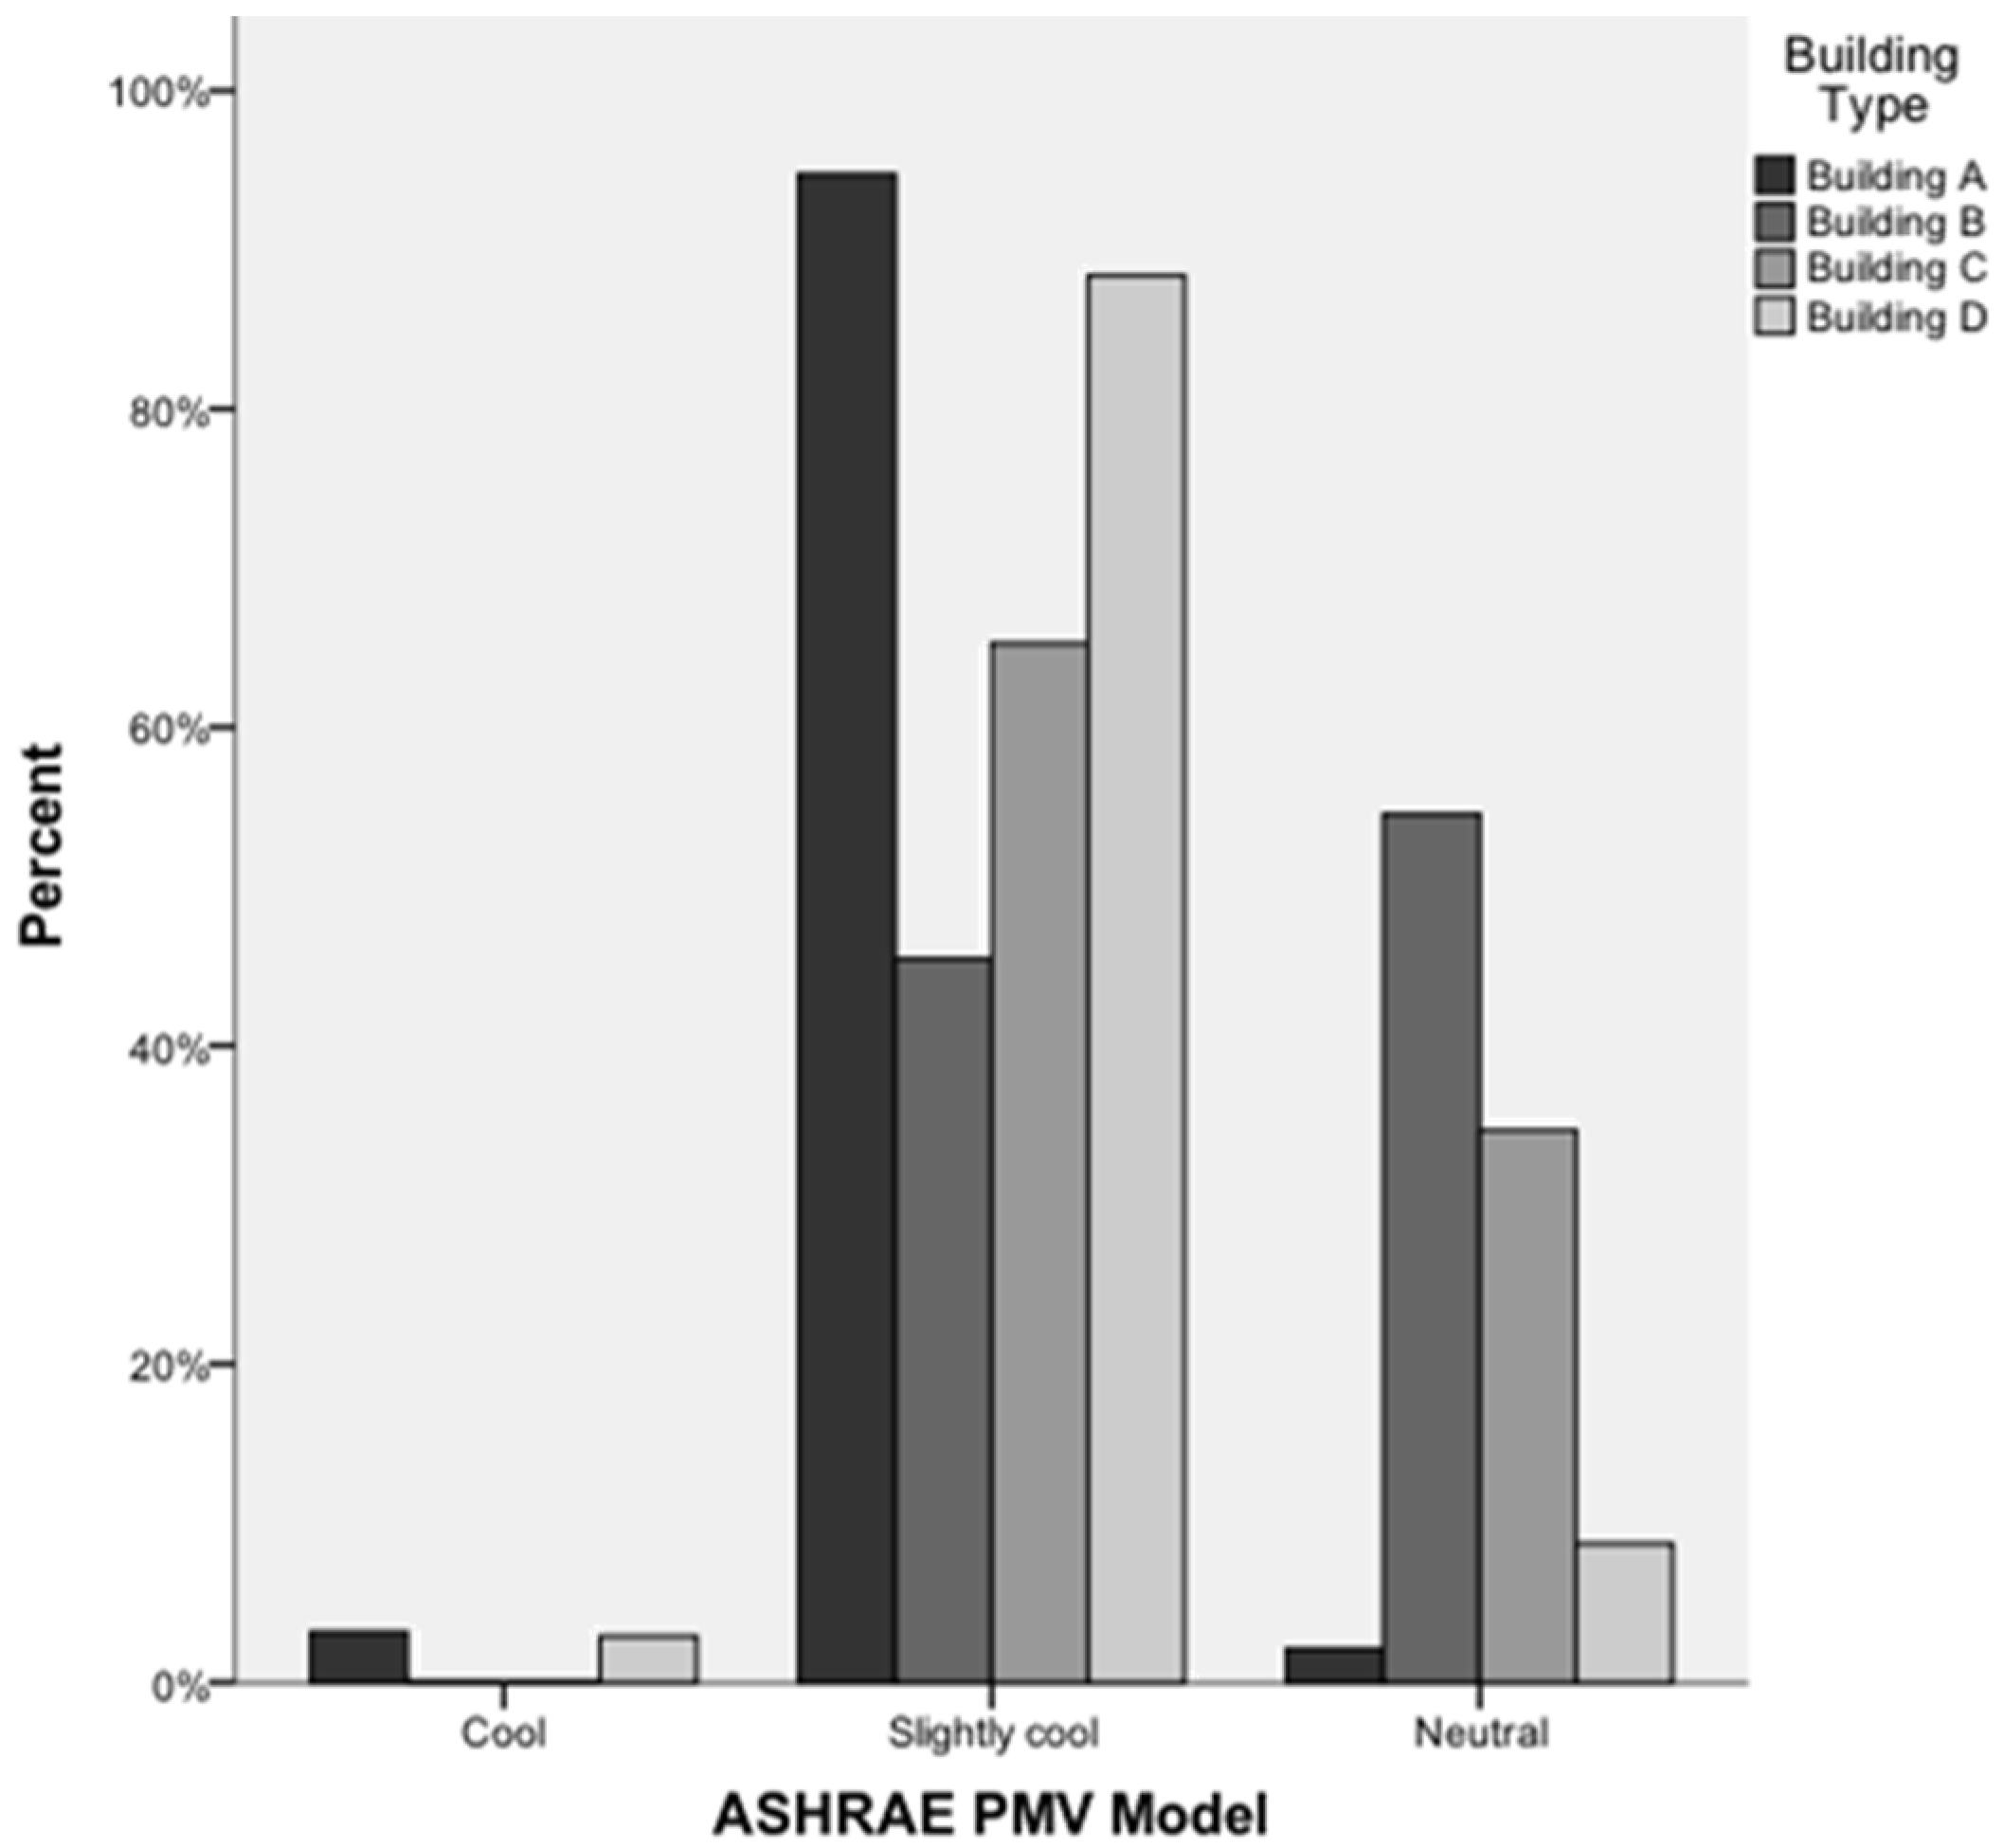
The Predicted Mean Vote (PMV) analysis was applied to evaluate the thermal performance of the buildings in accordance with the ASHRAE Standard 55-2013 [
36] using the ASHRAE Thermal Comfort Tool [
34], as shown in
Figure 7.
This analysis showed similar and acceptable conditions in all four buildings with “neutral” or “cool” conditions. Building A was expected to be slightly cooler than the other buildings, as presented in
Figure 7 and
Figure 8.
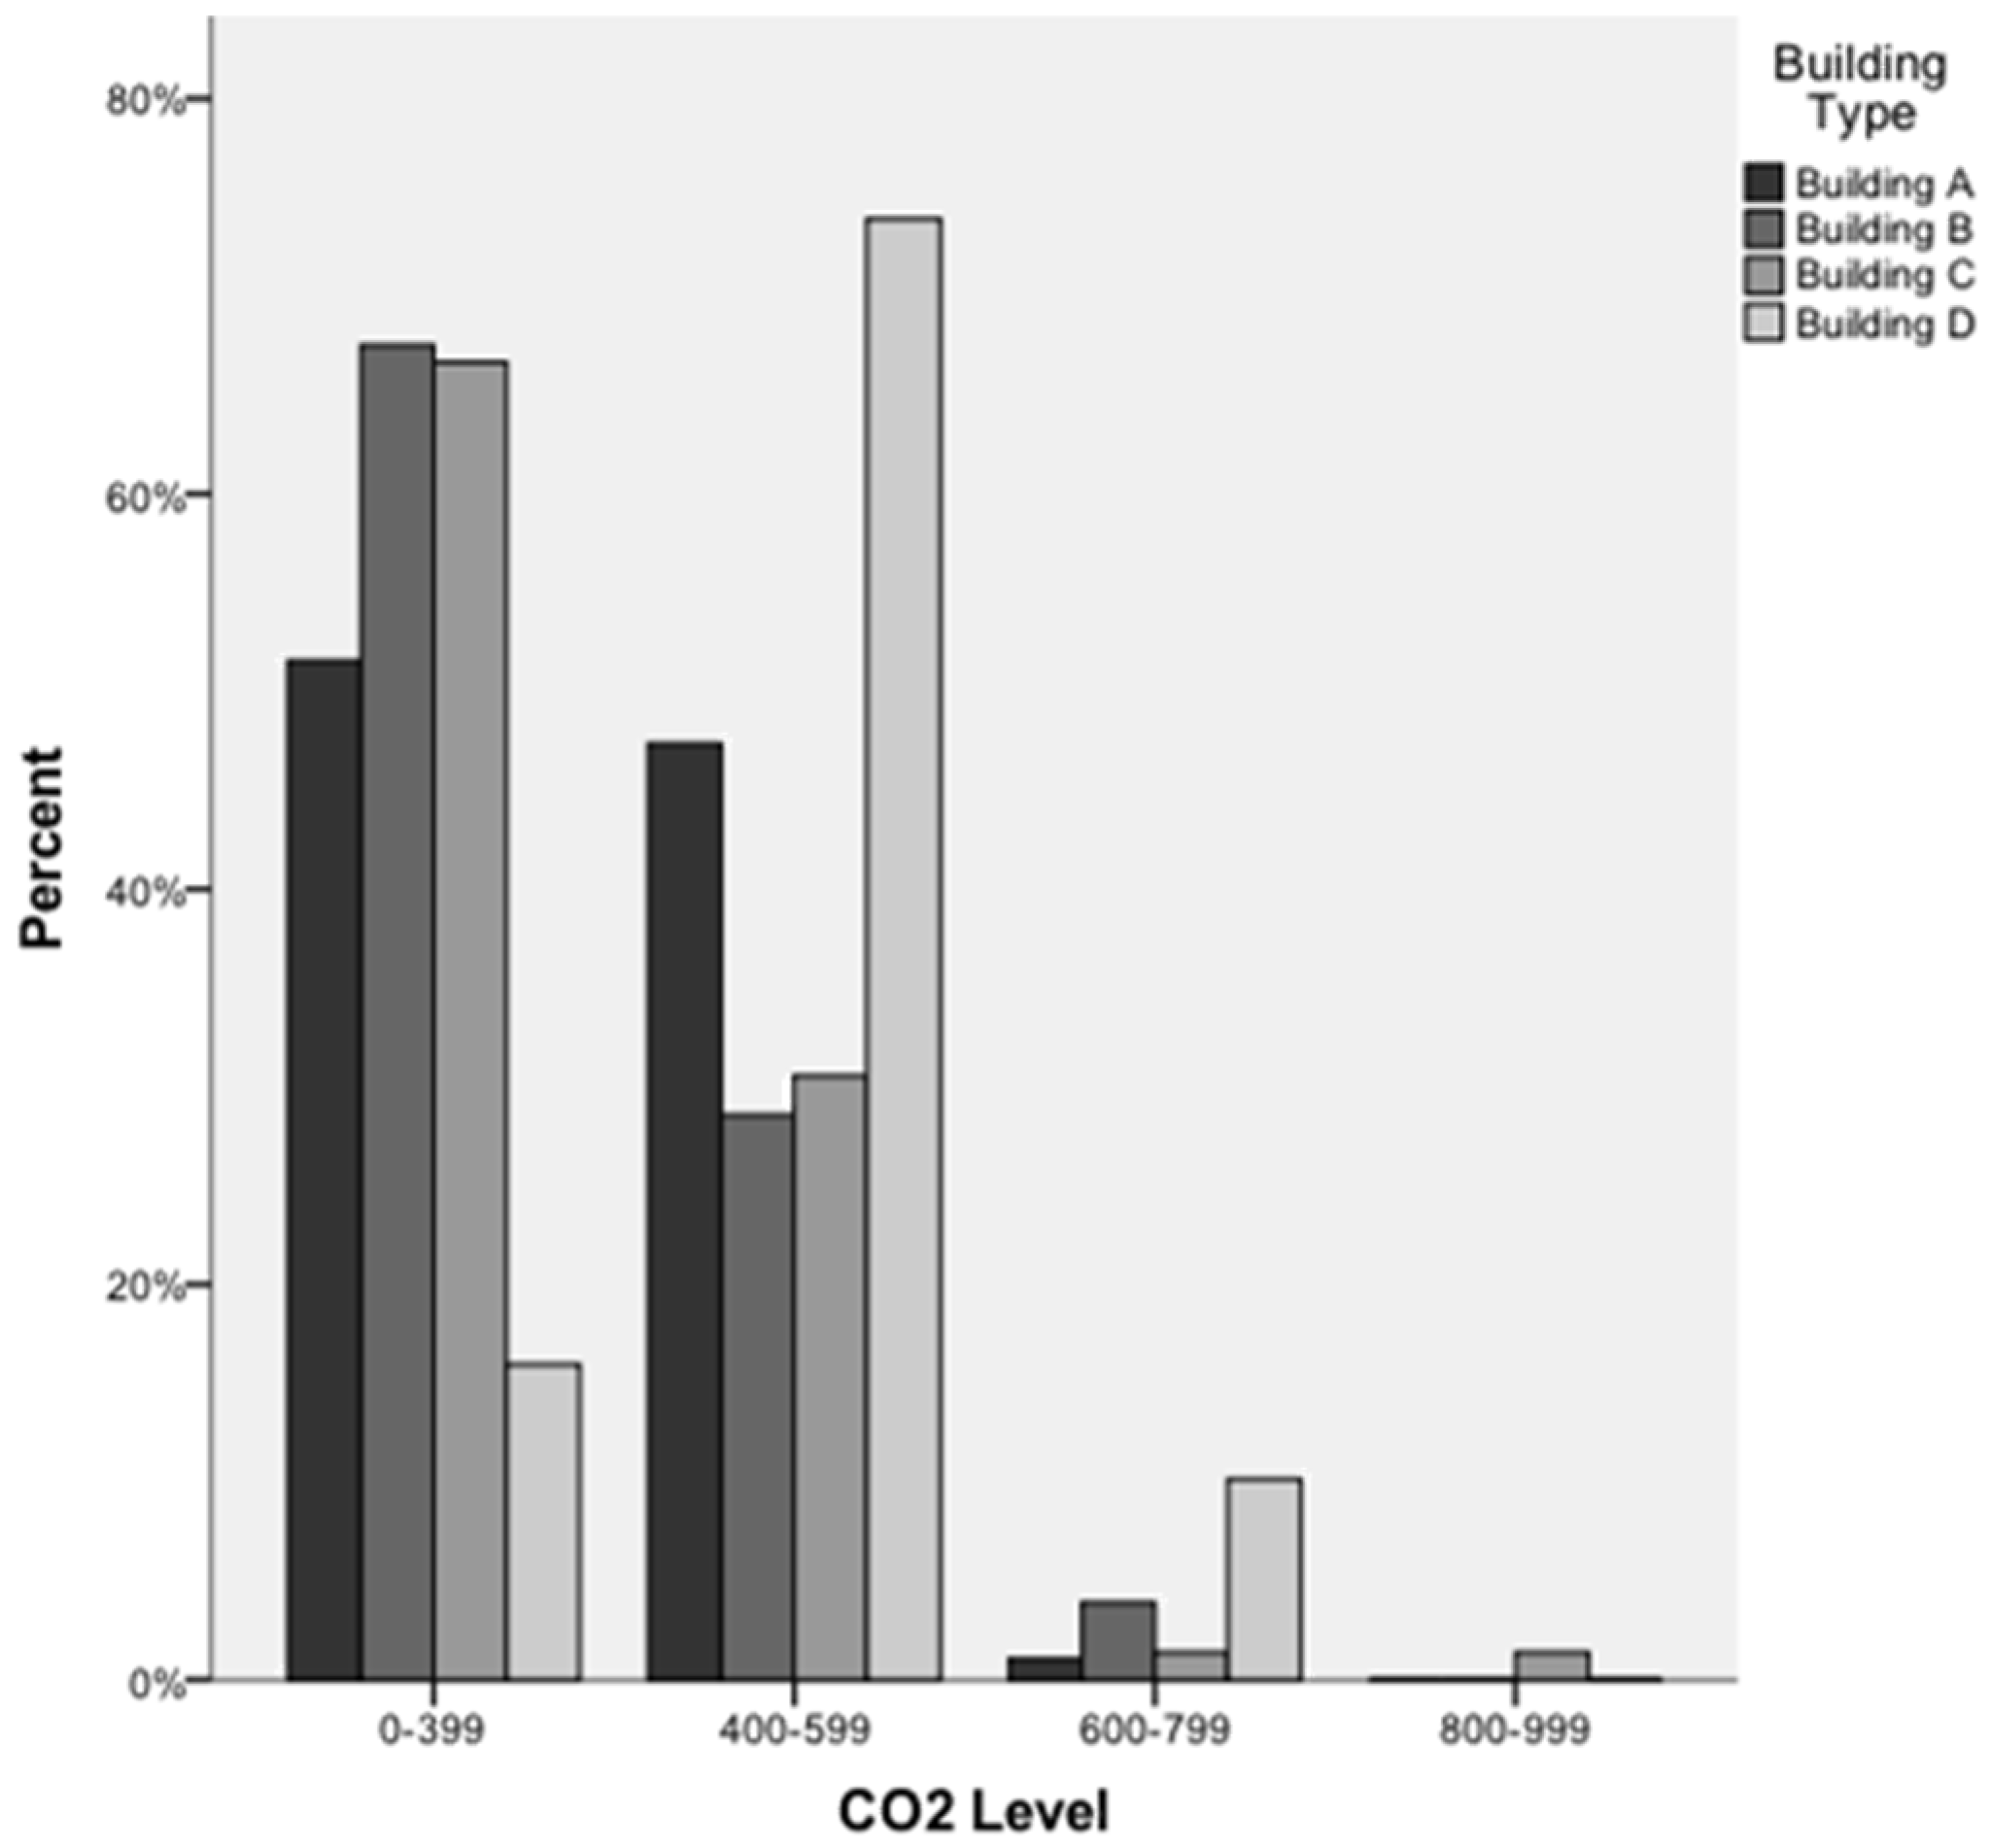
The carbon dioxide level of the buildings was measured at each workstation during the working hours and was found to be mainly below 600 ppm and within the acceptable range according to the ASHRAE Handbook 2001 [
37]. The deeper open plan office (Building D) had a higher carbon dioxide level but it was still within the acceptable range compared to the other three buildings, as presented in
Figure 9. Only in Building C, which is a naturally ventilated building, did the concentration of carbon dioxide exceed 800 ppm. According to Tietjen
et al. (2012), this may cause eye and upper respiratory symptoms [
9]. In all four buildings, printers were located in semi-closed copy rooms and outdoor pollution was within the acceptable range in all four locations. No odor was detected or reported in any of the buildings. Further analysis of the relationship between ventilation and building-related symptoms is presented in analysis section.
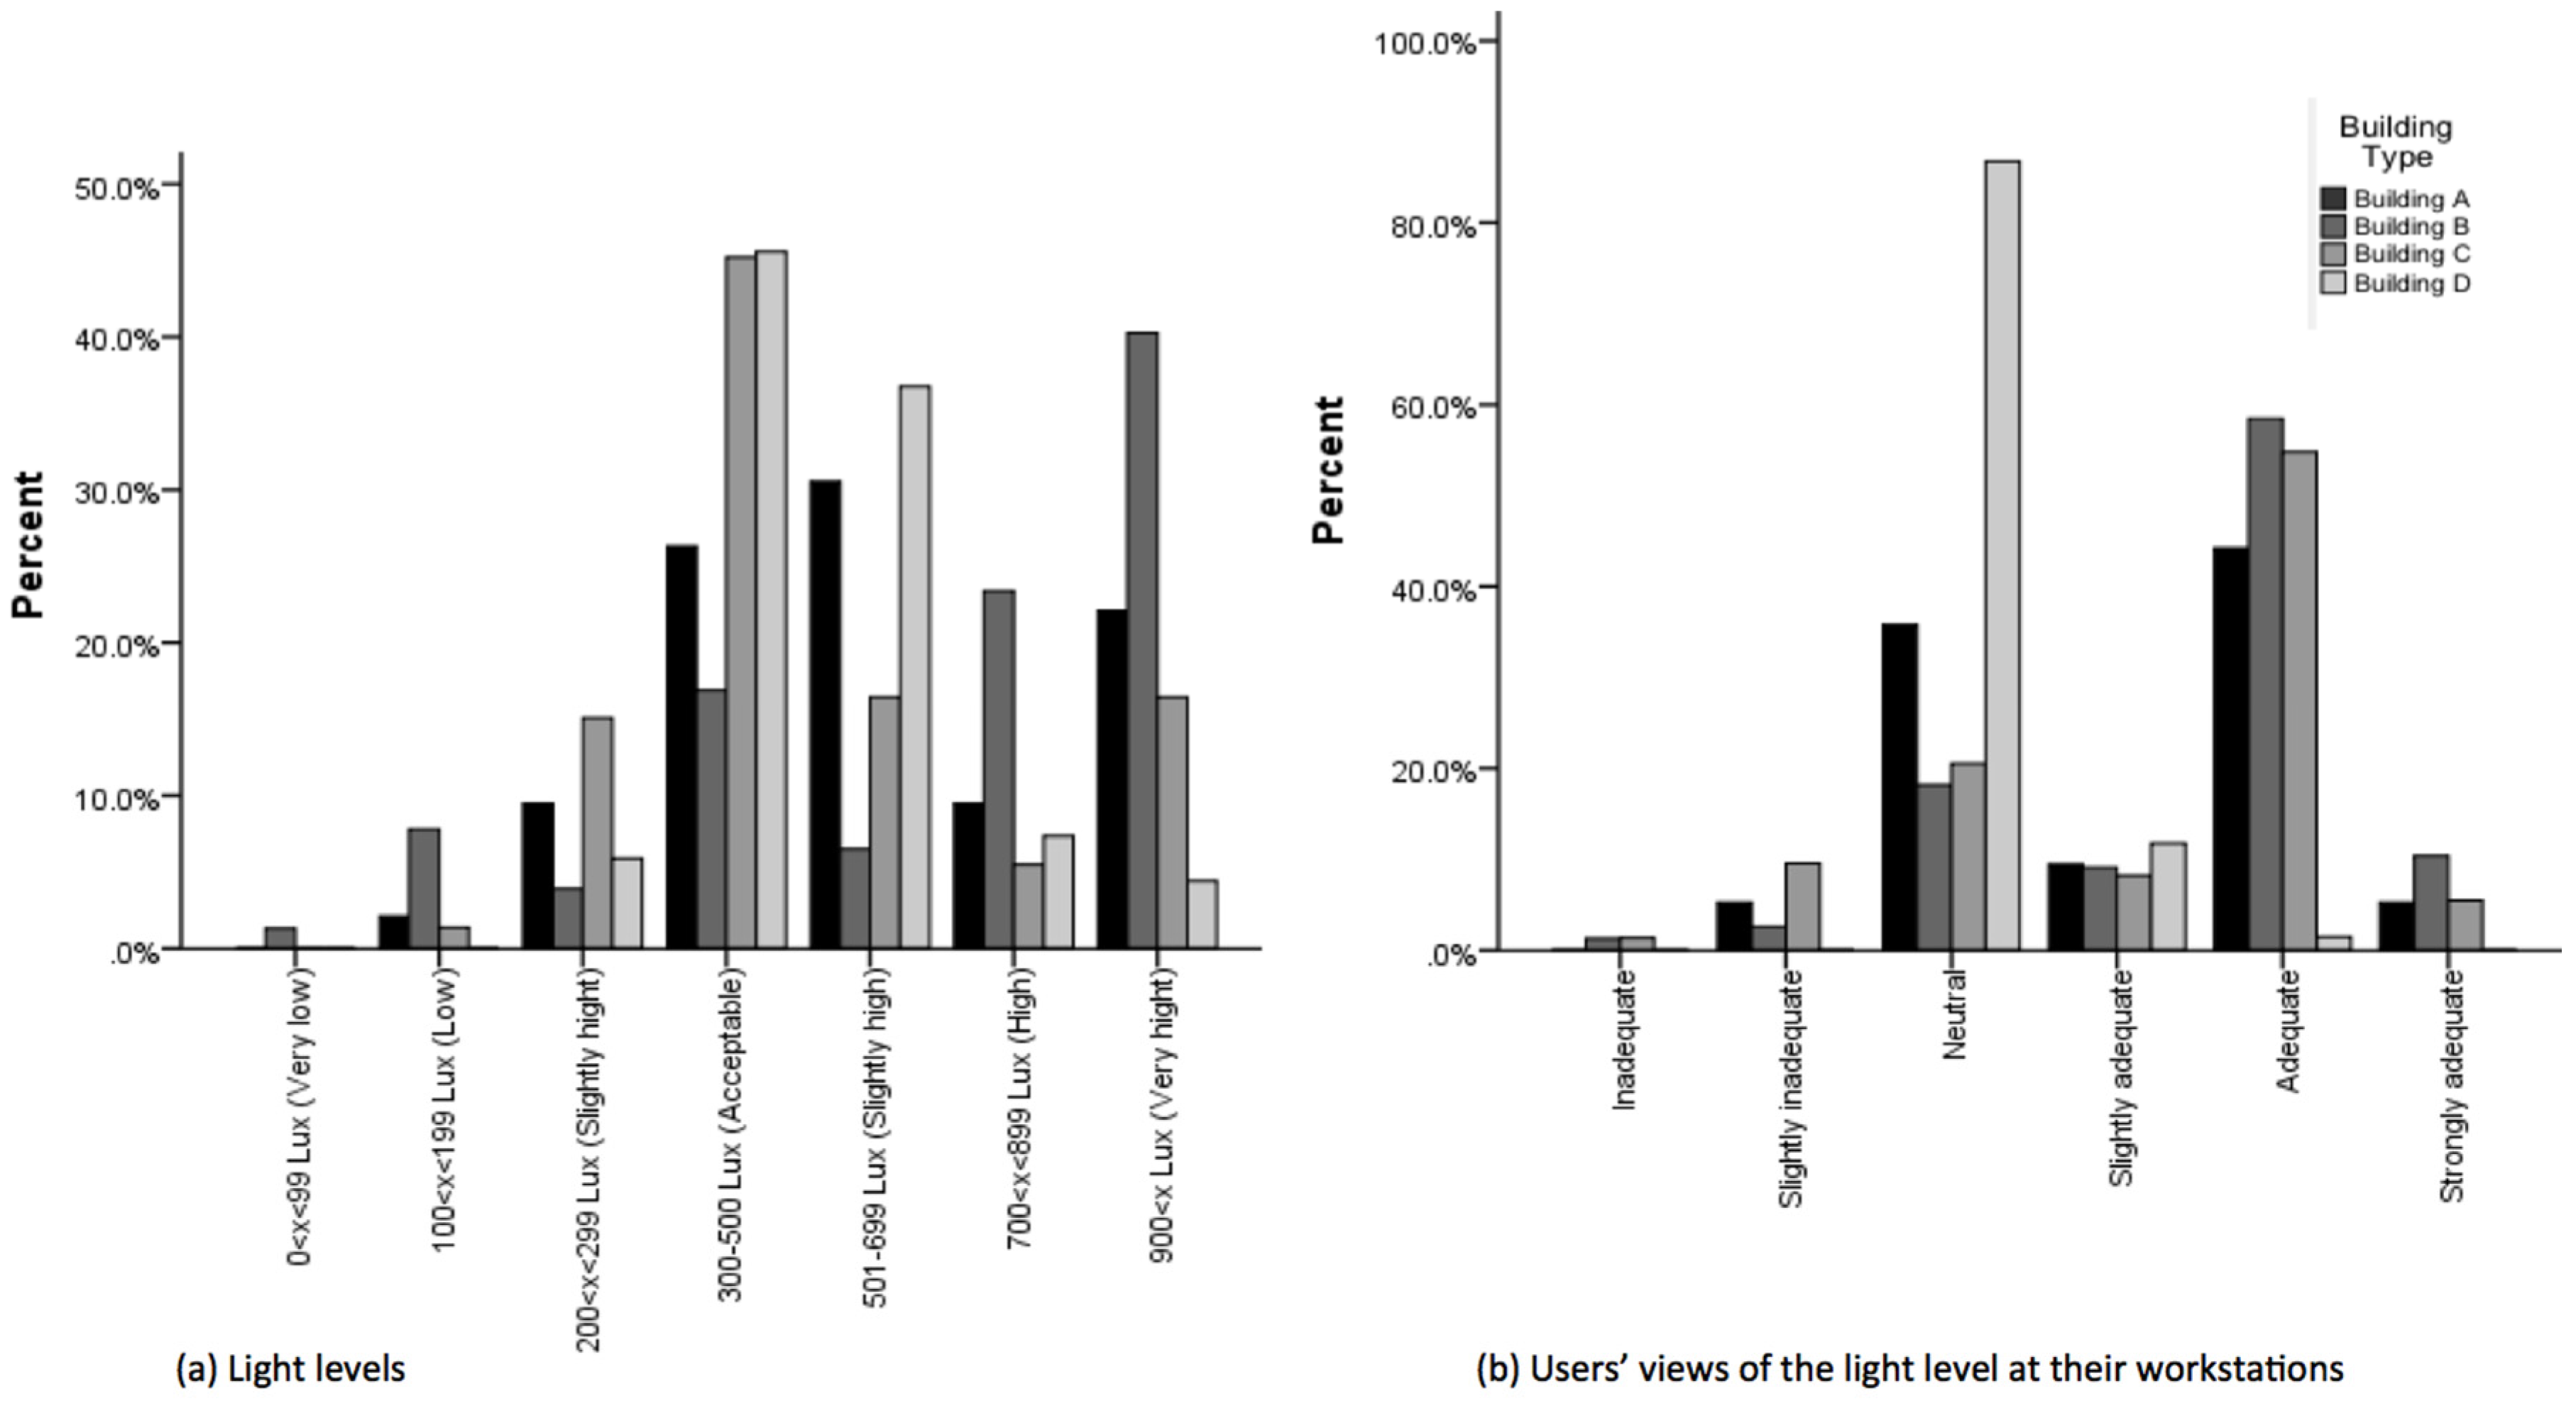
The acceptable light level for the workplace is considered to be 300 to 500 Lux [
38]. The light level was recorded at each workstation during the working hours and analyzed, showing more consistent lighting in the open plan offices compared to the cellular offices, as illustrated in
Figure 10a. This was mainly due to the use of artificial lighting in the open plan offices,
versus the changing of the natural light, which was the main source of lighting in the cellular offices. External and internal blinds were provided for these occupants to control the natural light. As presented in
Figure 10b, the survey questionnaire showed high levels of user satisfaction with the light level in the cellular offices compared to the open plan offices, particularly building D, which was a deep open plan office with mainly artificial lighting and no light switches. Further analysis of lighting and building-related symptoms is presented in analysis section.
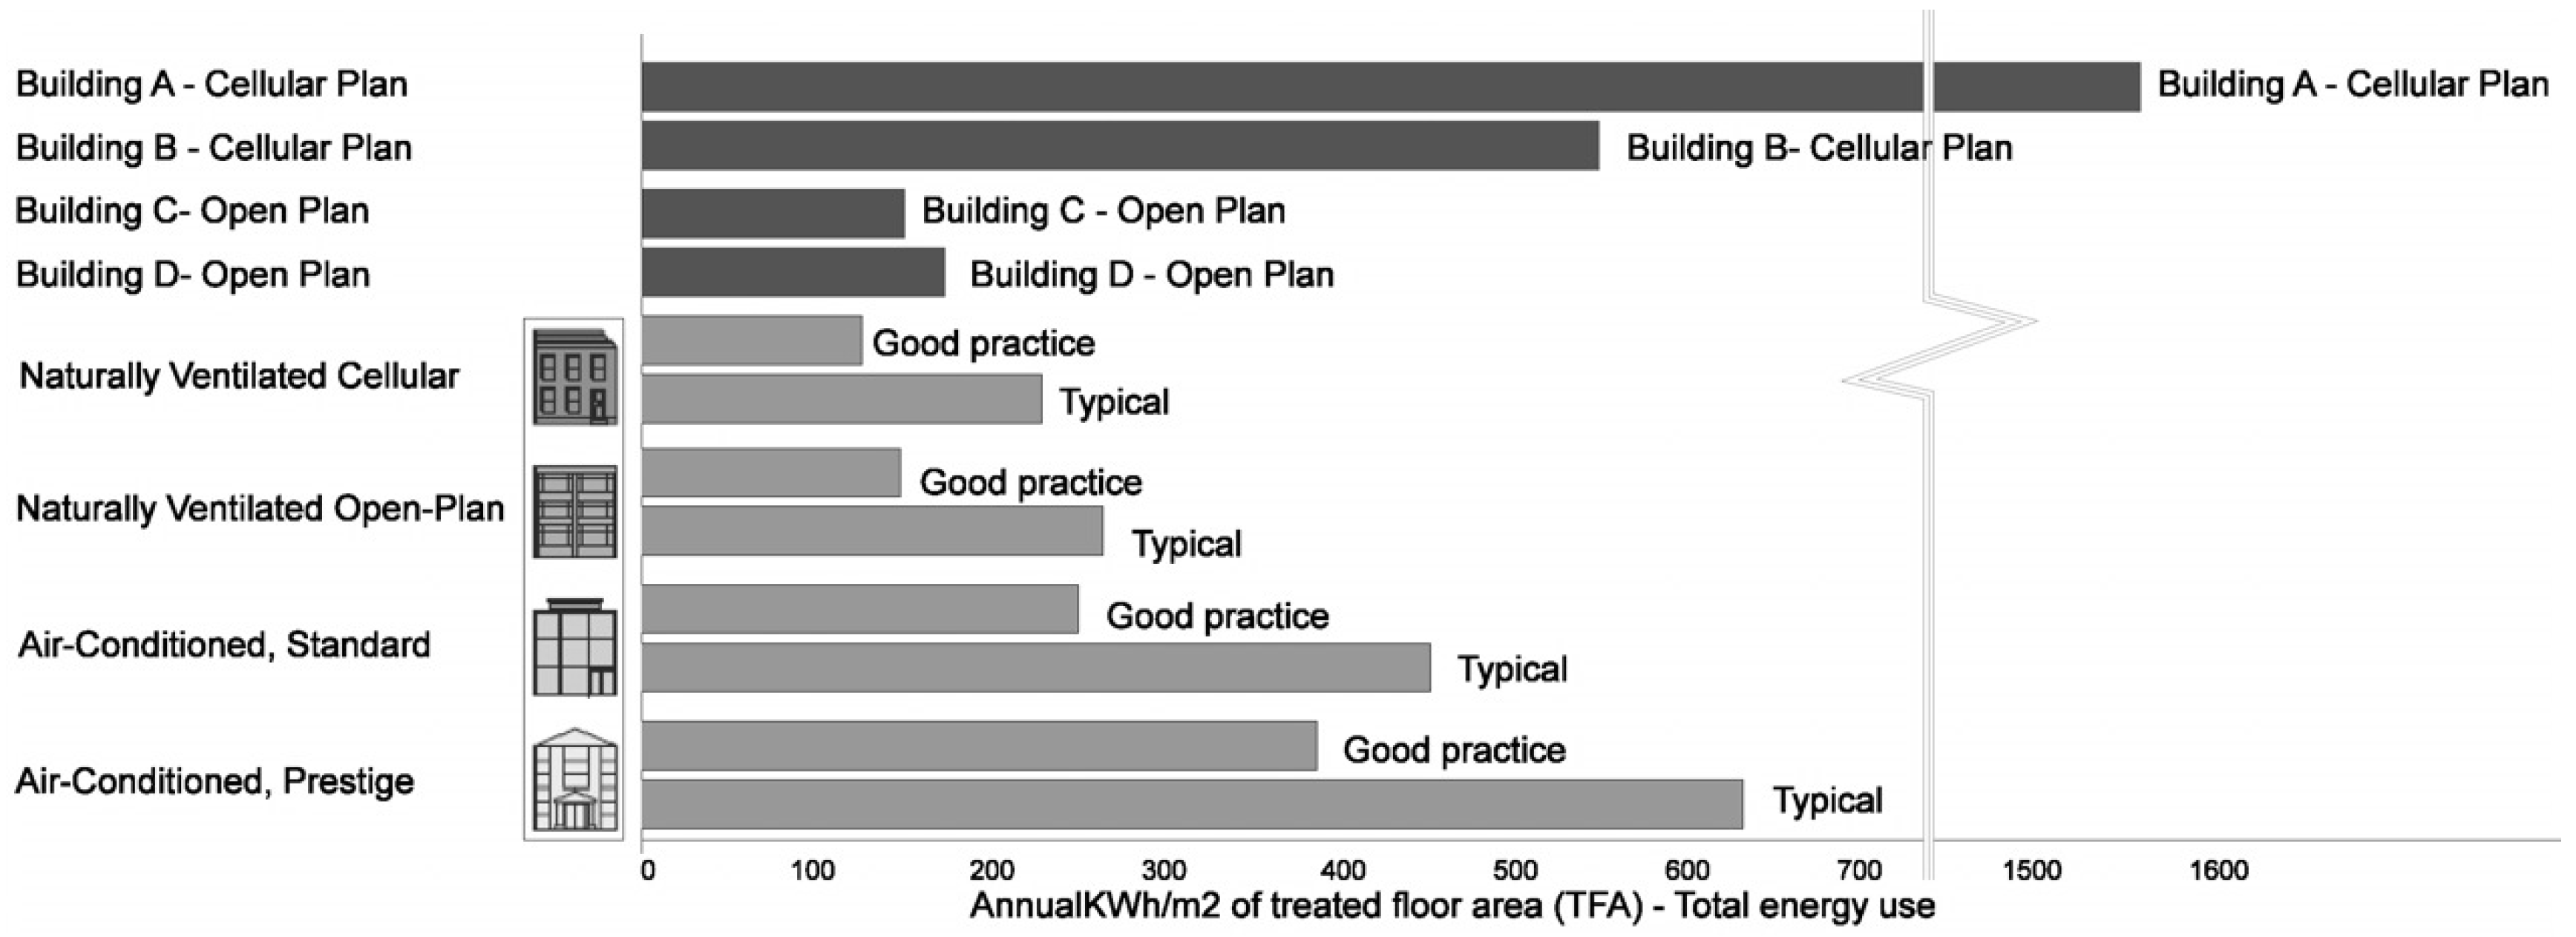
The energy bills, which were provided by the management of the buildings, were analyzed. The energy consumption analysis showed that except for one of the Norwegian cellular plan offices, all the other buildings are within the acceptable range of the CIBSE benchmark [
39], as presented in
Figure 11. Building A in particular had a much higher energy consumption that exceeds the limit (1550 Kwh/m
2 per year). This was mainly due to the application of contradictory thermal systems to provide occupants with thermal control and comfort, as explained earlier. Building C was the most energy-efficient case study, due to the natural ventilation. Overall, the British open plan offices are much more energy efficient (150 and 160 Kwh/m
2 per year) compared to the Norwegian cellular plan offices (1550 and 550 Kwh/m
2 per year). Although the major part of the energy was consumed during the cold season, there was still a clear gap between the energy consumption of the Norwegian and British practices in summer. This suggests that providing individual thermal control comes at a price.
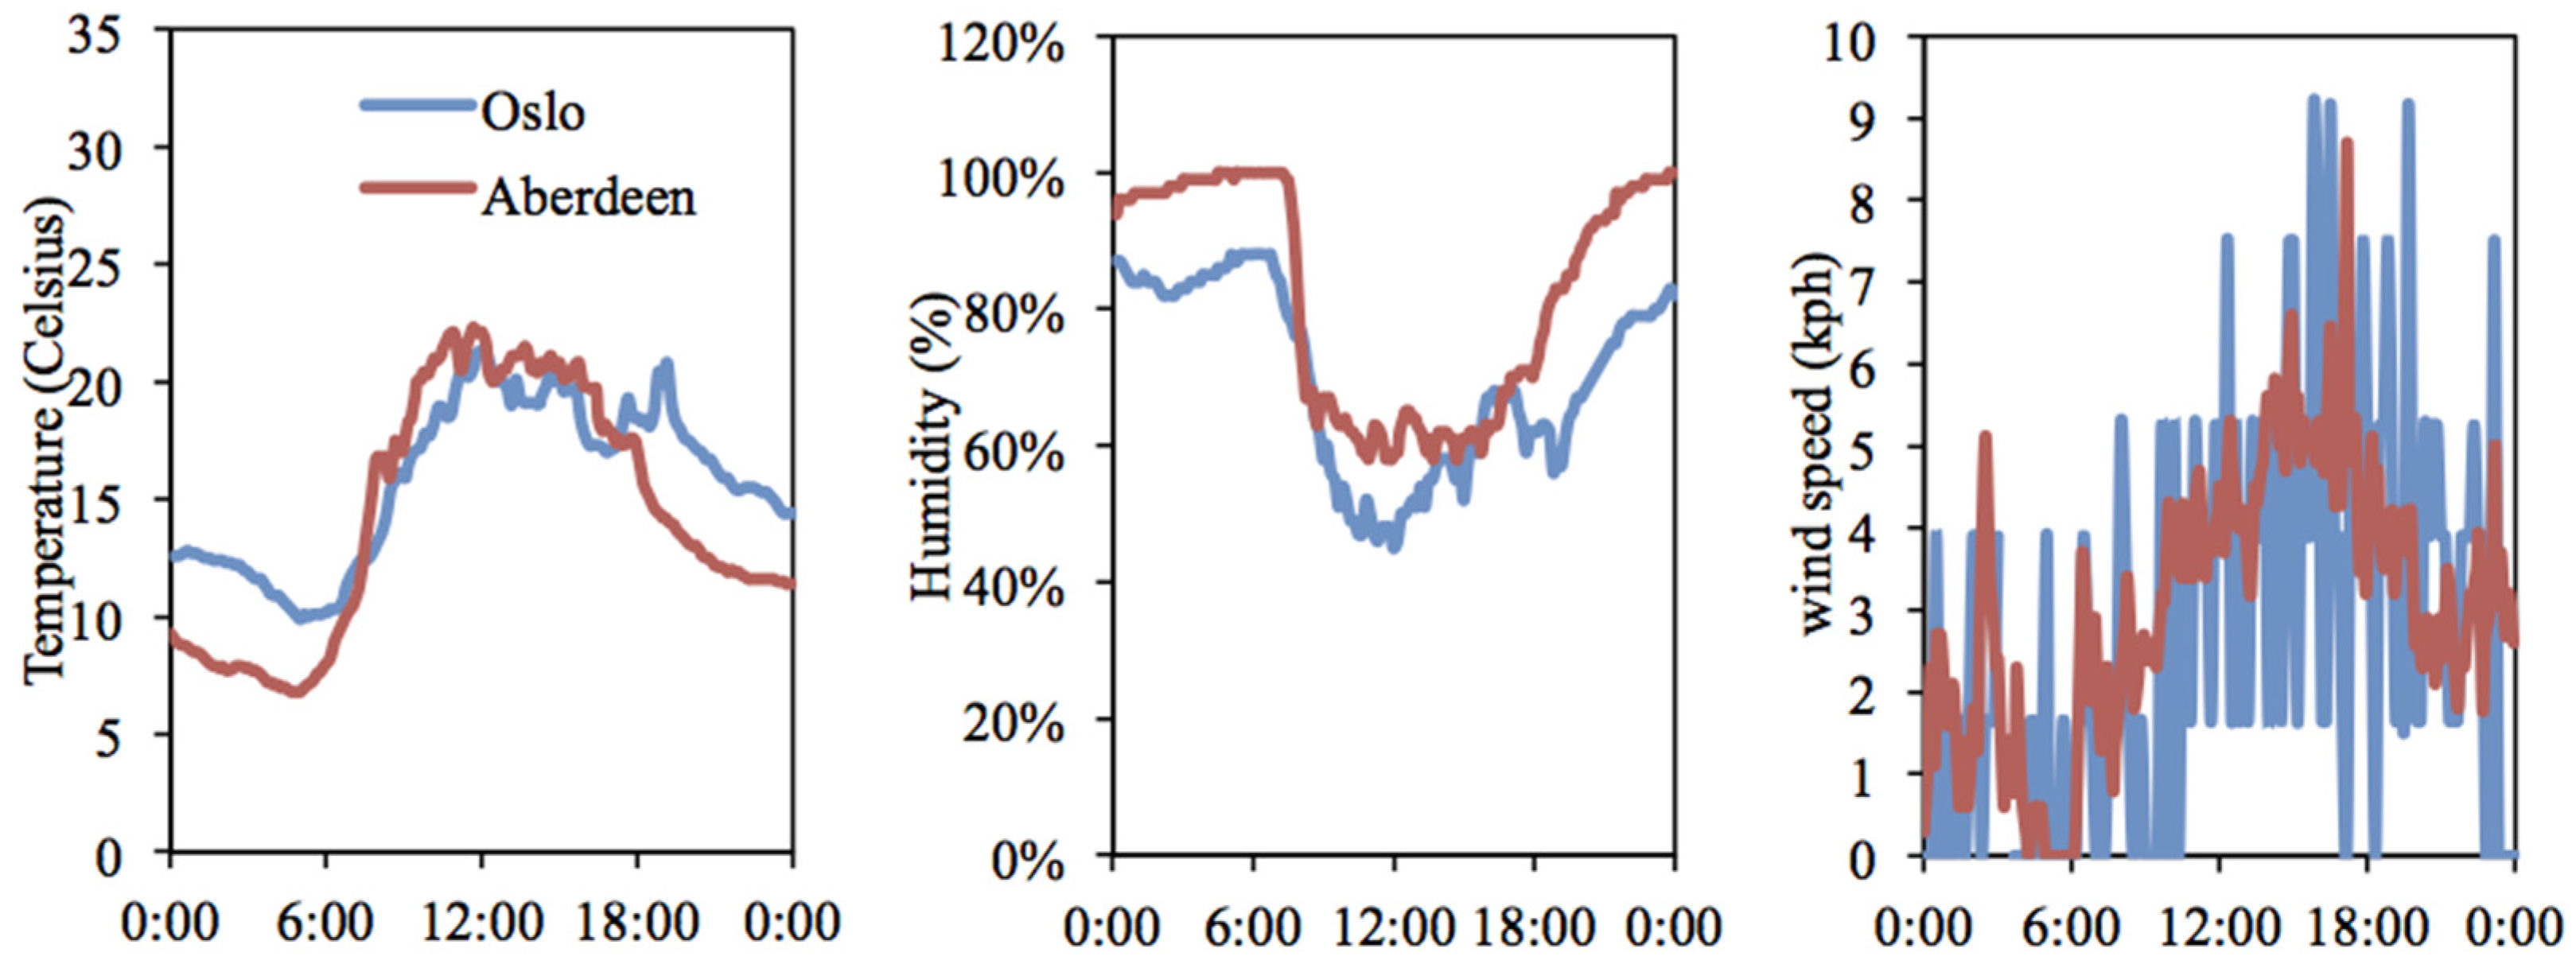
The energy consumption of the British office during the month of July 2012 (when the fieldwork took place) was 13.52 KWh/m
2, while that of the Norwegian office during June 2012 (when the fieldwork took place) was 59.17 KWh/m
2. Accordingly, the energy consumption of each British occupant was 47.32 KWh and that of each Norwegian occupant was 590.17 KWh. As mentioned above, in summer the weather conditions of the south of Norway and the north of Scotland were relatively similar, as illustrated in
Figure 12. Therefore, the difference in the energy consumption was less likely related to climate differences in the summer.
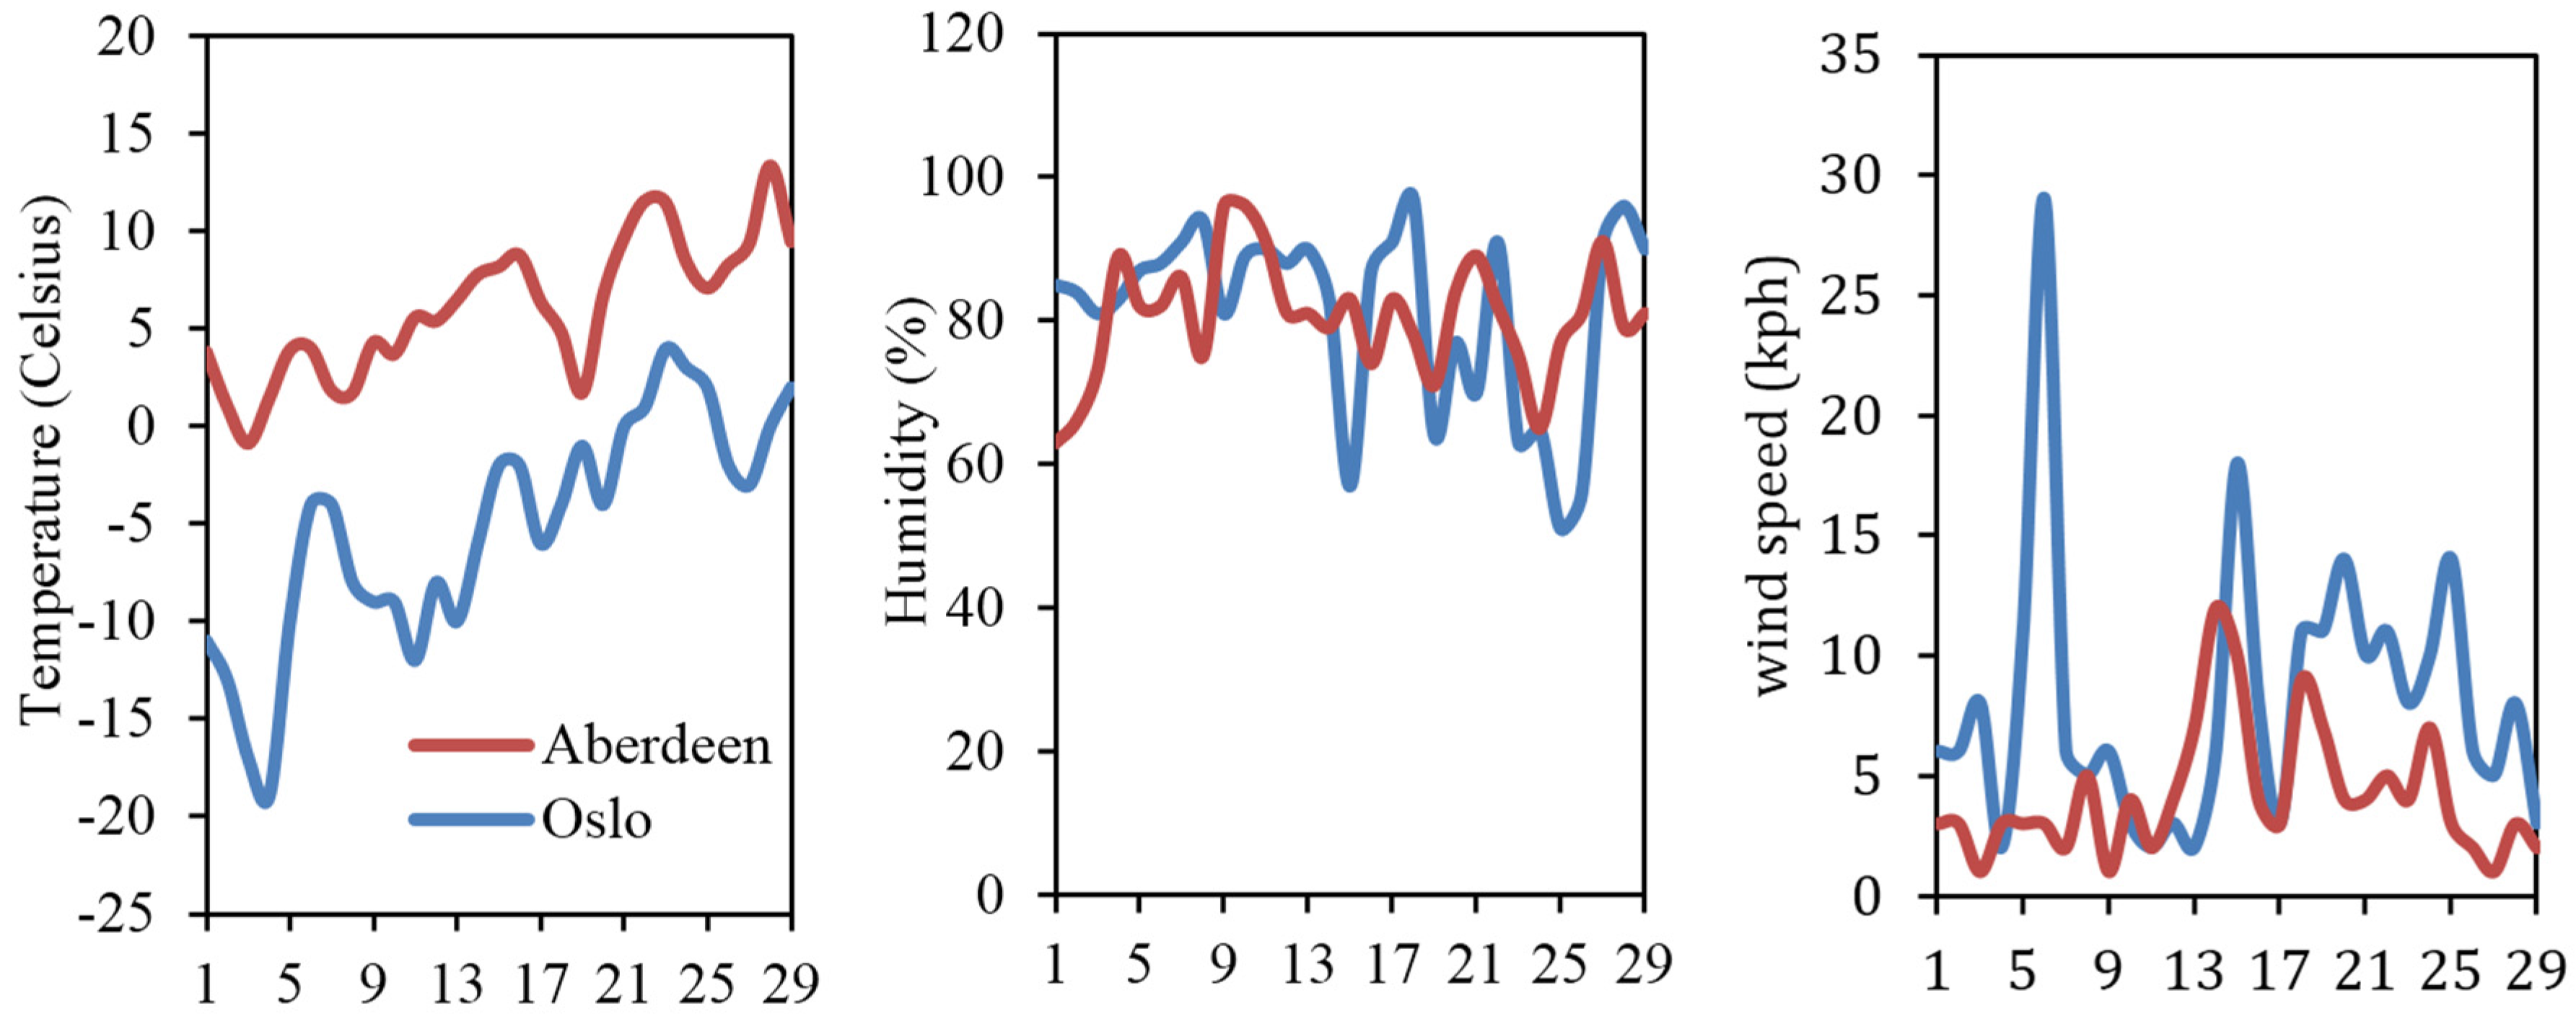
Additional energy analysis during February 2012 showed 12.54 KWh/m
2 energy use in the British workplace and 65.98 KWh/m
2 in the Norwegian office. February was selected for the energy consumption comparison to avoid the impact of seasonal holidays on occupancy and accordingly the energy consumption. The latter was found to be five times higher in the Norwegian building compared to the British office. Further analysis showed that the energy consumption of each British occupant was 43.89 KWh and that of each Norwegian occupant was 659.8 KWh during February 2012. Overall, each Norwegian occupant used 15 times more energy than a British occupant. As illustrated in
Figure 13, the difference in outdoor temperatures of the two regions during the wintertime was the main contributing factor in the difference between the energy data.
5. SBS Analysis
Quantitative analysis using the SPSS linear regression was applied to examine the relationship between the type of plan (Norwegian and British approaches) and each symptom. The results showed that the
p values were less than 0.05, except for the blocked and runny nose symptom. This indicated a significant relationship between the variables, as shown in
Table 5.
Figure 14,
Figure 15 and
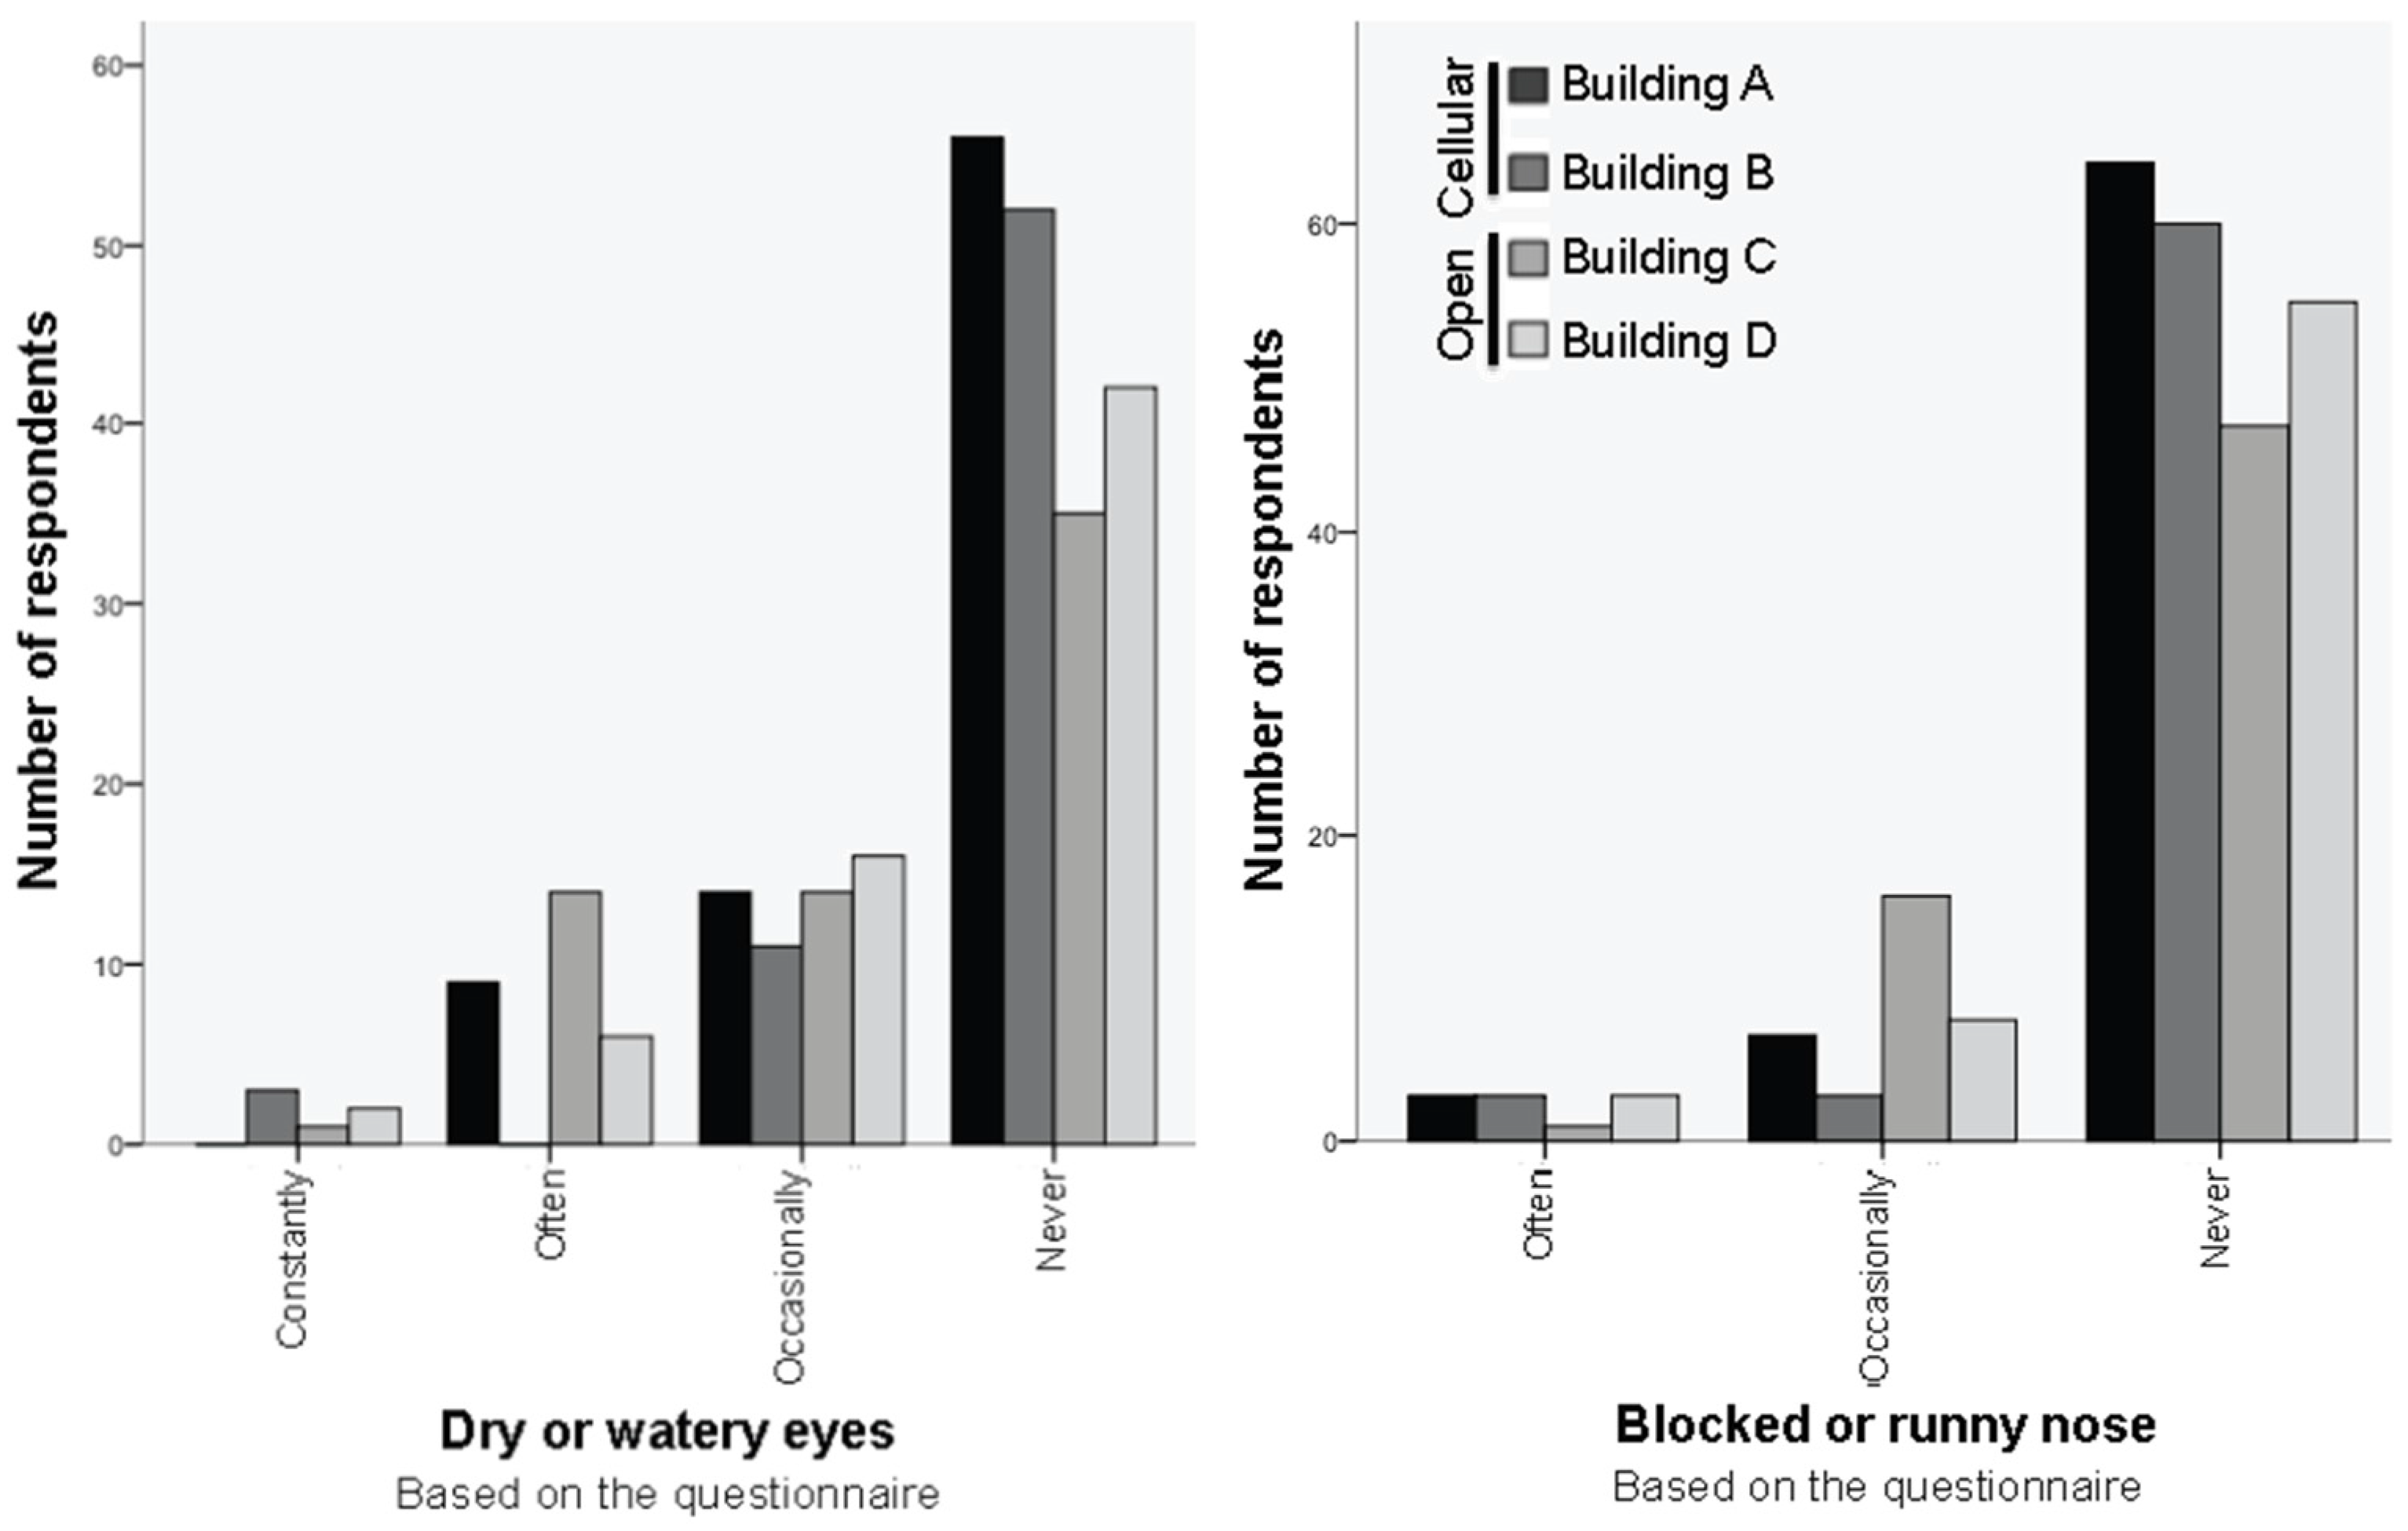
Figure 16 demonstrate the comparison of the symptoms in the British and Norwegian practices. The frequency of eye and nose symptoms was higher in the two open plan offices compared to the two cellular plan offices, as presented in
Figure 14. The majority of the occupants in the cellular offices never suffered from dry or watery eyes. The numbers are lower in the open plan offices. Some occupants suffered constantly from eye symptoms in three of the buildings, while no one reported suffering constantly from nose symptoms. Some occupants in Building B, which was an air-conditioned cellular plan office, reported suffering constantly from eye symptoms. One of the respondents identified the malfunctioning air conditioning in her room as the cause of her symptoms. This is further explained in the interview section. Although more occupants in the cellular offices never suffered from a blocked or runny nose compared to those in the open plan offices, the difference was not as conspicuous. The frequency of nose symptoms was lower than eye symptoms in all four buildings.
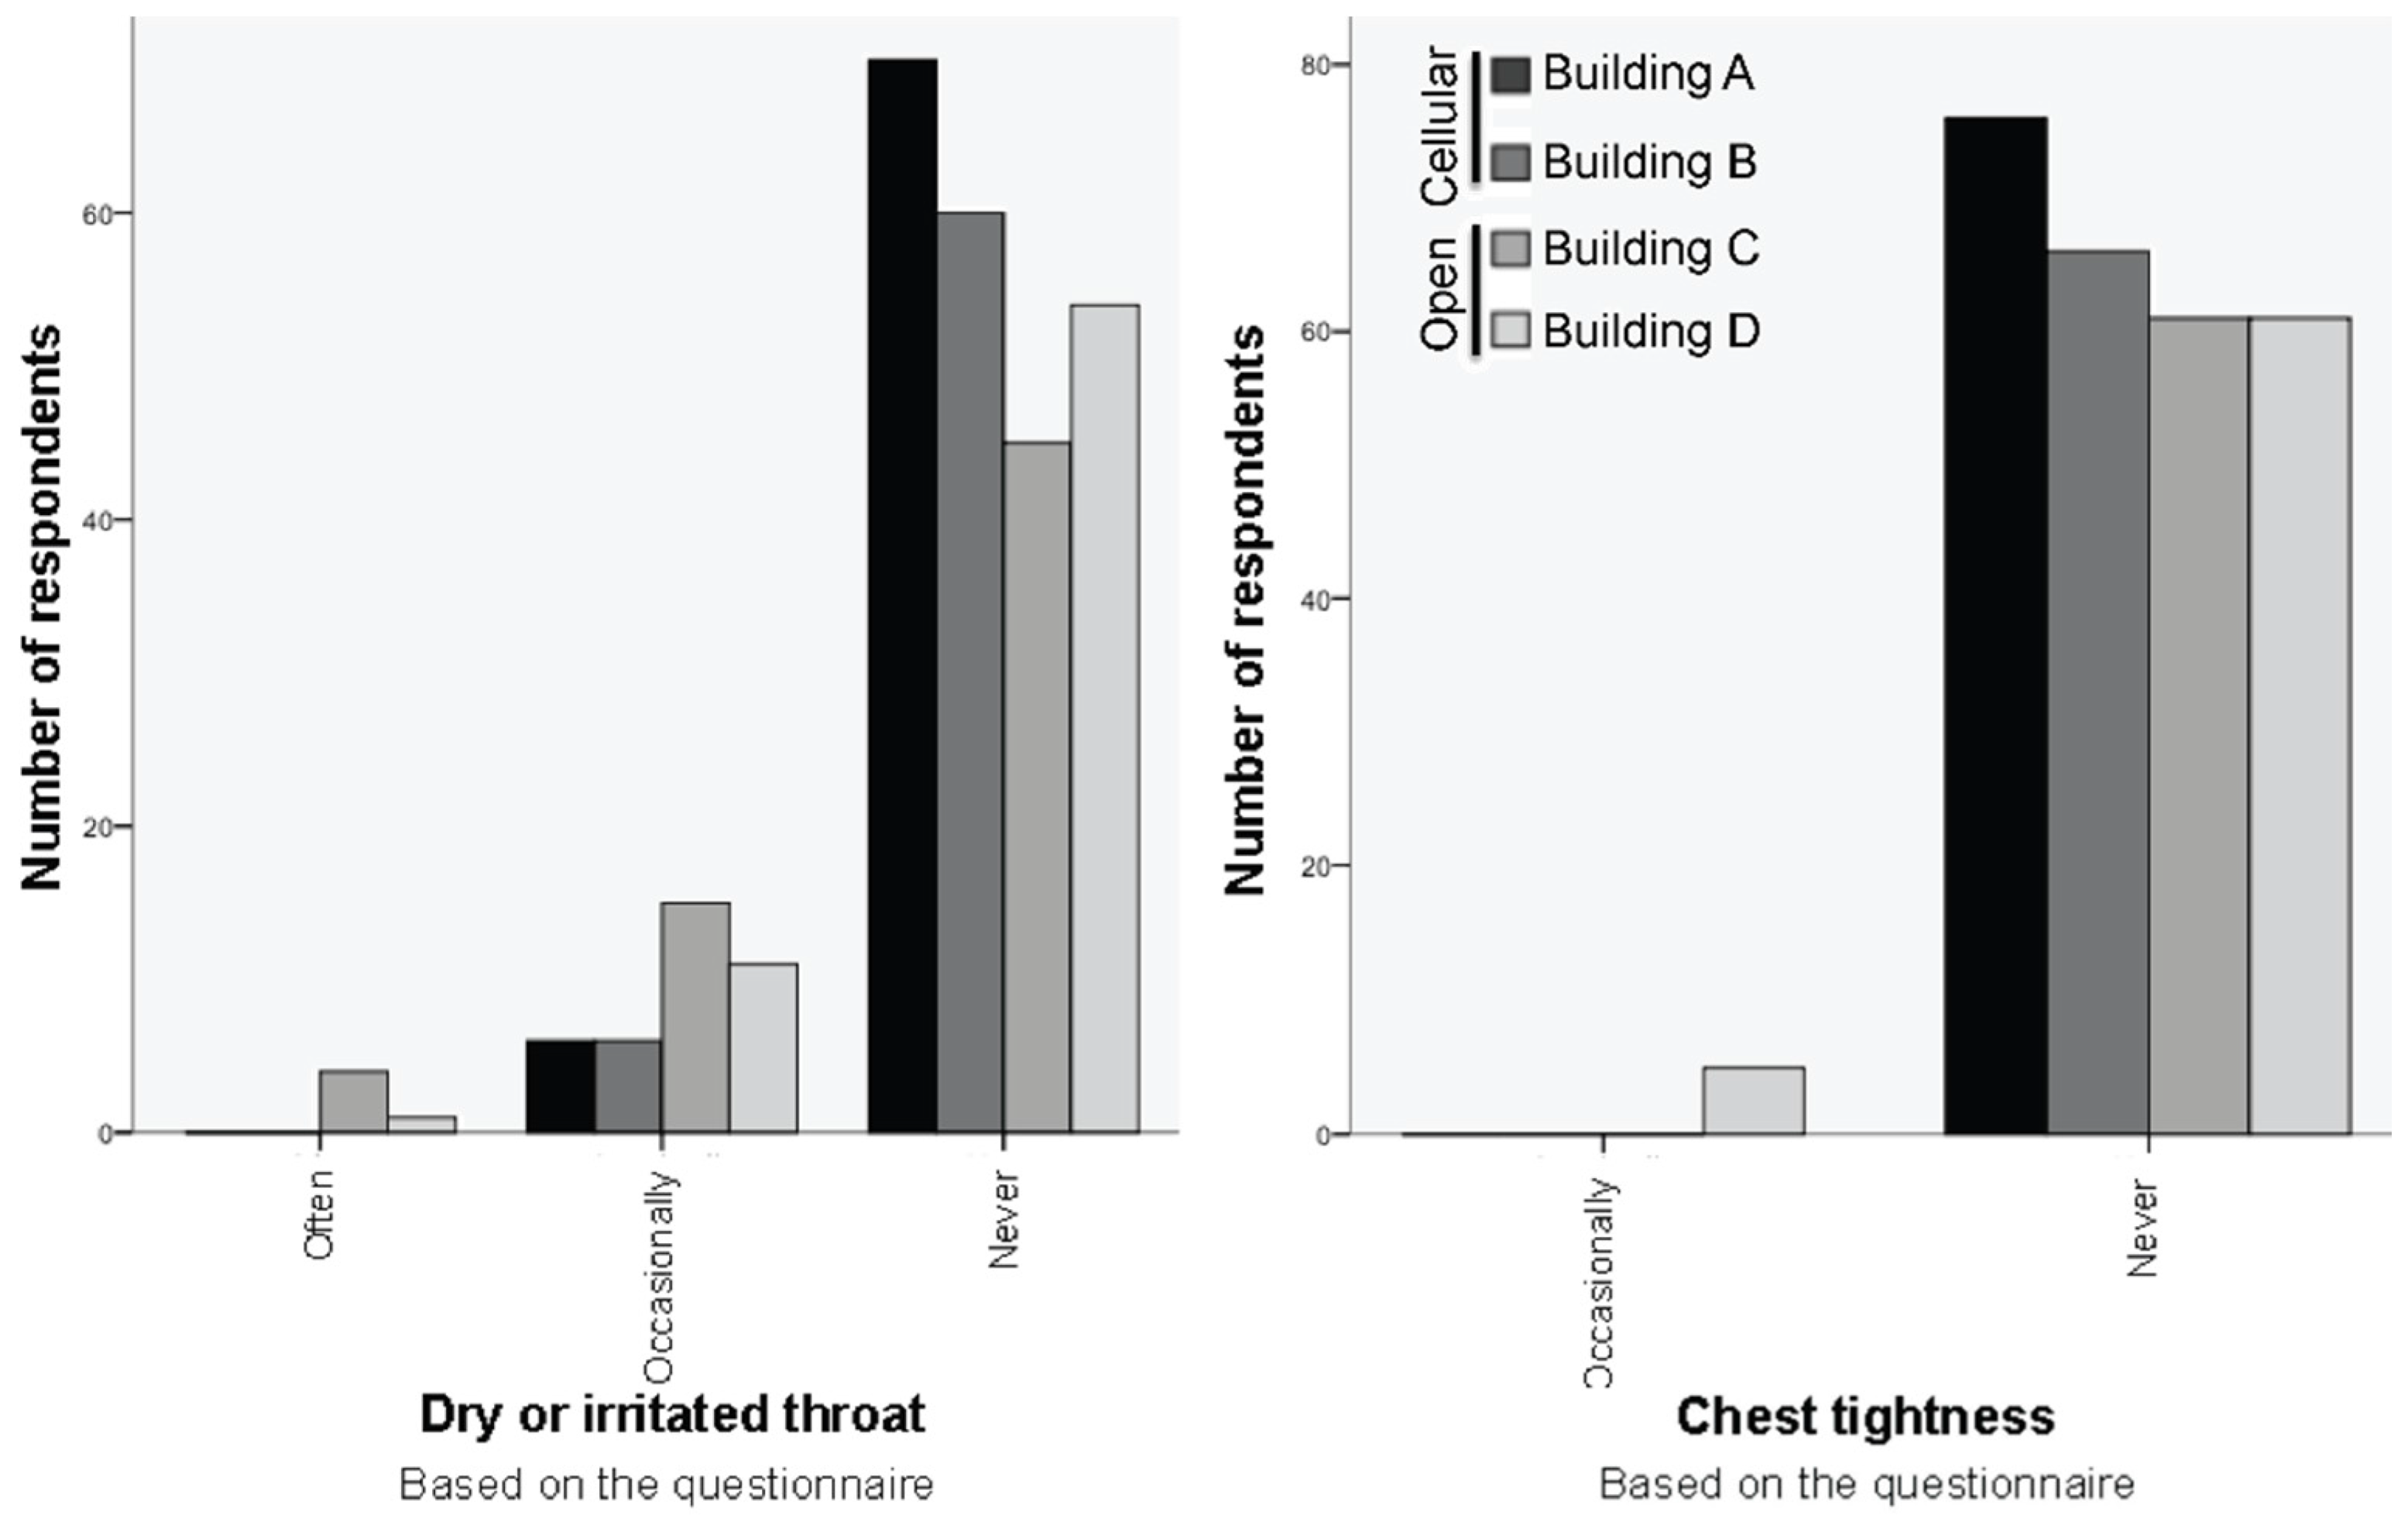
Throat and chest tightness were less frequent compared to other symptoms, as presented in
Figure 6. More occupants suffered from a dry or irritated throat in the open plan compared to the cellular plan offices. The majority of the occupants of the cellular offices never suffered from this symptom and no one reported that they suffered often or constantly. In contrast, fewer respondents reported never suffering from throat symptoms in the open plan offices and some participants often suffered. Chest tightness was the least reported symptom and only a few respondents in the displacement-ventilated open plan office reported that they occasionally suffered from chest tightness.
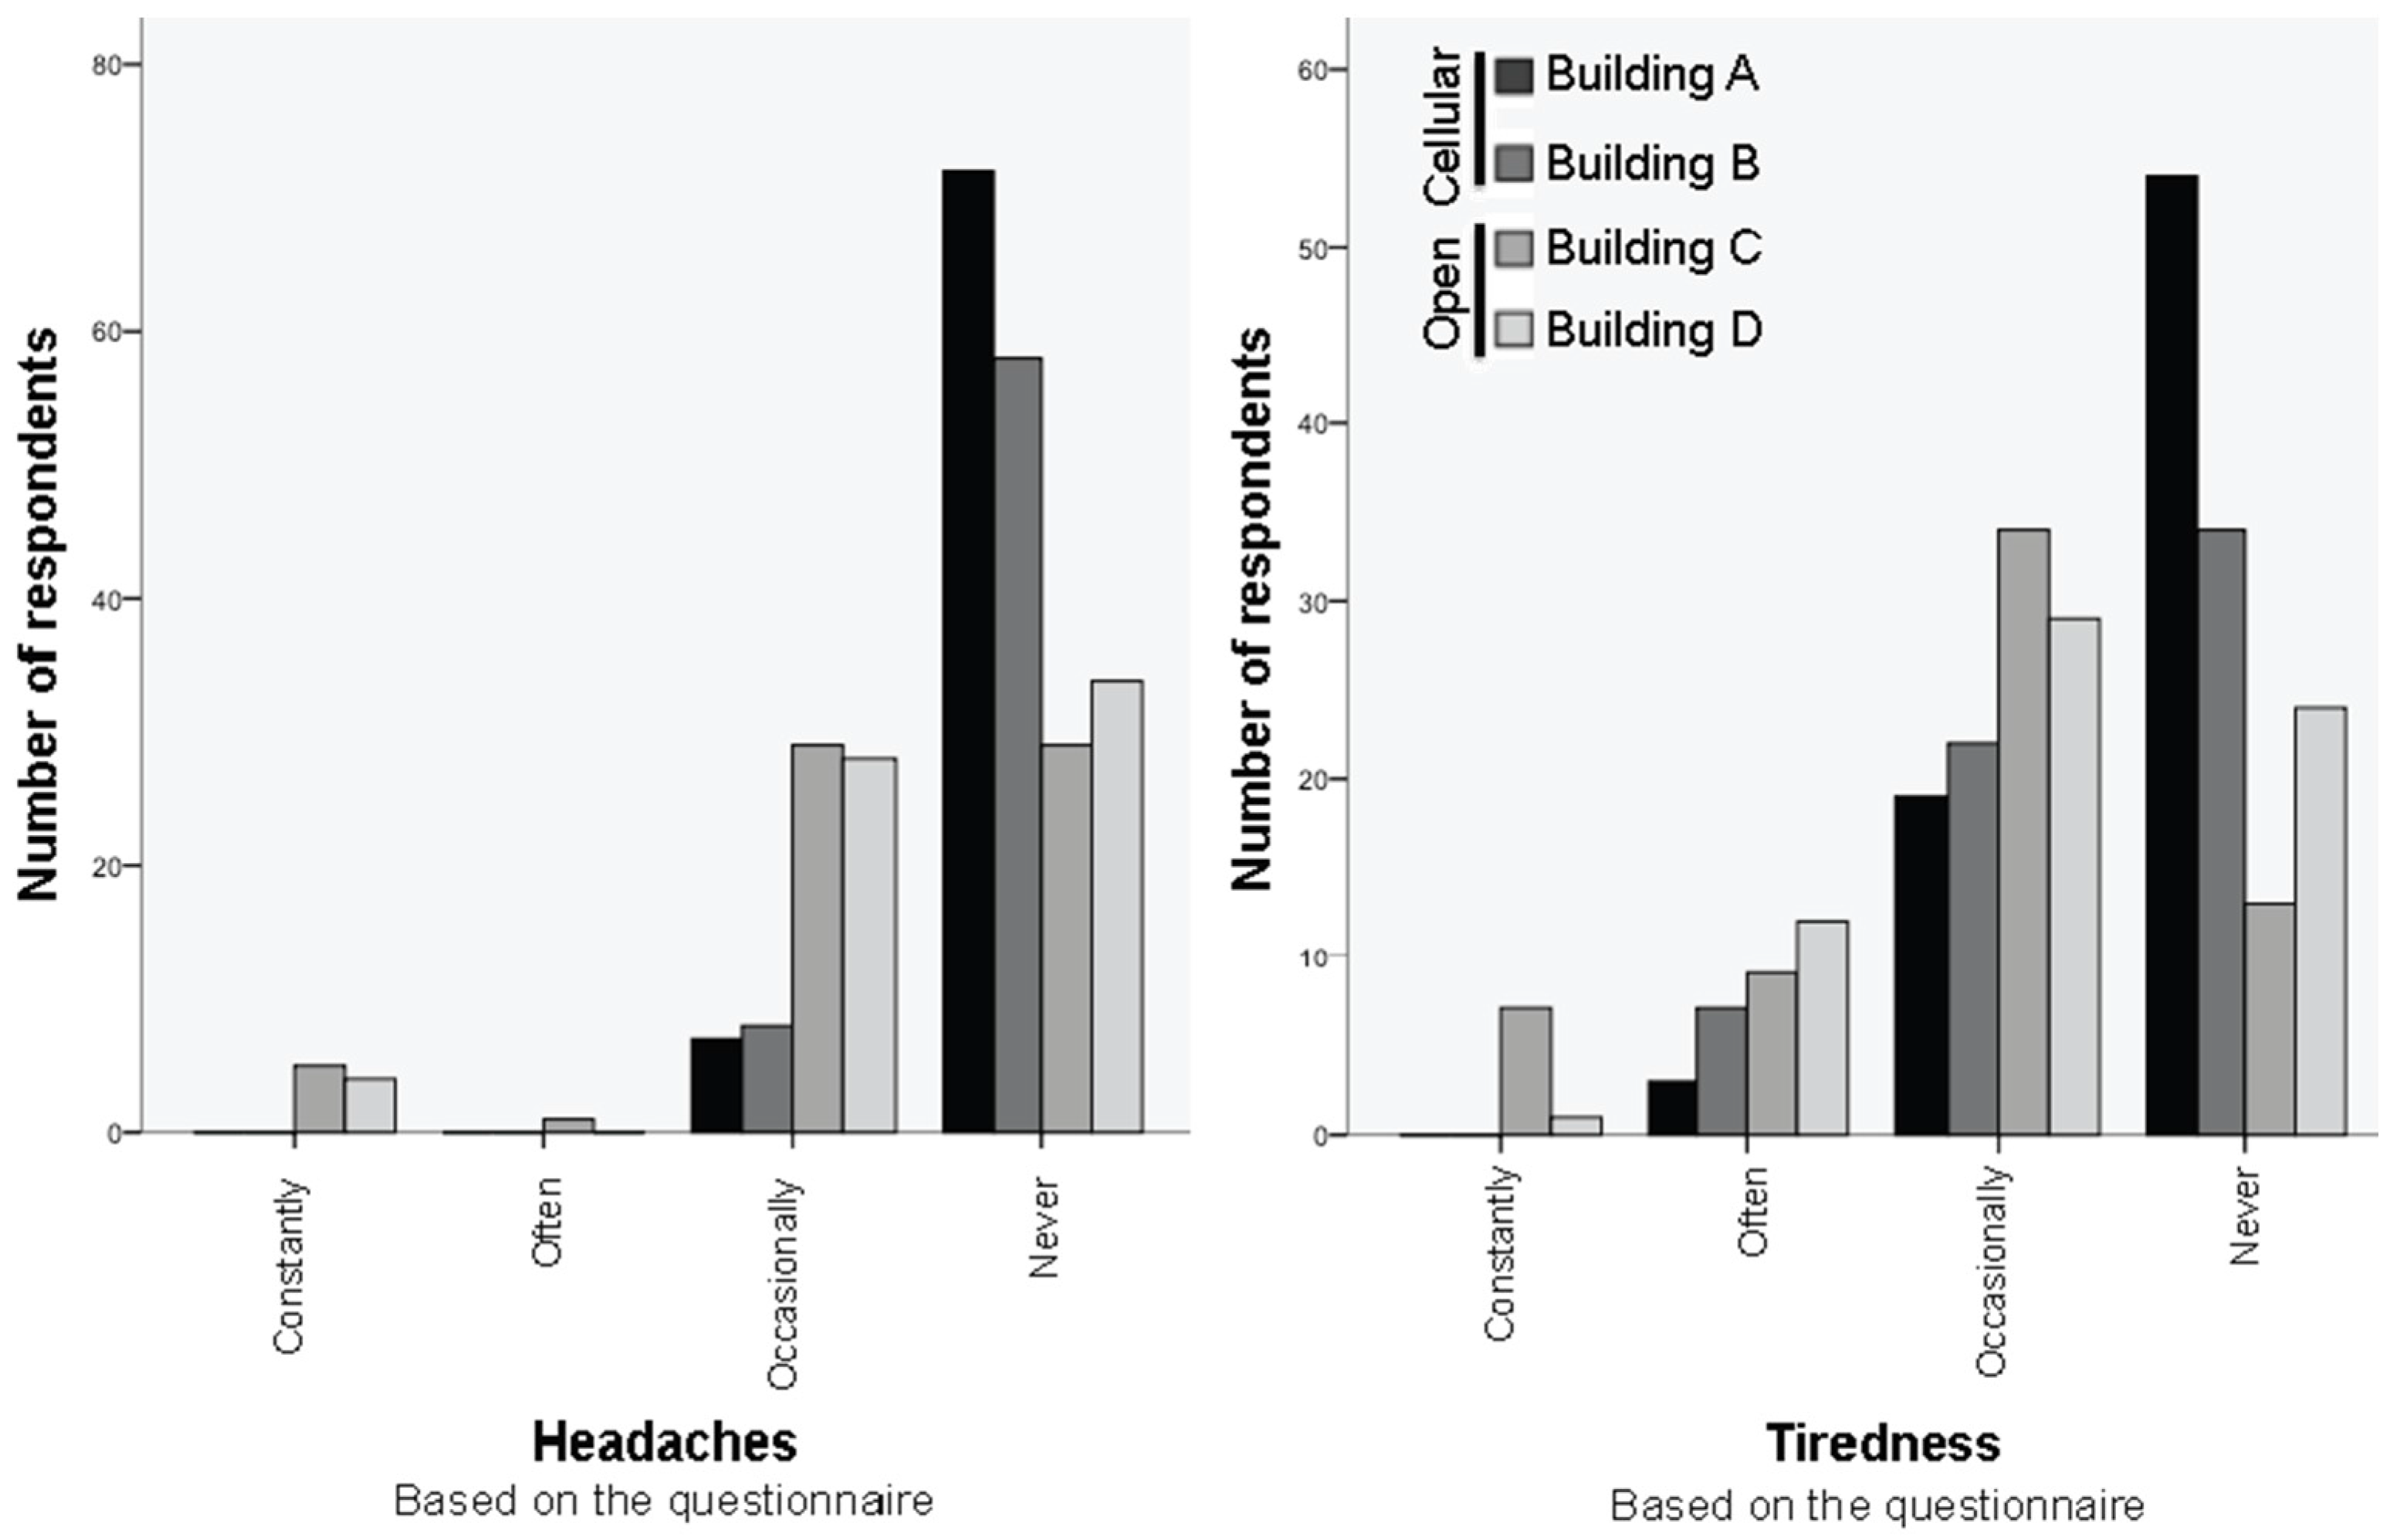
The difference in symptoms between the Norwegian and British approaches was more visible when comparing headaches and tiredness, as presented in
Figure 16. The majority of the occupants of the Norwegian offices reported no headaches or tiredness. In contrast, the majority of the respondents of the British offices suffered from these two symptoms and in some cases it was more intense and some respondents reported that they suffered constantly. Overall, the frequency of each symptom was higher in the two open plan offices compared to the two cellular plan offices.
- ■
90% of the respondents in the two cellular plan offices never suffered from headaches, while the numbers dropped to only 48% in the two open plan offices.
- ■
No participants (0%) in the two cellular plan offices reported constantly suffering from headaches, while 7% of the respondents in the open plan offices reported experiencing constant headaches.
- ■
63% of the respondents in the two cellular plan offices never suffered from tiredness, while the numbers dropped to only 29% in the two open plan offices.
- ■
No participants (0%) in the two cellular plan offices reported constantly suffering from tiredness, while 6% of the respondents in the open plan offices reported experiencing constant headaches.
Regression analysis was applied to examine the relationship between building-related symptoms and environmental control variables, including users’ preference to adjust the temperature, ventilation, air movement, air quality, and light, as presented in
Table 6. In this analysis, all six symptoms were combined on a seven-point scale from very low to very high. The analysis showed a significant relationship between the overall environmental control preference of users and their symptoms. The availability of environmental control systems was in particular highly related to the symptoms. However, no significant relationship was found between the symptoms and users’ preference to adjust the temperature, ventilation, air movement, air quality, or light levels.
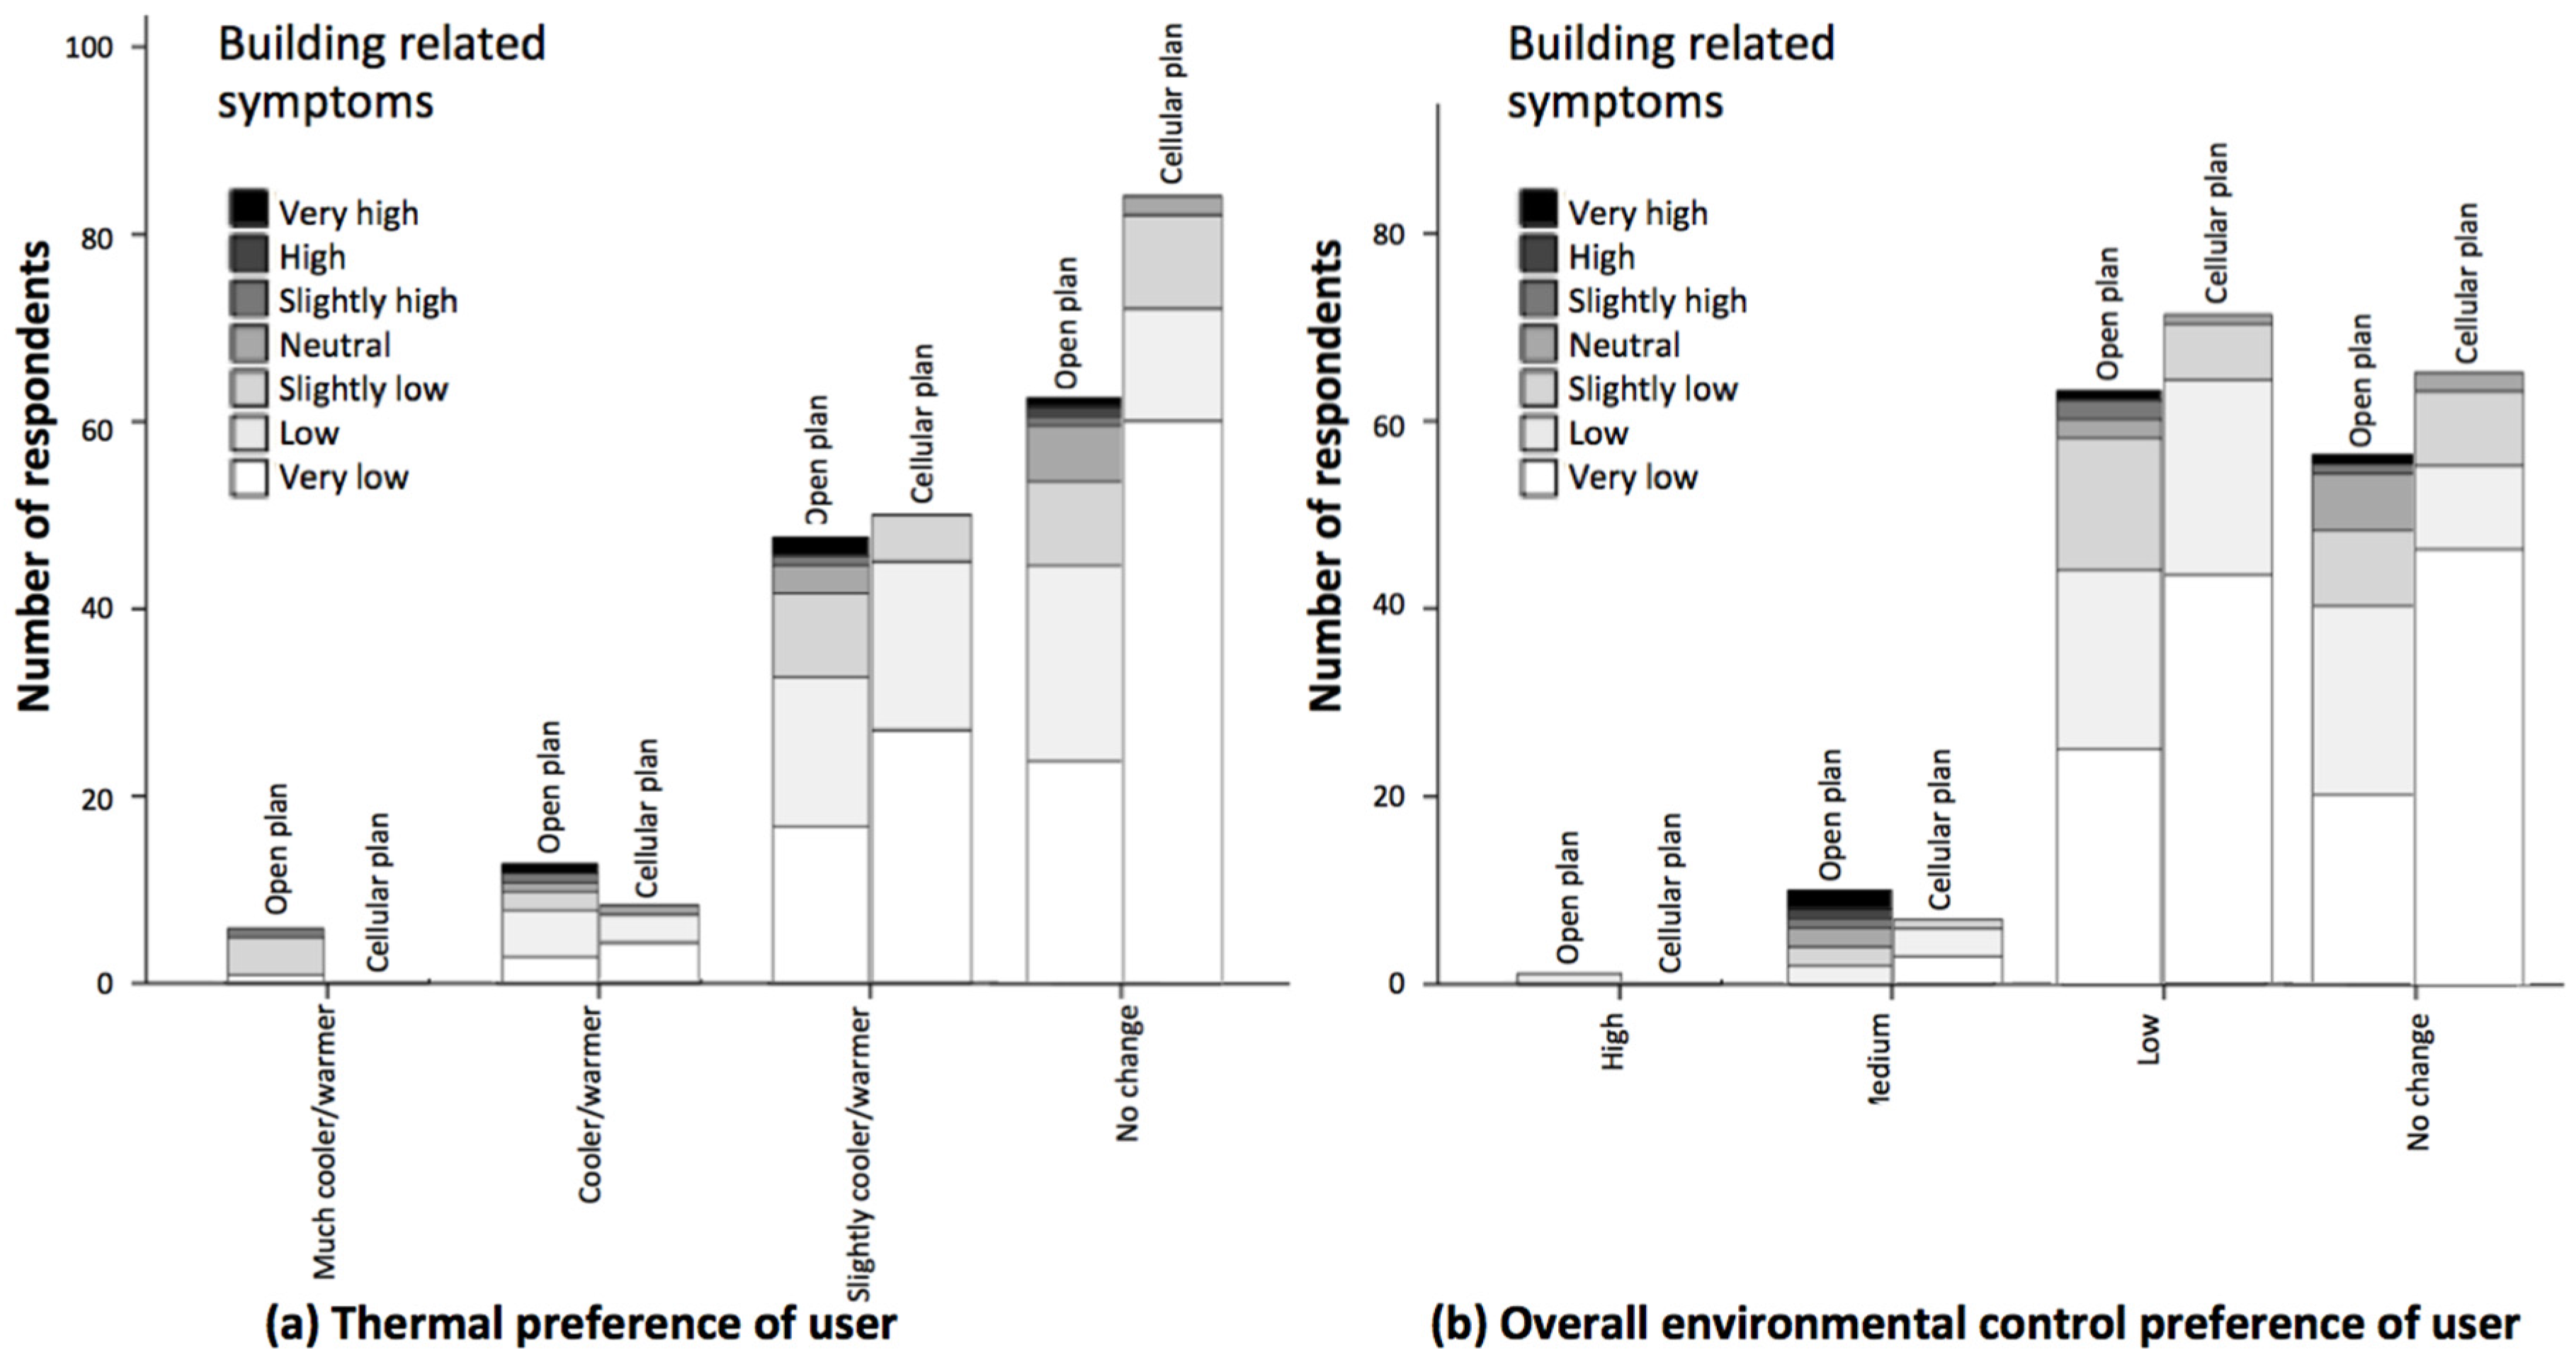
The relationship between symptoms and users’ preference to adjust the temperature, as well as to apply overall environmental control were further analyzed, as shown in
Figure 17. Respondents with a low desire to change the temperature or to apply environmental control had low or very low symptoms. The higher respondents’ desire to apply control, the more likely they suffered from building-related symptoms. Further regression analysis showed a significant relationship between building-related symptoms and variables including the thermal preference of the respondents (
i.e.,
p value = 0.005 < 0.05), and the likelihood of them applying environmental control (
i.e.,
p value = 0.007 < 0.05).
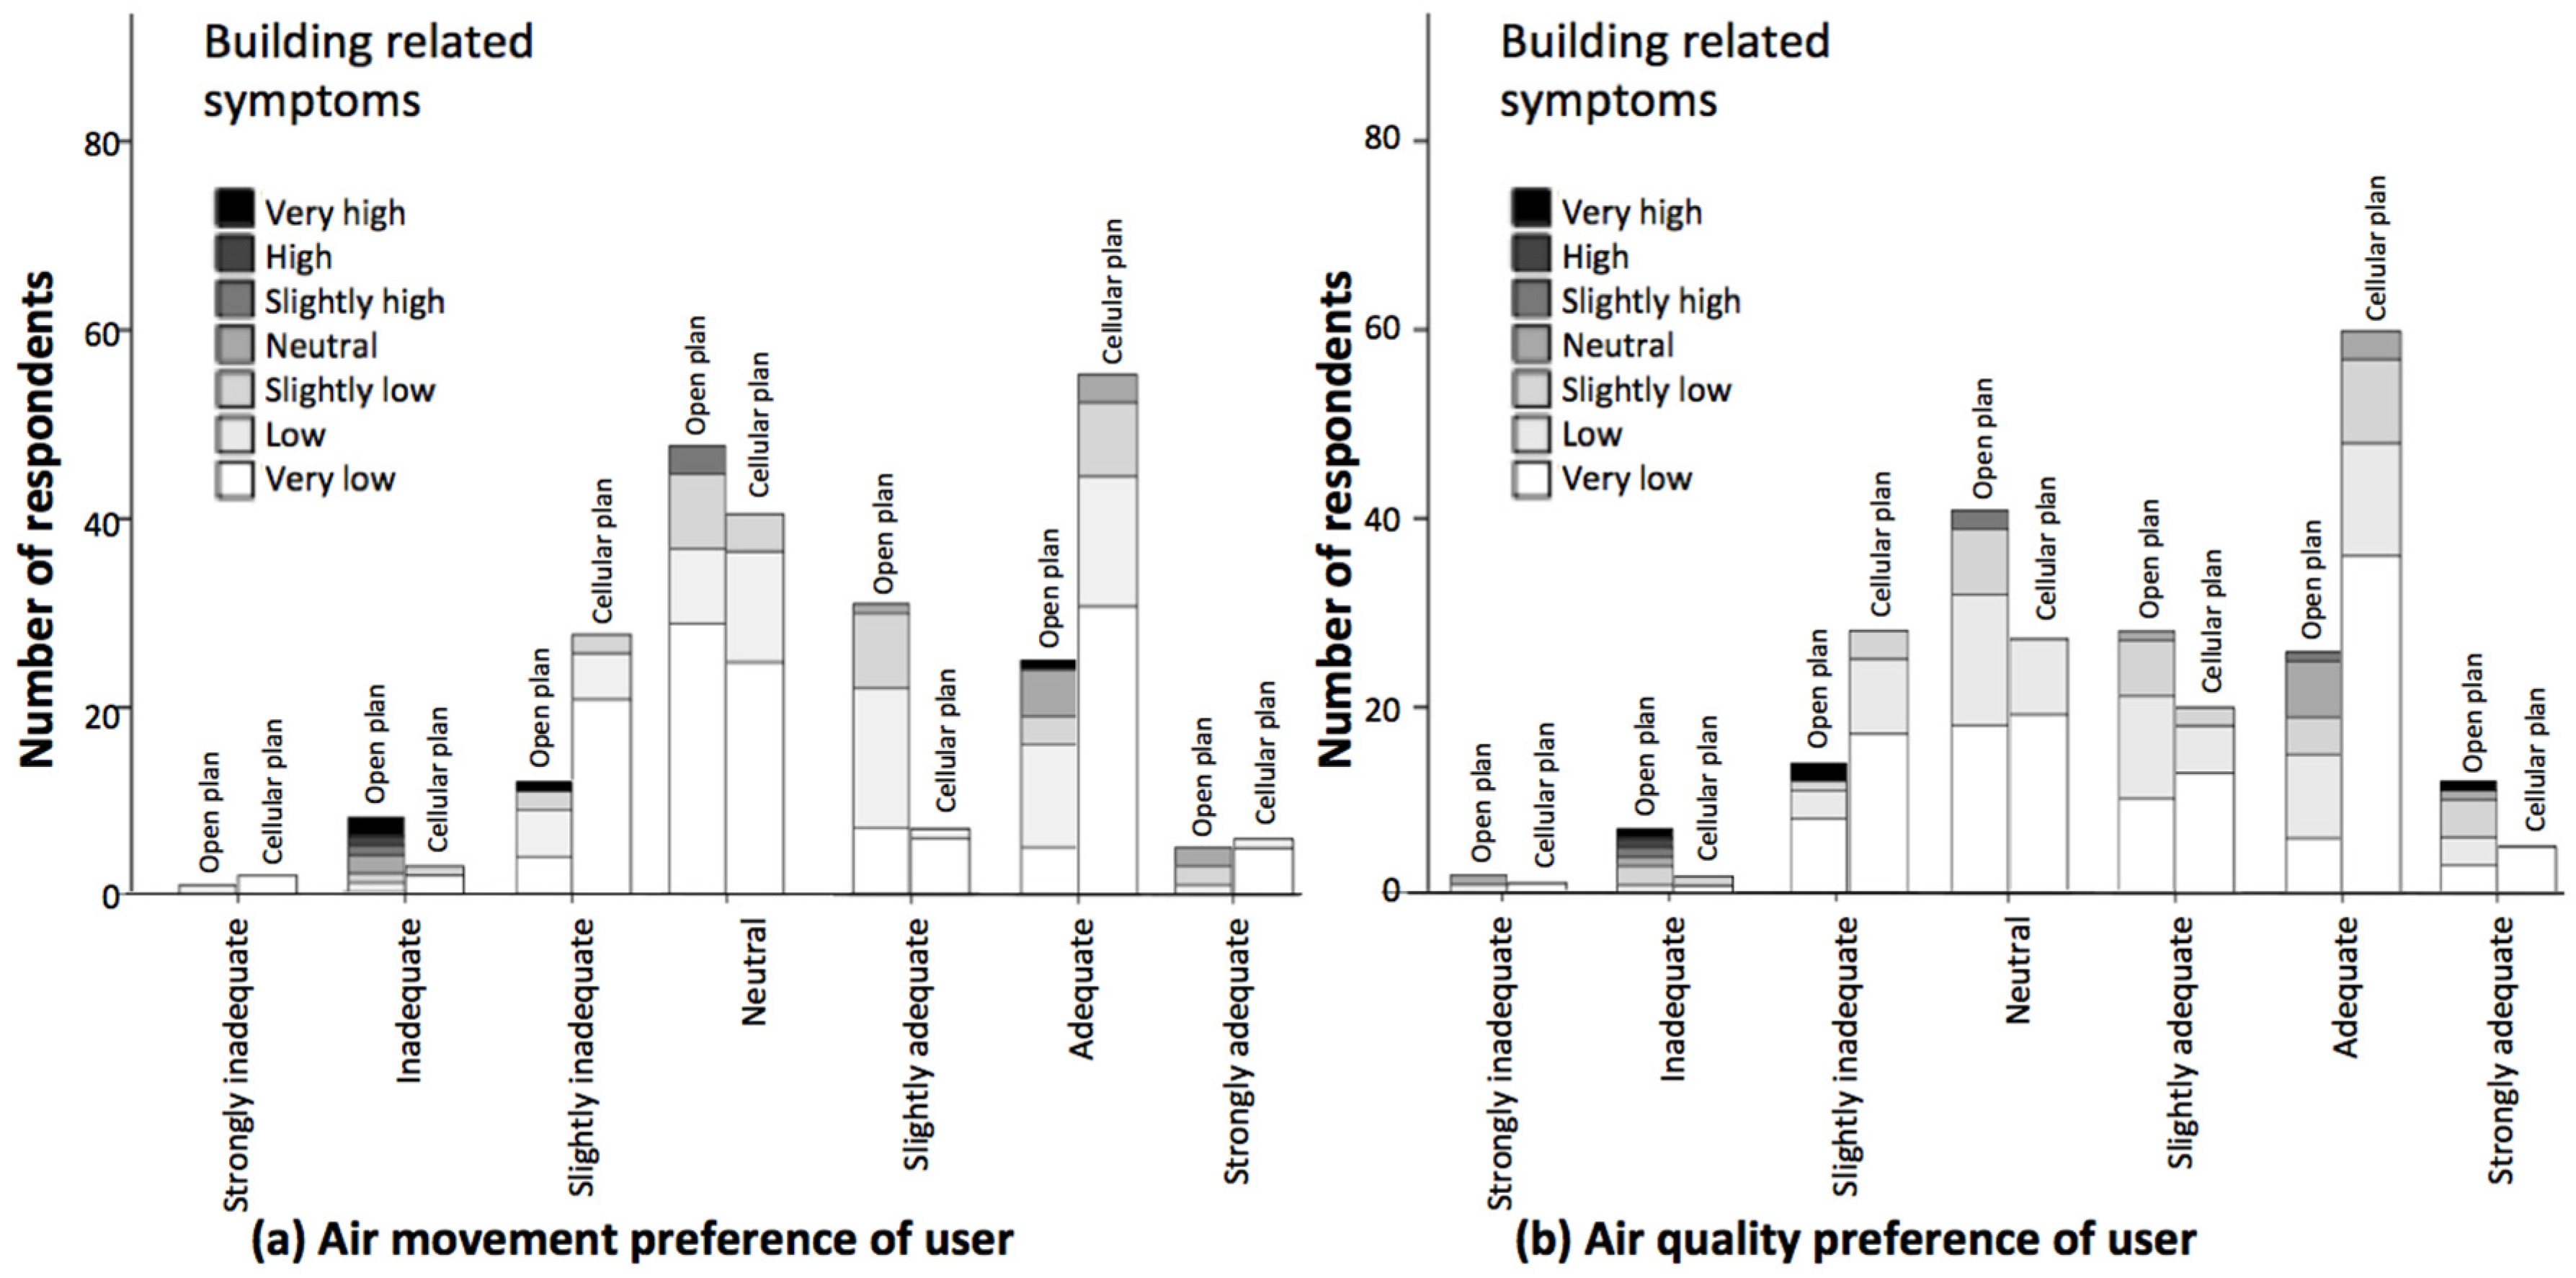
The relationship between building-related symptoms and air movement and quality is examined and illustrated in
Figure 18. Respondents who reported the air movement and quality as inadequate or strongly inadequate suffered more from the symptoms, particularly in the open plan offices. However, further regression analysis showed no significant relationship between building-related symptoms and respondents’ desire to change the air movement (
i.e.,
p value = 0.539 > 0.05) and air quality (
i.e.,
p value = 0.338 > 0.05).
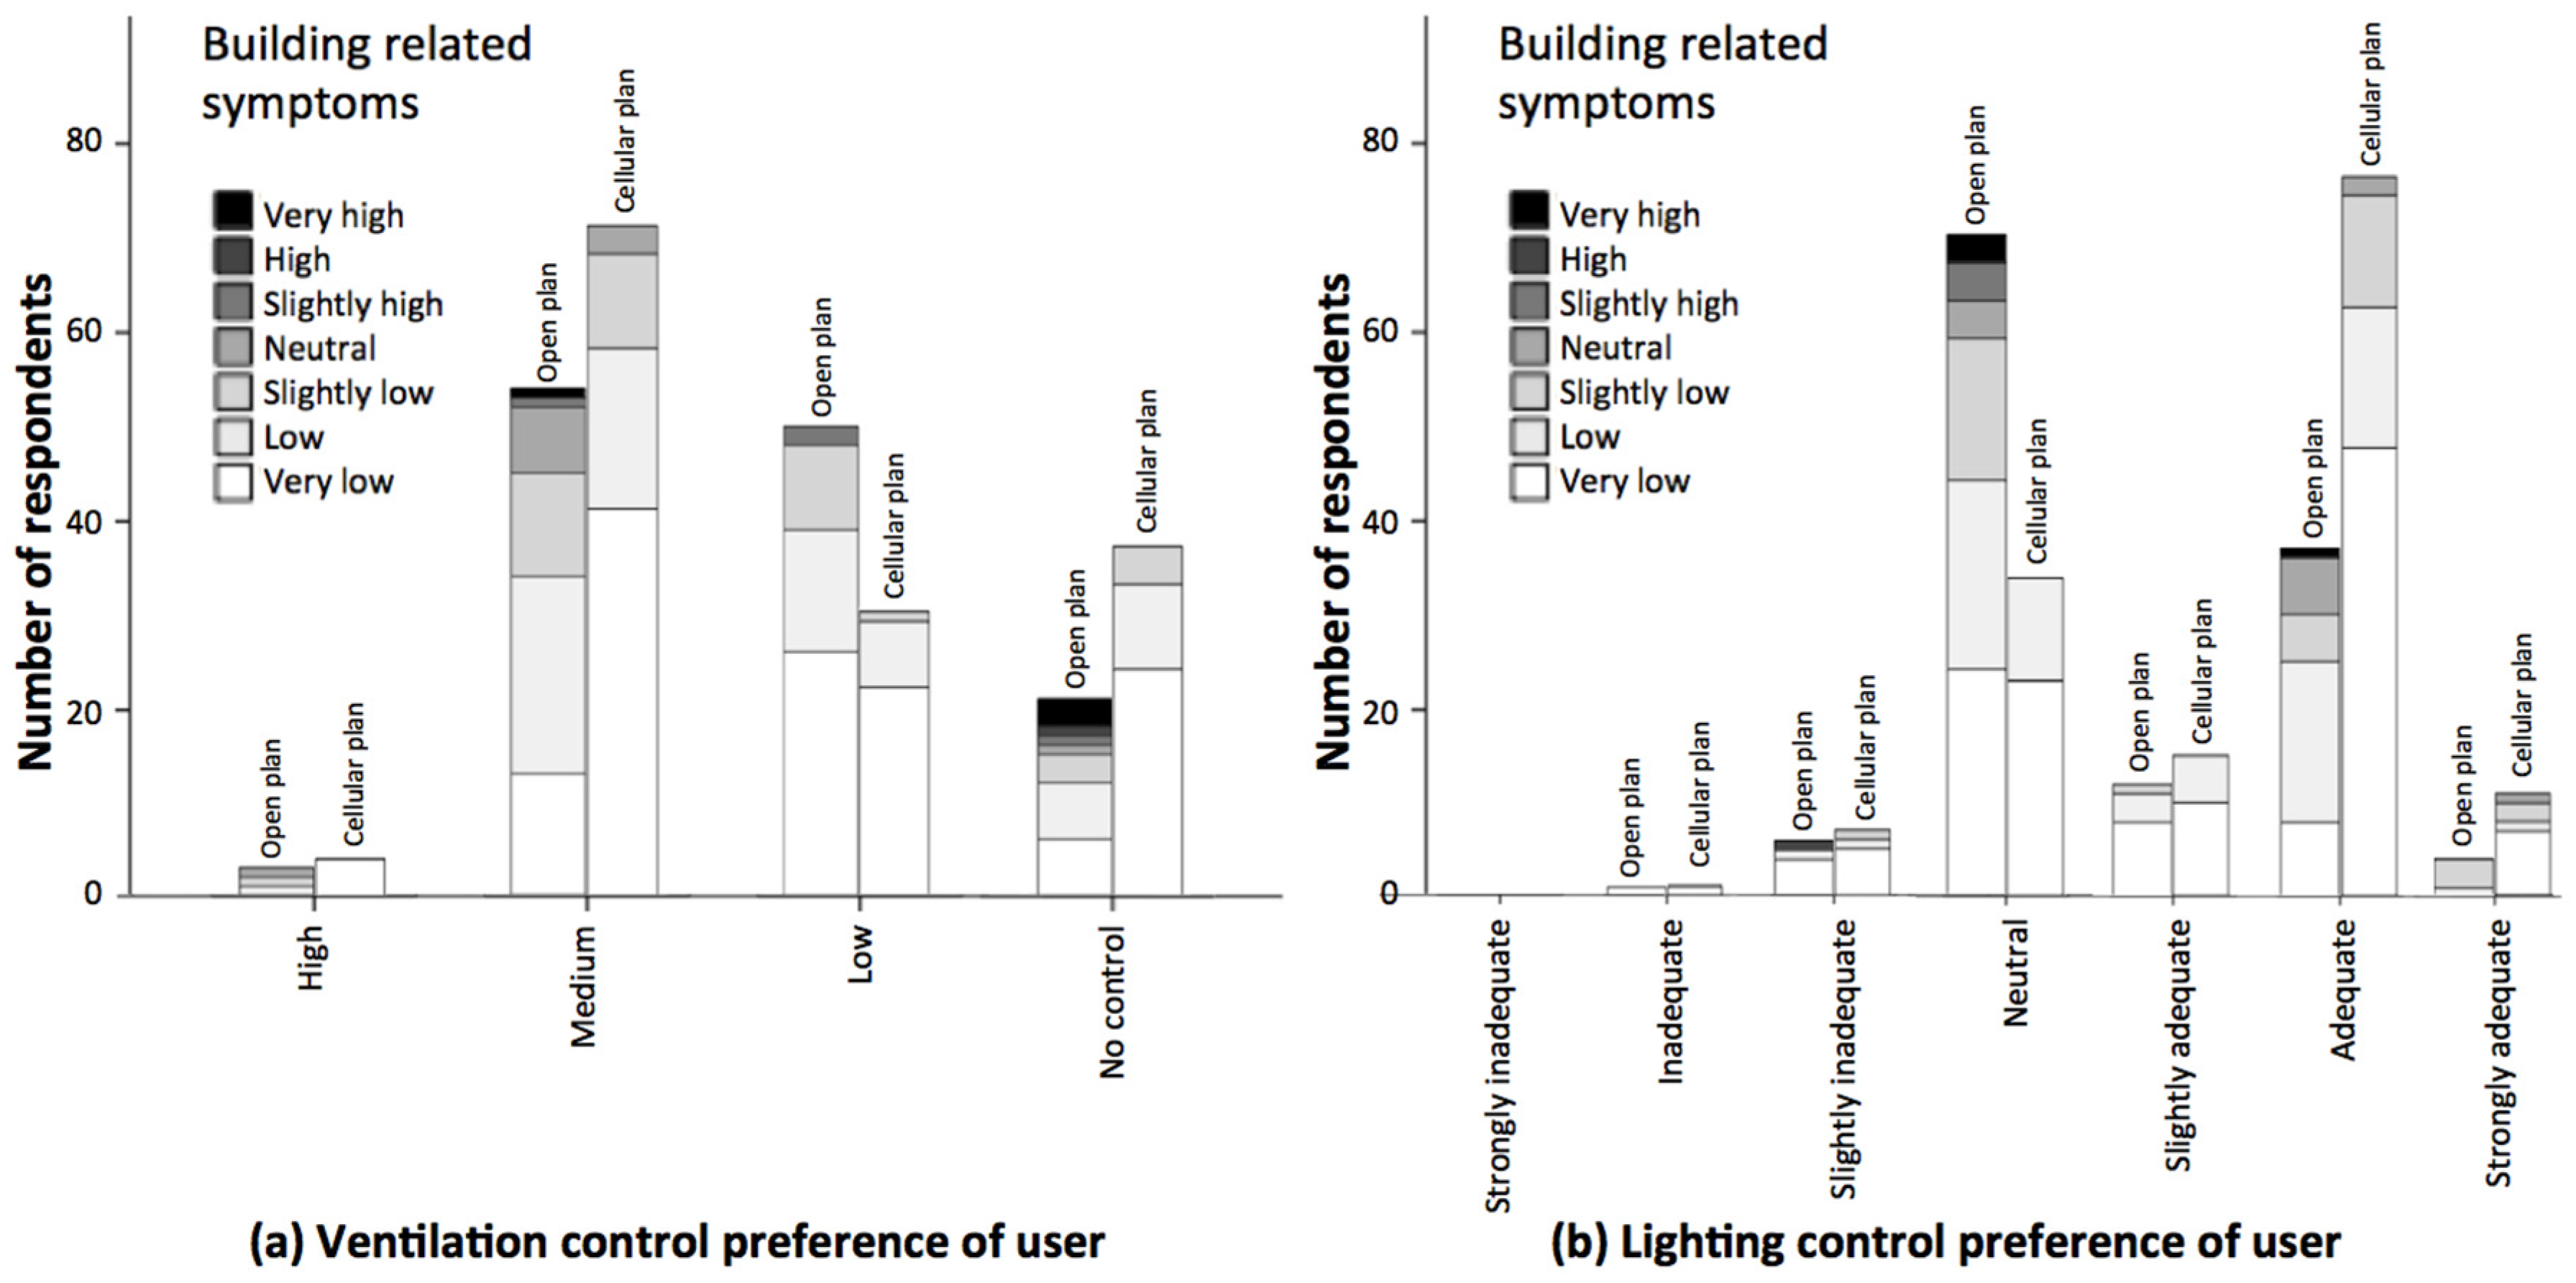
The relationship between the building-related symptoms and respondents’ desire to control the ventilation and lighting was tested and presented in
Figure 19. In the cellular offices, occupants with higher symptoms wanted more change in the ventilation. Although a similar pattern was observed in the open plan offices, respondents with very high symptoms did not want any change in the ventilation. Further regression analysis showed no significant relationship between building-related symptoms and respondents’ preference to control the ventilation (
i.e.,
p value = 0.609 > 0.05) and adequacy of lighting (
i.e.,
p value = 0.929 > 0.05).
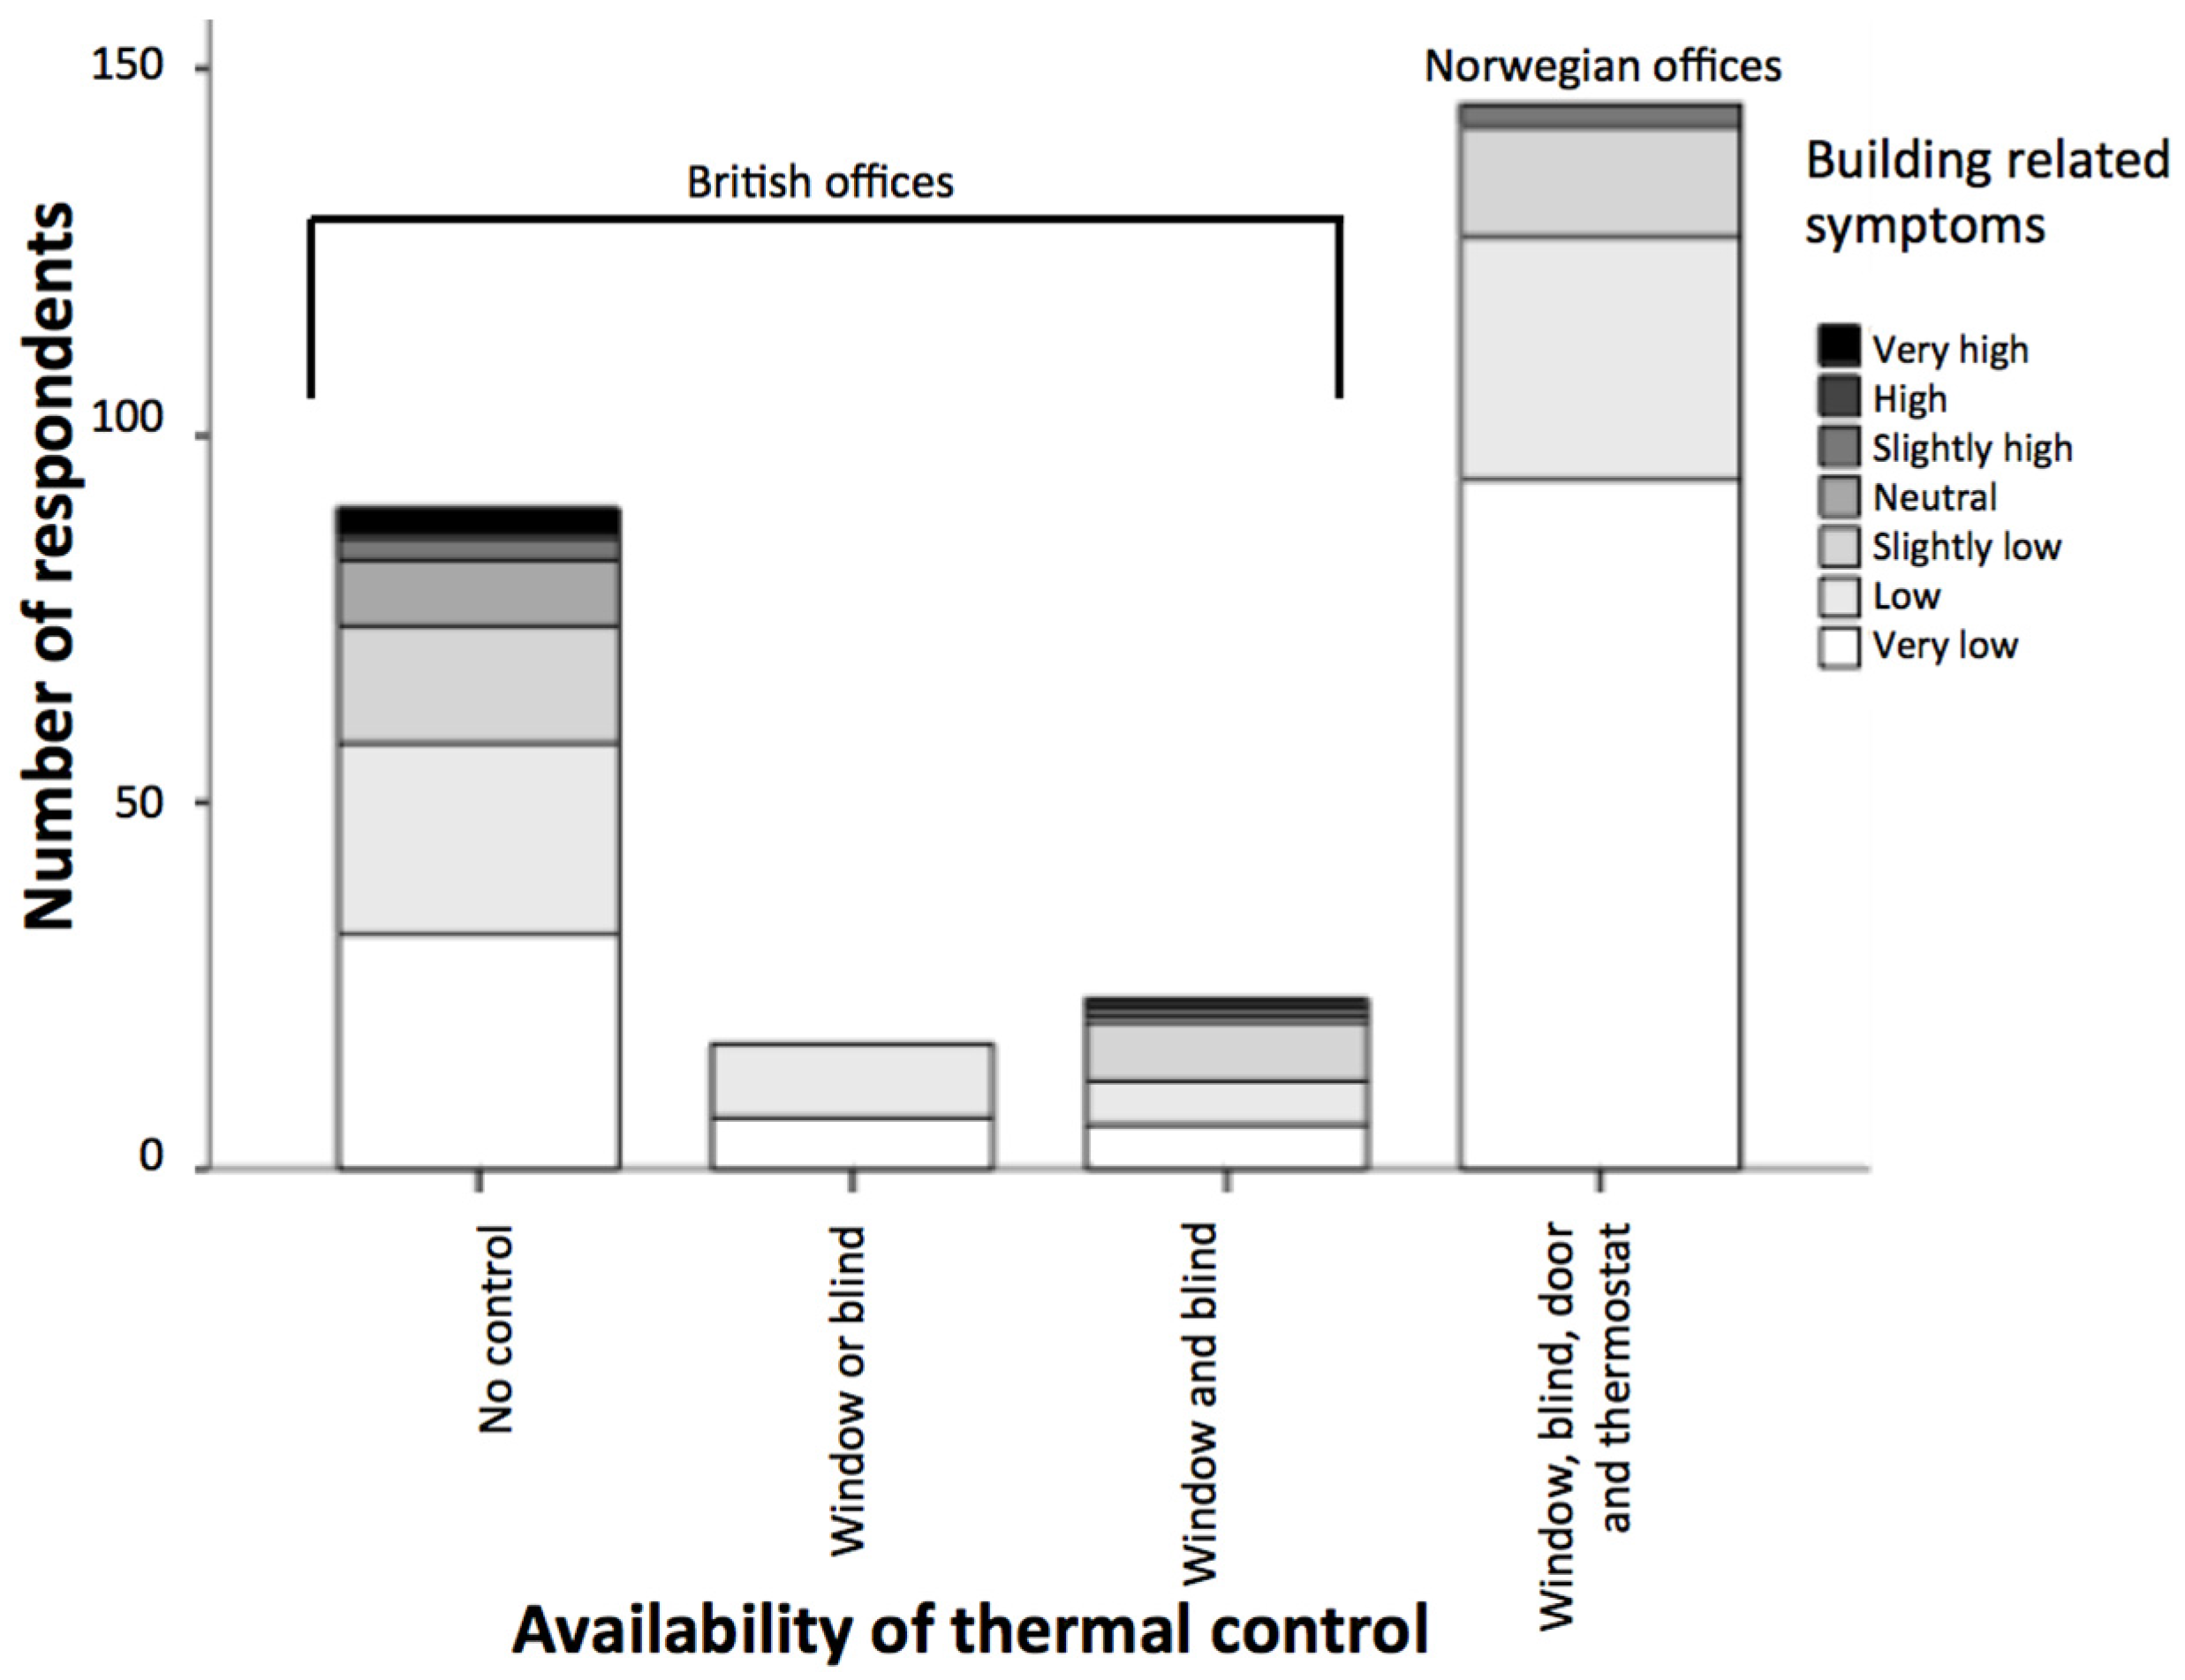
The relationship between building-related symptoms and the availability of thermal control was analyzed, as illustrated in
Figure 20. The two open plan offices provided similar levels of thermal control and occupants seated away from the windows had no control over the thermal environment. Occupants seated close to the perimeter and atrium of the building had limited control over openable windows and blinds. In contrast, Norwegian practices provided high levels of thermal control.
As shown in
Figure 20, the availability of thermal control options led to fewer symptoms and better health conditions. Occupants with higher levels of thermal control (cellular plan offices) suffered less from the symptoms and occupants with no thermal control option (seated far from windows in the open plan) reported suffering the most. Overall, 78% of the occupants in the cellular plan offices never suffered from any symptoms, while this number dropped to 50% in the open plan offices. So the healthy conditions in Norwegian contexts were 28% higher compared to those found in the United Kingdom. Only occupants in the British open plan offices reported high or very high (
i.e., constantly or often) symptoms and no respondent in the Norwegian model reported suffering greatly or very greatly from symptoms. Further regression analysis showed a significant relationship between building-related symptoms and the availability of thermal control (
i.e.,
p value = 0.000 < 0.05).
7. Discussion and Conclusions
This study showed that occupants of two air-conditioned buildings suffered 28% less from building-related symptoms compared to offices where natural ventilation and displacement ventilation were in operation. This suggests that air conditioning was not responsible for building-related symptoms. This called into question other research in the field, which identified air conditioning as the main cause of building-related symptoms [
28,
29] and reported fewer symptoms in naturally ventilated offices [
20]. There is a risk of perceiving naturally ventilated buildings as being inherently better than air-conditioned buildings—irrespective of internal layouts and working practices—and thus causing fewer building-related symptoms compared to air-conditioned buildings. This study indicated that the quality of the design and thermal control are important factors. For instance, in a poorly designed naturally ventilated building, the air circulation in some corners may be insufficient. Therefore occupants seated in those areas may suffer from building-related symptoms [
40]. Occupants may also decide to close windows, particularly in cold winter conditions. This influences the airflow in the building, causing increases in the carbon dioxide concentration and exacerbating symptoms. In this study, automated windows in the naturally ventilated building controlled the carbon dioxide level. However, occupants complained that when they opened the windows in winter, the cold draught made them feel uncomfortable. Overall, the two air-conditioned buildings caused fewer health-related issues, mainly due to high levels of thermal control, such as a thermostat and an openable window. This finding agreed with other research stating that when air conditioning is well designed and functions properly, it does not increase symptoms [
23,
28].
In this study, the thermal environment and carbon dioxide levels were similar in the four case studies and within an acceptable range. The significant difference between the buildings was the availability of thermal control in the Norwegian approach. In the interviews, occupants emphasized control over the temperature and openable windows, which agreed with other findings [
33,
34,
35,
36]. The analysis indicated a significant relationship between building-related symptoms and the planning of the office environment. It demonstrated that the two open plan offices with limited levels of thermal control had a higher risk of Sick Building Syndrome in comparison to the two cellular plan offices, which, while mechanically ventilated, featured a comprehensive provision of thermal control. These findings concur with other research in the field indicating that health and control are related and a lack of environmental control causes health-related issues [
41,
42,
43,
44]. Occupants of the open plan offices identified the lack of control over the thermal environment in their office as the main cause for their symptoms.
Currently, low carbon and energy efficient strategies are encouraged. However, this study suggests that the availability of ventilation, thermal control systems, and the design of the workplace significantly influence building-related symptoms. Personal offices with high levels of thermal control provide a healthier work environment compared to energy-efficient open plan offices with limited environmental control. The study suggests a balance between providing thermal control and energy efficiency. Overall, the statistics indicate that the availability and proper design of thermal control improve users’ health and this was confirmed in the interviews.
Contemporary sustainable and low-carbon design strategies tend to favor natural ventilation methods over mechanical provision in terms of capital and recurring costs, operational energy impacts, and air quality. However this study indicated that sophisticated levels of control in mechanically ventilated buildings lead to higher user satisfaction and fewer incidences of perceived ill health from the internal environment. Cellular office accommodation tends to be more popular with office workers in terms of the quality of their environment. The research suggests that naturally ventilated environments do not offer optimum internal conditions for building users.


 ,
, 


