Article

Handling Diversity of Visions and Priorities in Food Chain Sustainability Assessment

Department of Agriculture, Food and Environment, University of Pisa, via del Borghetto 80, Pisa 56124, Italy
*
Author to whom correspondence should be addressed.
Sustainability 2016, 8(4), 305; https://doi.org/10.3390/su8040305
Submission received: 26 December 2015 / Revised: 10 March 2016 / Accepted: 21 March 2016 / Published: 25 March 2016

Abstract

:
Food chain sustainability assessment is challenging on several grounds. Handling knowledge and information on sustainability performance and coping with the diversity of visions around “what counts as sustainable food” are two key issues addressed by this study. By developing a comparative case study on local, regional and global wheat-to-bread chains, and confronting the multidimensionality of sustainability, this work focuses on the differing visions and perspectives of stakeholders. We integrate qualitative and quantitative data, stakeholder consultation and multi-criteria analysis to align the visions and the multiple meanings of sustainability. Because of the complexity and the dynamicity of the food system, the multidimensionality of the sustainability concept and its pliability to stakeholders priorities, sustainability is an object of competition for firms in the agro-food sector and has major implications in the governance of food chains. Results identify key propositions in relation to: (i) the value of combining science-led evidence with socio-cultural values; (ii) multidimensional sustainability assessment as a self diagnosis tool; and (iii) the need to identify shared assessment criteria by communities of reference.

1. Introduction

There is a widely recognized need for individuals, organizations and societies to find modes, metrics and tools for articulating the extent to which, and the ways in which, entities or activities are sustainable [1]. In the definition provided by Ness and colleagues, “the purpose of sustainability assessment is to provide decision-makers with an evaluation of global to local integrated nature–society systems in short- and long-term perspectives in order to assist them to determine which actions should or should not be taken in an attempt to make society sustainable” [2].
The substantial impacts of food production and consumption on environmental and socio-economic grounds have stimulated scholars, civil society, corporations, and national and international institutions in developing food chain sustainability assessments. Several streams of literature address food chain sustainability assessment, including supply chain management [3], socio ecological systems [4], and rural sociology [5]. The assessment of different aspects of sustainability relies on a wide range of “assessment frameworks”—integrated and structured procedures which prescribe a number of stages—and “assessment tools”—analytical techniques that can be used to conduct analyses/comparisons within frameworks, such as indicator lists/composite indices and multi-criteria analysis among others [6]. Several meta-analysis compare and classify existing sustainability assessment frameworks and tools systematically based on the type of tool used [7,8] temporal scope [2], degree of top-down influence and stakeholder participation [9]. Munda [10] classifies among “reductionist” and “non reductionist” tools: reductionist tools make use of a single measurable indicator (e.g., economic costs/benefits), a single dimension (e.g., environmental), a single objective (e.g., maximization of economic efficiency) and a single time frame. The advantage of such tools lies in the reduction and integration of diverse aspects to proxy indicators, which allows a certain degree of “simplicity”, compatible with stakeholders and policy-makers needs. “Non-reductionist” tools are well represented by multi-criteria indicator-based techniques. Two major trade-offs arise in relation to sustainability assessment through “reductionist approaches”, as with indicators: the first is between the accuracy of the assessment and keeping information needs manageable for the enterprises and the second is between adaptation to an enterprise’s unique setting, and assurance of comparability [11]. On the other hand, within non-reductionist approaches, several of the methodological choices, including the choice of the indicator and the weights, are considered as “subjective” (e.g., data selection, criteria definition, aggregation and weighting), but are nonetheless made in an explicit way [12].
Understanding what is needed to “achieve” sustainability requires assessing the systemic consequences of the possible alternatives [13] and in turn, the definition of alternatives requires selection criteria, which ultimately result from a subjective value based judgment. The choice of parameters for sustainability assessment, within for example risk assessment and benchmarking [14], is inevitably value and world-view dependent [13]. As a consequence of this, an “enlarged way of thinking” [15] is needed in order to make a step forward in sustainability thinking and practice. The post-normal science perspective [16] offers a lens to look more broadly, recognizing the complexity and uncertainty involved in conducting sustainability assessment. In this view, the assessment of progress towards sustainability should not be reduced to a single metric, thus “methodological pluralism coupled with stakeholder participation seems a safer path to tread” [7]. Most importantly, value judgments should not be implied but explicitly accounted for [7,17]. The inclusion of multiple stakeholder knowledge is a way to open up valuable contributions to sustainability evaluation to capture the values of the affected stakeholder and to inform the decision of the most appropriate evaluation tool(s) [6]. The research in the field of sustainability performance assessment of food chains claims for contributions focusing on the role and the visions of the stakeholders [17,18].
The present work addresses multidimensional sustainability assessment in food supply chains by explicitly considering stakeholder values and perceptions on sustainability performance: how can values and perceptions be considered in sustainability assessment? What does diversity and convergence of views contribute to sustainability assessment?
We explore the sustainability performance and the multiple meanings assigned to food chain sustainability through case study analysis with the aim of building theoretical propositions from cases, having regard to the practices adopted and the dynamics occurring within single settings in different geographical and socio-economic contexts [19,20,21]. For this purpose, we selected a specific food sector—bread—and three supply chains, based in Italy. Bread is a staple food that can be either highly standardized or diversified, according to context, history and culture: there is a strong emphasis on bread qualities and varieties and initiatives aiming at re-thinking supply chain relationships and practices are spreading, especially in Italy. After an explorative analysis on sustainability performance of bread supply chains, we directly addressed stakeholders, and their different visions of sustainability. During a participatory workshop, to which stakeholders at different levels of the bread chains were invited, we integrated an individual assessment with a collective discussion, with the aim of explicitly highlighting different views and interests and identifying areas of consensus and priorities.
The paper is organized as follows: the next section presents the materials and methods chosen for the preliminary assessment (Section 2.1) and the participatory assessment (Section 2.2). The results are presented in Section 3, which includes results of the preliminary assessment (Section 3.1) and of the stakeholder workshop (Section 3.2). A discussion on main sources of challenge for sustainability assessment in light of the case studies findings follows in Section 4. Section 5 concludes by formulating propositions for furthering research on food chain sustainability assessment.

2. Materials and Methods

Our research methodology comprises two main stages. In a first stage, we carried out a selection and a preliminary assessment of three diverse supply chains having regard to each phase: input provisioning, farming, first and second stage processing and distribution. In the second stage, we integrated the previous analysis by developing a participatory assessment to explore the visions of different stakeholders on the importance of the set of sustainability dimensions and attributes, in relation to the performance of the three bread chains.

2.1. Methodology of the Preliminary Assessment

2.1.1. Case Studies Selection

The selection of the supply chains for case study purposes was aimed at capturing the most diverse—in the words of Eisenhardt [19]—“polar type” situations. Differing degrees of complexity, multidimensional sustainability performances and contrasting values and interests—in relation to sustainability—can be observed in the supply chains studied. The selection of the cases was inspired by four main characteristics: the geographical distance between the chains’ stages (localized, regional and global), the governance and organization of supply chain actors (one integrated, one vertically coordinated and one coordinated based on market relations, i.e., price); the resources, know-how and technologies employed (labor intensive and handcraft know how, capital intensive and industrial and a mix of both) and the territorial identity of the product (standardized or differentiated).
The three bread chains are: (i) a small scale, niche bread (local case); (ii) an industrial bread with traditional features as defined by a Protected Designation of Origin (PDO) quality specification (regional case); and (iii) a large scale, industrial and standardized bread (global case). Table 1 and Table 2 present a set of contextual descriptors to convey the heterogeneity of the cases selected.

2.1.2. Attributes for Sustainability Assessment

The supply chains selected were assessed in relation to a set of sustainability attributes within five sustainability dimensions: social, economic, environmental, health, and ethical. We referred to a scoping study by Kirwan et al. who evaluated the perceptions and representations of food chain performance at both global and local level in different national contexts; four spheres were considered as spaces of communication characterized by actors, the media and discourses (i.e., the market, the public, the scientific and the policy spheres) across five dimensions of sustainability (economic, social, environmental, human health and ethical) [22]. Sustainability “attributes” are “features or characteristics or inherent parts of sustainability performance”. It should be noted that “attributes are not indicators”. We adapted the 24 attributes identified by Kirwan et al. [22] to the specificities of the bread sector by carrying out an academic literature analysis on the wheat-to-bread chain [23,24], and adopting a hierarchical structure of sustainability attributes within each dimensions. This hierarchical structure was aimed at helping respondents to assess the attributes with reference to each dimension of sustainability, in the later steps of the research [25]. This led to the identification of 19 attributes relevant for the analyzed commodity (Table 3) Some adaptations of the set of attributes proposed by Kirwan and colleagues [22] were made, in order to tailor the assessment to the specificities of the bread chain (based on a literature analysis) and to simplify assessment by stakeholders [26]. Hence, we analyzed the three cases with reference to the selected sustainability attributes, having regard to each step of the chain: input provision, farming, first and second stage processing and distribution. Based on a case-study protocol [27], we integrated in-depth interviews with stakeholders at all stages of the supply chains with interviews with experts and secondary data. At least two investigators were present in each interview and visit at case study sites.

2.2. Methodology of the Participatory Assessment

In the second stage, we developed a participatory assessment to explore the visions of different stakeholders on the perceived importance of the set of sustainability dimensions and attributes, in relation to the performance of the three bread chains. For this purpose, we organized a workshop that aimed at bringing together stakeholders at different stages of different wheat to bread supply chains, to allow for the heterogeneity of perspectives and expertise to be shared and exchanged. The attendance to the workshop was of thirteen participants, belonging to the three supply chains and other regional and national bread chains, representing farming, milling, baking and distribution (see Table A1 for the list of participants). During the workshop, we combined individual assessment and group discussion following a predetermined protocol, which was previously tested with students during class (the methodology was tested in a class of 15 students to check for timing, and feasibility of the agenda and effectiveness of data analysis during the workshop).
The workshop comprised three main parts. Firstly, a general introduction and brief presentation of the three chains was given, providing the same set of contextual information for each chain, with reference to the geographical description of the supply chain, the type of resources and technologies used, product prices and annual quantities and qualitative features of the three breads (Table 1 and Table 2 contain the information provided to participants). Secondly, the individual assessment took place. Stakeholders were given a brief definition for each attribute (Table 3) and three evaluation forms, which asked for, respectively:
  • A prioritization of the five sustainability dimensions for sustainability assessment of the wheat-to-bread chain (scale from 0 to 9).
  • A prioritization of the sustainability attributes within each dimension. Stakeholders were asked to assign a level of importance to each attribute (scale from 0 to 9) as a criteria to assess the sustainability performance of the wheat-to-bread chain.
  • Stakeholder judgment on the performance of three chains presented, with respect to each attribute assuming the availability of an “optimal” indicator (scale from 0 to 9).
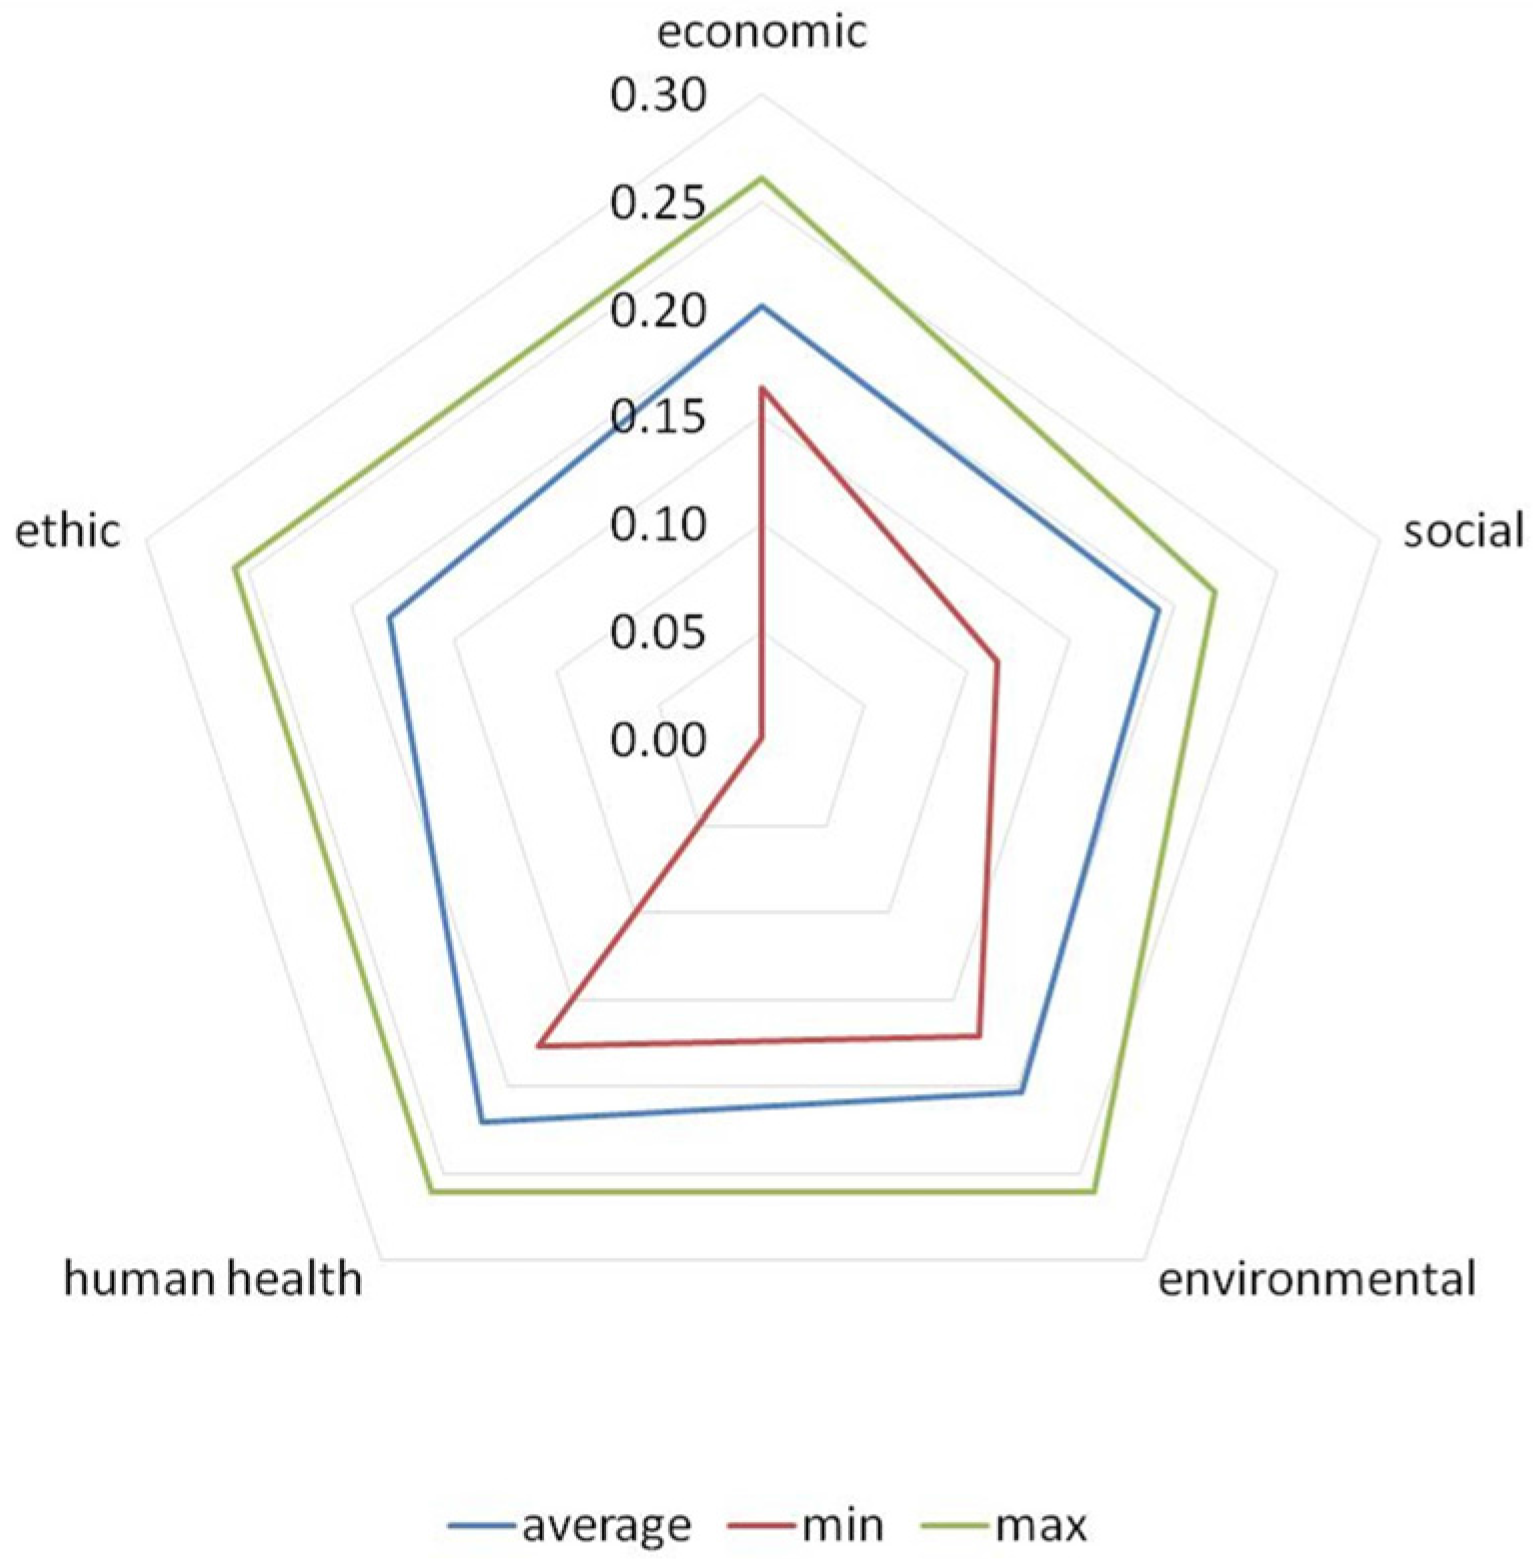
Thirdly, data were collected and analyzed by the research team, by means of a cluster analysis, aiming at grouping “homogeneous” stakeholders, based on the individual assessment of sustainability dimensions. The analysis applies a cluster analysis using dissimilarities between stakeholders’ perception on the relative relevance of sustainability dimensions. The groups are identified using hierarchical clustering method and the higher Calinski/Harabasz pseudo-F value (see Calinski and Harabasz [28]). The weights were calculated taking into account the hierarchical structure of sustainability dimensions and attributes. The analysis of the performance of the three chains was carried out by means of multi-criteria aggregation: the weights derived for each attribute were used to aggregate the normalized performance scores of different supply chains. While data were elaborated, a collective discussion on some overarching questions took place, aimed at identifying consensus areas, unsolved tradeoffs and possible disagreements on sustainability dimensions and performances. As soon as the results of the multi-criteria and cluster analysis were available, they were shown and discussed with the participants.

3. Results

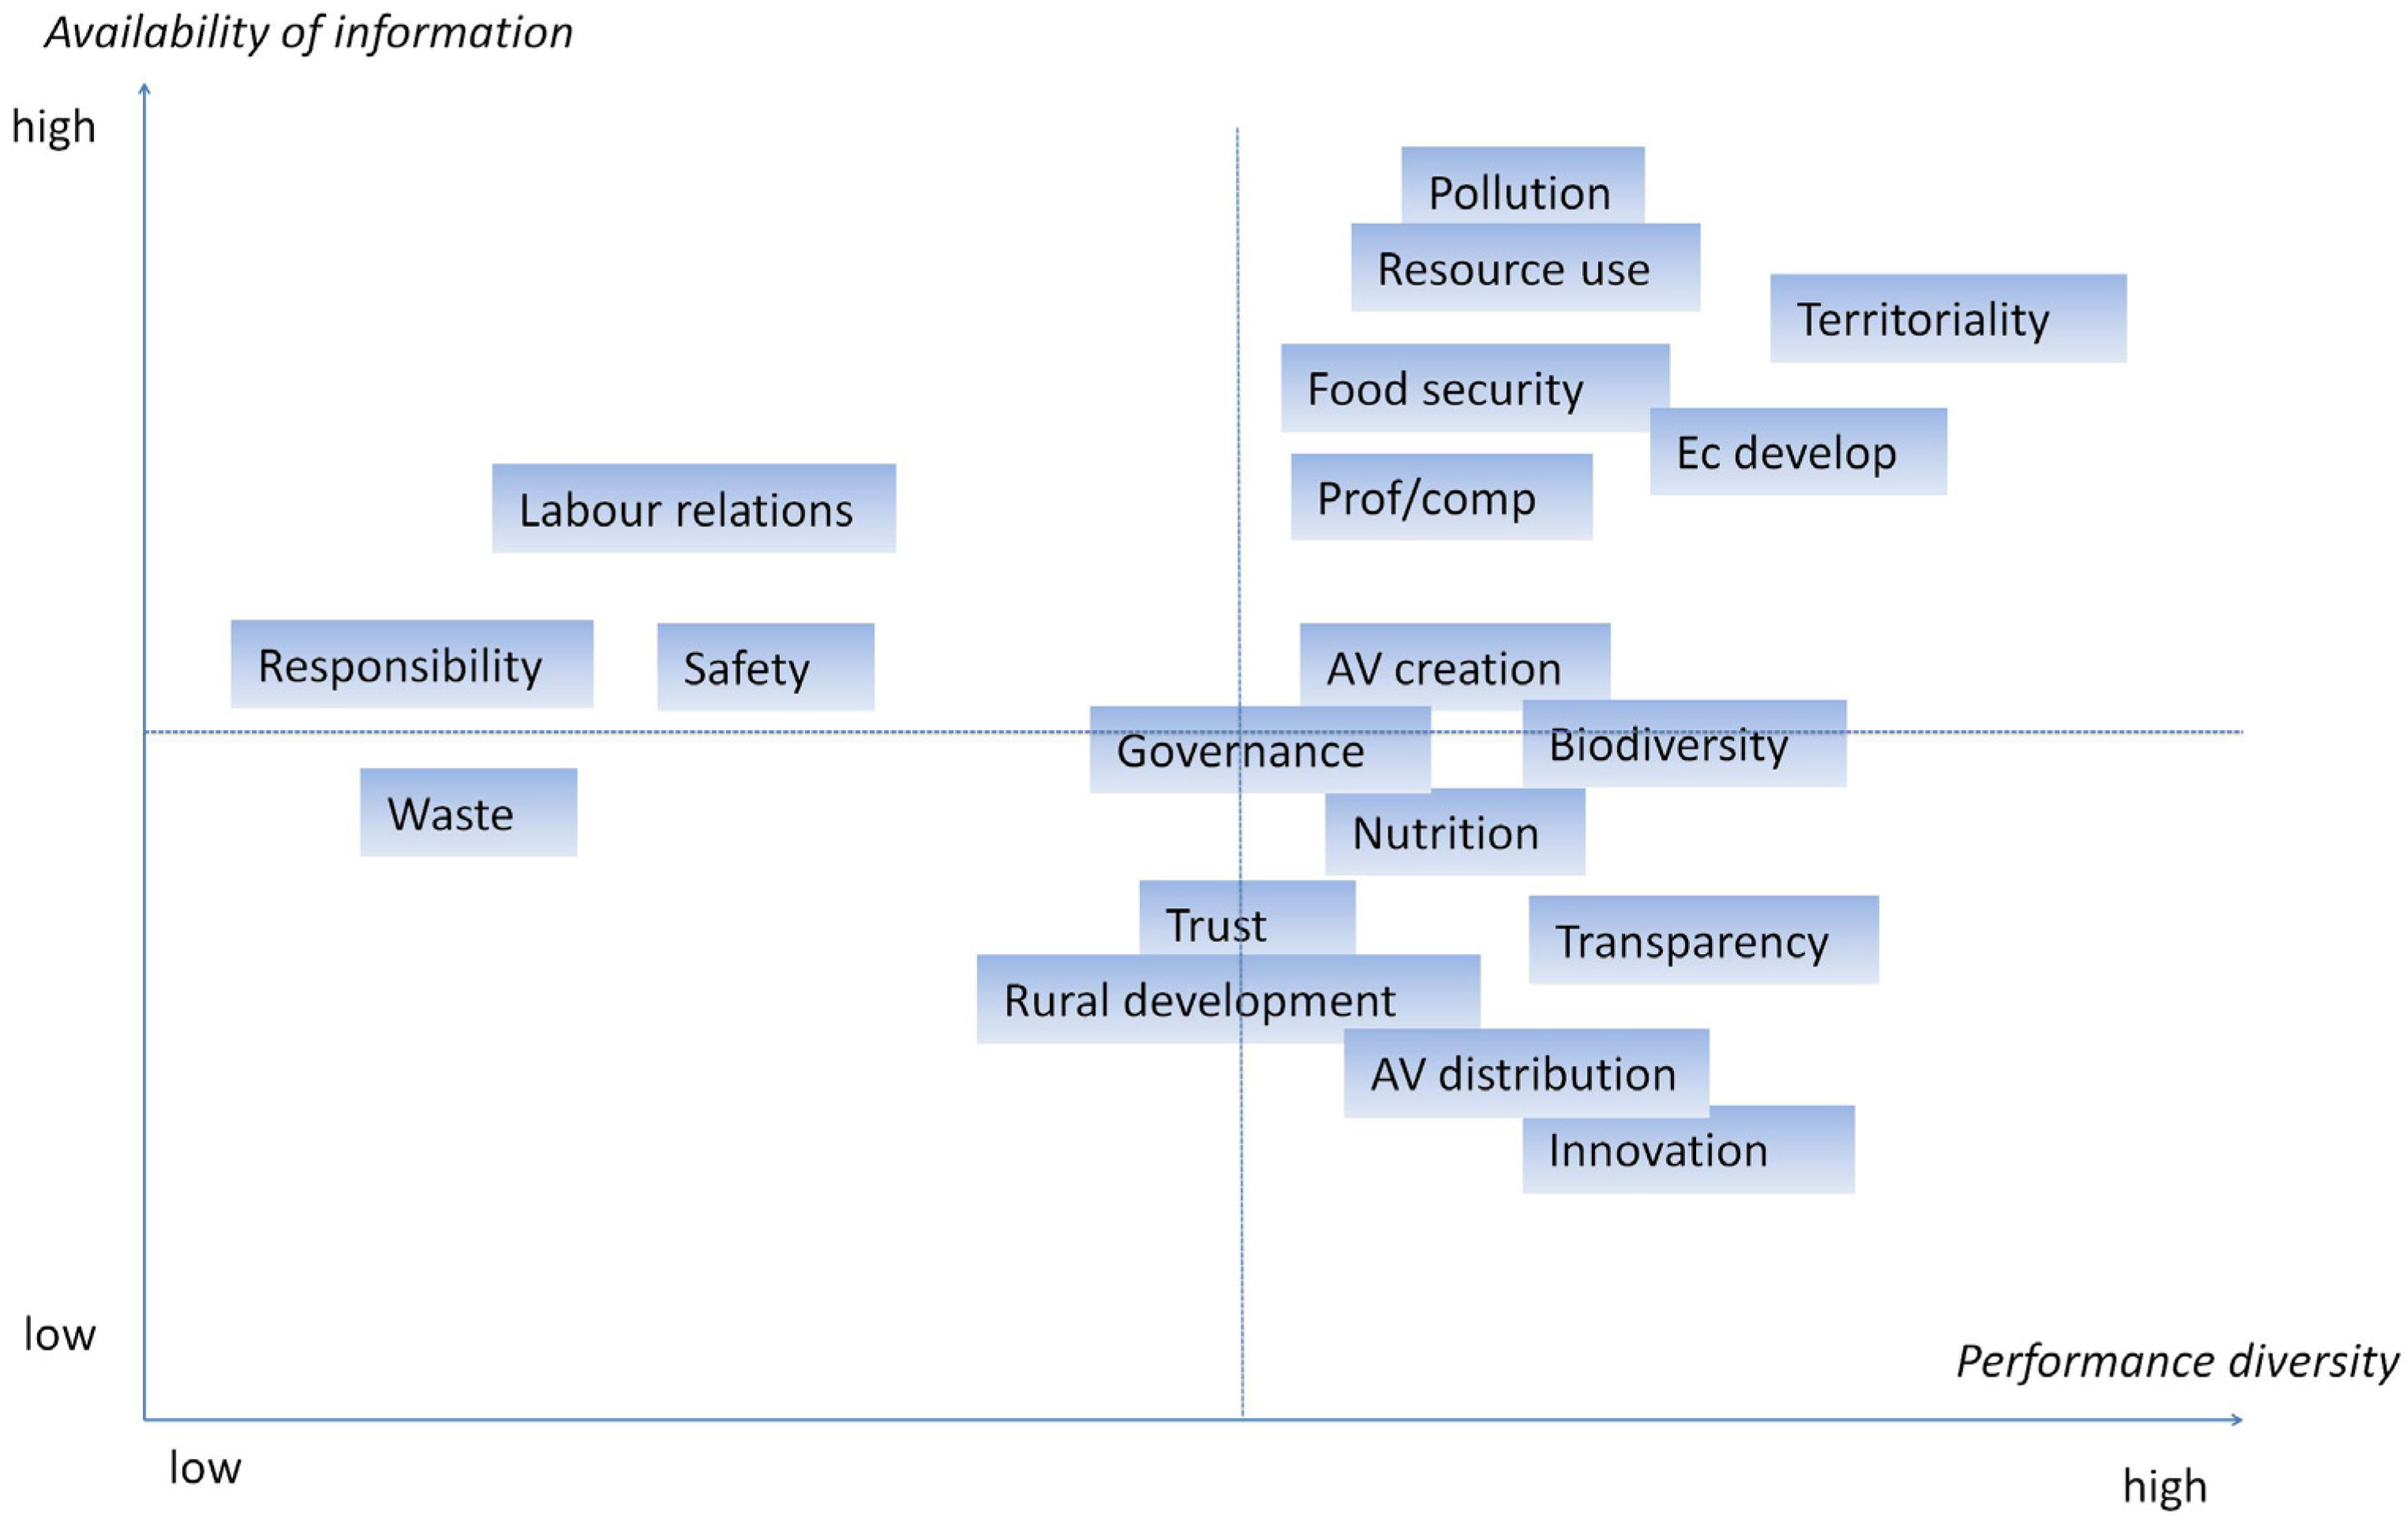
3.1. Results of the Preliminary Assessment

Figure 1 illustrates the results of the preliminary assessment based on the integration of information available on the set of sustainability attributes. The figure indicates on the vertical axis the positioning of the attributes in relation to the availability of information, (e.g., indicators and non-measurable but relevant information), while the horizontal axis expresses the difference in the performance of the three cases. The sustainability attributes are allocated into four quadrants: (1) Top-right: a high difference in the performance of the chains and a high availability of information for the chains selected; (2) Top-left: a low difference in the performance of the chains, supported by a relatively high availability of information on the attribute; (3) Bottom-right: a high difference in the performance of the chains and a low availability of information to clearly support such performance difference. The performance difference emerges from interviews with stakeholders and/or other information which is not captured by indicators but anyhow relevant to characterize the performance; (4) Bottom-left: a low diversity in the performance supported by a low availability of valuable information.

3.1.1. Economic Performance

The economic performances of the three chains are very diverse but they share a common feature: they are best practices, each one in its own “realm”. “Local” is a short and fully integrated supply chain without intermediaries and the product is a niche quality bread. The local bread shows the highest premium price in relation to a suitable comparable. Moreover, the farmer defines the final price based on production costs, and adapts the production according to the demand. However, the milling and baking plants are not used at their full potential, therefore the efficiency of the production process could be improved. The “regional” chain was initiated by a miller, with the support of the Regional Rural Development Program (RDP) and the code of practices agreed with farmers and bakeries limits the sourcing of wheat to the Tuscan territory. The localization strategy pursued by the Consortium includes the recognition of the PDO, which is currently in its final phase, and all operations must take place in Tuscany. The intention of the network is to sell this product on the global market. The contract agreement, which defines production quantities and premium price ranges for farmers, coordinates stakeholders to the common aim of ensuring the quality of the final product, a prerequisite of the commercial and economic success of the initiative. The “global” chain is a mass product whose premium price is positive with respect to a generic, comparable soft bread, in a market characterized by frequent promotions and price reduction. This is due to brand value and good organoleptic features. In this case, wheat is sourced on global commodity markets, because Italy has a limited internal supply of wheat suitable for baking purposes, due to pedo-climatic conditions, and technological features and therefore it is highly dependent on imports (more than one half of national requirements).

3.1.2. Social Performance

The social dimension of sustainability in the three cases considers labor relations, distribution of added value, food security, territoriality and trust. In relation to the two latter attributes, the predominance on the market of bread of low or unclear quality have encouraged the diffusion of re-localization experiences—as in the local and regional cases—aiming at reconnecting and increasing transparency and therefore trust in all stages of the bread chain up to the final consumer. Nonetheless the global chain has a national identity and brand, and although the product in itself is highly standardized, the product range is being increased and diversified. The global chain’s bread is the best performing in terms of food security, framed as economic and physical access, availability (and stability) of the product, which is easily accessible through mass retailers. The performances on labor relations across the three cases are not significantly different, despite the specificities of each case. The distribution of added value could not be assessed due to lack of data on prices and costs along each chain, however in the local and regional cases the role of farmers is more prominent: the local chain is fully led by the farmer and in the regional chain there is a contract that protects farmers from market fluctuations, by defining a minimum price per ton of wheat.

3.1.3. Environmental Performance

The environmental dimension is captured by contribution to biodiversity, resource use, pollution and waste. Performances across the chains in relation to biodiversity, pollution and resource use are diverse, while for waste no significant differences are found. Biodiversity can be captured by the wheat varieties used, as an indicator of “genetic variability”, and the cultivation practices adopted. The genetic improvement of (soft) wheat and the development of milling and baking technologies are closely related: the process of genetic selection has led to the replacement of traditional breeds with new cultivars with reduced height (semi-dwarf), high yields, high protein content (i.e., gluten, which confers elasticity to the dough), to be grown in very different environments, adapted through agronomic interventions (i.e., technological and chemical inputs). This process has improved the yields and the agronomic characteristics [29,30] but has caused a genetic erosion of soft wheat [31,32]. The recovery of traditional/heritage soft wheat varieties and compliance with agro-environmental measures are practices that favor both wild and domestic biodiversity [33]. Traditional and ancient varieties are being re-discovered for their characteristics (i.e., adaptability to pedo-climatic conditions, relative tolerance to fungal diseases, less need for added nutrients, ability to compete with weeds for their tall size), especially coupled with organic/biodynamic farming systems, or low input agriculture [34]. Due to the lack of varieties for organic agriculture, associations of organic farmers in several European countries have begun cultivating landraces and historic varieties, effectively practicing in situ conservation of agricultural biodiversity [35]. The three cases show different approaches towards biodiversity: the global chain supplies conventional varieties, suitable for industrial bread making purposes and has not, up to now, considered to turn to organic wheat supplies. Local and regional cases address different aspects in relation to biodiversity: the regional one links the production of wheat to a set of heritage and locally adapted varieties grown in the region, and requires that farmers comply with an agronomic protocol aimed at minimizing the heterogeneity of the wheat supply, with respect of technological quality requirements (e.g., protein content). In the local case, biodiversity represents an objective in all supply chain’s activities: the farming system, the seeds’ selection, and the way bread is processed are adapted to the features of the raw material, thanks to the flexibility allowed by the small scale. At the same time, biodiversity valorization has become a marketing strategy: beyond the organic certification, the quality features of ancient wheat are communicated to the consumer, via the website and word of mouth, or through the networks in which the farmer is embedded (i.e., joint collaboration with universities and NGOs). Resource use and pollution attributes have been assessed based on LCA indicators available for the local and global cases in published reports [36,37]: global warming potential (GWP in g/CO2 eq. (equivalent) per kg. of bread) and energy use (MJ per kg of bread) are summarized in Table 4.
Despite LCA methodological differences, which do not allow a comparability of the hotspots along the chain stages, data show that the local case has a higher overall GWP per kg of bread. Similarly, the local chain shows an overall higher energy consumption. This confirms available literature stating that large-scale industrial milling and baking have a lower impact on the environment. LCA literature on the bread chain also agrees that the environmental performance is strongly affected by the wheat farming system and the patterns of consumption [38], (the latter not considered in the scope of this study), beyond other minor factors, such as the efficiency of wheat cooling and storage, the milling and the baking technology, the packaging material used [39,40]. For the regional chain this information is not available, although stakeholders declare the intention towards reducing environmental impacts in all stages of the chain, supported by recent investments in more efficient plants and facilities. However, such effort is not coordinated and not explicitly monitored and measured.
Although waste of bread emerges in the literature as a critical issue, especially for distribution and consumption [41], this is not as relevant within the cases considered. The three products have a relatively long shelf life (Table 2). Local and regional are freshly baked breads and sourdough leavening allows a longer shelf life compared to the one obtained through baker’s yeast leavening. Moreover, stale bread can be reused by the consumer for traditional cooking recipes (e.g., soups). Specifically referred to the regional supply chain, the inclusion of contract agreements that make retailers responsible for waste disposal, thus discouraging the production of surplus. The global case is an industrial, sliced bread, which adopts aseptic packaging and the use of mild anti bacteria (i.e., ethanol). In terms of packaging disposal, the global case encourages the recycling of the plastic bag. The regional bread is sold in a paper bag, with a plastic insertion—to allow visualizing the product—thus making recycling more complicated for the consumer. The local chain uses a paper bag, which is also easily recyclable, but no indication is provided to the consumer.

3.1.4. Human Health Performance

The human health dimension is captured by nutritional content and the safety of the product itself. Food safety concerns in bread consumption currently find a resonance in national news, especially following recent scandals on the violation of hygiene norms for bread production. However the three cases are keen on following strict safety requirements, each one in its own context, so no significant differences are found. Nutritional content is a controversial issue because during all steps of bread making, complex biochemical and physical transformations occur, affect and affected by the various flour constituents [42]. The nutritive value of component cereals and flour, transformation and conservation processes impact on the nutritional value of bread [42,43]. Nutritional value of bread depends on multiple factors and there is a lack of consensus on the practices that ultimately impact on the nutritional performance: the choice of grains, the milling technology, the choice of ingredients, salt levels, fat and preservatives all impact on the preservation of the nutritional features of bread. We addressed the quality of wheat and flour, the leavening methods and the ingredients used. On the first aspect, whole grains, as a source of dietary fiber, and the germ, as a nutrient rich component of wheat kernels, have been demonstrated having positive impacts on human health (see, for example [44]). However, flour including wheat germ has a much shorter shelf life so it is hard to handle for industrial purposes. In addition, the wheat germ may also contain pesticide residues, which leads to reconsidering farming practices. Sourdough fermentation can improve the flavor and the nutritional properties of wheat bread because the cereal grain undergoes a series of biochemical processes that ultimately result in the production of bioactive compounds [42,43]. Moreover, during sourdough leavening, the gluten molecule is pre-digested, thus reducing the gluten sensitivity risk for consumers. Reduction of salt and fat in the recipes are also other sensitive areas of concern, although traditional recipes can only be re-adapted to a certain extent in order to preserve the identity of the product. Based on these parameters, local and regional cases show a superior nutritional profile compared to the global case.

3.1.5. Ethical Performance

The attributes considered within the ethical dimension—transparency, responsibility, governance and innovation for primarily non-economic purposes—are difficult to capture through indicators. Wheat is hardly traceable and usually information about where it is from and who produces it is lost as the product moves along the supply chain. The industrialized commodity system determines a loss of information about where, by whom, and under what conditions that wheat is grown and processed. The correspondence between what is declared and what is sold to the consumer can be secured by traceability. There has been a general shift towards some level of identity preservation in the grain sector [45], although staple crops were mostly neglected in comparison to fresh produce and animal products [46]. However, the different levels of identity preservation that could be possible must come to terms with blending practices of millers to achieve consistent quality [47] as well as the size of the supplies needed by each firm. Complete traceability of the wheat-to-bread supply chain requires dedicated storage structures for wheat, in order to ensure wheat separation and identity preservation. Ensuring complete traceability is one of the objectives of the regional supply chain contract and investments are publicly funded. The local chain provides the organic certifications for the farming system: the electronic certificate indicates the identity of the operator, the type or range of products covered by the certificate, its period of validity. When farming and processing happens within the same firm, down tracking is allowed. The EU organic logo is labeled on pre-packed products, e.g. wheat flour, but not on bread. Because of the local distribution of bread directly to the consumer, trust replaces the organic labeling [48]. The global chain, which operates on the international market on the side of supplies, does not encompass, at least for bread wheat, a full tracking down to wheat farmers. Information flows at the level of the supply chain actors develop with varying degrees of intensity depending on the market competition, the degree of integration and the territorial connection among stakeholders. The availability and accessibility of information to consumers on the product is a determinant of informed purchasing decision and includes food advertising, information on labeling, and the growing role of social media. At higher scales, corporate social responsibility gains a key role, allowing a pervasive communication through various channels (global case). For local and regional cases a much less costly communication strategy occurs, mostly based on face-to-face relationships, word of mouth reputation and ultimately trust between producer and producers.

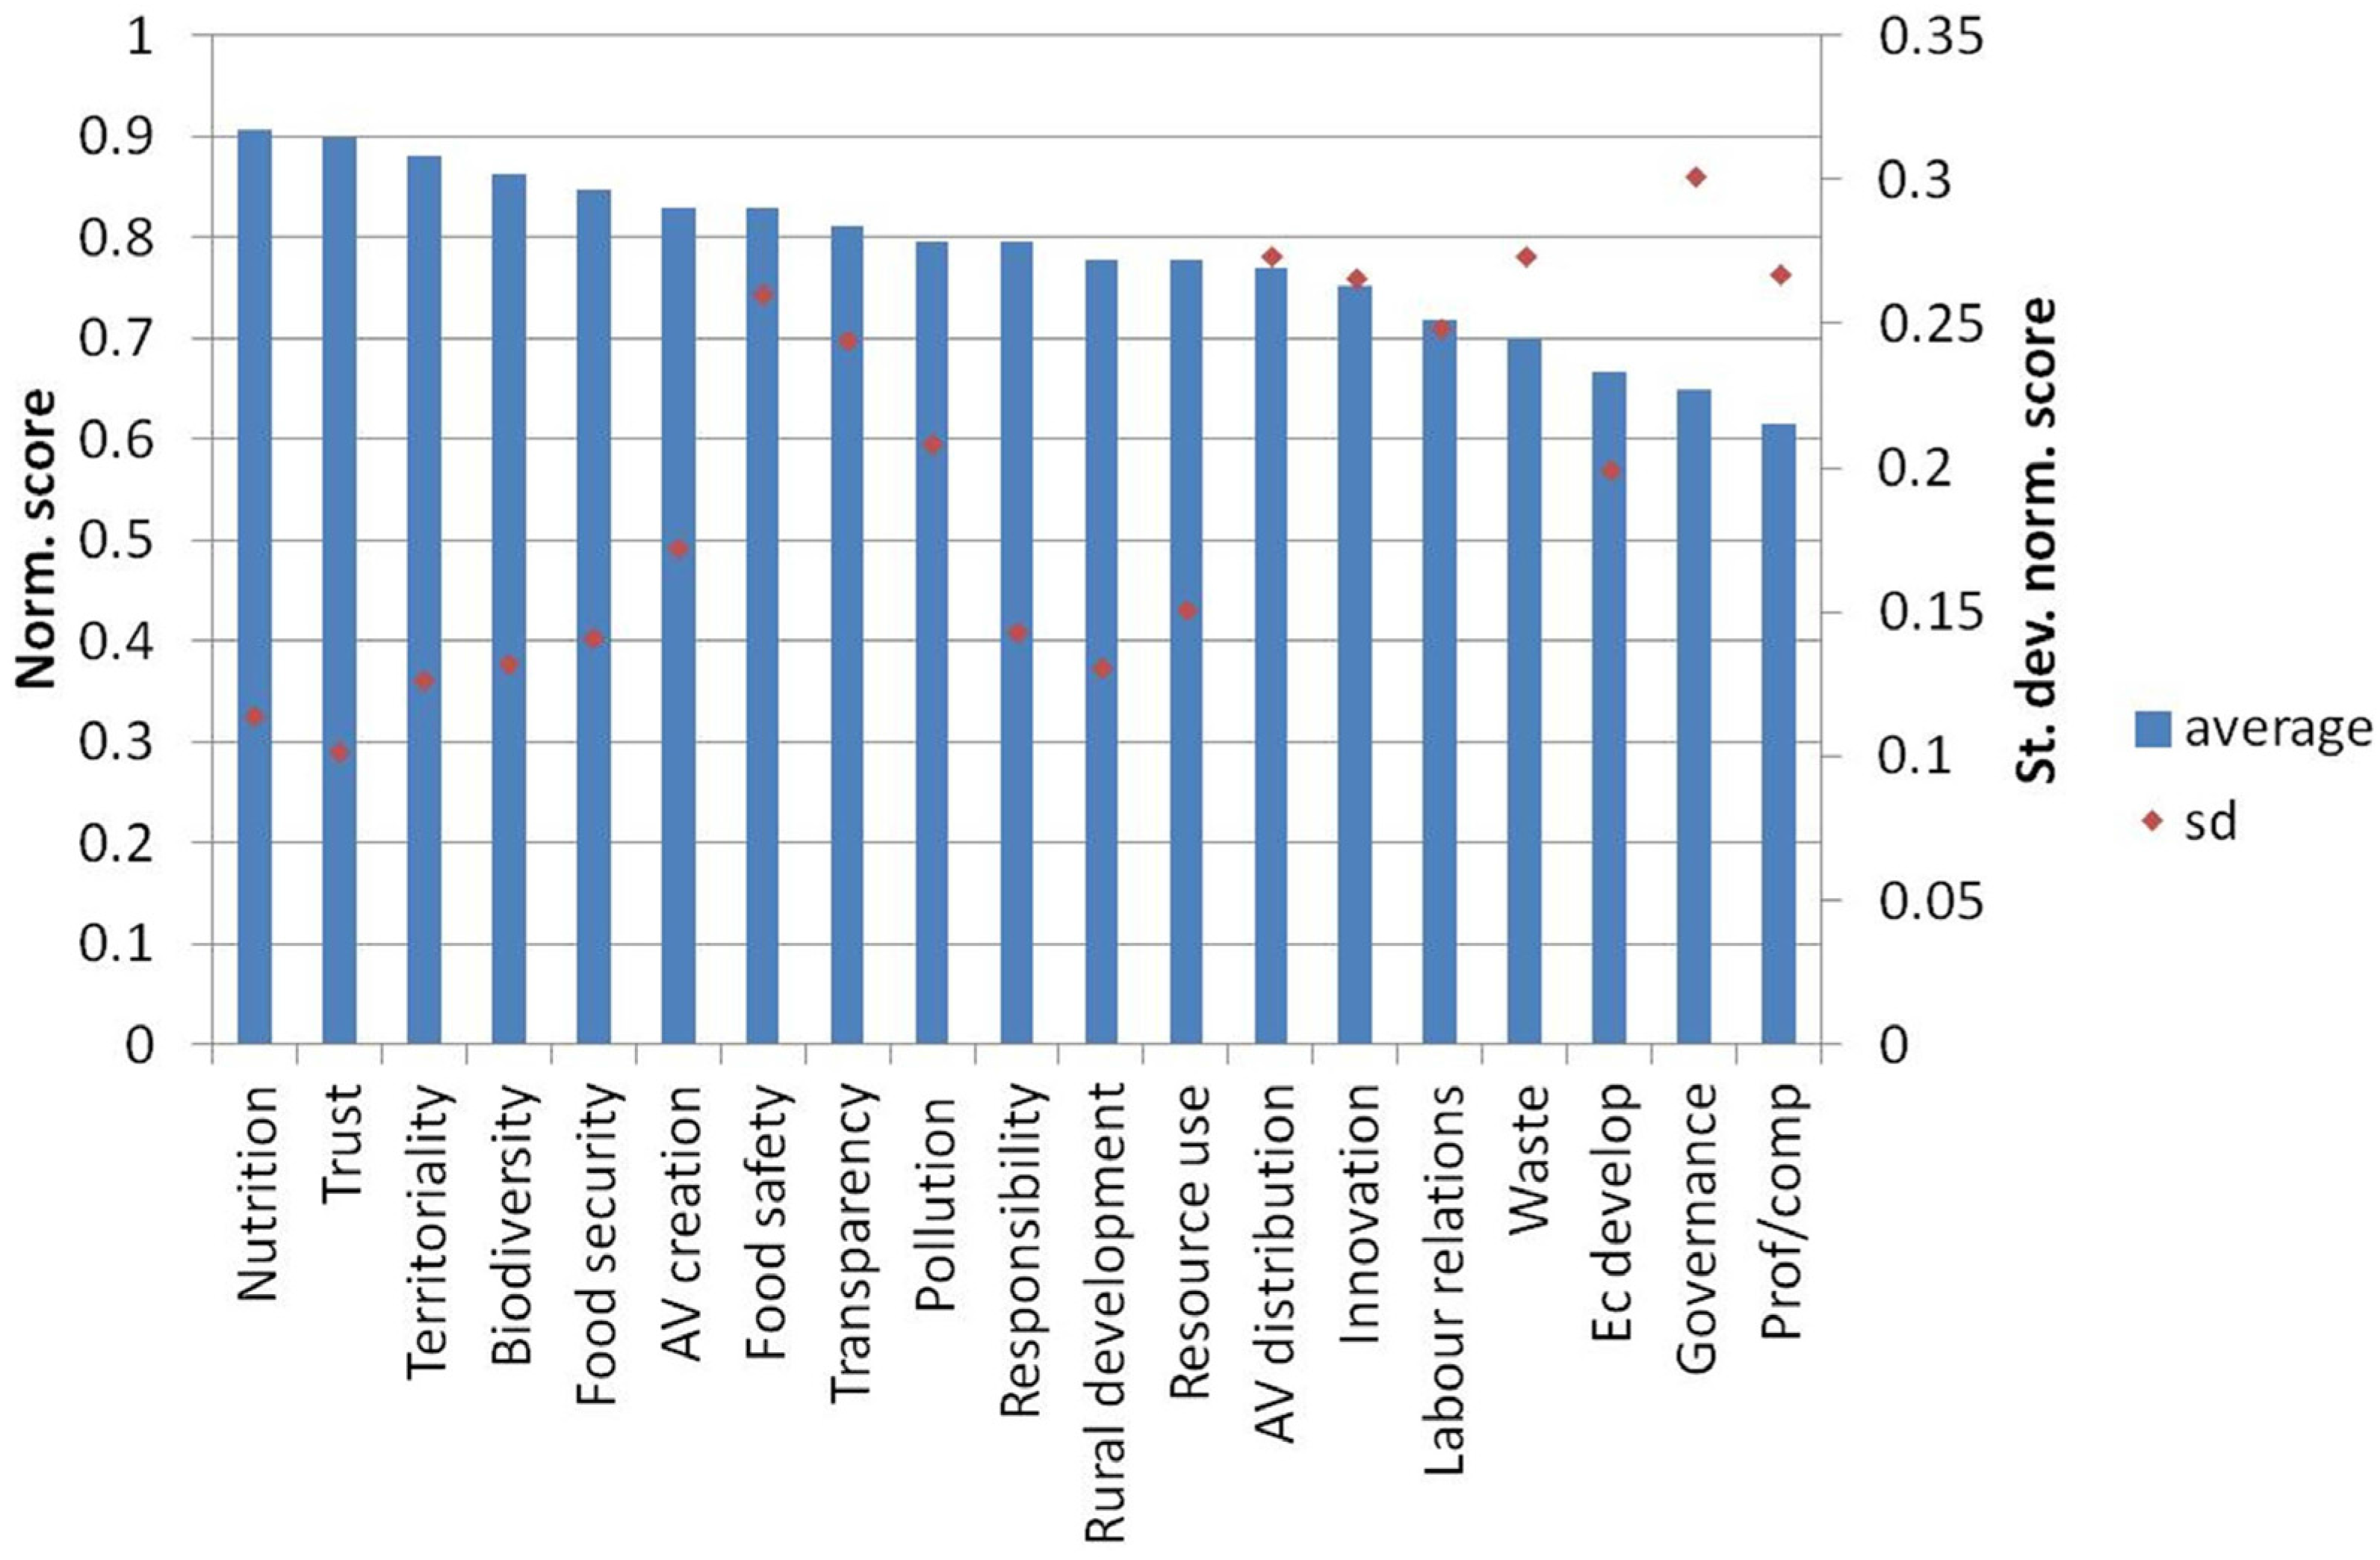
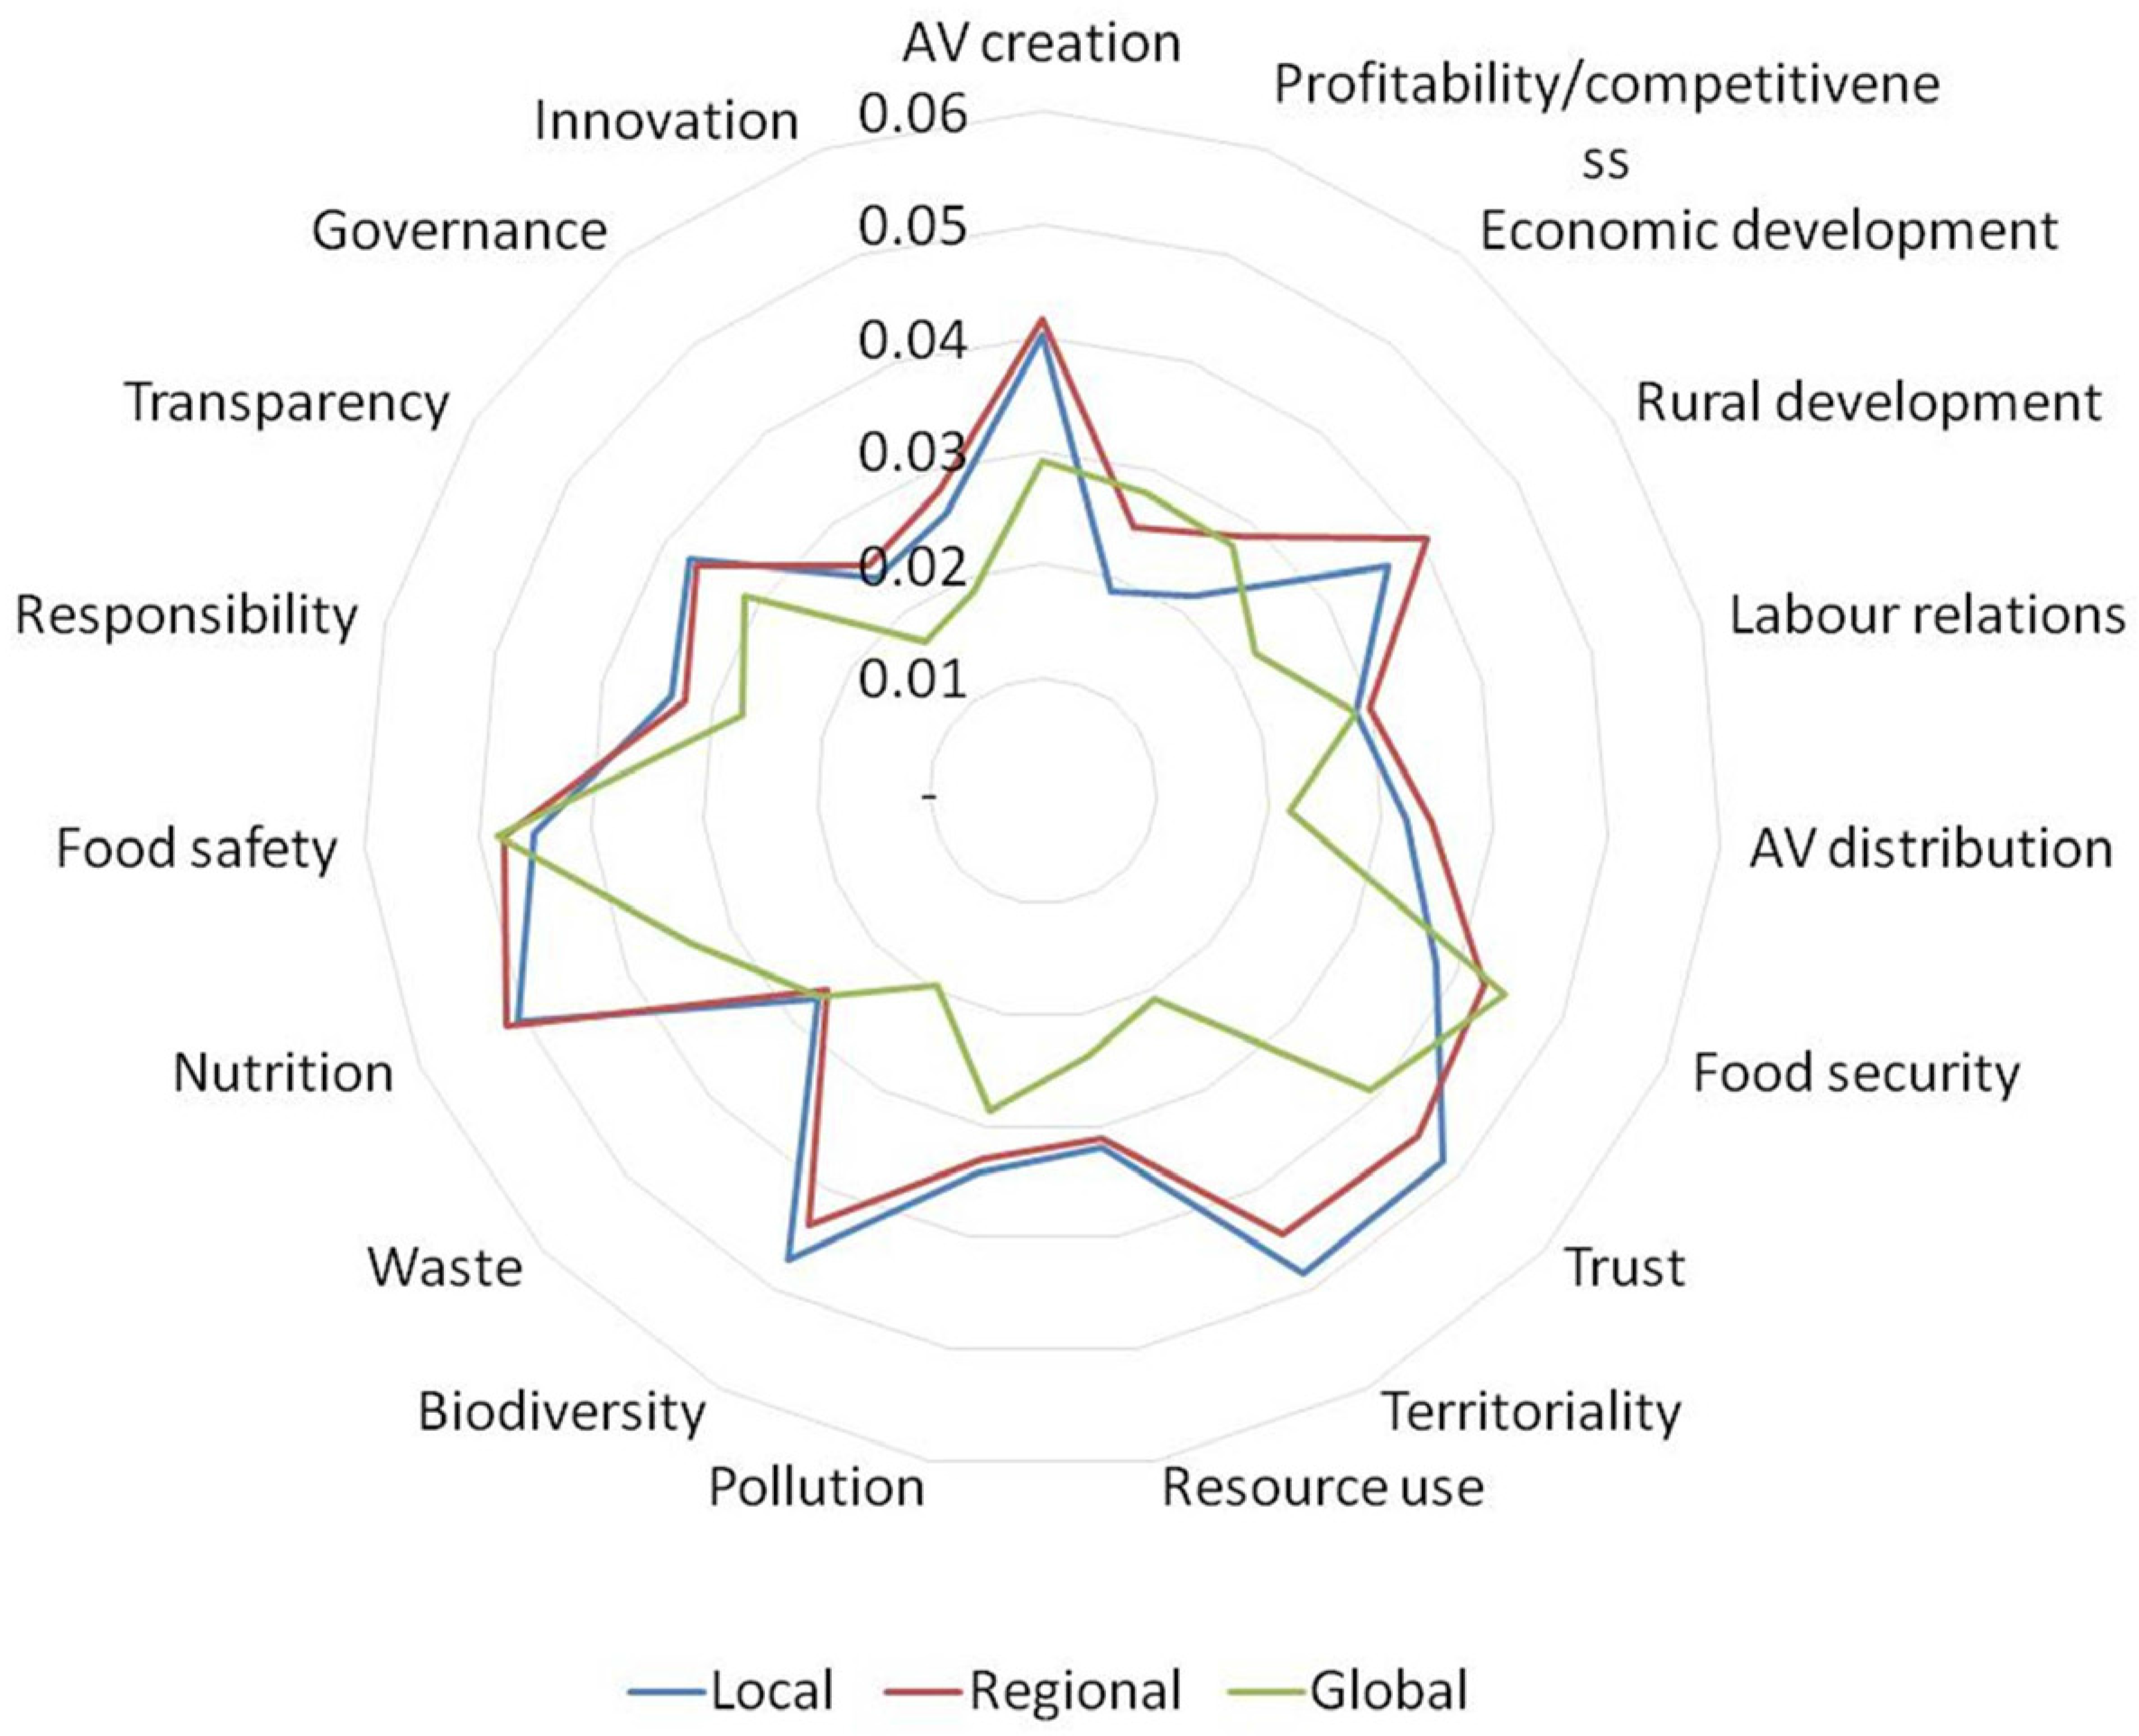
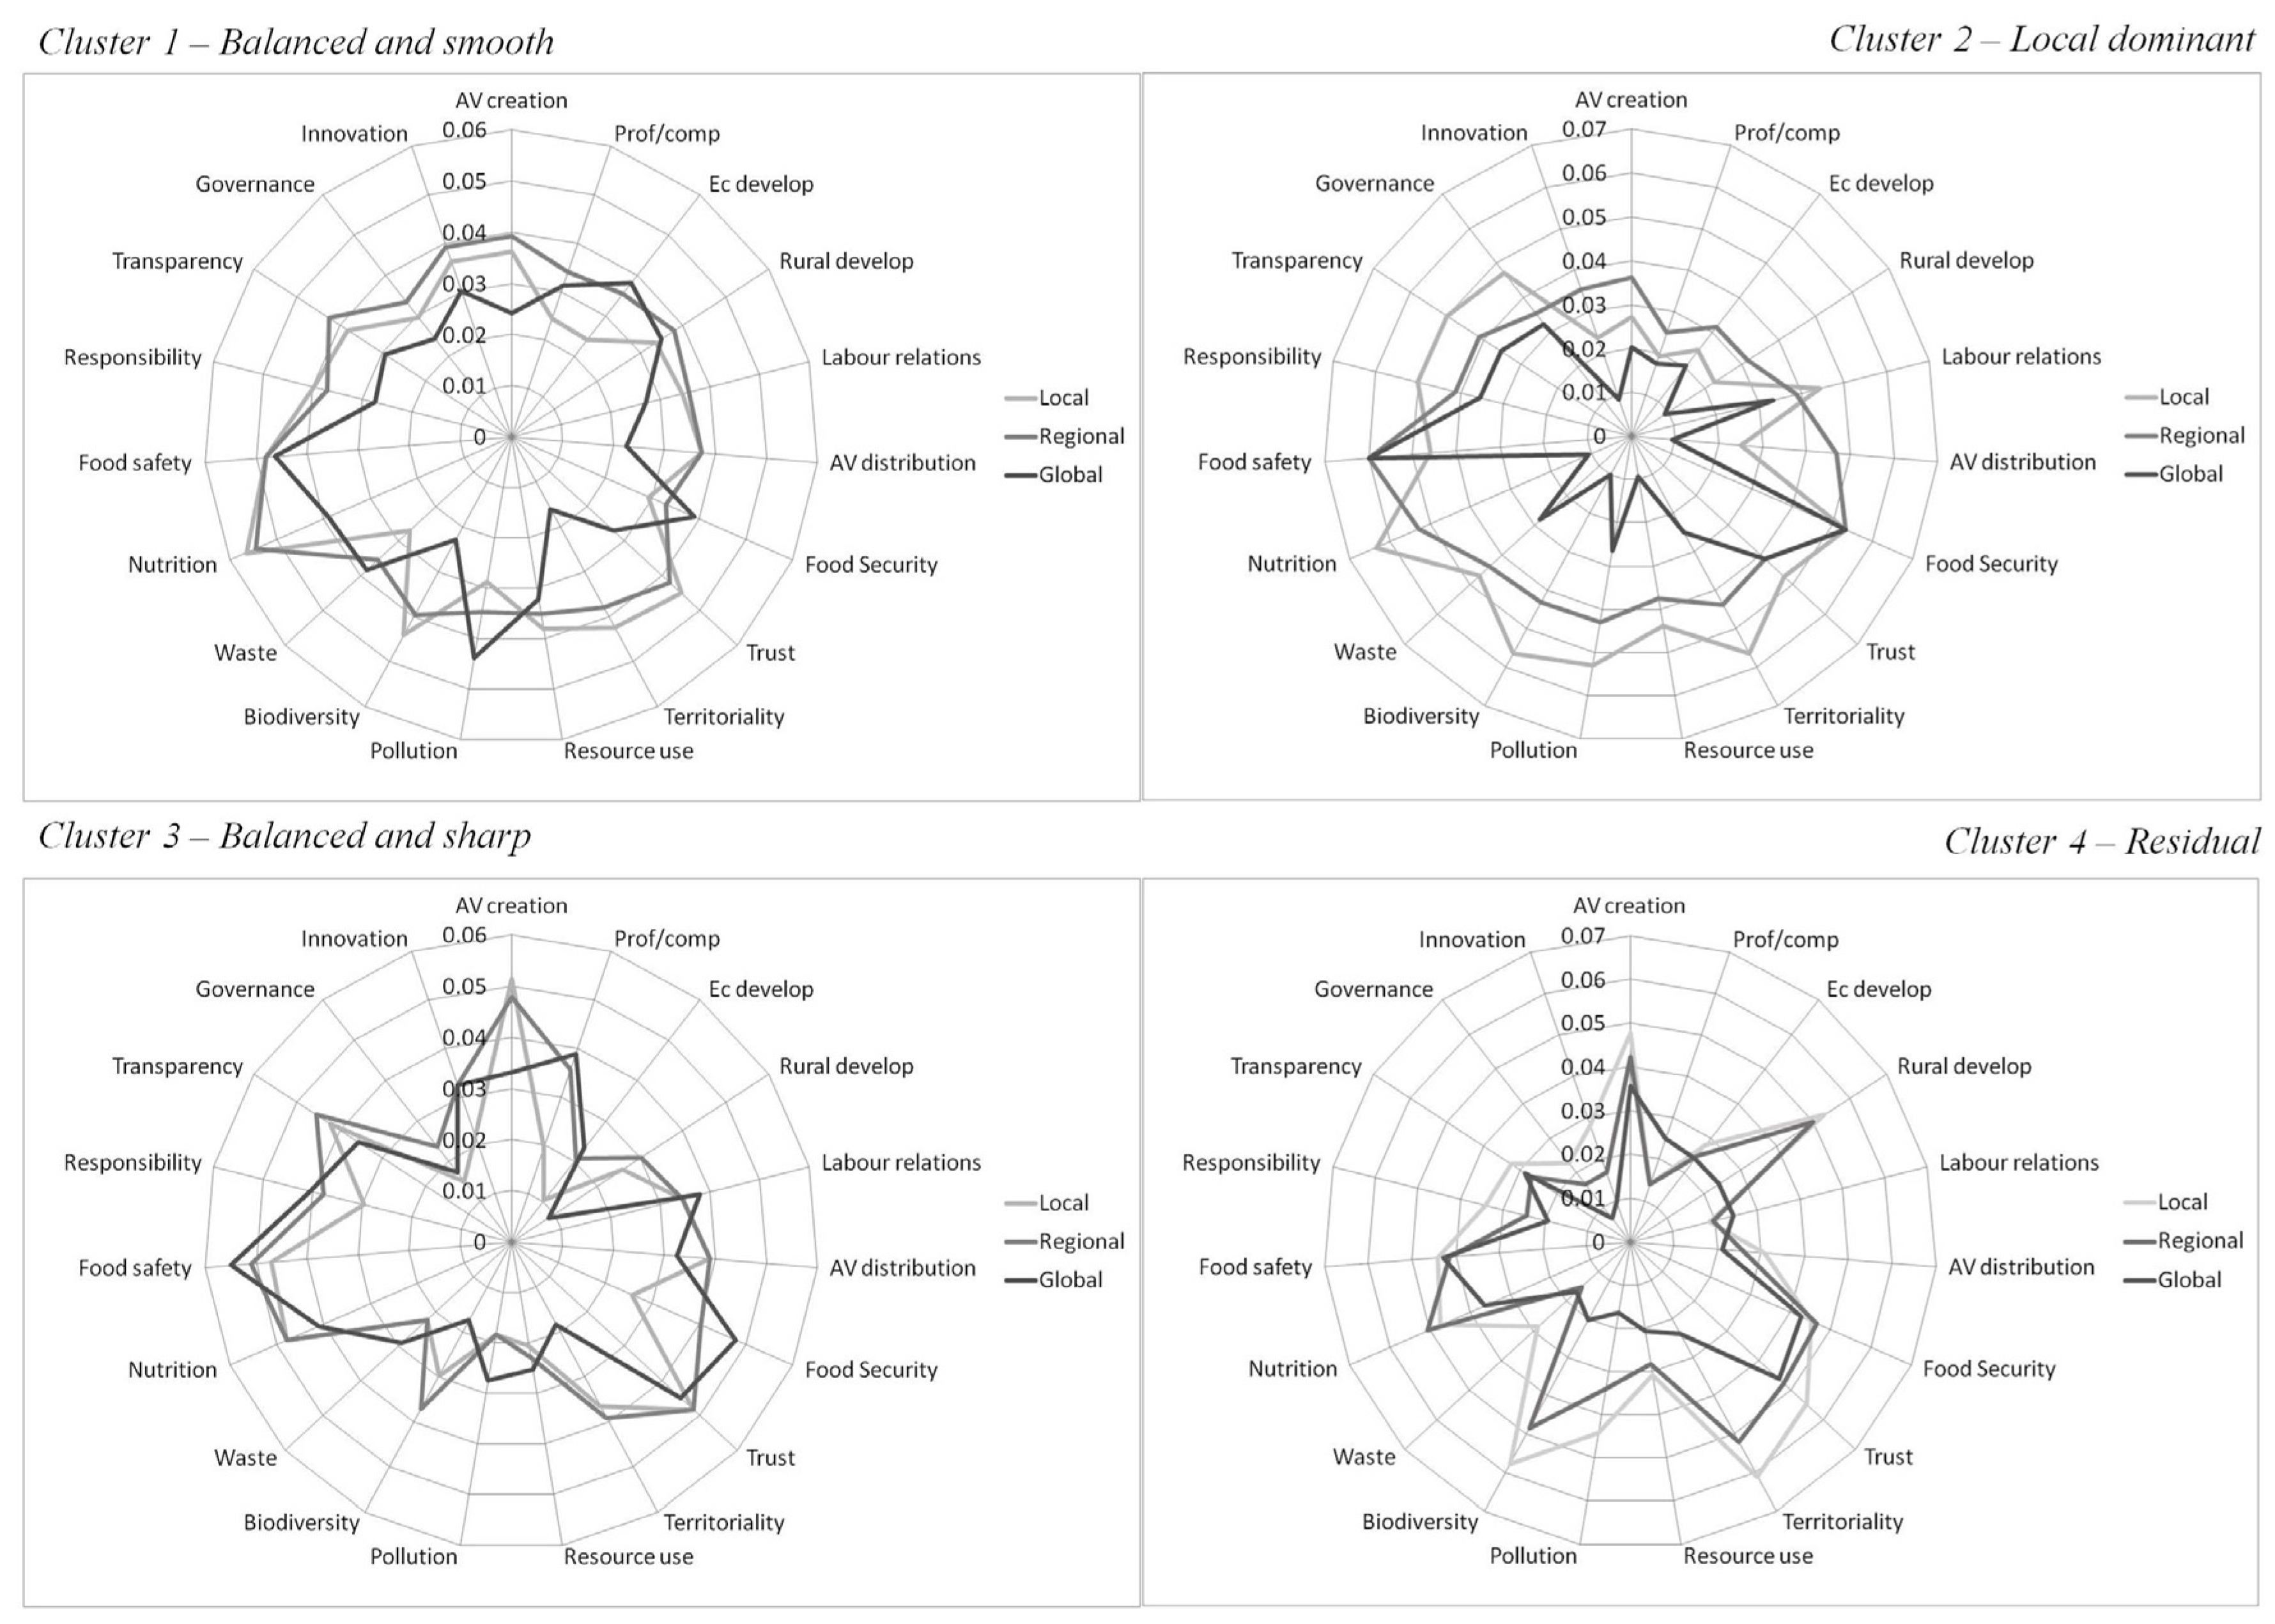
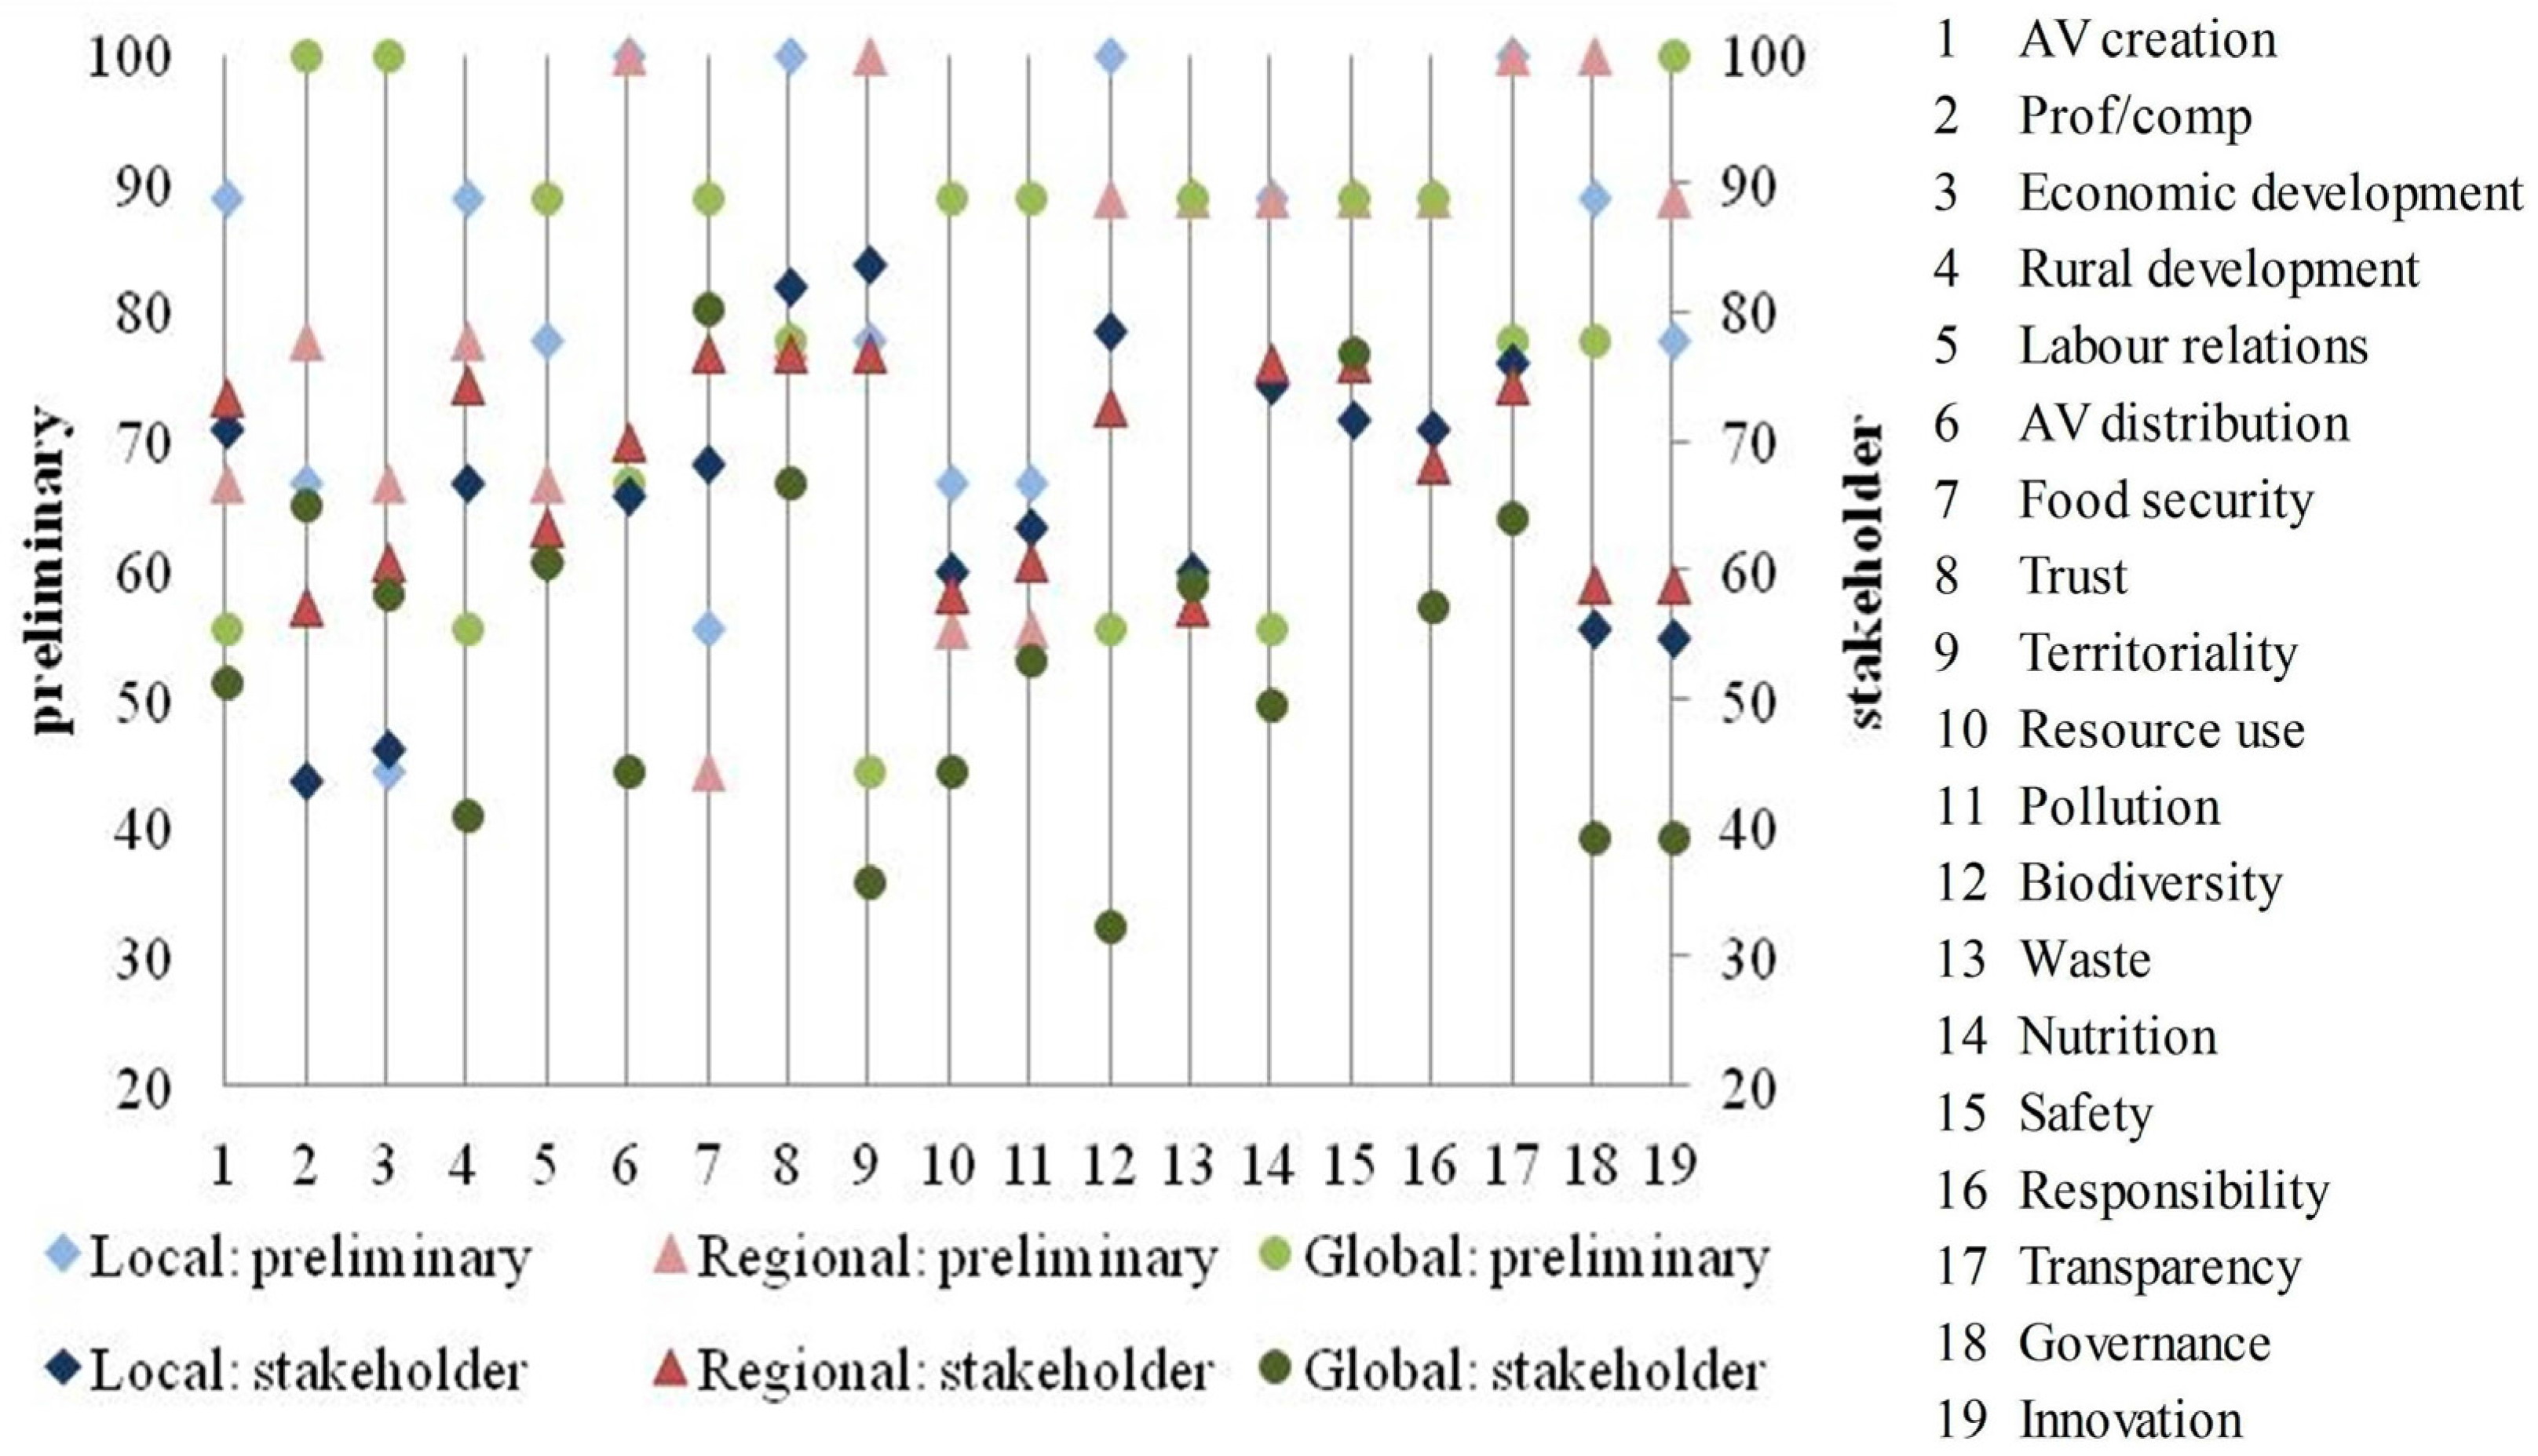
3.2. Results of the Participatory Assessment

3.2.1. Individual Assessments

Figure 2 shows the importance assigned by participants (from 0 to 9) to each dimension of sustainability (minimum, average and maximum values). The averages on each dimension sum up to 1. The most important dimension for participants is “human health”, and it is also the one on which there is most agreement (i.e., closeness between min and max). Economic and environmental dimensions rank second, while social and ethical follow in the back of the ranking. Social and ethical dimensions also show a lower level of agreement among participants compared to the other dimensions.
Figure 3 presents the ranking of the sustainability attributes (normalized scores and standard deviations). The sum of the normalized scores for all attributes is 1. On average, participants indicated nutrition as the most important attribute, followed by trust, territoriality and biodiversity. Overall, there is a higher agreement on these attributes, as shown by the relatively lower level of variability in the answers. Disagreements on the priority of attributes ranked are higher in the lower part of the ranking, in particular for waste, governance and profitability/competitiveness.
The web diagram in Figure 4 shows the results of the multi criteria analysis on the performance of the three chains, weighted by stakeholders’ prioritization of attributes. The multi criteria aggregation is the result of the weighted sum of the importance of each attribute and the perceived performances.
The weights represent the relative importance of the attributes in conducting a sustainability assessment of the bread chain and are calculated taking into account the hierarchical structure of sustainability dimensions and attributes, as presented in Figure 1 (i.e., the importance of each attribute is multiplied by the weight assigned to its sustainability dimension, which, in turn, represents a share of the overall sustainability performance). Weights are then used to aggregate the normalized performance scores of different supply chains relative to each attribute. Overall, local and regional chains perform relatively better than the global chain on most attributes and show very similar profiles, with minor differences. Attributes on which the global chain performs better, or as good as the others are competitiveness, labor relations (equal score), food security (i.e., economic and physical access to the product), waste and safety (equal scores).
Provided this is a result considering the average of responses, the next step is to understand how the results on the performance of the chains vary in relation to views and values of the actors. We grouped stakeholders with similar values to identify agreements and diversities between stakeholder sub-groups. After clustering stakeholders based on the proximity of the answers to questions on the weights, we calculated the weighted performance of chains within each group.
Based on hierarchic clustering, we have identified four clusters (see Appendix, Table A1 for cluster’s composition). Figure 5 represents the weighted performance of the three supply chains as expressed by the four clusters of stakeholders. A synthetic label identifies each group.
The first cluster is labeled “balanced and smooth”: four stakeholders compose this cluster and they span across local, regional and global categories, in a relatively balanced way. This group reflects the average results across stakeholders. The three chains show some small differences in the performance but none is overtaking the others markedly: local and regional cases are similar across the attributes, particularly successful on nutrition, biodiversity, trust, territoriality, transparency and distribution of added value, while the global case is more successful in terms of pollution, growth and employment and food security. The second cluster is labeled “local dominant”, composed by a milling company and the Rural Seed Network (an NGO): according to these stakeholders the local case shows a clear dominance in terms of environmental and social performance while the regional case performs better on the economic dimension. According to this group’s perception, the global case is dominated in all attributes, except for “safety” on which it aligns with the other chains. The third cluster is “balanced and sharp” and it is composed by a large-scale baker and the regional farmers’ consortium: the performances expressed do not show a dominance by one of the chains, as in the first cluster, but performances are more diversified. The global chain’s performance here is best for the larger set of attributes compared to the other groups (i.e., competitiveness, labor conditions, food security, pollution and resource use, food safety and waste). The fourth cluster can be considered residual. Overall, the judgment of these stakeholders tends to favor local and regional cases: although a large retailer is also part of the group, the values of regional and local stakeholders tend to refer to rural development, biodiversity, territoriality and nutrition as priorities on which a more “locally based” supply chain are considered to perform better.

3.2.2. Comparison of preliminary and stakeholder assessment

In this last section we compare the preliminary assessment with the individual assessment by stakeholders on the bread chains’ performances and highlight areas of consensus that emerged during the workshop collective discussion. Figure 6 represents how the performance assessed in the preliminary phase changes according to the views of the stakeholders addressed. The performance attributes are presented on the horizontal axis, while the vertical axes indicates the performances (in percentage values) of the preliminary assessment (left) and stakeholder assessment (right).
In relation to added value creation, which was the most important within the socio-economic dimension, local and regional chains perform better than global, based on available evidence and stakeholders’ perceptions. Conversely, the global chain confirms as best performing on profitability, contribution to economic development and food security. On rural development and distribution of added value, the local and regional cases are confirmed as best performing. Among social attributes, stakeholders indicate that trust is important but must be conceived differently in different chains, in relation to scale and distance among supply chain steps. The way trust is framed ultimately depends on the expectations of the consumer: the face-to-face relationship between a local producer and a local consumer is not the same relationship that the consumer has with the producer in the global chain. This is well explained by the words of the global chain stakeholder:
Single attributes can be measured fairly objectively, in principle. But expectations that consumers have on these products are very diverse. When a consumer purchasing a local product is betrayed on the local origin of raw material, consumer confidence drops. The expectation on our products is completely different, at most the national origin of raw material could be expected (but not guaranteed or certified). Therefore, the reference for the assessment must be different.” (…) “The importance of the single parameter chosen for the assessment changes across different chains: in the local case the promise is the use of an ancient variety, in my company a major expectation is on good taste and standardization: my products need to be absolutely equal. The promise is different. The parameters become more or less relevant depending on the promise that I make (…) I can measure objectively some indicators, but then the promise that I make is what actually matters.” (Global chain stakeholder, Authors’ translation).
In relation to the environmental dimension, local and regional cases favor biodiversity based on stakeholder opinion—including the global chain’s ones, with agreement among stakeholders. Similar considerations can be made for waste: stakeholders assign a lower priority on this attribute and the three chains show similar, relatively high performances, although bread types and chains are very different. Nonetheless waste remains a controversial issue: during the discussion it was remarked that “waste is an issue that always concerns others”, and responsibilities are hard to identify. In relation to pollution and resource use, there isn’t a clear agreement: LCA data indicate that the local chain impacts more than the global chain, while two clusters of stakeholders perceive the global supply chain as more polluting and consuming resources than the local chain. This divergence suggest that environmental performance is still a controversial area. The tension on this aspect, is well expressed by one of the global chain stakeholders, who remarks the relevance of life cycle assessment:
(…) CO2 emissions, is a parameter that-like it or not-will be crucial to the debate in the next five years, at least. And this parameter indicates that it is not necessarily true that small/local is better overall. For example the Canadian wheat with good agricultural practices and transported by ship is better than the Sicilian wheat. The way you grow the raw materials is very relevant and farming practices are crucial. When we get to this kind of discussion, what is expected is very different from the reality, because the variables affecting the results are different from those to which we normally think”. (Global chain stakeholder, Authors’ translation).
In relation to the health dimension, bread nutritional value in the local and regional cases is perceived to be superior to the global case, (or at most equal, as stated by global stakeholders). Although incontrovertible evidence is not available in this regard, the parameters identified in the preliminary analysis help to qualify such difference. It must be emphasized that nutrition represents one of the most important grounds for innovation, for all chains considered. On safety stakeholders share a similar perceptions however in more than one cluster, the global chain is perceived as able to perform better on this attribute than the other cases.
In relation to the ethical dimension, transparency, traceability and responsibility were widely discussed:
“Certification needs increase with scale and complexity. The necessity of standard production processes (at the industrial level) is part of a responsible management of processes. If my production line goes “out of the standard” the risk is to throw away tons of product. The consequence is the need for standardization. This is not required by the small bakery, which is much more flexible”. (Global chain stakeholder, Authors’ translation).
Full traceability along the wheat-to-bread chain is anyhow difficult and expensive to achieve, as the length of the chain and complexity increase:
“Traceability means transparency and safety and it is important for the consumer, but it also implies additional costs, and this impacts on affordability for the consumer”. (Retailer, Authors’ translation).
However, it was also clearly remarked that:
“Often, product price is very high (i.e., price per kg of bread) and not justified by any specific quality, and without any information either”. (Regional chain stakeholder, Authors’ translation).
Lastly it was noticed by the participants that the selected supply chains capture context-specific best practices: however, the analysis overlooks a more spread and undefined—but perhaps more representative—“generic bread chain”, with less quality features but more problematic areas. For instance, waste or safety issues are relevant for the bread sector but did not emerge in our cases.

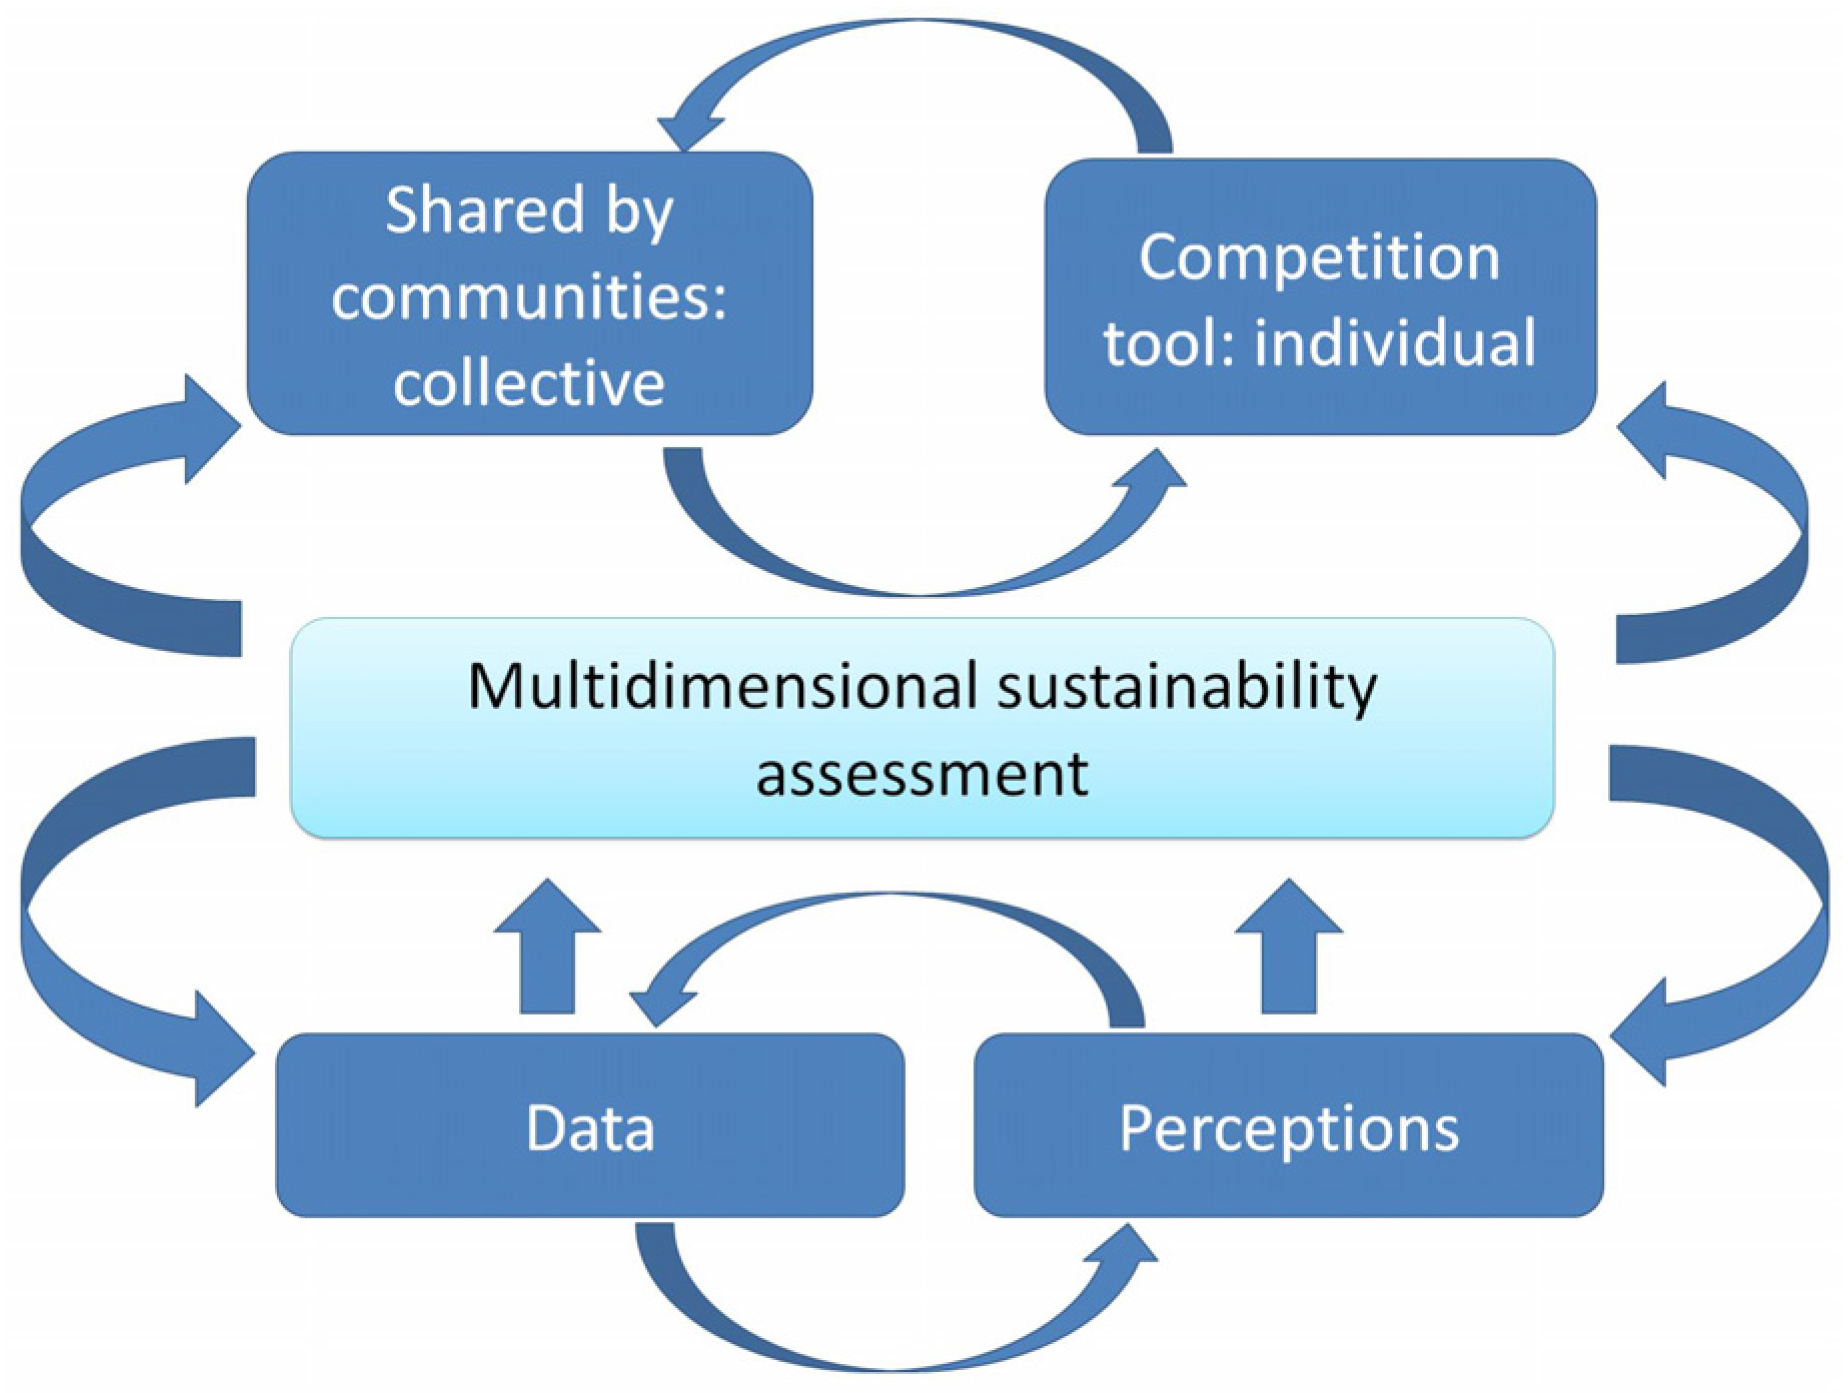
4. Discussion: Main Sources of Challenge to Sustainability Assessment

During case study development, five main challenges in sustainability assessment of food supply chains clearly emerged. In this paragraph we briefly discuss them in relation to case study findings and relevant available literature.

4.1. The Complexity of Food Supply Chains

Agri-food chains comprise social, ecological and technological connections that require integrated research approaches in order to fully capture relevant distinguishing features [49]. The simplistic and ambiguous distinction between “local” and “global” food chains of production and distribution as abstract typologies [50] is, per se, scarcely helpful in assessing sustainability performance. The physical/geographical distance between production and consumption is only one possible criterion, captured by the “food miles” metric [51], which anyhow shows critical limitations, revealed to be oversimplified and of limited use, or, at worst misleading [52], especially for consumers [53,54,55]. Furthermore, local and global are no clear-cut categories, as local chains entail global elements and vice-versa, giving rise to hybrid situations. Even the most local chain relies to some extent on global inputs (such as fuel and machinery) to be able to function, as emerged in our cases study chains. In our assessment, we made an effort to go beyond distance between supply chain stages and capture other relevant features that can be used to qualify the complexity of context specific food chains, such as the know-how and kind of resources used in the production process [56], the coordination and organizational structure along the chain [57,58], and the role of a more or less standardized identity of the product [59].

4.2. The Multidimensionality of the Sustainability Concept

Food chains can have impacts that require the consideration of multiple dimensions, whereas available research largely focuses on environmental and economic concerns [14]. Social aspects and also the integration of the three dimensions of sustainability are still rare [60]. Beyond environmental and economic dimensions, social, human health and ethical issues are attracting interest [61,62,63]. At the same time, this poses considerable methodological challenges because the inclusion of more criteria inevitably complicates comparability and determines tradeoffs. The heterogeneity of elements must be dealt with through trans-disciplinary knowledge development [18]: this is the reason why we referred to expert knowledge in order to address attribute specific performances (such as biodiversity or nutritional value of bread). Moreover, several tradeoffs between dimensions and attributes clearly emerged in the case study analysis: for example there is an unresolved debate about delivering biodiversity (environmental performance) and maximizing productive output (economic performance) across the chains. Another example concerns the health dimension: in different chains, the practices adopted to safeguard the nutritional value of ingredients, semi-final and final product are often constrained by scale, feasibility of large volumes and continuity (in quantitative and qualitative terms) of input supplies. And furthermore, a relevant tradeoff was indicated between traceability and prices—thus affordability—for the consumer: however it was also noticed that often high market prices are not justified by more available information to the consumer.

4.3. The Pliability of the Sustainability Concept

Legitimate but differing perspectives tend to shape the debate on sustainability in some direction and the higher the uncertainty the stronger the dispute in terms of value judgments. Sustainability has been defined as a “consensus frame”, or a concept that finds broad resonance and consent, but it can be used to make diverging, and sometimes conflicting, claims [64,65]. Sustainability is a concept that no one can be against, therefore it is used by a broad range of actors, even when holding contradictory positions. Behind this apparent consensus, conflicts, in the form of different frames and corresponding claims, may lie hidden. Although many actors use the sustainability concept, what they mean by the term, their causal analyses, and which forms of action they champion differ strongly [64]. This was a central issue in our study, in which clusters of stakeholders with heterogeneous views on what matters as sustainable were identified. For example, the “local dominant” cluster considers chain A as the best performing on all attributes, including profitability, competitiveness and labor relations, while other clusters consider performances of different cases as complimentary (as in the “balanced and smooth” cluster). In terms of priorities, while most stakeholders agree that nutrition and trust are most important attributes, it emerged during the discussion that these concepts have different meanings for different chains. A higher variability in answers—thus less agreement among chain stakeholder—was found for attributes in the lower part of the ranking (Figure 3), for example for distribution of added value which is a central refrain in the agricultural policy debate and sustainability.

4.4. The Dynamicity of Sustainability Objectives

The definition and the priority among sustainability dimensions and attributes are in a continuous process of change and what is considered sustainable today may not be so tomorrow. Handling sustainability requires the anticipation of long-term impacts of the current state of action and possible future developments. Consequently, the definition of “what counts as sustainable food” has become an object of competition among market players, corporations, practitioners, in relation to private and public policy making. The technical assessment of (mostly environmental) impacts through Life Cycle Analysis (LCA) represents an evolution of private standard setting, whose proliferation was initially led by corporate retailers to regulate product quality, safety and “ethics,” but also to manage supply chain risks, improve overall brand images, and compete on other factors beyond price. For example, partiality (standards usually focus on specific stages of the supply chain) and complexity (they represent an extra burden for firms) are overcome by the increased objectivity, completeness and (apparent) simplicity offered by foot-printing [66,67,68]. In this sense, “foot-printing” can be interpreted as a tool for governance [69]. The product footprint governs not just by establishing metrics of comparison and progress but also by identifying the “hotspots” within product life cycles, where measurable environmental impacts and thus potential improvement opportunities are greatest [70].
The global chain case is a well fitting example, where the baking company periodically discloses Environmental Product Declarations (EPD) to show improved eco-efficiency [71], to engage in supply chain governance and improve cooperation with stakeholders [70,72]. For the other supply chains stakeholder this would require an investment, which is not (yet) at their reach.

4.5. The Governance Implications of Sustainability Assessment for Food Supply Chains

Following from the previous point, we can state that sustainability assessment has fundamental implications for the governance of societies. Voss et al. [13] acknowledge the uncertainty and complexity around sustainability and argue that sustainable development is not an objective to be reached once and for all but is a “reflexive process”. The “reflexive governance” concept has been developed to tackle “wicked” problems like sustainability [73]: governance is intended as “the characteristic processes by which society defines and handles its problems” [13] and is the result of the interaction of many actors who have their own particular problems, define goals and follow strategies to achieve them. Reflexivity refers to the “continued learning in the course of modulating ongoing development, rather than towards complete knowledge and maximization of control”. Reflexive governance hence indicates “a mode of governance where cognitive procedures are designed to create feedbacks on multiple regulatory frameworks in order to influence actors’ beliefs and norms” [74] (p. 1). In the “reflexive governance framework” system analysis is a precondition to the formulation of objectives and the implementation of strategies for sustainability improvement. Some suggestions can be taken from this approach to deal with problematic features hindering system analysis, goal setting and strategy formulation. For example, the heterogeneity of elements must be dealt with trans-disciplinary knowledge development; the uncertainty about transformations and dynamics over time acknowledges the need for experimentation and adaptivity. Participation in iterative processes is important both for goal and strategy setting, provided that the capacities to influence transformations are distributed among actors.
In our participatory assessment we have been mindful of the reflexive governance approach by setting the conditions through which problem perceptions, assessment criteria and action strategies of different actors were exposed to each other. During the workshop, actors had the chance to begin to adapt their perceptions, criteria and strategies [13] (p. 7), reflect on the modes of problem treatment, the types of strategies that are applied to search for solutions and ultimately pursue sustainability. However, the scope of our study is limited to an initial step. Further research work would be needed to monitor and assess to what extent a participated sustainability assessment could actually lead to changed and more sustainable and innovative practices.

5. Conclusions

The development of a comprehensive and transparent approach to analyzing all sustainability dimensions in a coherent way remains a major challenge, despite increasing efforts by academics and practitioners. This study has addressed and experimented with the assessment of sustainability performance in light of the diversity of visions around what is to be considered sustainable. We have adopted a case study approach with the aim of building theoretical propositions from multiple cases to be explored by further research [19,20]. The cases analyzed are diverse context-specific wheat to bread supply chains, which can be considered best practices, each one in its own realm. Beyond collecting information on the sustainability performance in relation to five sustainability dimensions, we have addressed stakeholder to align the visions and the multiple meanings of sustainability. The comparison was not aimed at establishing a ranking of “winners and losers” but rather at overcoming a priori positions on “what counts as sustainable” [70], enriching the understanding of the attributes to be used to reflect the existing diversity of legitimate perspectives. Stakeholders’ involvement in sustainability assessment is necessary to understand the complexity of the problems of sustainability governance, the reasons why overcoming tradeoffs and barriers towards change is a slow and controversial process. Based on case study observation, three key propositions can be suggested to contribute to food chain sustainability assessment. These are summarized in Figure 7.
Proposition 1. 
Sustainability Assessment in the Agri-Food Sector is a Competition Ground and a Governance Tool for Firms. Sustainability Assessment for Self-Diagnosis Purposes should be Comprehensive and Multidimensional
At firm level, comparison between different supply chains can be used to identify best practices and benchmarks. Sustainability assessment is a way of increasing self-awareness and diagnosis by stakeholders on the practices adopted and on their own performance. The need to optimize their processes on the chosen set of indicators of performance generates, as a side effect, the risk of neglecting those dimensions of sustainability that are more difficult to define and quantify in an uncontested way, i.e., those referring to cultural values and ethical considerations. A comprehensive sustainability attributes “checklist” should be adapted for self-assessment by each chain at different levels. This is particularly relevant for the attributes within the social and ethical dimensions: how to consider the “promise” that is made by the specific supply chain in the assessment remains a considerable challenge.
Proposition 2. 
Identifying Shared Parameters and Indicators on which Producers, or a Community of Reference are Asking to be Evaluated is an Issue of Concern
To increase the degree of validity of sustainability assessment, public institutions should ensure that it is based on participation, transparency of different positions and on a dialogue between science and society. For example, the environmental impacts emerged as an area of dissent between stakeholder thinking and the results of LCA: indicators on impacts per kg of product may not be the most salient way of capturing environmental attributes. Moreover, the availability of data on the environmental dimension leads to the consequence that those who can afford data production and monitoring may be judged better in terms of performance, thus becoming a matter of power imbalance [70]. Efforts are needed to establish shared environmental indicators and to encourage environmental assessment also in small-scale enterprises.
Proposition 3. 
Multidimensional Sustainability Assessment must Acknowledge that What is Technically Measurable is a Part of Reality, and That Improvement of Measurability is a Process “Fed” by the Study of Non-Measurable Outcomes. The Combination of Hard and Soft Indicators should be further explored
Although there is an external perception on the performance of the chains, often data are insufficient to corroborate such perception. Combining science-led evidence with socio-cultural values contributes to sustainability assessment but also poses a considerable methodological challenge.
The methodological approach adopted has some strengths to be emphasized: the first concerns the fact that group discussions are inevitably influenced by individuals or clusters, as indicated by Starr [75]. This bias is overcome by controlling stakeholder opinions through individual questionnaires filled independently and based upon a common set of information provided initially. This also helps to reduce the influence by the facilitator who must lead the discussion and helps stakeholder to avoid answers based on “official positions” represented in public and to go beyond the participants’ contingent interest. Secondly, the reliance on an integration of tools compensates some limitations of each instrument taken singularly. For example, multi criteria assessment allows identifying tradeoffs between attributes and performances, avoiding dominant positions and forced consensus. Thirdly, cluster analysis on priorities expressed by stakeholders allows overcoming unbalanced composition of experts, as clusters create homogeneous groups, independent from the number and degree of expertise of the participants. Eventually, it allows to identify, and marginalize if necessary, inhomogeneous stakeholders. Some limitations of our work also need to be acknowledged: for example the wide the set of attributes submitted to stakeholder increases the difficulty in understanding the meaning of each one. Moreover, we asked stakeholder to assess the importance of each sustainability attributes: the collective discussion suggested that it would have been useful to ask for a judgment on the importance of attributes for each chain, in order to take into account how the “promise” by each chain changes. However, this would pose a problem regarding the actual ability of stakeholders in answering this question, being limited by their own specific experience.

Acknowledgments

The research has received funding from the European Union’s Seventh Framework Programme for research, technological development and demonstration under grant agreement number 311778, Global and Local food chain Assessment: a Multidimensional performance-based approach (GLAMUR) project. Further information is available on the website http://www.glamur.eu/. The views expressed in this paper are solely those of the authors.

Author Contributions

All authors conceived and designed the research; Fabio Bartolini and Francesca Galli analyzed the data; Francesca Galli wrote the paper; all authors revised the drafts.

Conflicts of Interest

The authors declare no conflict of interest.

Appendix

Table A1. Workshop participants and clustering.
ClusterIdOrganization
11Tuscan Bread Consortium
14National Association for industrial bakery
15Food technology expert
17Local case collaborator
22Regional case milling company
29NGO (Rural Seed Network)
38Regional consortium of farmers
312Representative of the global baking company (Barilla)
46Terre regionali Toscane, regional farm (public ownership)
411Solidarity Purchasing Groups
413Regional association of bakers
43National retailer (Coop)
410Local association of bakers

References

  1. Bebbington, J.; Brown, J.; Frame, B. Accounting technologies and sustainability assessment models. Ecol. Econ. 2007, 61, 224–236. [Google Scholar] [CrossRef]
  2. Ness, B.; Urbel-Piirsalu, E.; Anderberg, S.; Olsson, L. Categorising tools for sustainability assessment. Ecol. Econ. 2007, 60, 498–508. [Google Scholar] [CrossRef]
  3. Seuring, S.; Müller, M. From a literature review to a conceptual framework for sustainable supply chain management. J. Clean. Prod. 2008, 16, 1699–1710. [Google Scholar] [CrossRef]
  4. Ostrom, E.A. A General Framework for Analyzing Sustainability of Social-Ecological Systems. Science 2009, 325, 419–422. [Google Scholar] [CrossRef] [PubMed]
  5. Ilbery, B.; Maye, D. Food supply chains and sustainability: Evidence from specialist food producers in the scottish/english borders. Land Use Policy 2005, 22, 331–344. [Google Scholar] [CrossRef]
  6. Gasparatos, A. Embedded value systems in sustainability assessment tools and their implications. J. Environ. Manag. 2010, 91, 1613–1622. [Google Scholar] [CrossRef] [PubMed]
  7. Gasparatos, A.; El-Haram, M.; Horner, M. A critical review of reductionist approaches for assessing the progress towards sustainability. Environ. Impact Assess. Rev. 2008, 28, 286–311. [Google Scholar] [CrossRef]
  8. Gasparatos, A.; Scolobig, A. Choosing the most appropriate sustainability assessment tool. Ecol. Econ. 2012, 80, 1–7. [Google Scholar] [CrossRef]
  9. Binder, C.R.; Feola, G.; Steinberger, J.K. Considering the normative, systemic and procedural dimensions in indicator-based sustainability assessments in agriculture. Environ. Impact Assess. Rev. 2010, 30, 71–81. [Google Scholar] [CrossRef]
  10. Munda, G. Social multi-criteria evaluation for urban sustainability policies. Land Use Policy 2006, 23, 86–94. [Google Scholar] [CrossRef]
  11. Schader, C.; Grenz, J.; Meier, M.S.; Stolze, M. Scope and precision of sustainability assessment approaches to food systems. Ecol. Soc. 2014, 19. [Google Scholar] [CrossRef]
  12. Munda, G. Social Multi-Criteria Evaluation for a Sustainable Economy; Springer: Heidelbery, Genmary, 2008. [Google Scholar]
  13. Voss, J.P.; Bauknecht, D.; Kemp, R. Reflexive Governance for Sustainable Development; Edward Elgar Publishing: Cheltenham, UK, 2006. [Google Scholar]
  14. Yakovleva, N.; Sarkis, J.; Sloan, T. Sustainable benchmarking of supply chains: The case of the food industry. Int. J. Prod. Res. 2012, 50, 1297–1317. [Google Scholar] [CrossRef]
  15. Hinrichs, C.C. Transitions to sustainability: A change in thinking about food systems change? Agric. Hum. Values 2014, 31, 143–155. [Google Scholar] [CrossRef]
  16. Funtowicz, S.O.; Ravetz, J.R. The emergence of post-normal science. In Science, Politics and Morality; Springer: London, UK, 1993; pp. 85–123. [Google Scholar]
  17. Bond, A.J.; Morrison-Saunders, A. Re-evaluating sustainability assessment: Aligning the vision and the practice. Environ. Impact Assess. Rev. 2011, 31, 1–7. [Google Scholar] [CrossRef]
  18. Sala, S.; Ciuffo, B.; Nijkamp, P. A systemic framework for sustainability assessment. Ecol. Econ. 2015, 119, 314–325. [Google Scholar] [CrossRef]
  19. Eisenhardt, K.M. Building theories from case study research. Acad. Manag. Rev. 1989, 14, 532–550. [Google Scholar]
  20. Eisenhardt, K.M.; Graebner, M.E. Theory building from cases: Opportunities and challenges. Acad. Manag. J. 2007, 50, 25–32. [Google Scholar] [CrossRef]
  21. Wacker, J.G. A definition of theory: Research guidelines for different theory-building research methods in operations management. J. Oper. Manag. 1998, 16, 361–385. [Google Scholar] [CrossRef]
  22. Kirwan, J.; Maye, D.; Bundhoo, D.; Keech, D.; Brunori, G. Glamur wp2-Scoping/Framing General Comparative Report on Food Chain Performance (deliverable 2.3); Countryside and Community Research Institute, University of Gloucestershire: Cheltenham, UK, 2014. [Google Scholar]
  23. Galli, F.; Bartolini, F.; Brunori, G.; Colombo, L.; Gava, O.; Grando, S.; Marescotti, A. Sustainability assessment of food supply chains: An application to local and global bread in italy. Agric. Food Econ. 2015, 3, 1–17. [Google Scholar] [CrossRef]
  24. Gava, O.; Galli, F.; Bartolini, F.; Brunori, G. Sustainability of Local Versus Global Bread Supply Chains: A Literature Review. In Proceedings of the 2014 Third Congress, Alghero, Italy, 25–27 June 2014.
  25. Saaty, T.L. Fundamentals of Decision Making and Priority Theory with the Analytic Hierarchy Process; RWS Publications: Pittsburgh, PA, USA, 2000; Volume 6. [Google Scholar]
  26. In detail, 8 attributes were removed and 3 were added: animal welfare has no direct relevance for the bread chain, affordability was excluded because prices are considered within the FAO food security definition (economic access) and consumer behavior was not covered by the assessment. Connection is considered within territoriality and resilience is considered within rural development. Fair trade was considered as “distribution of added value” (while creation of added value was kept as a separate attribute), efficiency is considered within resource use, traceability is considered within transparency. Technological innovation was turned into “innovation for non-economic purposes”. Rural development is added to specify contribution to economic development in rural areas. Trust between producer and consumer was also included.
  27. Schmitt, E.; Cravero, V.; Tanquery-Cado, A.; Barjolle, D. Glamur wp3 Guidelines for Case Studies; Research Institute of Organic Agriculture: Frick, Switzerland, 2014. [Google Scholar]
  28. Caliński, T.; Harabasz, J. A dendrite method for cluster analysis. Commun. Stat.-Theory Methods 1974, 3, 1–27. [Google Scholar] [CrossRef]
  29. Castioni, F.; Moretti, R. Pane Nuovo da Grani Antichi. Evoluzione Delle Varietà di Grano, Della Tecnica Molitoria e Panificatoria; Industrie Grafiche Pacini Editore: Siena, Italy, 2013. (In Italian) [Google Scholar]
  30. Calderini, D.; Dreccer, M.; Slafer, G. Genetic improvement in wheat yield and associated traits. A re-examination of previous results and the latest trends. Plant Breed. 1995, 114, 108–112. [Google Scholar] [CrossRef]
  31. Bonnin, I.; Bonneuil, C.; Goffaux, R.; Montalent, P.; Goldringer, I. Explaining the decrease in the genetic diversity of wheat in france over the 20th century. Agric. Ecosyst. Environ. 2014, 195, 183–192. [Google Scholar] [CrossRef]
  32. Bonneuil, C.; Goffaux, R.; Bonnin, I.; Montalent, P.; Hamon, C.; Balfourier, F.; Goldringer, I. A new integrative indicator to assess crop genetic diversity. Ecol. Indic. 2012, 23, 280–289. [Google Scholar] [CrossRef]
  33. Chateil, C.; Goldringer, I.; Tarallo, L.; Kerbiriou, C.; Le Viol, I.; Ponge, J.-F.; Salmon, S.; Gachet, S.; Porcher, E. Crop genetic diversity benefits farmland biodiversity in cultivated fields. Agric. Ecosyst. Environ. 2013, 171, 25–32. [Google Scholar] [CrossRef] [Green Version]
  34. Dawson, J.; Serpolay, E.; Giuliano, S.; Schermann, N.; Galic, N.; Chable, V.; Goldringer, I. Multi-trait evolution of farmer varieties of bread wheat after cultivation in contrasting organic farming systems in europe. Genetica 2012, 140, 1–17. [Google Scholar] [CrossRef] [PubMed]
  35. Chable, V.; Dawson, J.; Bocci, R.; Goldringer, I. Seeds for organic agriculture: Development of participatory plant breeding and farmers’ networks in france. In Organic Farming, Prototype for Sustainable Agricultures; Springer: Dordrecht, The Netherlands, 2014; pp. 383–400. [Google Scholar]
  36. Environmental Product Declaration, Barilla Company. Dichiarazione ambientale di prodotto applicata al panbauletto. Available online: http://gryphon.environdec.com/data/files/6/8906/epd223it_Barilla_PanBauletto_2012.pdf (accessed on 23 March 2016).
  37. Michal, K.; Thomas, N. D8.5environmental Assessment of Diversified Cropping Systems; Agroscope: Zurich, Switzerland, 2014. [Google Scholar]
  38. Espinoza-Orias, N.; Stichnothe, H.; Azapagic, A. The carbon footprint of bread. Int. J. Life Cycle Assess. 2011, 16, 351–365. [Google Scholar] [CrossRef]
  39. Andersson, K.; Ohlsson, T. Life cycle assessment of bread produced on different scales. Int. J. Life Cycle Assess. 1999, 4, 25–40. [Google Scholar] [CrossRef]
  40. Mondal, A.; Datta, A. Bread baking–a review. J. Food Eng. 2008, 86, 465–474. [Google Scholar] [CrossRef]
  41. Mena, C.; Adenso-Diaz, B.; Yurt, O. The causes of food waste in the supplier–retailer interface: Evidences from the UK and Spain. Resour. Conserv. Recycl. 2011, 55, 648–658. [Google Scholar] [CrossRef]
  42. Poutanen, K.; Flander, L.; Katina, K. Sourdough and cereal fermentation in a nutritional perspective. Food Microbiol. 2009, 26, 693–699. [Google Scholar] [CrossRef] [PubMed]
  43. Katina, K.; Heiniö, R.L.; Autio, K.; Poutanen, K. Optimization of sourdough process for improved sensory profile and texture of wheat bread. LWT-Food Sci. Technol. 2006, 39, 1189–1202. [Google Scholar] [CrossRef]
  44. Hu, F.B.; Willett, W.C. Optimal diets for prevention of coronary heart disease. JAMA 2002, 288, 2569–2578. [Google Scholar] [CrossRef] [PubMed]
  45. Elbehri, A. The Changing Face of the Us Grain System: Differentiation and Identity Preservation Trends; United States Department of Agriculture, Economic Research Service: Washington, DC, USA, 2007. Available online: http://www.ers.usda.gov/media/201679/err35_1_.pdf (accessed on 23 March 2016).
  46. Hills, K.M.; Goldberger, J.R.; Jones, S.S. Commercial bakers and the relocalization of wheat in western washington state. Agric. Hum. Values 2013, 30, 365–378. [Google Scholar] [CrossRef]
  47. Barling, D.; Sharpe, R.; Lang, T. Traceability and ethical concerns in the UK wheat—Bread chain: From food safety to provenance to transparency. Int. J. Agric. Sustain. 2009, 7, 261–278. [Google Scholar] [CrossRef]
  48. Nelson, E.; Tovar, L.G.; Rindermann, R.S.; Cruz, M.Á.G. Participatory organic certification in mexico: An alternative approach to maintaining the integrity of the organic label. Agric. Hum. Values 2010, 27, 227–237. [Google Scholar] [CrossRef]
  49. Lowe, P.; Phillipson, J.; Lee, R.P. Socio-technical innovation for sustainable food chains: Roles for social science. Trends Food Sci. Technol. 2008, 19, 226–233. [Google Scholar] [CrossRef]
  50. Hand, M.S.; Martinez, S. Just what does local mean. Choices 2010, 25, 13–18. [Google Scholar]
  51. Pretty, J.N.; Ball, A.S.; Lang, T.; Morison, J.I. Farm costs and food miles: An assessment of the full cost of the UK weekly food basket. Food Policy 2005, 30, 1–19. [Google Scholar] [CrossRef]
  52. Schnell, S.M. Food miles, local eating, and community supported agriculture: Putting local food in its place. Agric. Hum. Values 2013, 30, 615–628. [Google Scholar] [CrossRef]
  53. Coley, D.; Howard, M.; Winter, M. Local food, food miles and carbon emissions: A comparison of farm shop and mass distribution approaches. Food Policy 2009, 34, 150–155. [Google Scholar] [CrossRef]
  54. Kemp, K.; Insch, A.; Holdsworth, D.K.; Knight, J.G. Food miles: Do UK consumers actually care? Food Policy 2010, 35, 504–513. [Google Scholar] [CrossRef]
  55. Sirieix, L.; Grolleau, G.; Schaer, B. Do consumers care about food miles? An empirical analysis in france. Int. J. Consum. Stud. 2008, 32, 508–515. [Google Scholar] [CrossRef]
  56. Wiskerke, J.S. On promising niches and constraining sociotechnical regimes: The case of Dutch wheat and bread. Environ. Plan. A 2003, 35, 429–448. [Google Scholar] [CrossRef]
  57. Schiefer, G.; Fritz, M.; Gellynck, X.; Molnár, A. Chain governance structures: The European traditional food sector. Br. Food J. 2009, 111, 762–775. [Google Scholar] [CrossRef]
  58. Gereffi, G.; Humphrey, J.; Sturgeon, T. The governance of global value chains. Rev. Int. Political Econ. 2005, 12, 78–104. [Google Scholar] [CrossRef]
  59. Barham, E.; Sylvander, B. Labels of Origin for Food: Local Development, Global Recognition; CABI: Wallingford, Oxfordshire, UK, 2011. [Google Scholar]
  60. Roy, P.; Nei, D.; Orikasa, T.; Xu, Q.; Okadome, H.; Nakamura, N.; Shiina, T. A review of Life Cycle Assessment (LCA) on some food products. J. Food Eng. 2009, 90, 1–10. [Google Scholar] [CrossRef]
  61. Veisi, H.; Liaghati, H.; Alipour, A. Developing an ethics-based approach to indicators of sustainable agriculture using Analytic Hierarchy Process (AHP). Ecol. Indic. 2016, 60, 644–654. [Google Scholar] [CrossRef]
  62. Cawthorn, D.M.; Hoffman, L.C. The bushmeat and food security nexus: A global account of the contributions, conundrums and ethical collisions. Food Res. Int. 2015, 76, 906–925. [Google Scholar] [CrossRef]
  63. Coff, C.; Korthals, M.; Barling, D. Ethical traceability and informed food choice. In Ethical Traceability and Communicating Food; Springer: Dordrecht, The Netherlands, 2008; pp. 1–18. [Google Scholar] [CrossRef]
  64. Candel, J.J.; Breeman, G.E.; Stiller, S.J.; Termeer, C.J. Disentangling the consensus frame of food security: The case of the EU common agricultural policy reform debate. Food Policy 2014, 44, 47–58. [Google Scholar] [CrossRef]
  65. Mooney, P.H.; Hunt, S.A. Food security: The elaboration of contested claims to a consensus frame*. Rural Sociol. 2009, 74, 469–497. [Google Scholar] [CrossRef]
  66. Konefal, J.; Mascarenhas, M.; Hatanaka, M. Governance in the global agro-food system: Backlighting the role of transnational supermarket chains. Agric. Hum. Values 2005, 22, 291–302. [Google Scholar] [CrossRef]
  67. Ponte, S.; Cheyns, E. Voluntary standards, expert knowledge and the governance of sustainability networks. Glob. Netw. 2013, 13, 459–477. [Google Scholar] [CrossRef]
  68. Campbell, H. Breaking new ground in food regime theory: Corporate environmentalism, ecological feedbacks and the ‘food from somewhere’regime? Agric. Hum. Values 2009, 26, 309–319. [Google Scholar] [CrossRef]
  69. Newell, J.P.; Vos, R.O. “papering” over space and place: Product carbon footprint modeling in the global paper industry. Ann. Assoc. Am. Geogr. 2011, 101, 730–741. [Google Scholar] [CrossRef]
  70. Freidberg, S. Footprint technopolitics. Geoforum 2014, 55, 178–189. [Google Scholar] [CrossRef]
  71. Garnett, T. Three perspectives on sustainable food security: Efficiency, demand restraint, food system transformation. What role for life cycle assessment? J. Clean. Product. 2014, 73, 10–18. [Google Scholar] [CrossRef]
  72. Gold, S.; Seuring, S.; Beske, P. Sustainable supply chain management and inter-organizational resources: A literature review. Corp. Soc. Responsib. Environ. Manag. 2010, 17, 230–245. [Google Scholar] [CrossRef]
  73. Kemp, R.; Loorbach, D. Transition management: A reflexive governance approach. In Reflexive Governance for Sustainable Development; Voss, J.P., Bauknecht, D., Kemp, R., Eds.; Edward Elgar Publishing: Cheltenham, UK, 2006; pp. 103–130. [Google Scholar]
  74. Feindt, P. Reflexive governance of global public goods: Multi-level and multireferential goveraqnce in agriculture policy. In Reflexive Governance for Public Goods; Brousseau, E., Dedeurwaerdere, T., Siebenhüner, B., Eds.; MIT Press: Boston, MA, USA, 2010. [Google Scholar]
  75. Starr, M.A. Qualitative and mixed-methods research in economics: Surprising growth, promising future. J. Econ. Surv. 2014, 28, 238–264. [Google Scholar] [CrossRef]
Figure 1. Sustainability attributes positioning in relation to availability of information and performance diversity across the three chains.
Sustainability 08 00305 g001
Figure 2. Ranking of the sustainability dimensions for the wheat-to-bread chains.
Sustainability 08 00305 g002
Figure 3. Ranking of the sustainability attributes for the wheat-to-bread chains.
Sustainability 08 00305 g003
Figure 4. Performance of the bread chains weighted by participants.
Sustainability 08 00305 g004
Figure 5. Performances of chains according to clusters of participants.
Sustainability 08 00305 g005
Figure 6. Supply chain performances: comparison between preliminary assessment and stakeholder workshop results.
Sustainability 08 00305 g006
Figure 7. Key elements of the final propositions.
Sustainability 08 00305 g007
Table 1. Quantities and prices in the case study breads.
CaseQuantity of Bread (tons/year)Conversion Factor (kg of Wheat/kg of Bread, Range Values)Price to Consumer, Range (€/kg)Average Price Comparable Bread (€/kg)Price Range for Soft Wheat (€/ton)
Local210.95–1.093.50–4.202.25400–450 *
Regional2001.12–1.203.00–3.502.4240–270 **
Global198151.20–1.282.85–3.002.4180–190 ***
* organic wheat; ** fixed by contract; *** average price on the Bologna board of exchange.
Table 2. Features of the supply chains.
CaseFarmingMillingLeaveningBakingDistributionShelf Life
Localancient wheat varieties, organic farmingstone milling and cylinder millingcraft kneading, sourdough and bakers’ yeastdiscontinuous baking, wood ovendirect sale or small retailers, local market Up to 7 days
Regionalselected wheat varieties, conventional and integrated farmingcylinder milling (reduced speed and temperature control to preserve the germ in the flour)industrial kneading, sourdoughdiscontinuous baking, electric and gas ovenregional distribution through retailers, collective mark (PDO specification)4 to 6 days
Globalwheat sourced on national and continental market, conventional farmingcylinder millingindustrial kneading, baker’s yeastcontinuous baking, gas ovenretailers and mass distribution on national marketUp to 30 days
Table 3. Attributes within sustainability dimension and definitions (adapted from [22]).
SustainabilityAttributeDefinition
EconomicAV creationProduct’s ability to obtain a price premium that remunerates production
Profitability/competitivenessAbility of the chain to get stable prices, access to credit, access to factors of production (raw materials and skilled labor), market access
Economic developmentContribution to growth and employment
Rural developmentContribution to growth and employment in rural areas
SocialLabour relations Quality of working conditions of the operators in the industry
AV distributionFairness of the distribution of added value along the supply chain
Food securityStability in the availability and access (physical and economic)
TrustRelationship of trust between producers and consumers
TerritorialityAbility of the chain to reflect the links between the product and the territory
EnvironmentalResource use Resources consumed (land, energy, other materials) in the production process
PollutionNegative impacts on the ecosystem
BiodiversityContribution of food chains to the preservation of diversity of species and ecosystems
WasteLosses and waste of raw materials, semi-finished and finished products
Human healthNutritionNutritional qualities associated with the food in terms of composition and capabilities of the product to contribute to the physical health and well-being
SafetyStandards of hygiene and safety adopted by companies to reduce the risks associated with complex transformation and storage of food
EthicalResponsibilityCompany procedures based on non-trade values. Coherence between behavior and communication.
TransparencyInformation conveyed to consumers, and communication between the actors in the chain (including traceability).
GovernanceStakeholder involvement to business decisions.
Innovation Innovations for primarily environmental, social and health aims
Table 4. Pollution and resource use for local and global cases.
Indicators/kg of BreadLocalGlobal
PollutionGWP g CO2 eq.22.518.2
Resource useEnergy MJ 18001012

