
Does Wind Discourage Sustainable Transportation Mode Choice? Findings from San Francisco, California, USA


Abstract
:1. Introduction
2. Methods
2.1. Survey Design and Collection of Microclimate Data
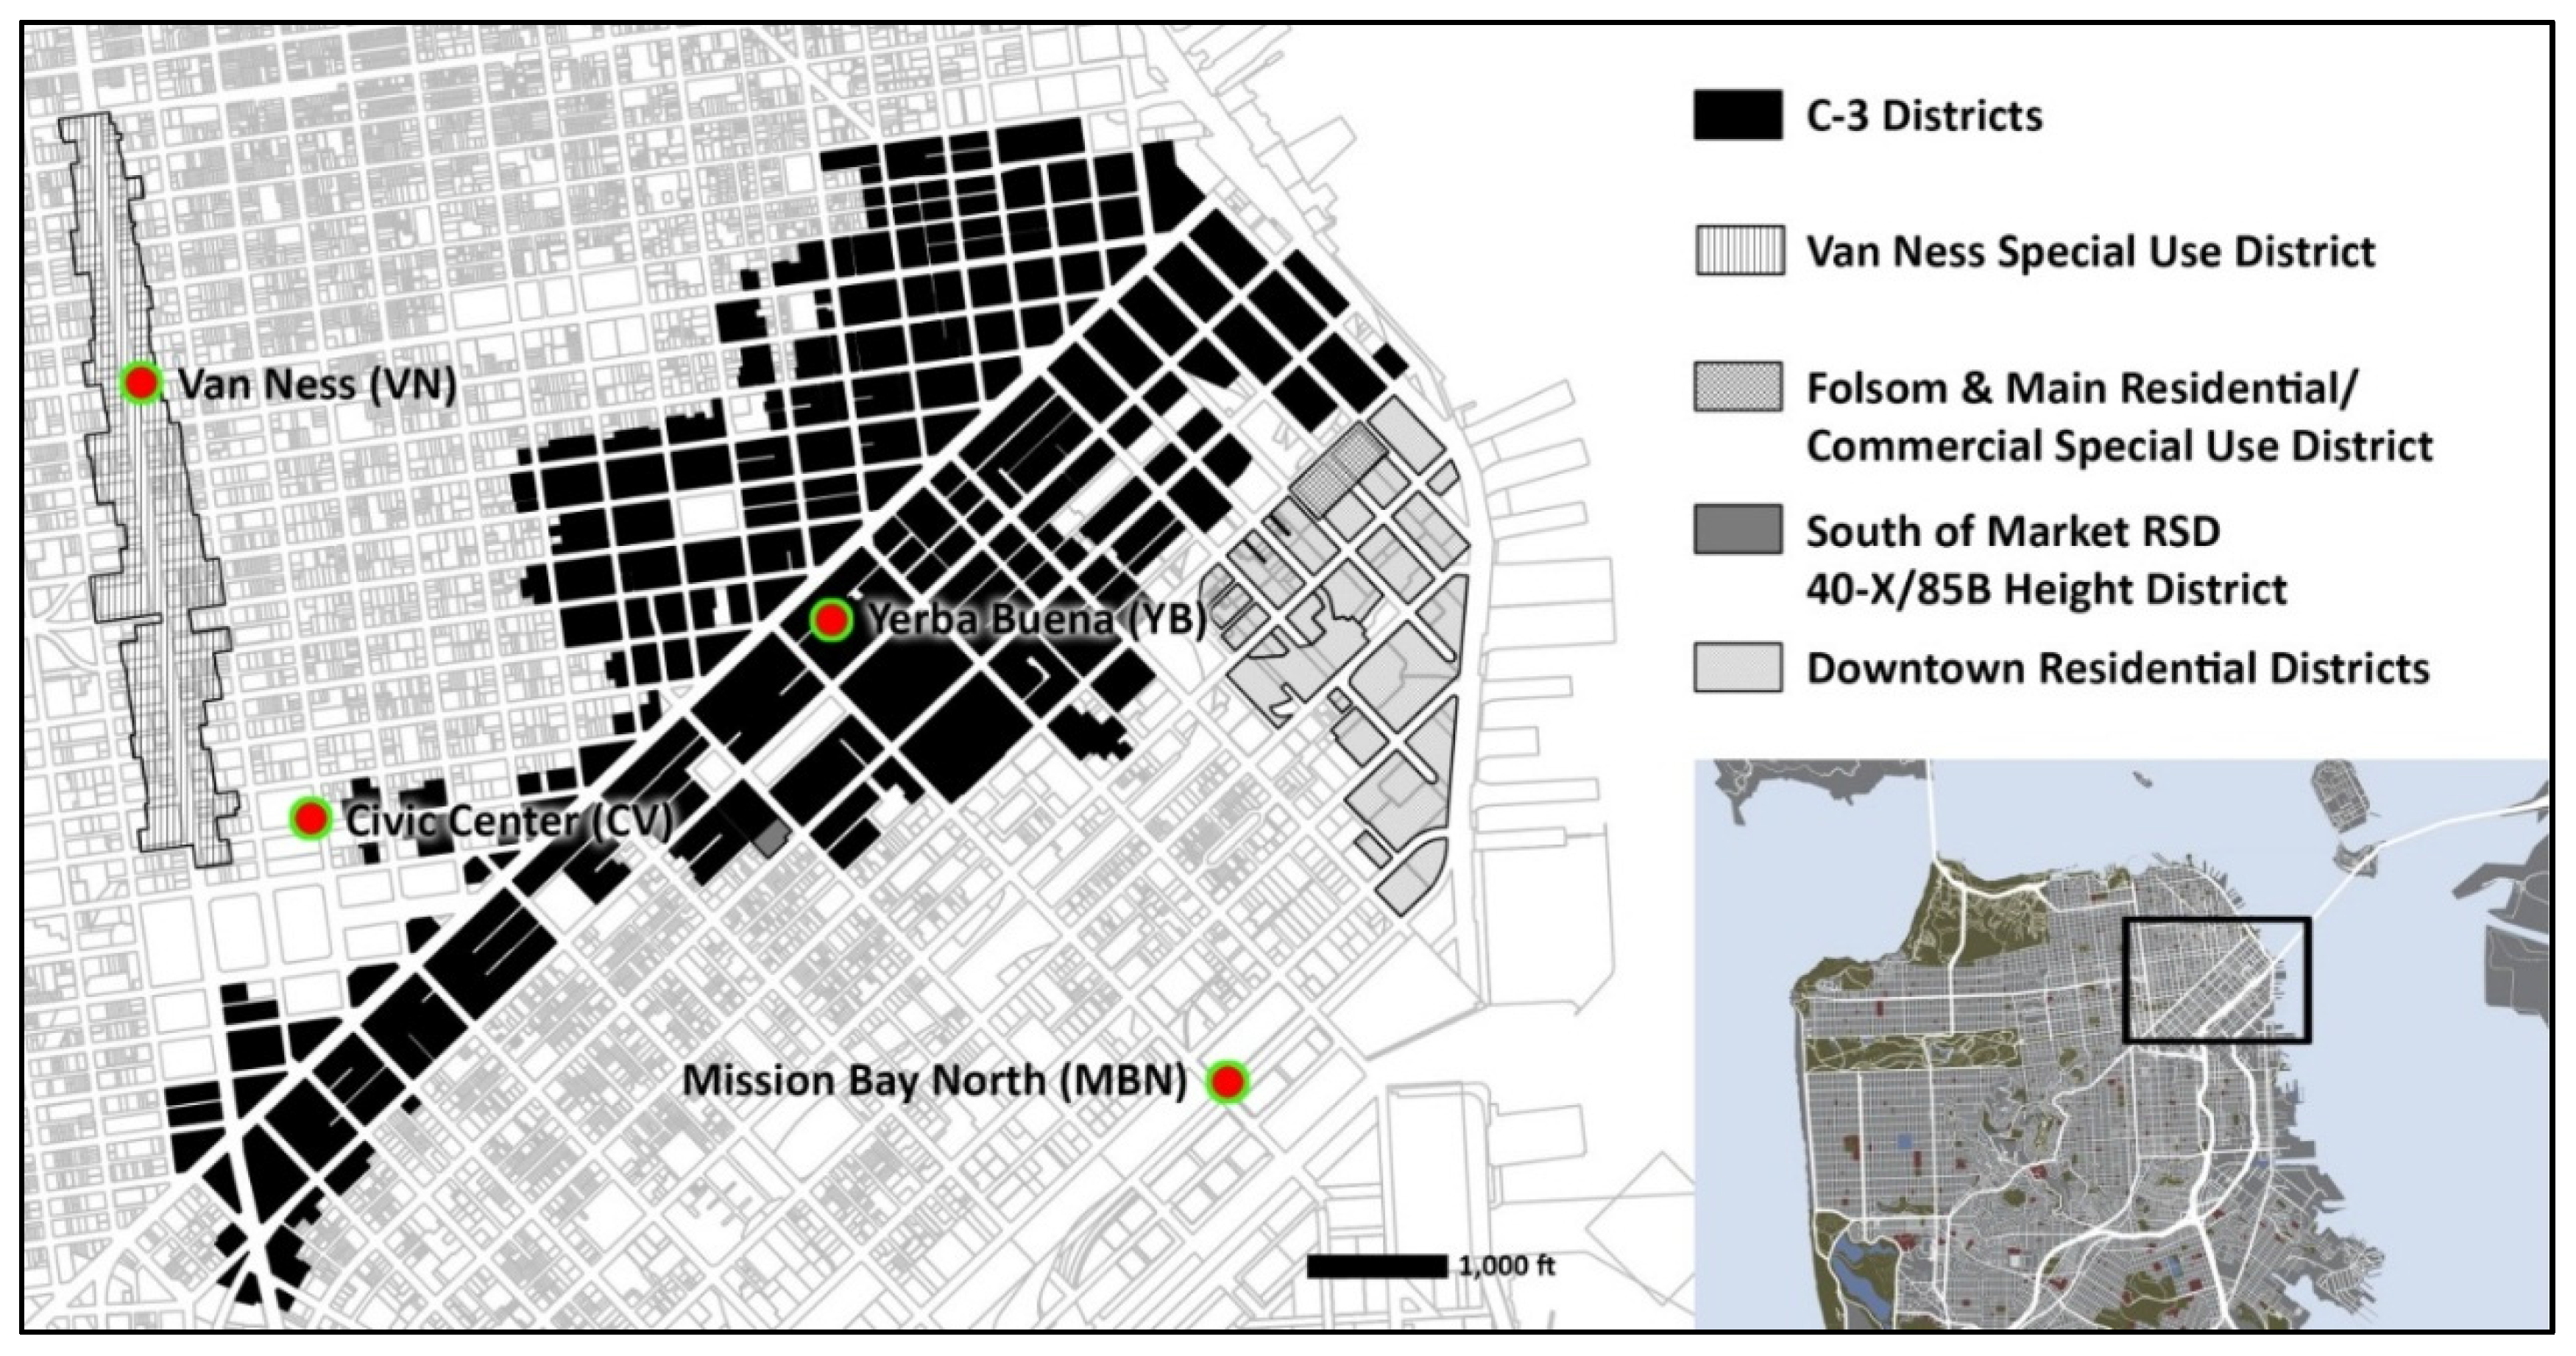
2.2. Field Study Locations
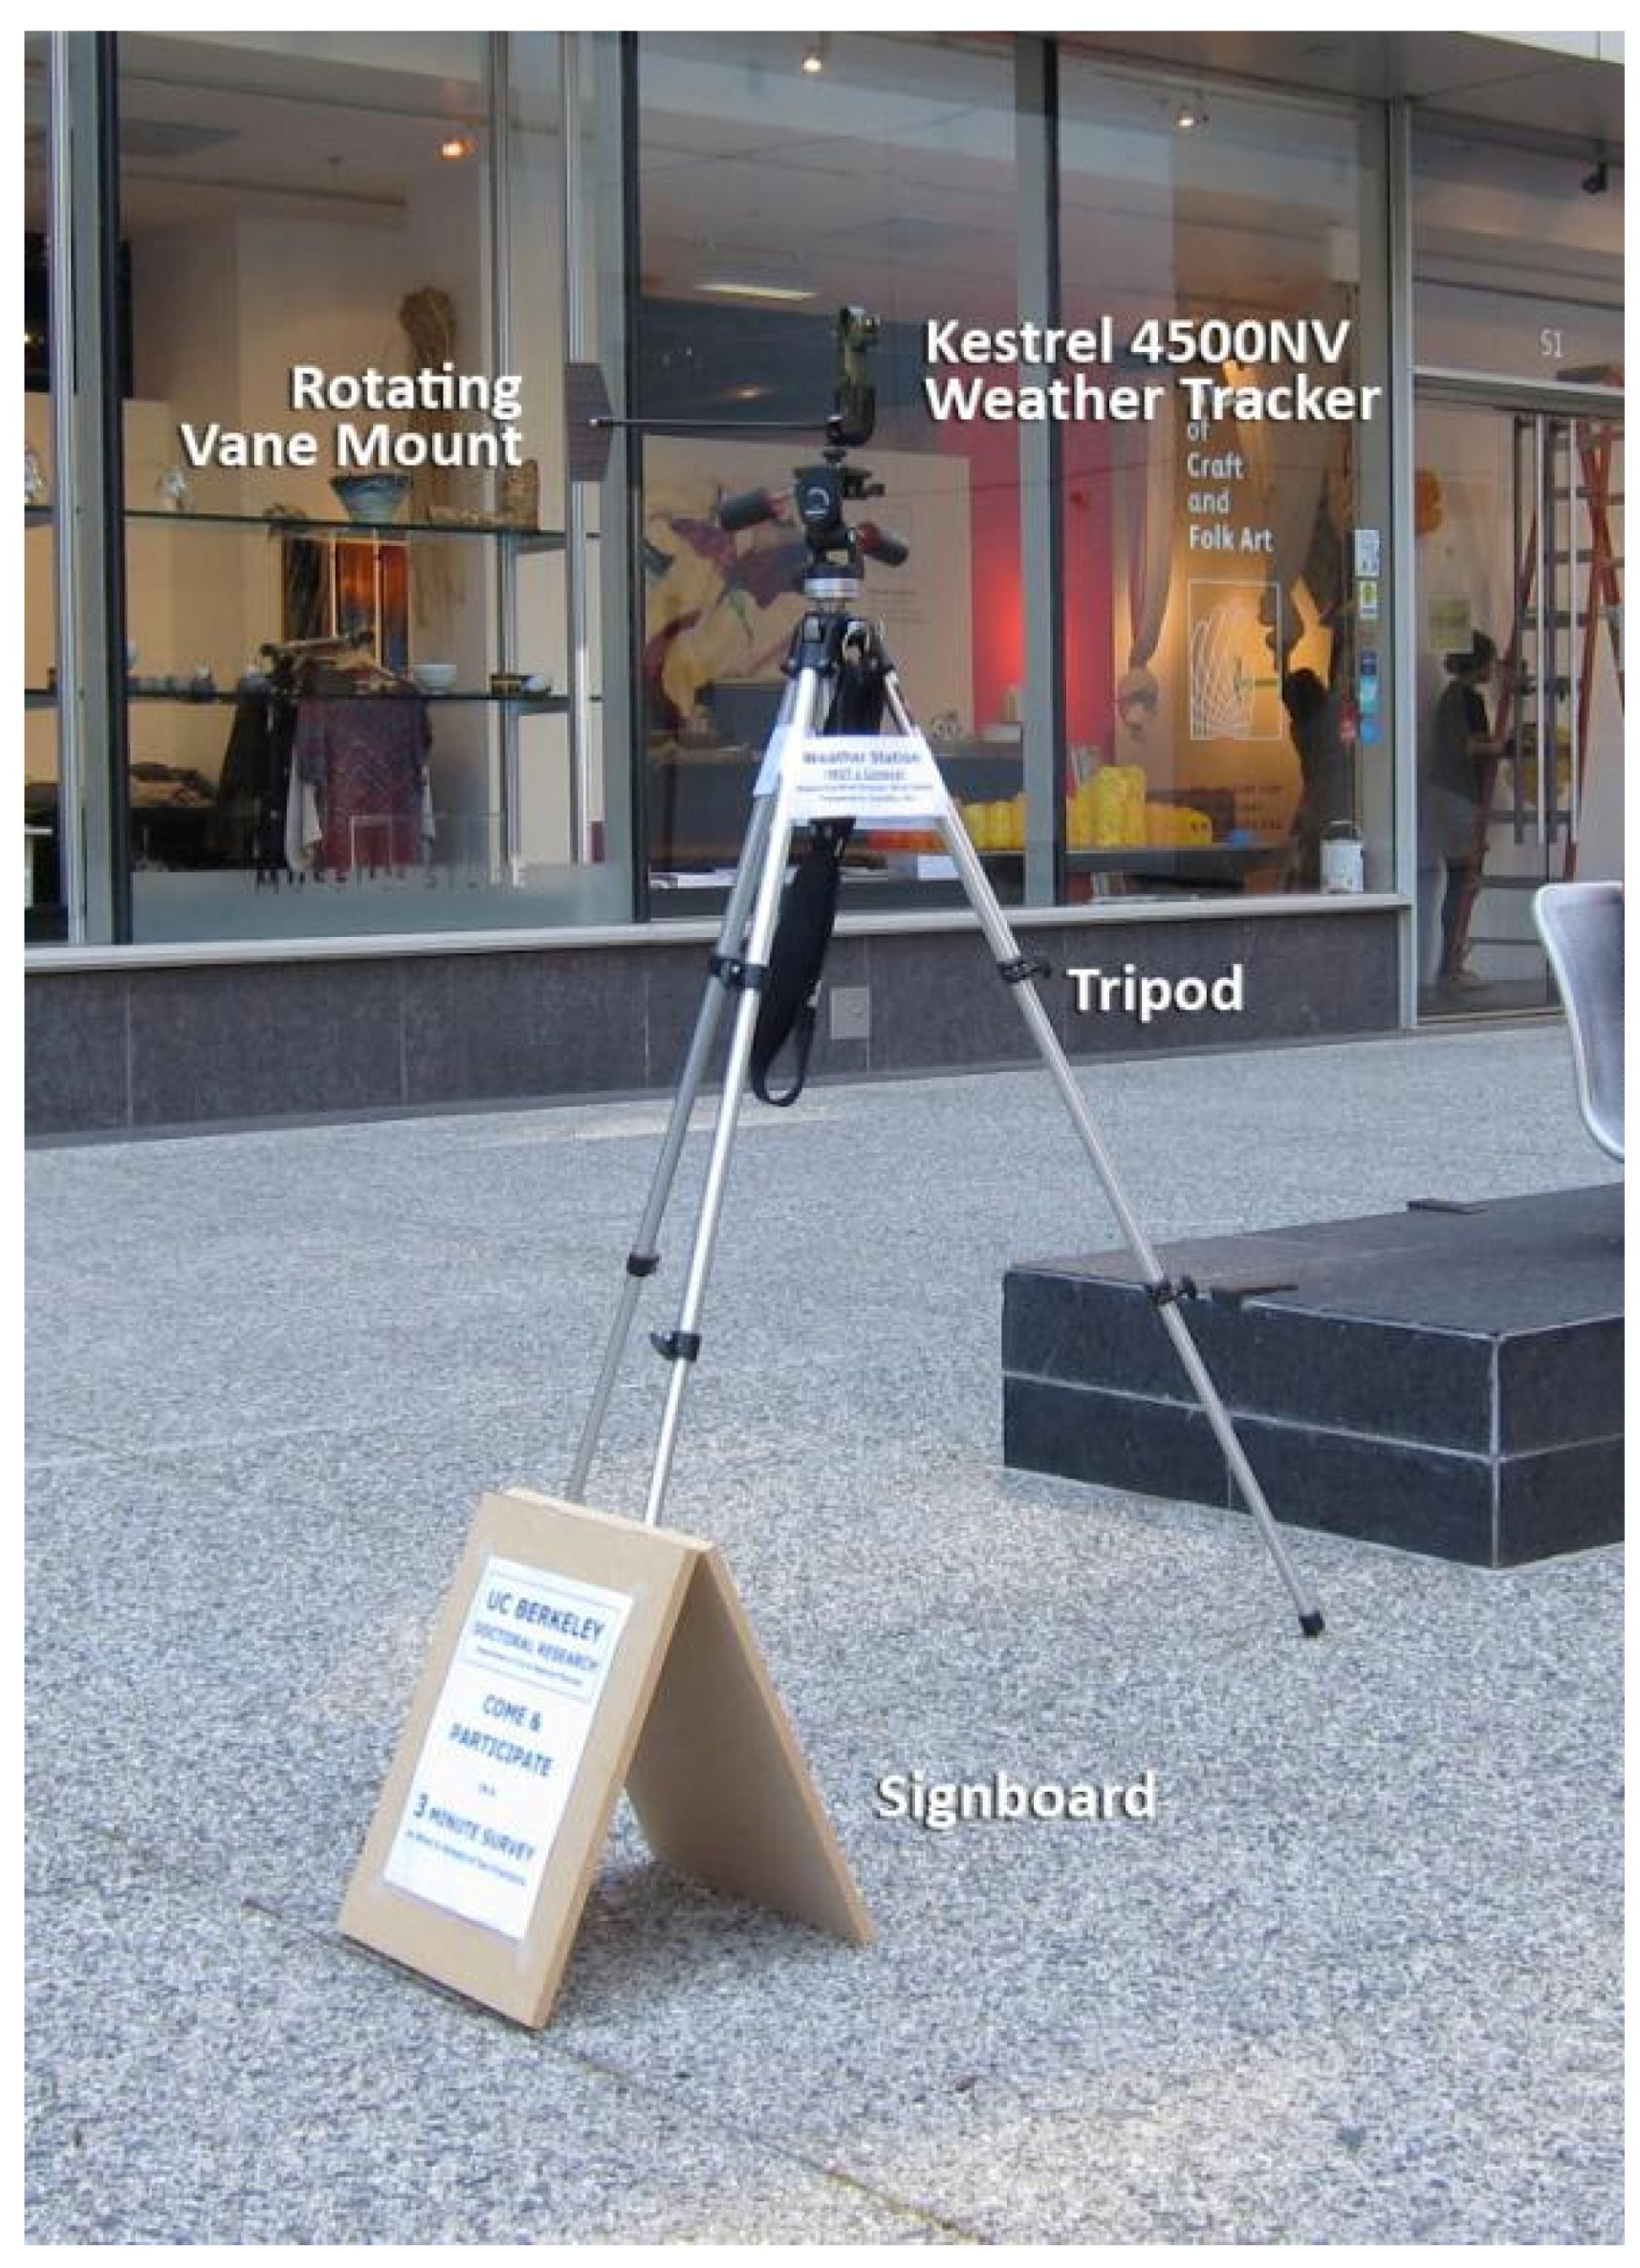
2.3. Field Study Procedure
3. Results
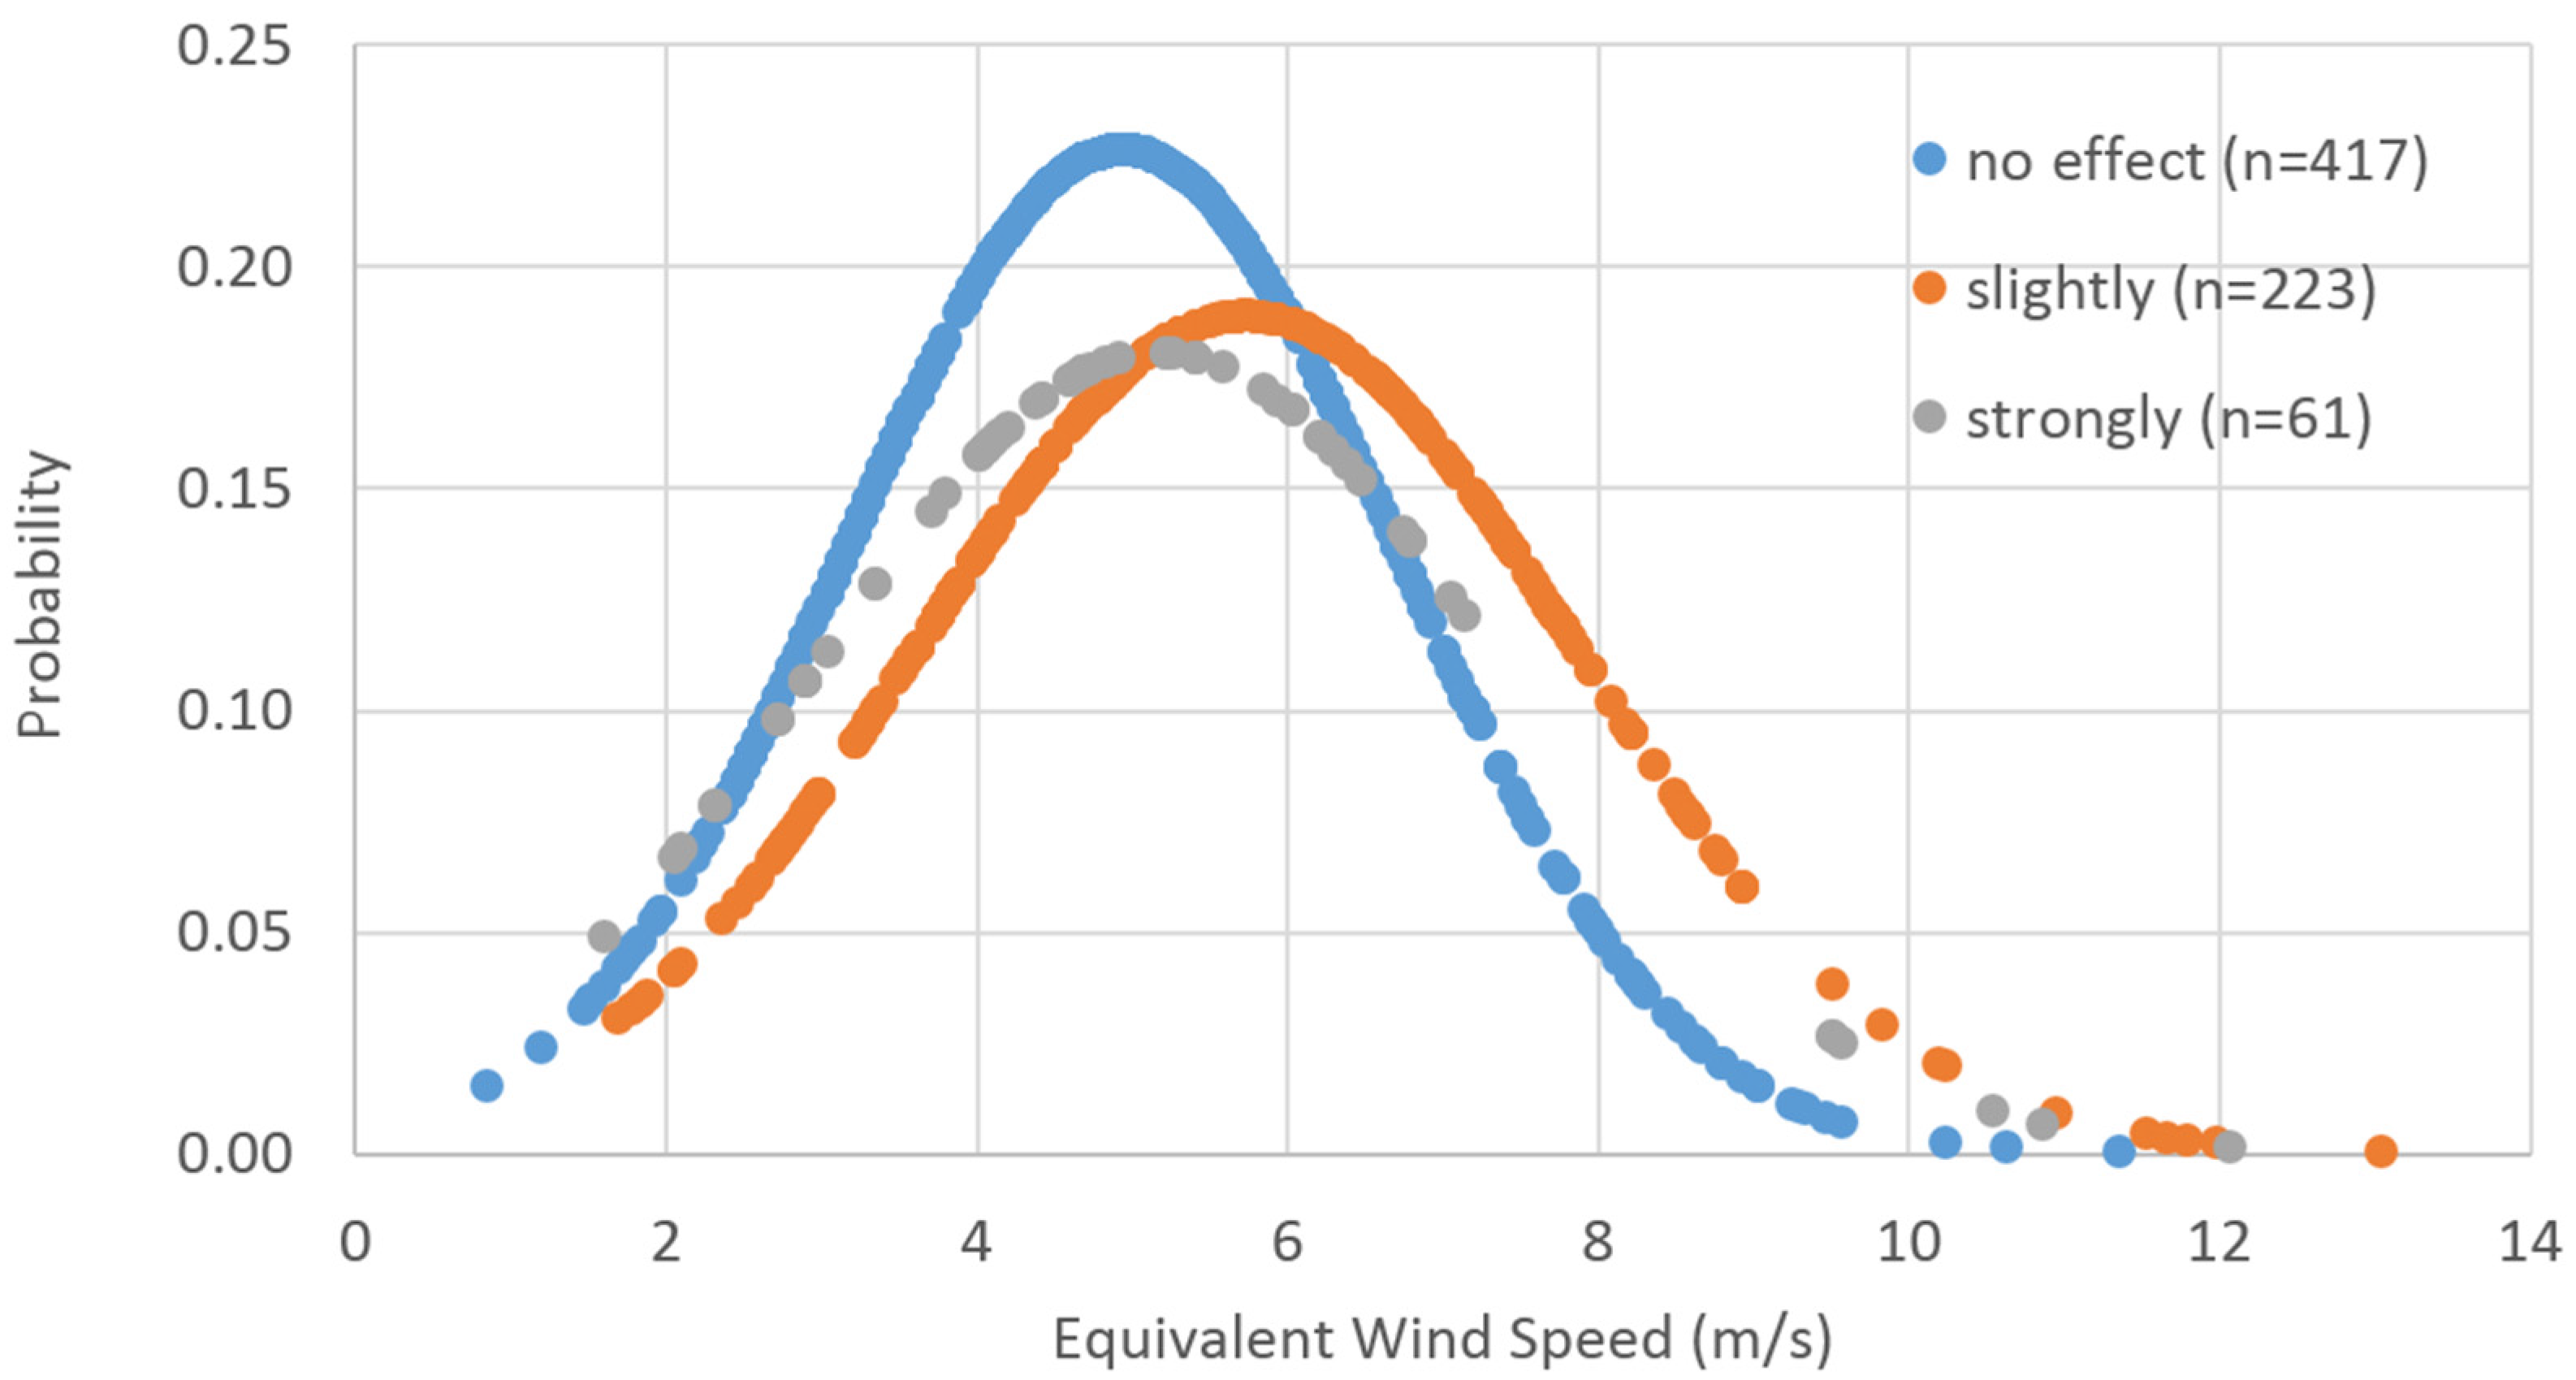
3.1. Immediate Relationship between Wind and Discouragement for Sustainable Transportation Mode Choice
3.2. Net Effect of Wind on Discouragement for Sustainable Transportation Mode Choice
3.3. Findings from Open-Ended Question
4. Discussion and Conclusions
Acknowledgments
Author Contributions
Conflicts of Interest
References
- Black, W.R. Sustainable transportation: A US perspective. J. Transp. Geogr. 1996, 4, 151–159. [Google Scholar] [CrossRef]
- Haynes, K.E.; Gifford, J.L.; Pelletiere, D. Sustainable transportation institutions and regional evolution: Global and local perspectives. J. Transp. Geogr. 2005, 13, 207–221. [Google Scholar] [CrossRef]
- Richardson, B.C. Sustainable transport: Analysis frameworks. J. Transp. Geogr. 2005, 13, 29–39. [Google Scholar] [CrossRef]
- Schiller, P.L.; Bruun, E.; Kenworthy, J. An Introduction to Sustainable Transportation: Policy, Planning and Implementation; Routledge: Washington, DC, USA, 2010. [Google Scholar]
- Steg, L.; Gifford, R. Sustainable transportation and quality of life. J. Transp. Geogr. 2005, 13, 59–69. [Google Scholar] [CrossRef]
- Duany, A.; Plater-Zyberk, E.; Speck, J. Suburban Nation: The Rise of Sprawl and the Decline of the American Dream; North Point Press: New York, NY, USA, 2000. [Google Scholar]
- Ewing, R. Characteristics, Causes, and Effects of Sprawl: A Literature Review. Environ. Urban Stud. 1994, 21, 1–15. [Google Scholar]
- Freilich, R.H. From Sprawl to Sustainability: Smart Growth, New Urbanism, Green Development, and Renewable Energy, 2nd ed.; American Bar Association: Chicago, IL, USA, 2010. [Google Scholar]
- Gillham, O. The Limitless City: A Primer on the Urban Sprawl Debate; Island Press: Washington, DC, USA, 2002. [Google Scholar]
- Newman, P.; Kenworthy, J. Sustainability and Cities: Overcoming Automobile Dependence; Island Press: Washington, DC, USA, 1999. [Google Scholar]
- Schneider, R.J. Understanding Sustainable Transportation Choices: Shifting Routine Automobile Travel to Walking and Bicycling; University of California, Berkeley: Berkeley, CA, USA, 2011. [Google Scholar]
- Hunt, J.C.R.; Poulton, E.C.; Mumford, J.C. The Effects of Wind on People: New Criteria Based on Wind Tunnel Experiments. Build. Environ. 1976, 11, 15–28. [Google Scholar] [CrossRef]
- Jackson, P.S. The Evaluation of Windy Environments. Build. Environ. 1978, 13, 251–260. [Google Scholar] [CrossRef]
- Lawson, T.; Penwarden, A.D. The Effects of Wind on People in the Vicinity of Buildings; Cambridge University Press: Heathrow, UK, 1975; pp. 605–622. [Google Scholar]
- Penwarden, A.D. Acceptable Wind Speeds in Towns. Build. Sci. 1973, 8, 259–267. [Google Scholar] [CrossRef]
- Arens, E. Designing for an Acceptable Wind Environment. Transp. Eng. J. 1981, 107, 127–141. [Google Scholar]
- Bottema, M. A Method for Optimisation of Wind Discomfort Criteria. Build. Environ. 2000, 35, 1–18. [Google Scholar] [CrossRef]
- Isyumov, N.; Davenport, A.G. The Ground Level Wind Environment in Built-up Areas; Cambridge University Press: Heathrow, UK, 1975; pp. 403–422. [Google Scholar]
- Lawson, T. The Wind Content of the Built Environment. J. Wind Eng. Ind. Aerodyn. 1978, 3, 93–105. [Google Scholar] [CrossRef]
- Melbourne, W.H. Criteria for Environmental Wind Conditions. J. Wind Eng. Ind. Aerodyn. 1978, 3, 241–249. [Google Scholar] [CrossRef]
- Murakami, S.; Iwasa, Y.; Morikawa, Y. Study on Acceptable Criteria for Assessing Wind Environment at Ground Level Based on Residents’ Diaries. J. Wind Eng. Ind. Aerodyn. 1986, 24, 1–18. [Google Scholar] [CrossRef]
- Soligo, M.J.; Irwin, P.A.; Williams, C.J.; Schuyler, G.D. A Comprehensive Assessment of Pedestrian Comfort Including Thermal Comfort. In Proceedings of the 8th US National Conference on Wind Engineering, Baltimore, MD, USA, 5–7 June 1997.
- Bosselmann, P.; Dake, K.; Fountain, M.; Kraus, L.; Lin, K.T.; Harris, A. Sun, Wind, and Comfort: A Field Study of Thermal Comfort in San Francisco; Center for Environmental Design Research, University of California, Berkeley: Berkeley, CA, USA, 1988. [Google Scholar]
- Eliasson, I.; Knez, I.; Westerberg, U.; Thorsson, S.; Lindberg, F. Climate and Behaviour in a Nordic City. Landsc. Urban Plan. 2007, 82, 72–84. [Google Scholar] [CrossRef]
- Gehl, J. Cities for People; Island Press: Washington, DC, USA, 2010. [Google Scholar]
- Gehl, J.; Gemzøe, L. Public Spaces Public Life: Copenhagen; The Danish Architecture Press: Copenhagen, Denmark, 2004. [Google Scholar]
- Nikolopoulou, M.; Lykoudis, S. Use of Outdoor Spaces and Microclimate in a Mediterranean Urban Area. Build. Environ. 2007, 42, 3691–3707. [Google Scholar] [CrossRef]
- Thorsson, S.; Lindqvist, M.; Lindqvist, S. Thermal Bioclimatic Conditions and Patterns of Behaviour in an Urban Park in Göteborg, Sweden. Int. J. Biometeorol. 2004, 48, 149–156. [Google Scholar] [CrossRef] [PubMed]
- Zacharias, J.; Stathopoulos, T.; Wu, H. Microclimate and Downtown Open Space Activity. Environ. Behav. 2001, 33, 296–315. [Google Scholar] [CrossRef]
- Zacharias, J.; Stathopoulos, T.; Wu, H. Spatial Behavior in San Francisco’s Plazas The Effects of Microclimate, Other People, and Environmental Design. Environ. Behav. 2004, 36, 638–658. [Google Scholar] [CrossRef]
- National Climatic Data Center. 1971–2000 U.S. Climate Normals Data and Information; National Climatic Data Center: Asheville, NC, USA, 2005. [Google Scholar]
- Bosselmann, P. Representation of Places: Reality and Realism in City Design; University of California Press: Berkeley, CA, USA, 1998. [Google Scholar]
- Bosselmann, P. Urban Transformation: Understanding City Design and Form; Island Press: Washington, DC, USA, 2008. [Google Scholar]
- Brown, G.Z.; DeKay, M. Sun, Wind, and Light: Architectural Design Strategies, 2nd ed.; Wiley: Hoboken, NJ, USA, 2001. [Google Scholar]
- Gehl, J.; Svarre, B. How to Study Public Life; Island Press: Washington, DC, USA, 2013. [Google Scholar]
- Loukaitou-Sideris, A.; Banerjee, T. The Negotiated Plaza: Design and Development of Corporate Open Space in Downtown Los Angeles and San Francisco. J. Plan. Educ. Res. 1993, 13, 1–12. [Google Scholar] [CrossRef]
- Marcus, C.C.; Francis, C. People Places: Design Guidelines for Urban Open Space; Van Nostrand Reinhold: New York, NY, USA, 1998. [Google Scholar]
- Creemers, L.; Wets, G.; Cools, M. Meteorological variation in daily travel behaviour: Evidence from revealed preference data from the Netherlands. Theor. Appl. Climatol. 2015, 120, 183–194. [Google Scholar] [CrossRef]
- Cools, M.; Moons, E.; Creemers, L.; Wets, G. Changes in Travel Behavior in Response to Weather Conditions: Do Type of Weather and Trip Purpose Matter? Transp. Res. Rec. 2010, 2157, 22–28. [Google Scholar] [CrossRef]
- Arana, P.; Cabezudo, S.; Peñalba, M. Influence of weather conditions on transit ridership: A statistical study using data from Smartcards. Transp. Res. Part Policy Pract. 2014, 59, 1–12. [Google Scholar] [CrossRef]
- Guo, Z.; Wilson, N.; Rahbee, A. Impact of Weather on Transit Ridership in Chicago, Illinois. Transp. Res. Rec. J. Transp. Res. Board 2007, 2034, 3–10. [Google Scholar] [CrossRef]
- Stover, V.W.; McCormack, E.D. The Impact of Weather on Bus Ridership in Pierce County, Washington. J. Public Transp. 2012, 15, 95–110. [Google Scholar] [CrossRef]
- Aaheim, H.A.; Hauge, K.E. Impacts of Climate Change on Travel Habits: A National Assessment Based on Individual Choices; CICERO Report; Center for International Climate and Environmental Research: Oslo, Norway, 2005. [Google Scholar]
- Heinen, E.; Maat, K.; van Wee, B. Day-to-Day Choice to Commute or Not by Bicycle. Transp. Res. Rec. J. Transp. Res. Board 2011, 2230, 9–18. [Google Scholar] [CrossRef]
- Nankervis, M. The effect of weather and climate on bicycle commuting. Transp. Res. A Policy Pract. 1999, 33, 417–431. [Google Scholar] [CrossRef]
- Rietveld, P.; Daniel, V. Determinants of bicycle use: Do municipal policies matter? Transp. Res. A Policy Pract. 2004, 38, 531–550. [Google Scholar] [CrossRef]
- Saneinejad, S.; Roorda, M.J.; Kennedy, C. Modelling the impact of weather conditions on active transportation travel behaviour. Transp. Res. D Transp. Environ. 2012, 17, 129–137. [Google Scholar] [CrossRef]
- Gebhart, K.; Noland, R.B. The impact of weather conditions on bikeshare trips in Washington, DC. Transportation 2014, 41, 1205–1225. [Google Scholar] [CrossRef]
- Helbich, M.; Böcker, L.; Dijst, M. Geographic heterogeneity in cycling under various weather conditions: Evidence from Greater Rotterdam. J. Transp. Geogr. 2014, 38, 38–47. [Google Scholar] [CrossRef]
- Aultman-Hall, L.; Lane, D.; Lambert, R. Assessing Impact of Weather and Season on Pedestrian Traffic Volumes. Transp. Res. Rec. J. Transp. Res. Board 2009, 2140, 35–43. [Google Scholar] [CrossRef]
- Böcker, L.; Dijst, M.; Prillwitz, J. Impact of Everyday Weather on Individual Daily Travel Behaviours in Perspective: A Literature Review. Transp. Rev. 2013, 33, 71–91. [Google Scholar] [CrossRef]
- Clark, A.F.; Scott, D.M.; Yiannakoulias, N. Examining the relationship between active travel, weather, and the built environment: A multilevel approach using a GPS-enhanced dataset. Transportation 2014, 41, 325–338. [Google Scholar] [CrossRef]
- American Society of Heating, Refrigerating, and Air-Conditioning Engineers. ANSI/ASHRAE Standard 55–2010; American Society of Heating, Refrigerating, and Air-Conditioning Engineers, Inc.: Atlanta, GA, USA, 2010. [Google Scholar]
- Cheng, V.; Ng, E.; Chan, C.; Givoni, B. Outdoor Thermal Comfort Study in a Sub-Tropical Climate: A Longitudinal Study Based in Hong Kong. Int. J. Biometeorol. 2012, 56, 43–56. [Google Scholar] [CrossRef] [PubMed]
- Lenzholzer, S.; van der Wulp, N.Y. Thermal Experience and Perception of the Built Environment in Dutch Urban Squares. J. Urban Des. 2010, 15, 375–401. [Google Scholar] [CrossRef]
- Lin, T. Thermal Perception, Adaptation and Attendance in a Public Square in Hot and Humid Regions. Build. Environ. 2009, 44, 2017–2026. [Google Scholar] [CrossRef]
- Nikolopoulou, M.; Baker, N.; Steemers, K. Thermal Comfort in Outdoor Urban Spaces: Understanding the Human Parameter. Sol. Energy 2001, 70, 227–235. [Google Scholar] [CrossRef]
- Spagnolo, J.; de Dear, R. A Field Study of Thermal Comfort in Outdoor and Semi-Outdoor Environments in Subtropical Sydney Australia. Build. Environ. 2003, 38, 721–738. [Google Scholar] [CrossRef]
- Thorsson, S.; Honjo, T.; Lindberg, F.; Eliasson, I.; Lim, E.M. Thermal Comfort and Outdoor Activity in Japanese Urban Public Places. Environ. Behav. 2007, 39, 660–684. [Google Scholar] [CrossRef]
- Villadiego, K.; Velay-Dabat, M.A. Outdoor thermal comfort in a hot and humid climate of Colombia: A field study in Barranquilla. Build. Environ. 2014, 75, 142–152. [Google Scholar] [CrossRef]

| Variable | Unit or Scale | Definition, Range, or Options | Collection Method | ||
|---|---|---|---|---|---|
| Independent Variable | Microclimatic Condition | Equivalent wind speed | m/s | Mean wind speed combined with wind turbulence | Meteorological station |
| Temperature | °C | Air temperature | Meteorological station | ||
| Solar radiation | W/m2 | Amount of solar energy received at unit area | Solar power meter | ||
| Humidity | % | Relative humidity | Meteorological station | ||
| Thermal history and status | Metabolic rate | met | Energy generated inside the body due to various activities (1 met = 58.2 W/m2) | Survey | |
| Time spent outside in the last 1-h | minute | Degree of adaptation to the outdoor microclimatic conditions | Survey | ||
| Clothing insulation | clo | Thermal insulation provided by garments and clothing ensembles (1 clo = 0.155 m2·°C/W) | Recording by surveyor | ||
| Individual | Gender | - | 1 = Female | Recording by surveyor | |
| 2 = Male | |||||
| Visit frequency | - | 1 = 4+ times per week | Survey | ||
| 2 = 1–3 times per week | |||||
| 3 = 1–3 times per month | |||||
| 4 = Rarely or first time | |||||
| Visit purpose | - | 1 = Wait for someone | Survey | ||
| 2 = Rest or linger | |||||
| 3 = Have lunch/coffee | |||||
| 4 = On way to somewhere | |||||
| 5 = Others | |||||
| Location | Location | - | 1 =YB | Recording by surveyor | |
| 2 = VN | |||||
| 3 = CC | |||||
| 4 = MBN | |||||
| Usual use of sustainable transportation modes | Frequency of public transportation use | - | 1 = Rarely | Survey | |
| 2 = Sometimes | |||||
| 3 = Frequently | |||||
| Frequency of bicycling | - | 1 = Rarely | Survey | ||
| 2 = Sometimes | |||||
| 3 = Frequently | |||||
| Dependent Variable | Discouragement for sustainable transportation mode choice | Discouragement for waiting at transit stop with no shelter | - | 1 = No effect | Survey |
| 2 = Slightly | |||||
| 3 = Strongly | |||||
| Discouragement for bicycling | - | 1 = No effect | Survey | ||
| 2 = Slightly | |||||
| 3 = Strongly | |||||
| Discouragement for walking | - | 1 = No effect | Survey | ||
| 2 = Slightly | |||||
| 3 = Strongly | |||||
| Variable | Unit | Descriptive Statistics or Frequency | |||||||
|---|---|---|---|---|---|---|---|---|---|
| Independent Variable | Min | Max | Mean | SD | |||||
| Microclimatic Condition | Equivalent wind speed | m/s | 0.8 | 13.1 | 5.2 | 2.0 | |||
| Temperature | °C | 12.3 | 24.3 | 17.4 | 2.4 | ||||
| Solar radiation | W/m2 | 6 | 949 | 238 | 249 | ||||
| Humidity | % | 46.2 | 94.4 | 69.8 | 11.1 | ||||
| Thermal history and status | Metabolic rate | Met | 0.6 | 4.5 | 1.7 | 0.5 | |||
| Time spent outside in the last 1-h | minute | 0 | 60 | 26 | 20 | ||||
| Clothing insulation | Clo | 0.30 | 1.64 | 0.86 | 0.24 | ||||
| Individual | Gender | - | Female: 295 (42%) | ||||||
| Male: 406 (58%) | |||||||||
| Visit frequency | - | 4+ times per week: 287 (41%) | |||||||
| 1–3 times per week: 127 (18%) | |||||||||
| 1–3 times per month: 143 (20%) | |||||||||
| Rarely/first time: 144 (21%) | |||||||||
| Visit purpose | - | Wait for someone: 16 (2%) | |||||||
| Rest or linger: 35 (5%) | |||||||||
| Have lunch/coffee: 98 (14%) | |||||||||
| On way to somewhere: 391 (56%) | |||||||||
| Others: 161 (23%) | |||||||||
| Location | Location | - | YB: 239 (34%) | ||||||
| VN: 161 (23%) | |||||||||
| CC: 183 (26%) | |||||||||
| MBN: 118 (17%) | |||||||||
| Rarely | Sometimes | Frequently | |||||||
| Usual use of Sustainable Transportation Modes | Frequency of public transportation use | - | 117 (17%) | 117 (17%) | 407 (58%) | ||||
| Frequency of bicycling | - | 442 (63%) | 136 (19%) | 123 (18%) | |||||
| Dependent Variable | No effect | Slightly | Strongly | ||||||
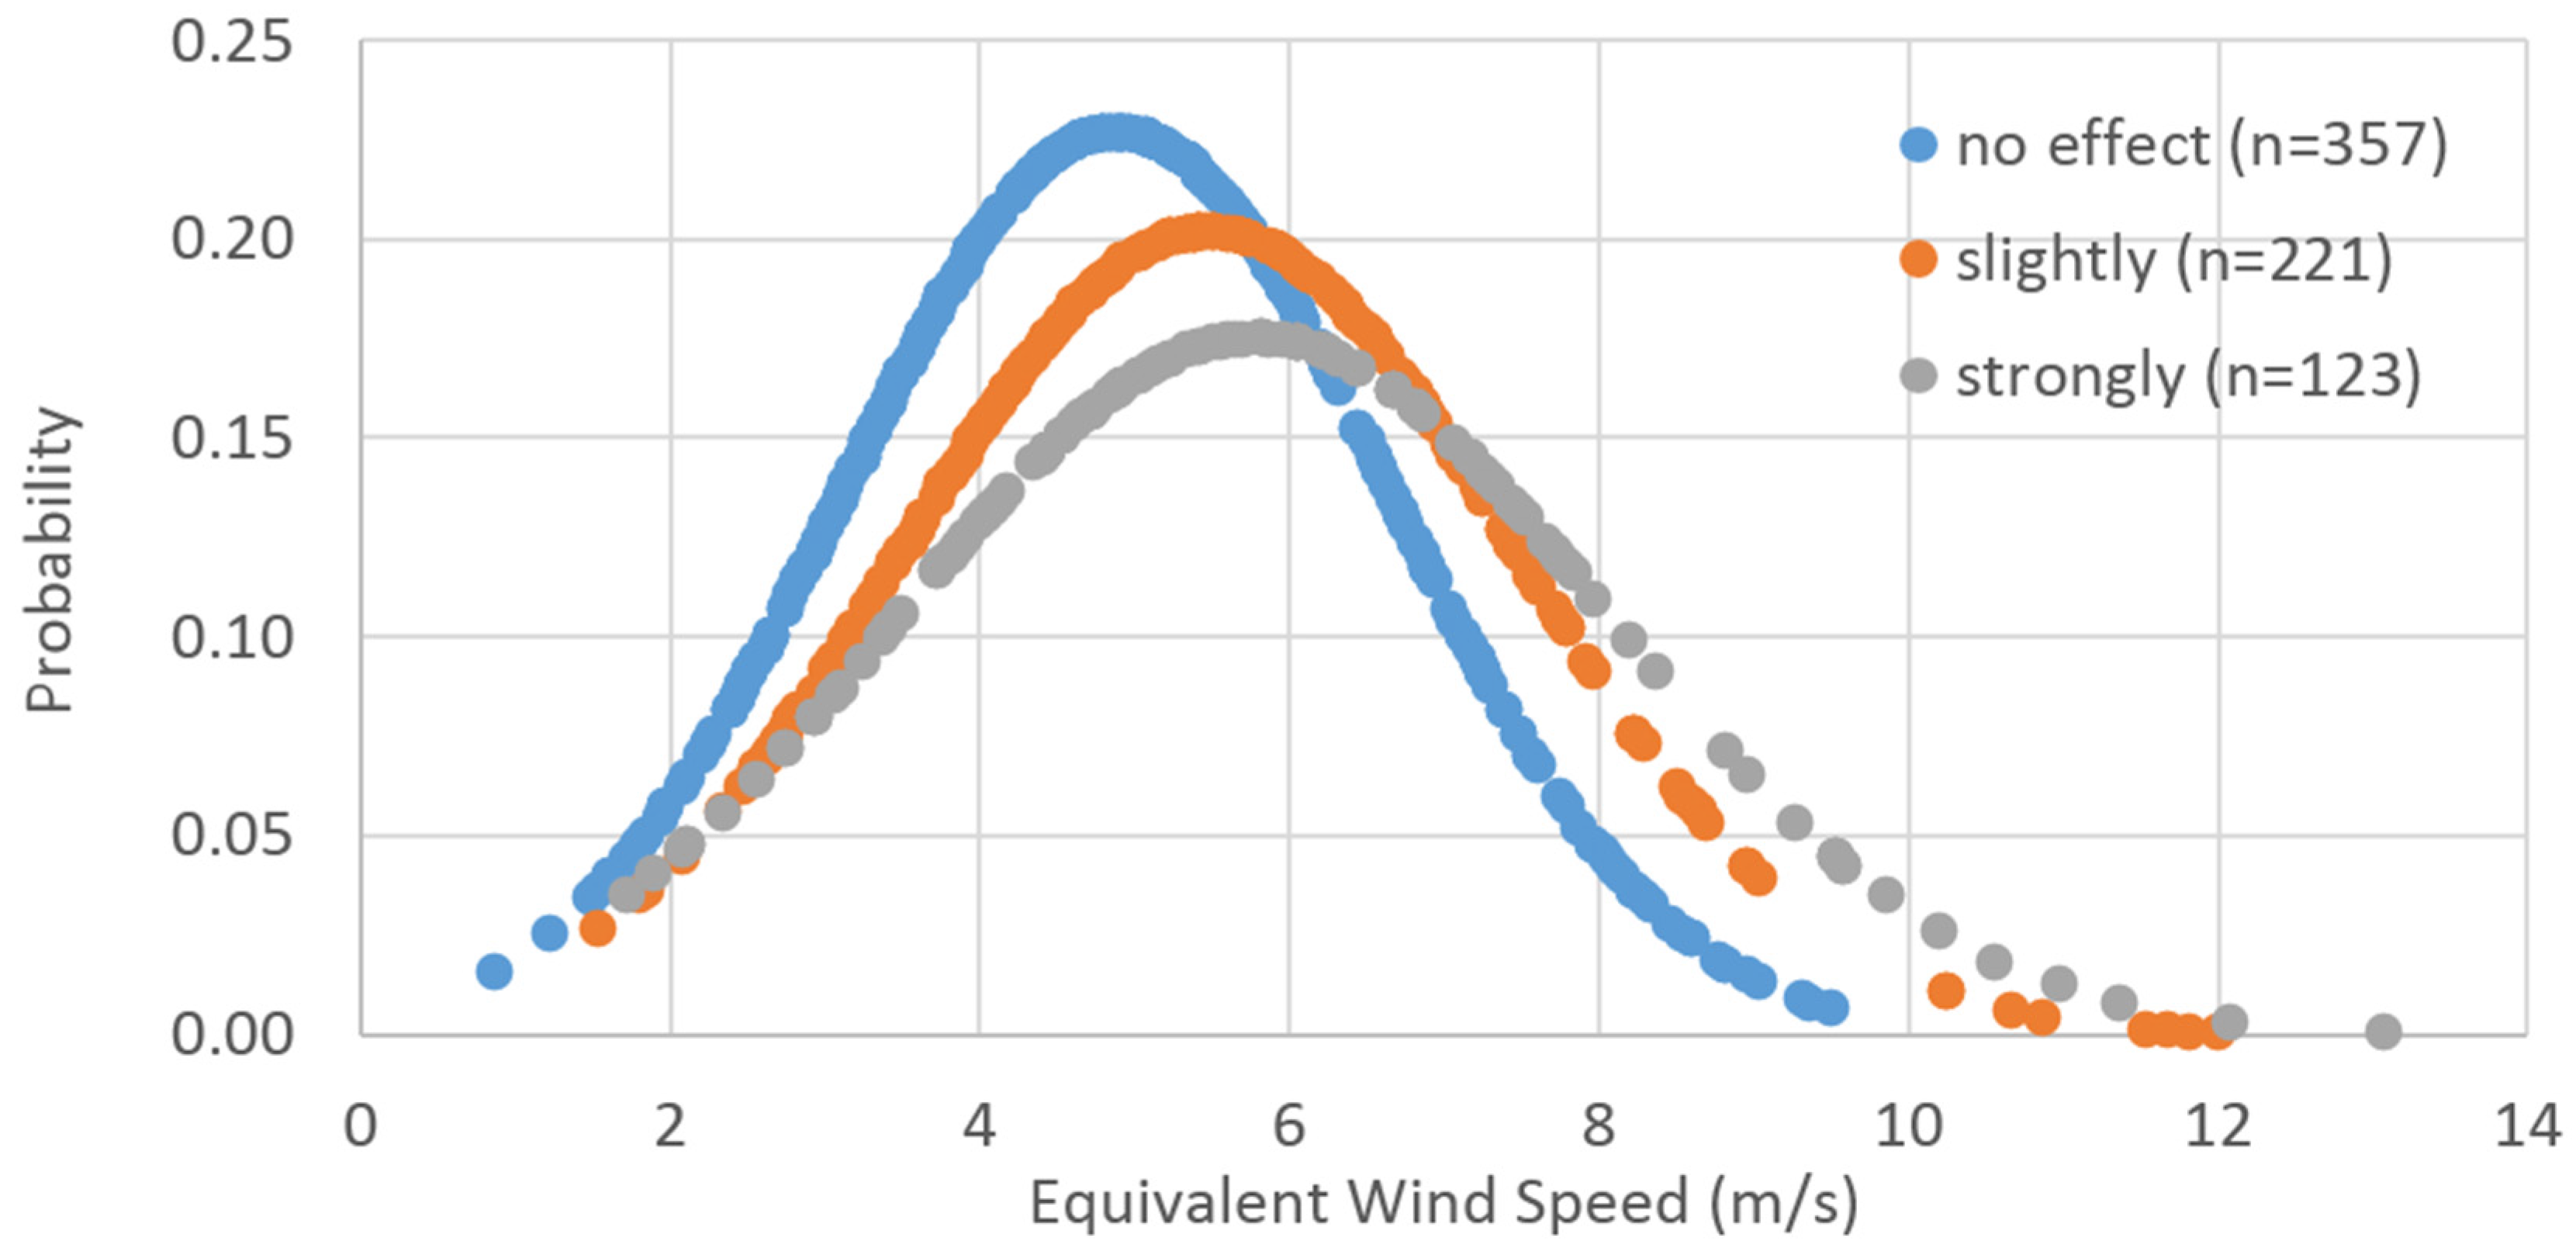
| Discouragement for sustainable transportation mode choice | Discouragement for waiting at transit stop with no shelter | - | 357 (51%) | 221 (32%) | 123 (18%) | ||||
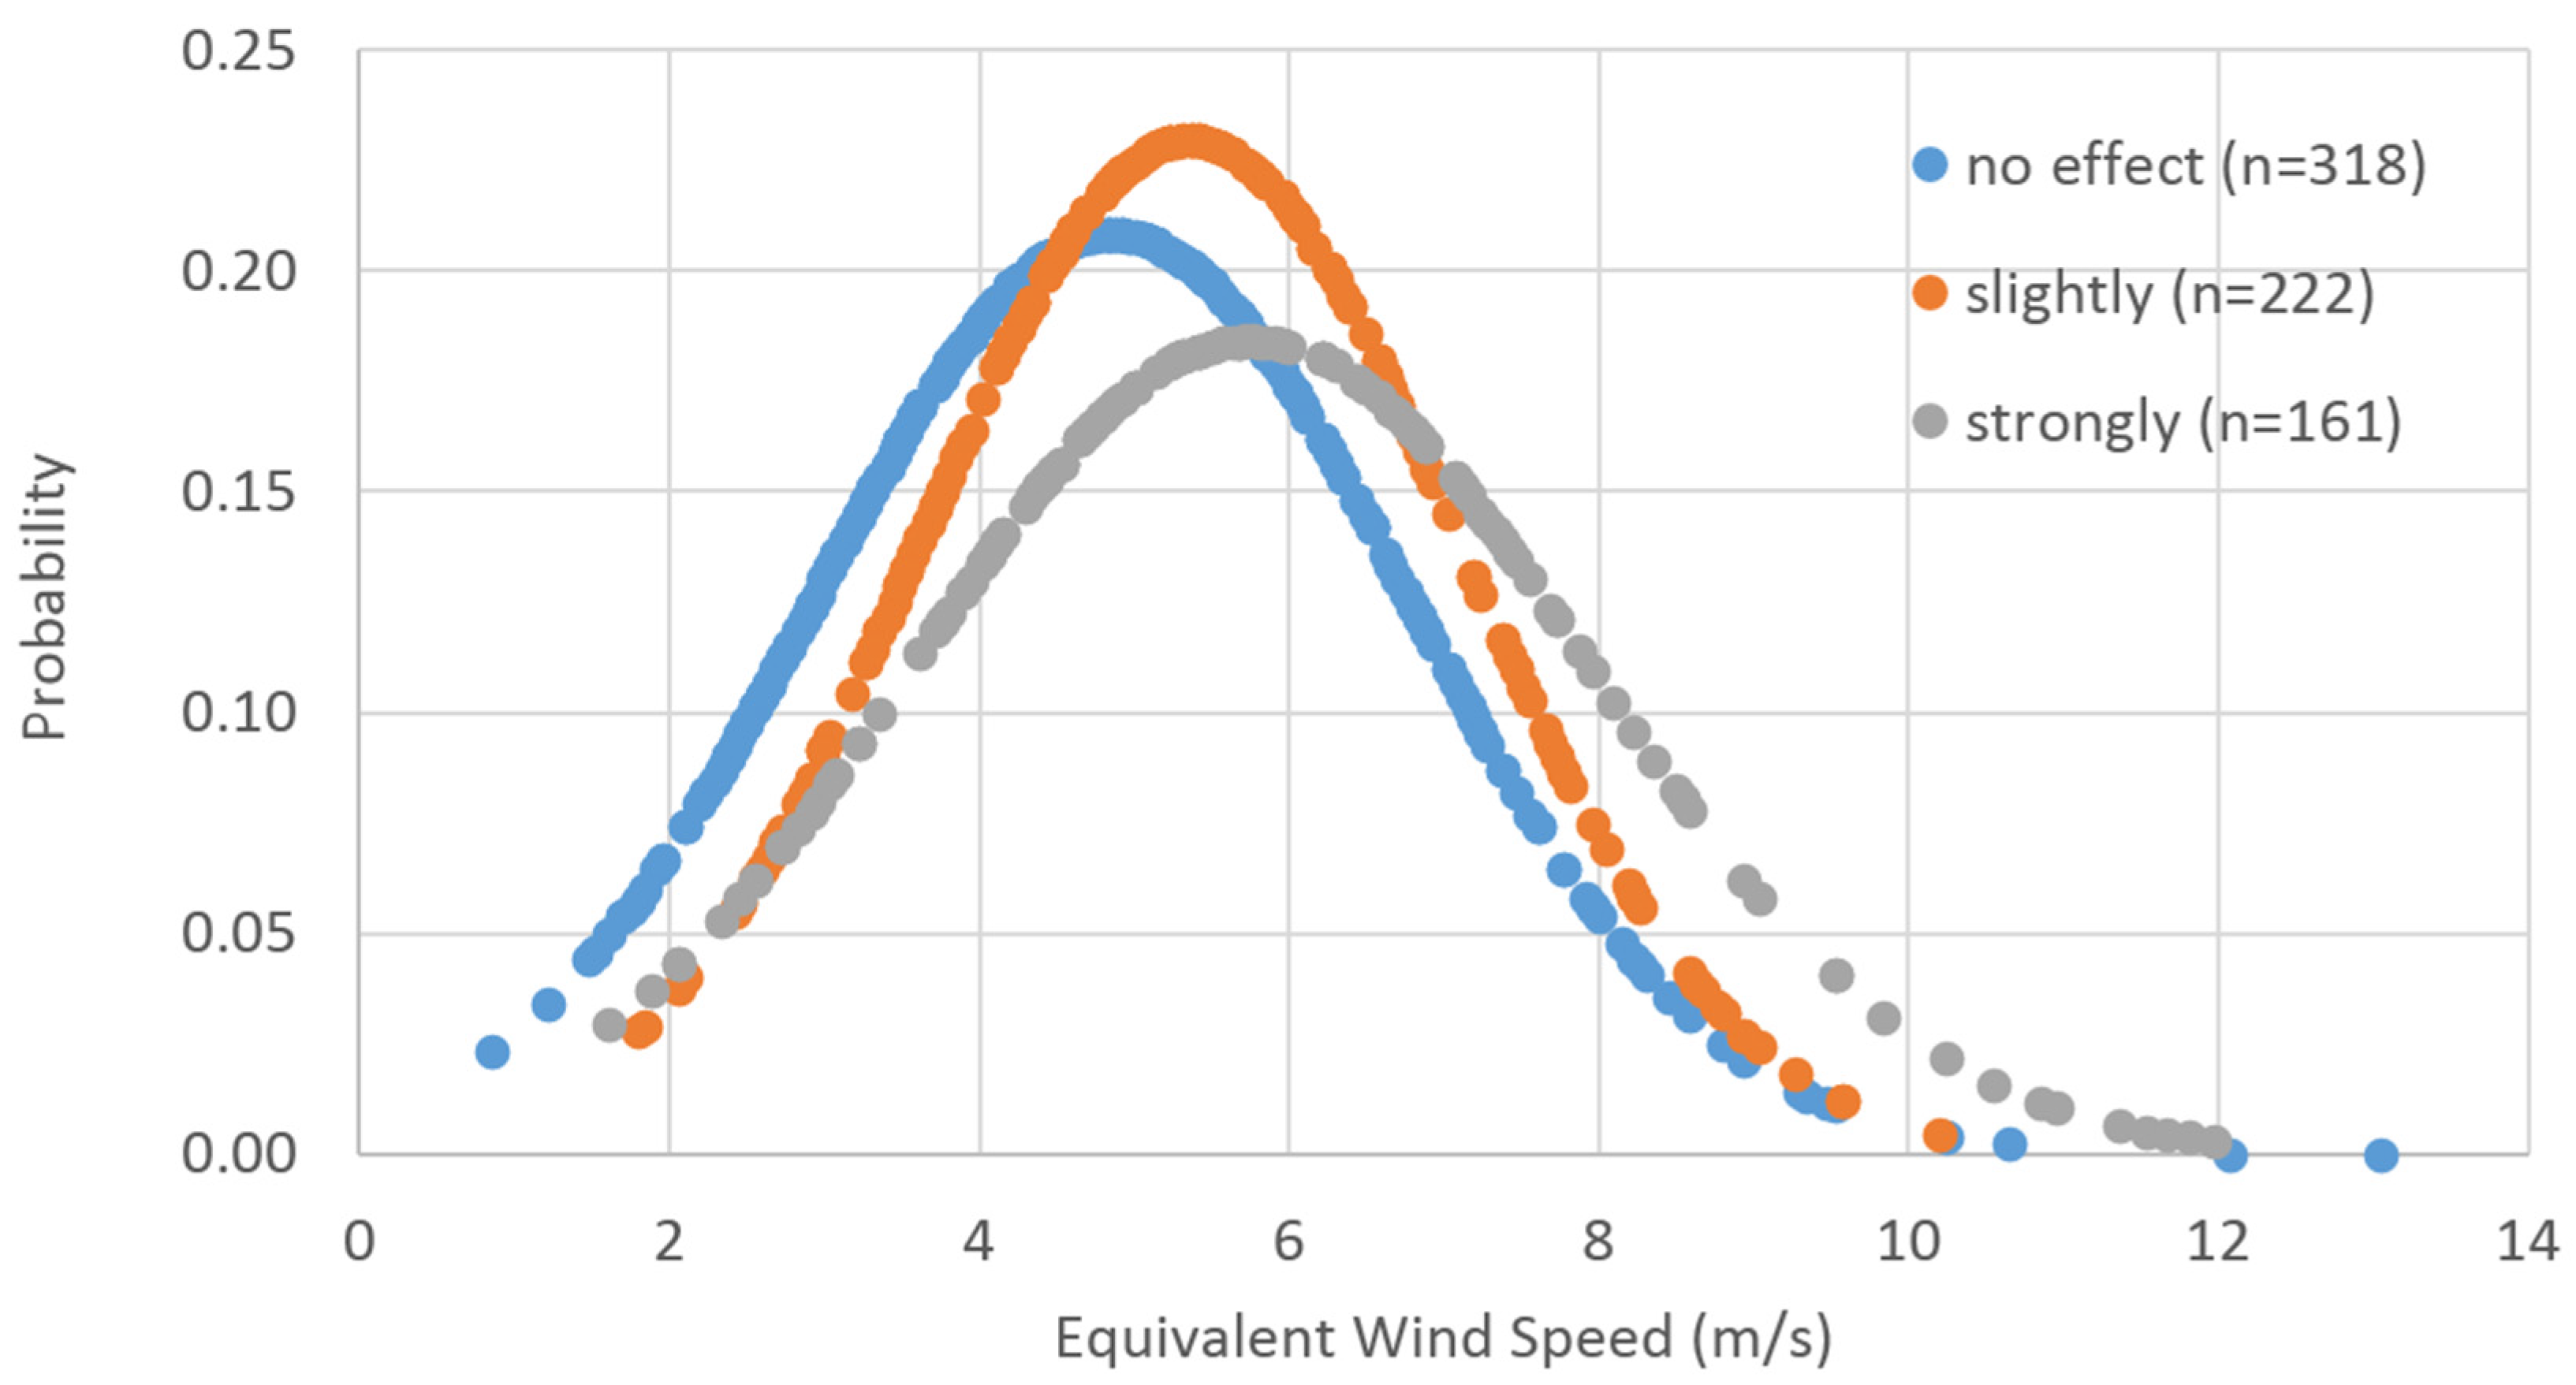
| Discouragement for bicycling | - | 318 (45%) | 222 (32%) | 161 (23%) | |||||
| Discouragement for walking | - | 417 (59%) | 223 (32%) | 61 (9%) | |||||
| Variable | Discouragement for Waiting at Transit Stop with no Shelter | Discouragement for Bicycling | Discouragement for Walking | ||||
|---|---|---|---|---|---|---|---|
| Coeff. | Z | Coeff. | Z | Coeff. | Z | ||
| Microclimatic Condition | Equivalent wind speed | 0.185 | 3.99 *** | 0.182 | 3.92 *** | 0.126 | 2.66 ** |
| Temperature | −0.097 | −1.85* | −0.049 | −0.98 | −0.065 | −1.18 | |
| Solar radiation | 0.000 | 0.37 | 0.000 | 0.46 | −0.000 | −0.69 | |
| Humidity | 0.003 | 0.28 | 0.008 | 0.73 | 0.009 | 0.78 | |
| Thermal history and status | Metabolic rate | 0.248 | 1.44 | 0.052 | 0.31 | 0.117 | 0.65 |
| Time spent outside in the last 1-h | −0.005 | −1.06 | −0.002 | −0.41 | −0.000 | −0.04 | |
| Clothing insulation | −0.206 | −0.61 | 0.047 | 0.14 | 0.620 | 1.77 * | |
| Individual | Gender a (1 = Female) | 0.277 | 1.79 * | 0.181 | 1.19 | 0.264 | 1.62 |
| Gender b (0 = Male) | 0 | - | 0 | - | 0 | - | |
| Visit frequency a | 0.091 | 0.42 | 0.037 | 0.17 | 0.179 | 0.77 | |
| (1 = 4+ times per week) | |||||||
| Visit frequency a | −0.085 | −0.35 | −0.118 | −0.49 | −0.076 | −0.29 | |
| (1 = 1–3 times per week) | |||||||
| Visit frequency a | −0.101 | −0.43 | −0.282 | −1.21 | −0.005 | −0.02 | |
| (1 = 1–3 times per month) | |||||||
| Visit frequency b | 0 | - | 0 | - | 0 | - | |
| (0 = Rarely/First time) | |||||||
| Visit purpose a | 0.002 | 0.01 | 0.308 | 0.86 | 0.317 | 0.84 | |
| (1 = Wait for someone) | |||||||
| Visit purpose a | −1.034 | −1.81 * | 0.226 | 0.45 | −0.500 | −0.86 | |
| (1 = Rest or linger) | |||||||
| Visit purpose a | 0.366 | 1.44 | 0.504 | 2.01* | 0.479 | 1.81 * | |
| (1 = Have lunch/coffee) | |||||||
| Visit purpose a | −0.065 | −0.34 | 0.185 | 0.99 | −0.207 | −1.04 | |
| (1 = On way to somewhere) | |||||||
| Visit purpose b | 0 | - | 0 | - | 0 | - | |
| (0 = Others) | |||||||
| Location | Location a (1 = YB) | −0.032 | −0.13 | 0.035 | 0.14 | −0.038 | −0.14 |
| Location a (1 = VN) | −0.589 | −2.05 ** | −0.375 | −1.35 | −0.285 | −0.97 | |
| Location a (1 = CC) | −0.298 | −1.14 | −0.182 | −0.72 | −0.383 | −1.40 | |
| Location b (0 = MBN) | 0 | - | 0 | - | 0 | - | |
| Usual use of Sustainable Transportation Modes | Frequency of public transportation use a | −0.438 | −1.85 * | −0.039 | −0.17 | −0.182 | −0.71 |
| (1 = Sometimes) | |||||||
| Frequency of public transportation use a | −0.300 | −1.40 | 0.062 | 0.30 | 0.158 | 0.69 | |
| (1 = Frequently) | |||||||
| Frequency of public transportation use b | 0 | - | 0 | - | 0 | - | |
| (0 = Rarely) | |||||||
| Frequency of bicycling a | 0.107 | 0.56 | 0.089 | 0.48 | −0.182 | −0.87 | |
| (1 = Sometimes) | |||||||
| Frequency of bicycling a | −0.400 | −1.88 * | −0.287 | −1.43 | −0.070 | −0.32 | |
| (1 = Frequently) | |||||||
| Frequency of bicycling b | 0 | - | 0 | - | 0 | - | |
| (0 = Rarely) | |||||||
| Summary Statistics | N | 701 | 701 | 701 | |||
| Log likelihood | −680.176 | −720.731 | −592.718 | ||||
| Likelihood ratio Chi2 | 59.78 | 45.49 | 56.46 | ||||
| p | < 0.001 | < 0.001 | < 0.001 | ||||
| McFadden’s pseudo R2 | 0.042 | 0.031 | 0.046 | ||||
© 2016 by the authors; licensee MDPI, Basel, Switzerland. This article is an open access article distributed under the terms and conditions of the Creative Commons by Attribution (CC-BY) license (http://creativecommons.org/licenses/by/4.0/).
Share and Cite
Kim, H.; Macdonald, E. Does Wind Discourage Sustainable Transportation Mode Choice? Findings from San Francisco, California, USA. Sustainability 2016, 8, 257. https://doi.org/10.3390/su8030257
Kim H, Macdonald E. Does Wind Discourage Sustainable Transportation Mode Choice? Findings from San Francisco, California, USA. Sustainability. 2016; 8(3):257. https://doi.org/10.3390/su8030257
Chicago/Turabian StyleKim, Hyungkyoo, and Elizabeth Macdonald. 2016. "Does Wind Discourage Sustainable Transportation Mode Choice? Findings from San Francisco, California, USA" Sustainability 8, no. 3: 257. https://doi.org/10.3390/su8030257
APA StyleKim, H., & Macdonald, E. (2016). Does Wind Discourage Sustainable Transportation Mode Choice? Findings from San Francisco, California, USA. Sustainability, 8(3), 257. https://doi.org/10.3390/su8030257