Article

Indication of Importance of Including Soil Microbial Characteristics into Biotope Valuation Method

1
Faculty of Environment, Jan Evangelista Purkyně University in Ústí nad Labem, Králova Výšina 3132/7, 400 96 Ústí nad Labem, Czech Republic
2
Institute of Chemical Process Fundamentals, ASCR, Rozvojová 135, 165 00 Prague 6, Czech Republic
*
Author to whom correspondence should be addressed.
Sustainability 2016, 8(3), 253; https://doi.org/10.3390/su8030253
Submission received: 31 December 2015 / Revised: 17 February 2016 / Accepted: 22 February 2016 / Published: 9 March 2016
(This article belongs to the Section Environmental Sustainability and Applications)

Abstract

:
Soil is a key part of a biotope and microorganisms are dominant components contributing to soil functions. Conversely, established methods for valuation of biotopes according to Natura 2000 rely predominantly on the communities living on the surface. Here, we aimed to assess soil microbial biomass and community structure on five localities with range of biotope values by means of phospholipid fatty acid (PLFA) profiling. PLFA figures were affected both by sampling season (spring vs. autumn) and locality. In spring, the living microbial biomass (estimated by PLFAtot) exhibited poor correlation to biotope values. These were, on the contrary, correlated to trans/cis PLFA, an indicator of microbial stress, (i.e., lower stress in higher-rated biotopes), and fungal/bacterial PLFA (i.e., higher-rated biotopes contained more fungi). The attempt to model biotope values from microbial characteristics explained a maximum of ~50% of the variability; the best predictors were the trans/cis stress indicator, percentage of actinobacterial PLFA, and ratio of PLFA of Gram-positive to Gram-negative bacteria. These results show that soil microbial characteristics present partly new information and indicate the need to amend the procedures of biotope assessment. Soil PLFA profiling could serve as suitable methods for this purpose.

1. Introduction

Increasing necessity of sustainable development has revealed, among others, the need of valuation of biotopes and ecosystems and their functions and services. The concept of biotope defines specific biotic and abiotic conditions of some area (such as climate, soil, altitude, and composition of living species) which meet the requirements of specific plant and animal species. The term “ecosystem” evolved to describe mainly the functional relations (energy flows, trophic chains, and transfer of information) between biotic and abiotic parts of biotopes and their groups. Established methods for assessing and valuation of biotopes, according to Natura 2000 [1], rely predominantly on the plant and animal communities living on the terrestrial surface and do not reflect the species richness and quality of microbial life under the soil surface [1,2,3,4].
Biotope valuation method (BVM), as originally developed in the Hessian state of Germany and recommended as an inspirative system for valuing the benefits of nature and landscape by the EU White paper on Environmental Liability [5], (p. 20), and later also elaborated for the territory of the Czech Republic [2], has been developed for assessing the biodiversity damages and reasonable costs of ecological restorations. BVM is an expert method to establish a list of national biotopes and rank them by point values according to their capacity as specific environments for living plant and animal species (including NATURA 2000). Each biotope type has been valued by an interdisciplinary team of ecologists and economists from different scientific backgrounds using points according to eight ecological characteristics (matureness, naturalness, diversity of plant species, diversity of animal species, rareness of biotope, rareness of species, vulnerability, and threat to existence), each of them with a potential point value ranging from one to six points (for a complete list of biotope values see [6]. Biotope point values are derived from the relative ecological significance of the respective biotope and are transferred into monetary terms by average national costs of restoration measures, necessary for one point increase, i.e., for maintaining and improving the biotopes as environments for healthy ecosystems.
Soils present dominant components of biotopes and ecosystems. They provide a base and nutrient source for growing plants, serve as habitats for various organisms and provide essential functions such as nutrient cycling or water retention. Quality of soils limit the quality of ecosystems and the range of provided ecosystem functions and services. Soil microorganisms are its essential components and play a dominant role in soil processes. To date, a series of methods have been developed for study of soil microbial communities [7,8]. Among them phospholipid fatty acid (PLFA) profiling provides culture-independent assessment of living microbial biomass, a rough estimation of community structure, and an indication of its physiological state [9,10].
In this preliminary study we aim to compare biotope assessment calculated by the BVM [2] with soil microbial characteristics estimated from PLFA profiles on five different sites around the city of Ústí nad Labem (north-west of the Czech Republic). The research was driven by two unresolved questions: (1) is there a relationship between characteristics of soil microbial community and biotope value; and (2) can the BVM be amended to include indicators of microbial communities? The aim was to look for relationships and correlations and to suggest possible improvements of the BVM.

2. Experimental Section

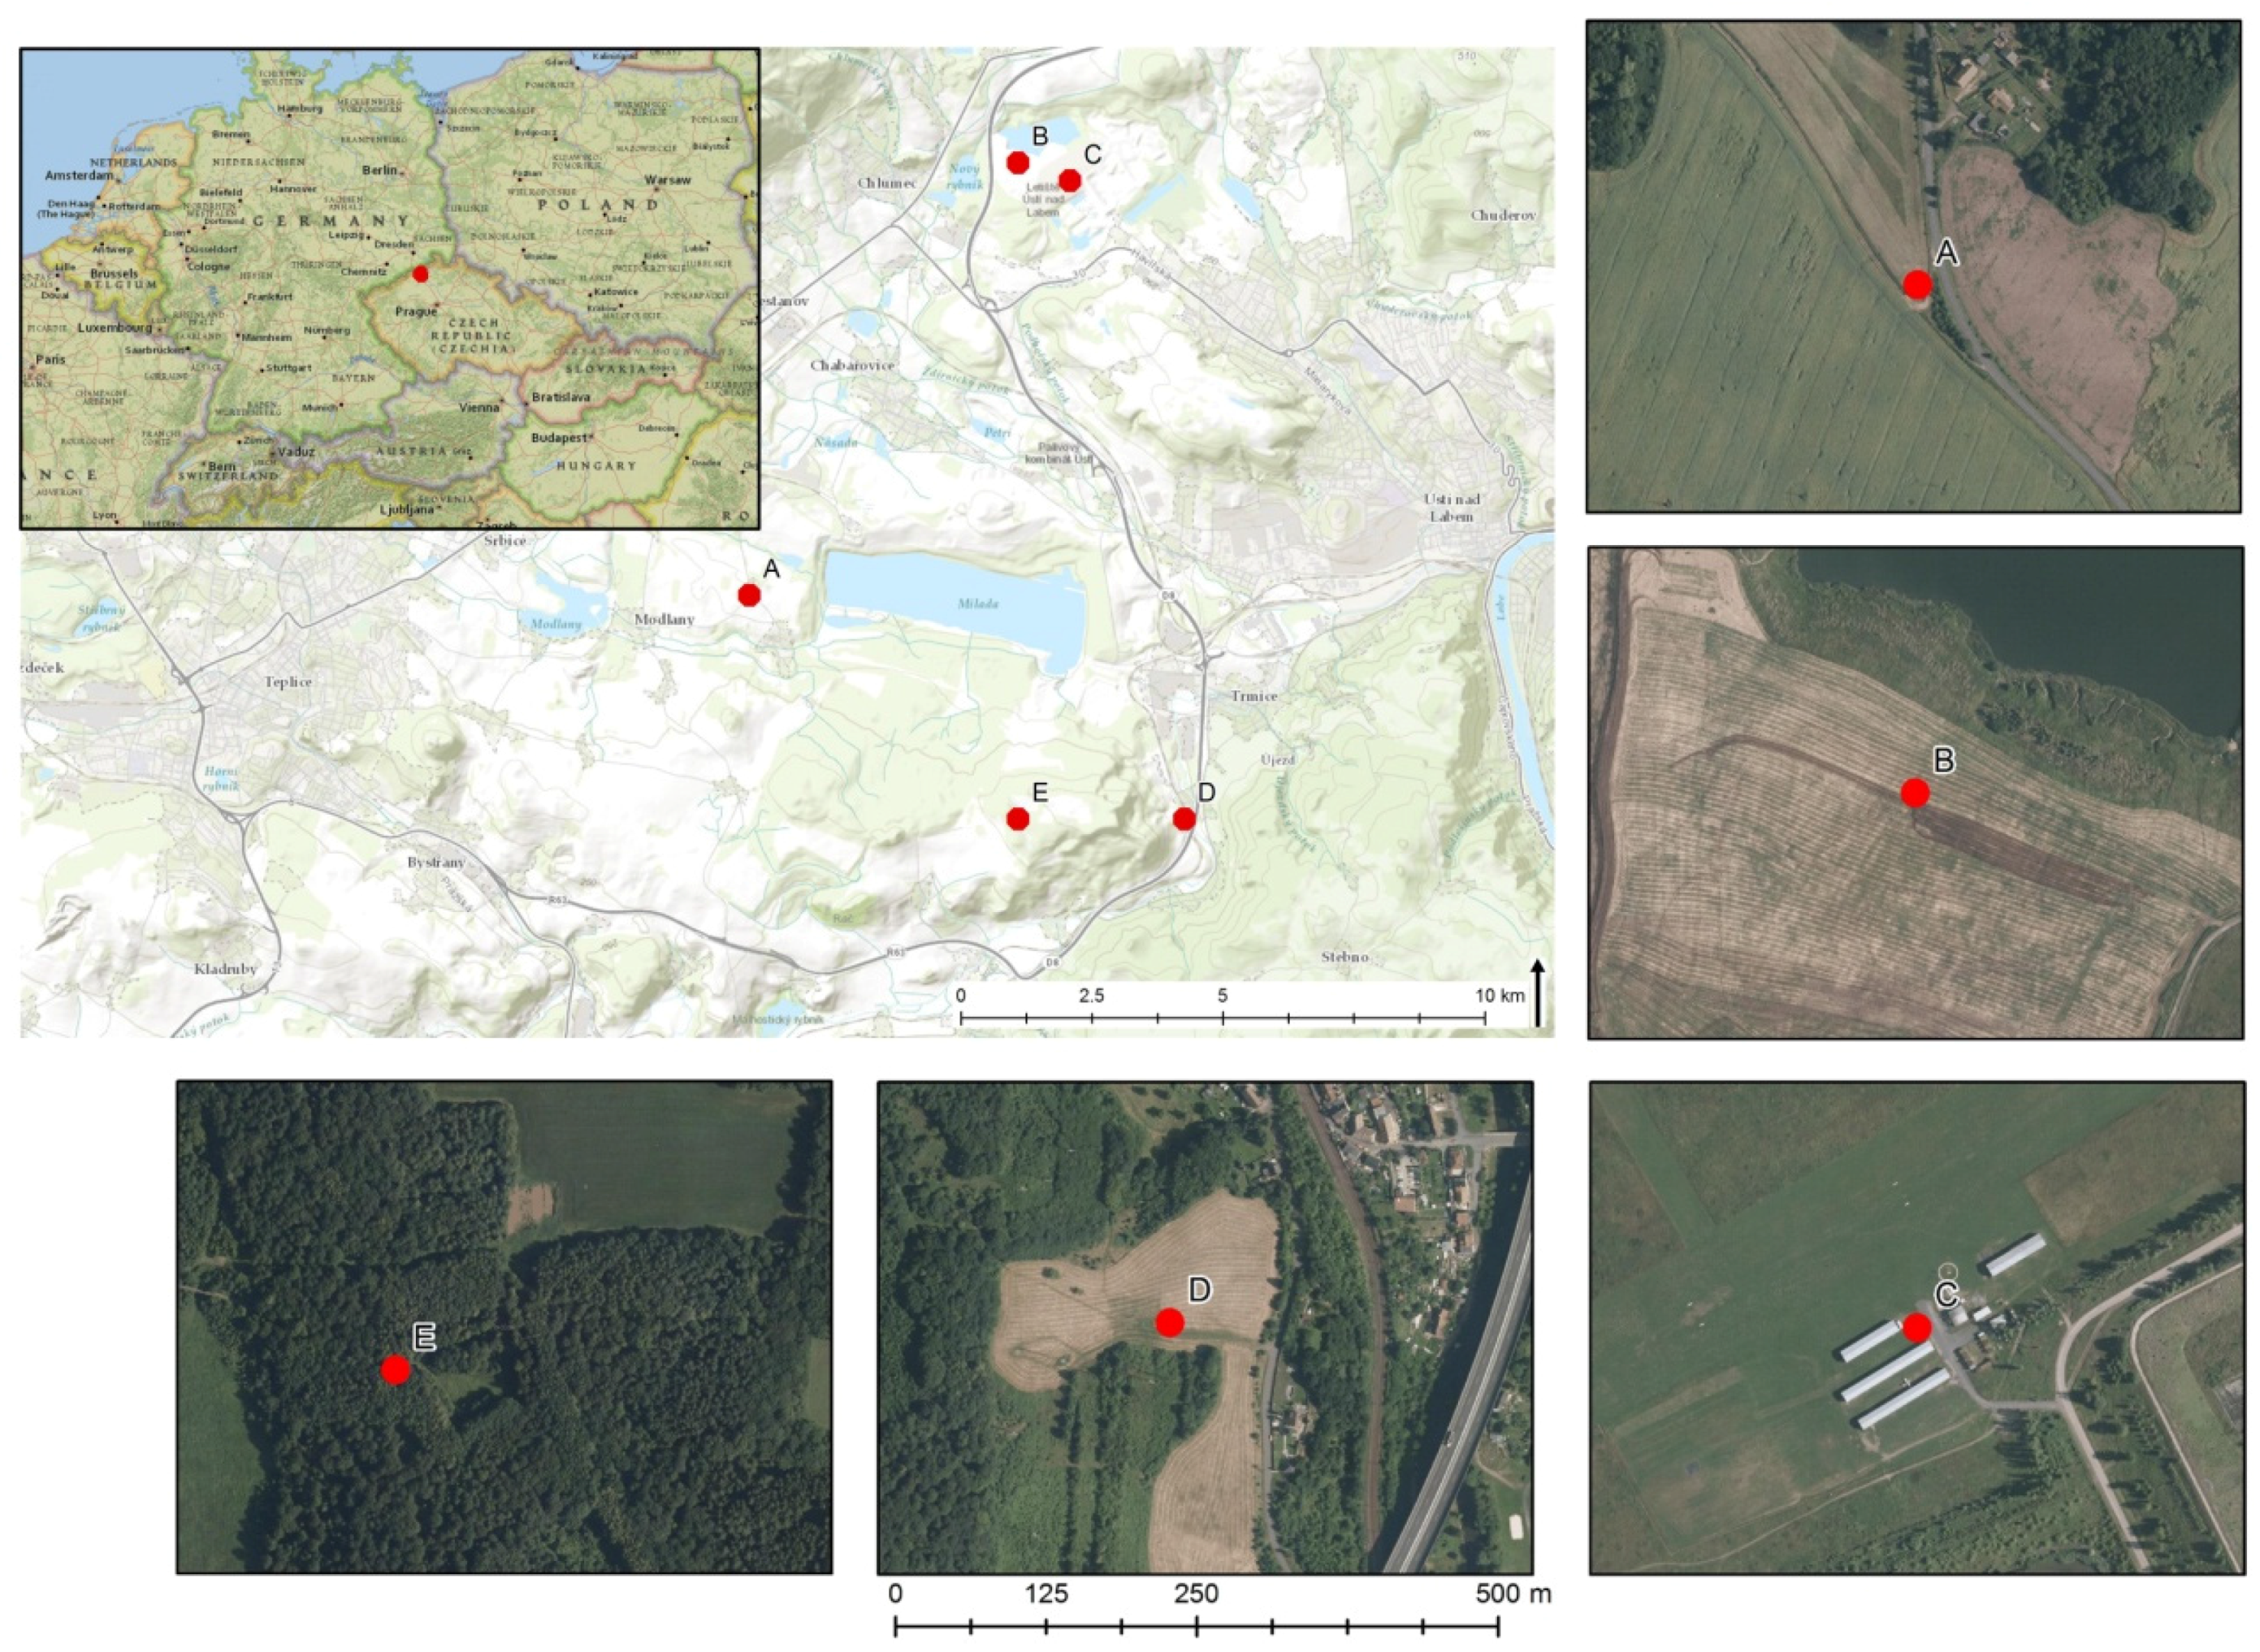
2.1. Study Sites and Sampling

Five sampling sites representing various ecosystems, localized partly on a former reclaimed open-cast brown coal mine, were selected. Details are summarized in Table 1, as well as on the map (Figure 1).
The sites were sampled in 2010 and 2011 in spring (June) and autumn (October) in order to follow presumed seasonality. Samples were withdrawn using a tubular sampler (5 cm diameter) [11]. The aboveground litter or grass layer was removed. The samples were then frozen (−30 °C) for further analysis. For each locality and sampling time four samples of upper 5 cm of soil were withdrawn and gathered together to form a mixed sample analyzed further. In autumn samplings, in addition, the samples for assessment of vertical PLFA patterns were also withdrawn (upper 12 cm of soil), separated vertically to 4 cm blocks and labeled a, b, and c from the top. Four samples of the same layer were mixed together and analyzed further.

2.2. PLFA Analyses

PLFA were analyzed as described previously [12,13] by the method conforming to ISO standard [14]. Briefly, the total lipids were extracted from soil by a single-phase mixture of chlorophorm, methanol, and phosphate buffer. The polar lipid fraction (includes phospholipids) was isolated by means of solid-phase extraction on silica columns and subjected to mild alkaline methanolysis. Produced fatty acid methyl esters (FAME) were determined by gas chromatography (Varian GC 3800, Palo Alto, CA, USA) with mass spectroscopy detector (Varian MS 4000).
The total PLFA (PLFAtot) was used as an indicator of living microbial biomass. Indicator FAMEs, according to Federici [15] (Table 2), were used to estimate the biomass of particular microbial groups and for calculation of physiological indicators.

2.3. Other Analyses

Soil pH was determined in a deionized water extract (1 g of soil extracted in 5 mL of water) according to the procedure used in a previous study [11]. Soil moisture was determined by drying at 105 °C to the constant weight according to the procedure used in a previous study [12].

2.4. Calculation and Statistics

PLFA values were recalculated per 1 g of dry soil mass. To enhance number of values for statistics equivalent of upper 5 cm was calculated from samples withdrawn for vertical PLFA patterns as a + 0.2 × b. In sum, 30 values were available for statistical analyses (for evaluation of locality factors six values per locality; for evaluation of the season factor 10 values for spring, and 20 values for autumn).
To determine differences in vertical PLFA patterns (differences of PLFA values with soil depth) average PLFA of samples a, b, and c were compared, based on their standard analytical errors observed over the long-term (±15%).
Correlation analyses, Kruskal–Wallis non-parametric analysis of variance, and principal component analysis was calculated using Statistica 12 software (StatSoft Inc, Tulsa, OK, USA). Stepwise linear regression was calculated using QC.Expert 3.3 (Trilobyte Statistical Software s.r.o., Pardubice, Czech Republic, www.trilobyte.cz).
Pearson’s correlation coefficient (including the significance level calculated for each correlation) was used to determine the linear dependency between each pair of soil parameters. Principal component analysis (PCA) based on the covariance matrix of the data was used to bring out strong patterns in a dataset and to reduce its high dimension. Only components whose eigenvalues are greater than one were extracted and displayed. Due to the low sample sizes, a non-parametrical Kruskal–Wallis test was used as a robust method for identifying factors affecting variability in the data (prior to one-way ANOVA). To identify possible complex linear relationships between biotope values and determined soil parameters a stepwise linear regression was carried out. In successive steps, all possible models were compared according to Akakie’s information criterion (AIC [17]) and for each number of regression parameters those with minimal value of AIC were retained. Due to the limited number of samplings and high correlation between samples, only models with up to three parameters were compared (Harrell recommends at least 10 data points per parameter [18]).

3. Results and Discussion

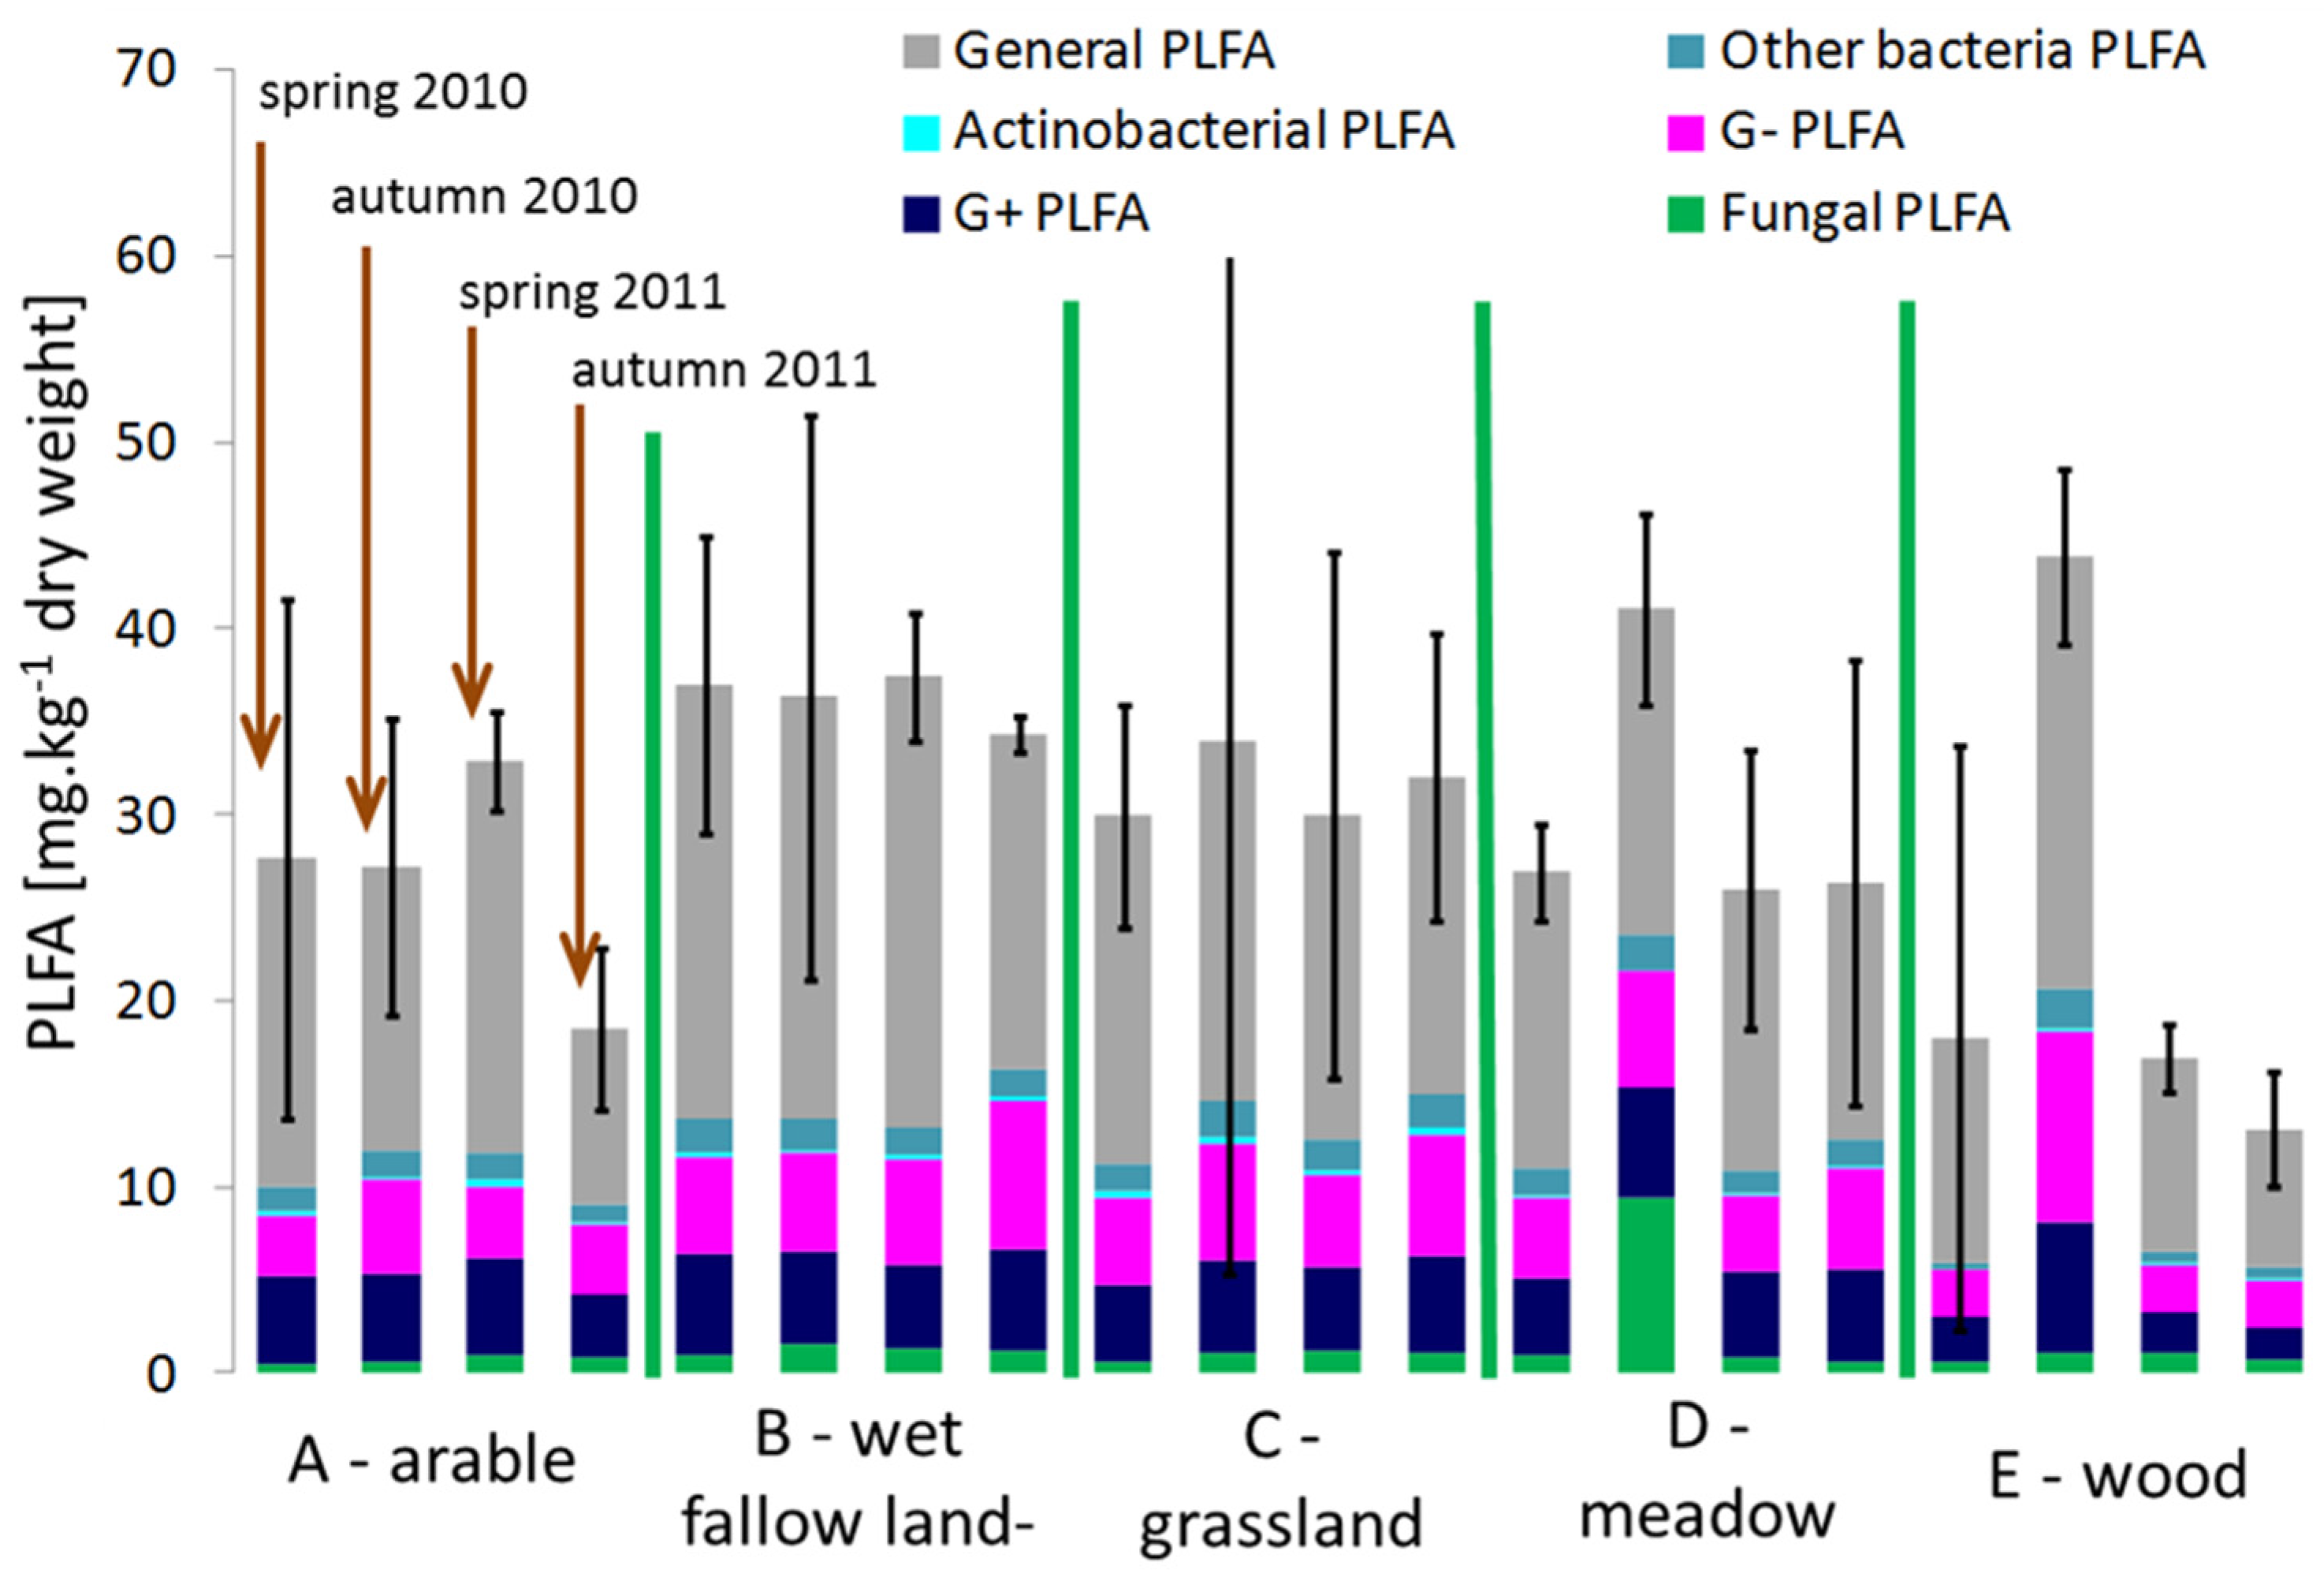
3.1. Soil Indicators in Study Sites and Their Variability

Soils on tested localities exhibited different vertical PLFA patterns. Former reclaimed spoil-dumps (localities B and C) possessed soil layers of a thickness lower than 10 cm on a spoil clay material. Arable soil of locality A, as expected, was homogenous to at least 15 cm both visually, as well as in terms of PLFA indicators (all in Table 2). The wood locality E, likely due to prevailing oaks (Querceus sp.), exhibited significant signs in activity of boars. Samples affected by boars were mixed to at least 15 cm depth and PLFA indicators did not differ with depth. Nevertheless samples taken from occasional unaffected places exhibited clear stratification to the litter layer, fermentation layer, and mature soil layer. Meadow (locality D) exhibited higher PLFAtot in the upper ~2–3 cm with a higher portion of grass decomposition. To overcome differences in vertical patterns and other interferences we have decided to sample upper 5 cm of soil in each locality only. This concept was used also in other studies (e.g., [11,19,20]) and, thus, it supports comparability of results.
Concentrations of indicator PLFA are presented in Figure 2. The lowest PLFAtot were surprisingly found in the natural wood (site D), while the highest PLFA concentrations were determined in wet fallow land (site B). With the exception of wood, obtained PLFAtot values were comparable to values obtained in other similar biotopes worldwide [11,12,21]. Additionally, the calculated ratios and indexes showed signs of standard undisturbed soils, i.e., G+/G− ratios comparable to standard value of ~1 [10], and cy/pre ratios predominantly below 0.4 [10,16].
Except for the mentioned activity of boars, a few other unexpected events in sampling sites were detected during the two-year sampling period. These events may have affected the PLFA profiles slightly, however due to their single nature they could not be statistically confirmed. Directly in site D, signs of inconsiderate picnics were obvious at the last sampling campaign, especially discarded rubbish, broken grass, and a fireplace. This might be the reason for lower PLFAtot from this sampling accompanied also by a decreased F/B ration (0.06 in autumn 2011 vs. 0.15 in autumn 2010) and increased trans/cis stress indicators (0.14 vs. 0.11) and cy/pre (0.61 vs. 0.34). Crop change was likely the reason for higher variability of PLFA indicators in arable soil (site A).
In addition to mentioned vertical patterns, other sources of variability (i.e., locality and season) were tested by Kruskal–Walis non-parametric analysis of variance (Table 3). Abiotic parameters (soil pH and dry weight) differed significantly between localities but exhibited insignificant season variation. On the other hand, a majority of PLFA parameters differed significantly between the spring and autumn samplings, with the exception of PLFAtot and the F/B ratio. Parameters F/B, G+/G−, and G+ (%) exhibited insignificant differences between localities.
The seasonal variability of PLFA parameters, observed in many studies [11,22,23,24], is not surprising due to factors, such as weather changes or input of fresh material (litter) resulting in activity of zymogenic microorganisms. In our case we observed higher raining and above-mentioned unexpected events during autumn sampling and, therefore, we have decided to analyze more stable spring data separately.
Variability of data was also assessed by PCA (Figure 3). The three principal components explained together ~70% regardless accounting all data or spring data only, further components explained 10% or less variability each.
Accounting data from both seasons the principal component one correlates well with indicators related to G+ and G− bacteria, while the principal component two could be related to the trans/cis stress indicator, and partly to biotope value and F/B indicators. Principal component three correlates predominantly with indicators of Actinobacteria. Quantitative indicator PLFAtot, as well as soil pH, are more or less independent. Accounting for spring data only, principal component one can be related to biotope values and F/B ratio.

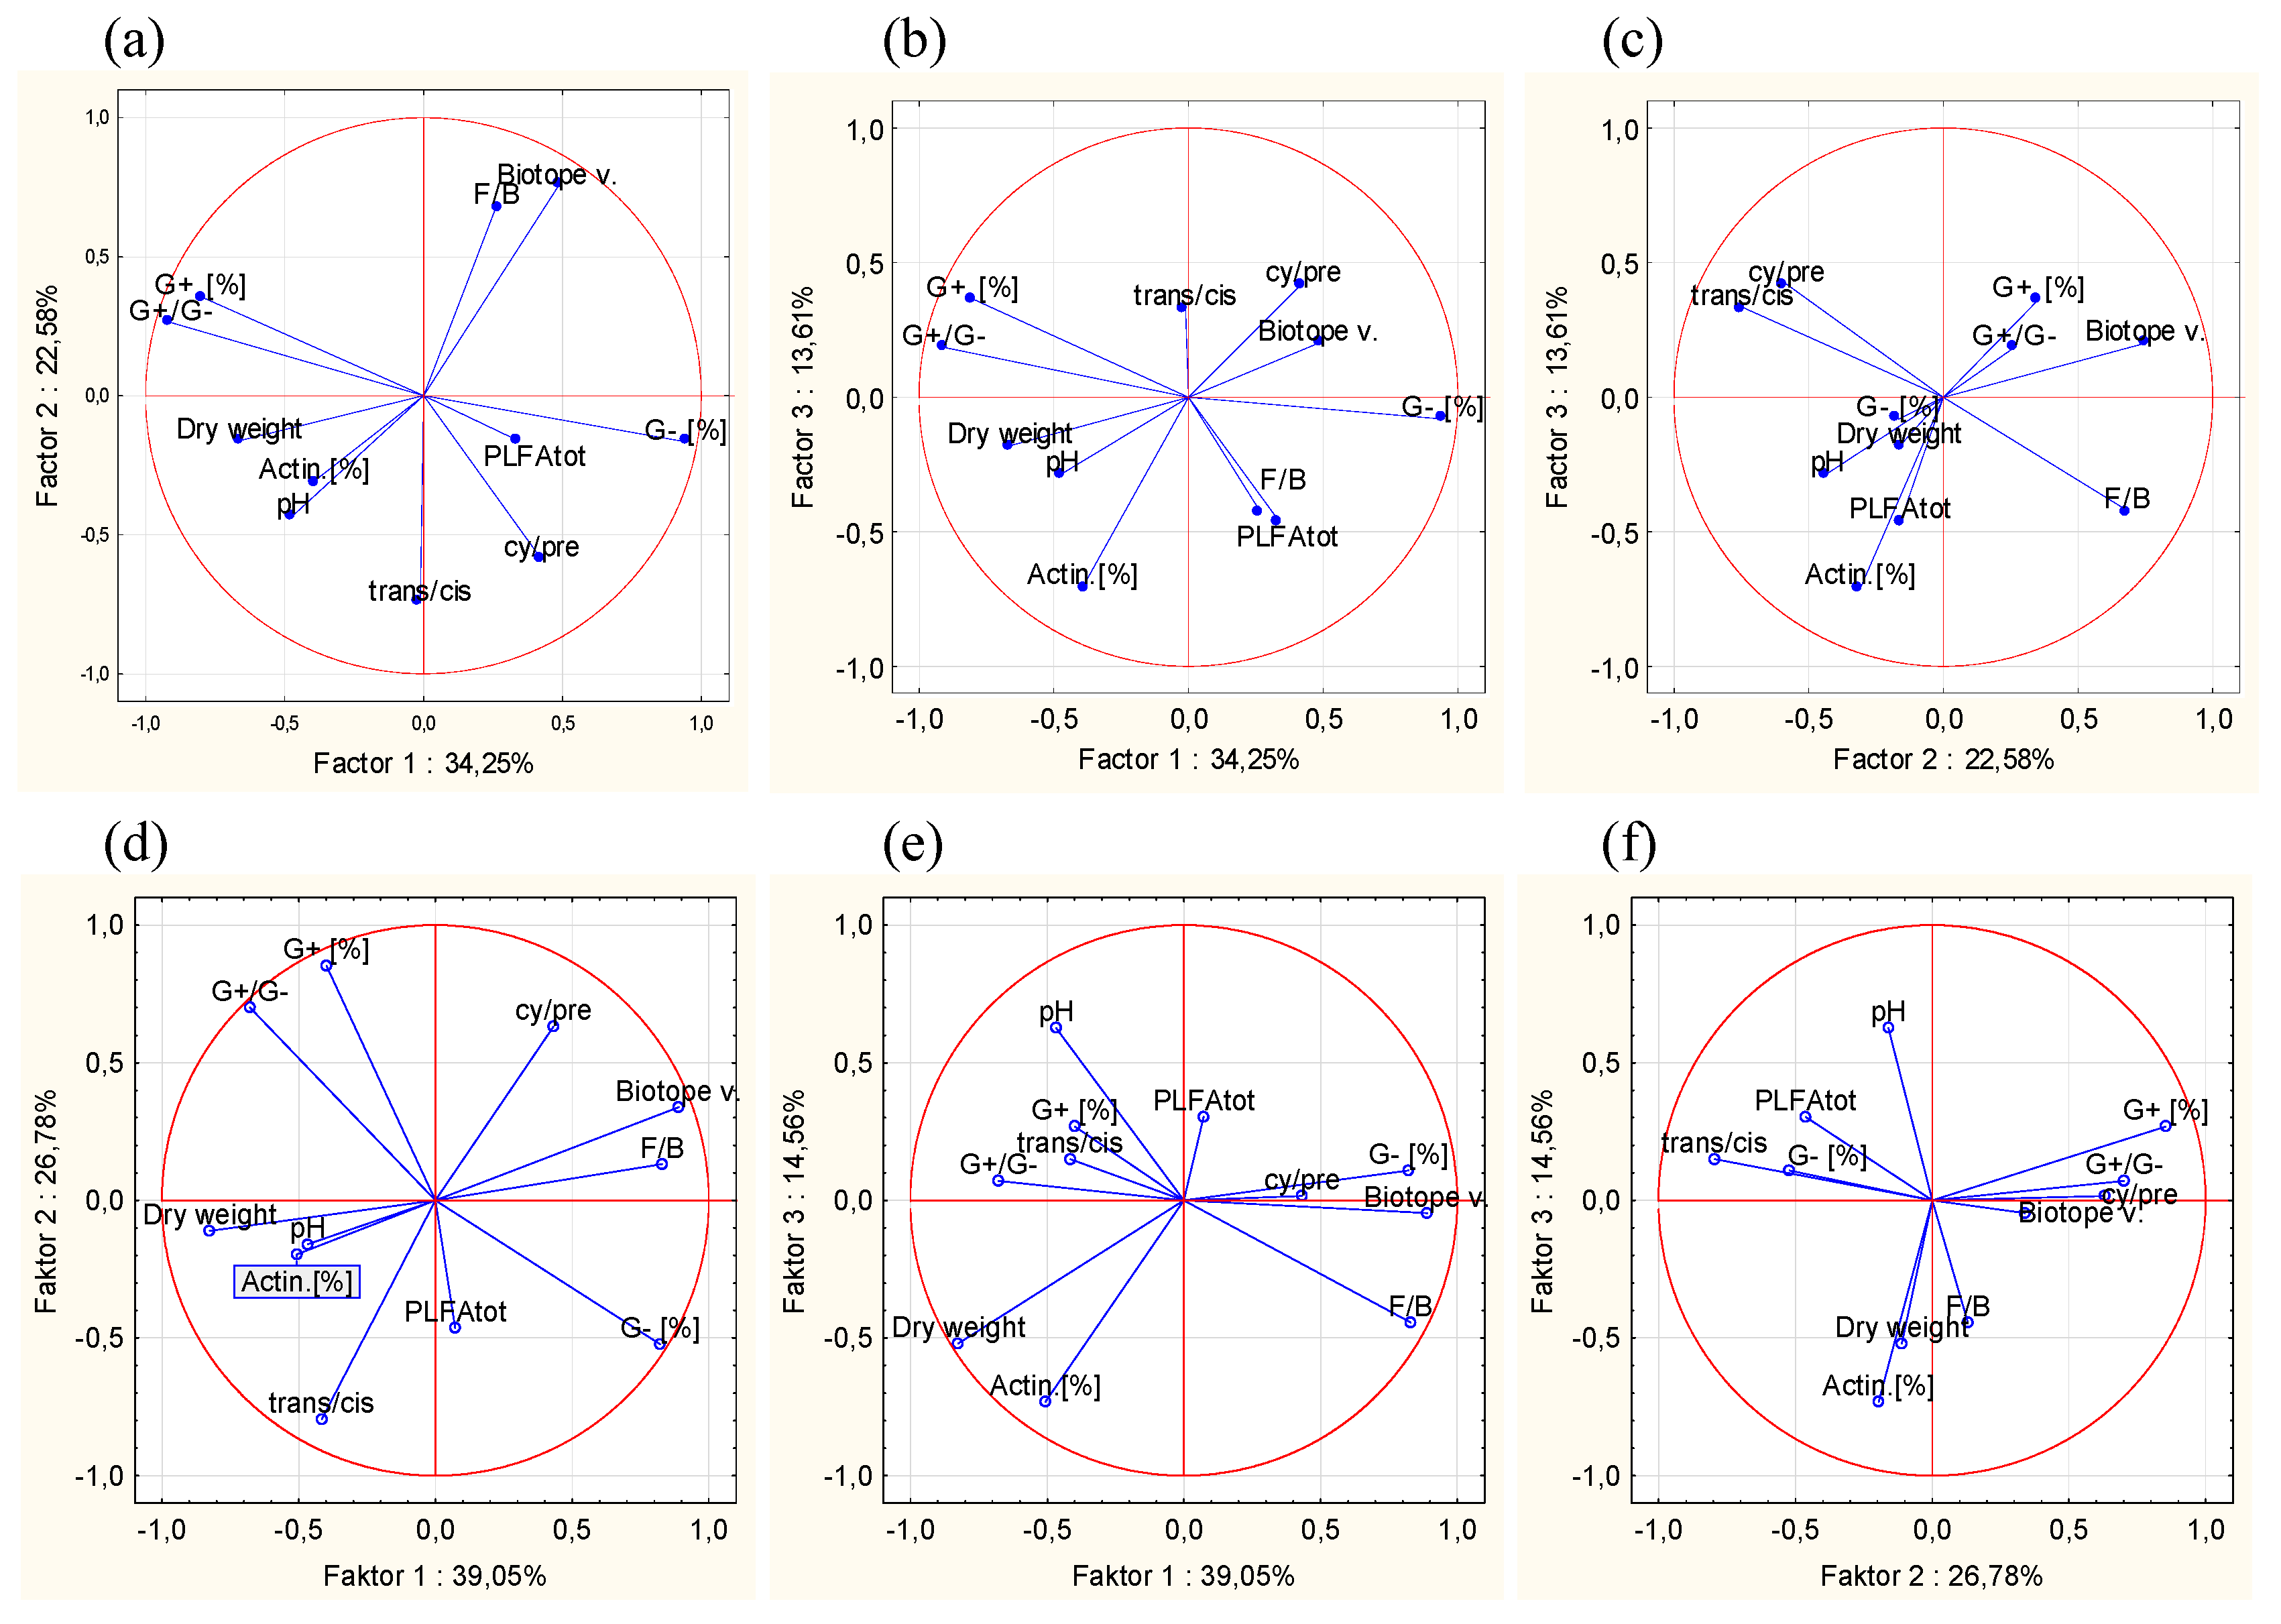
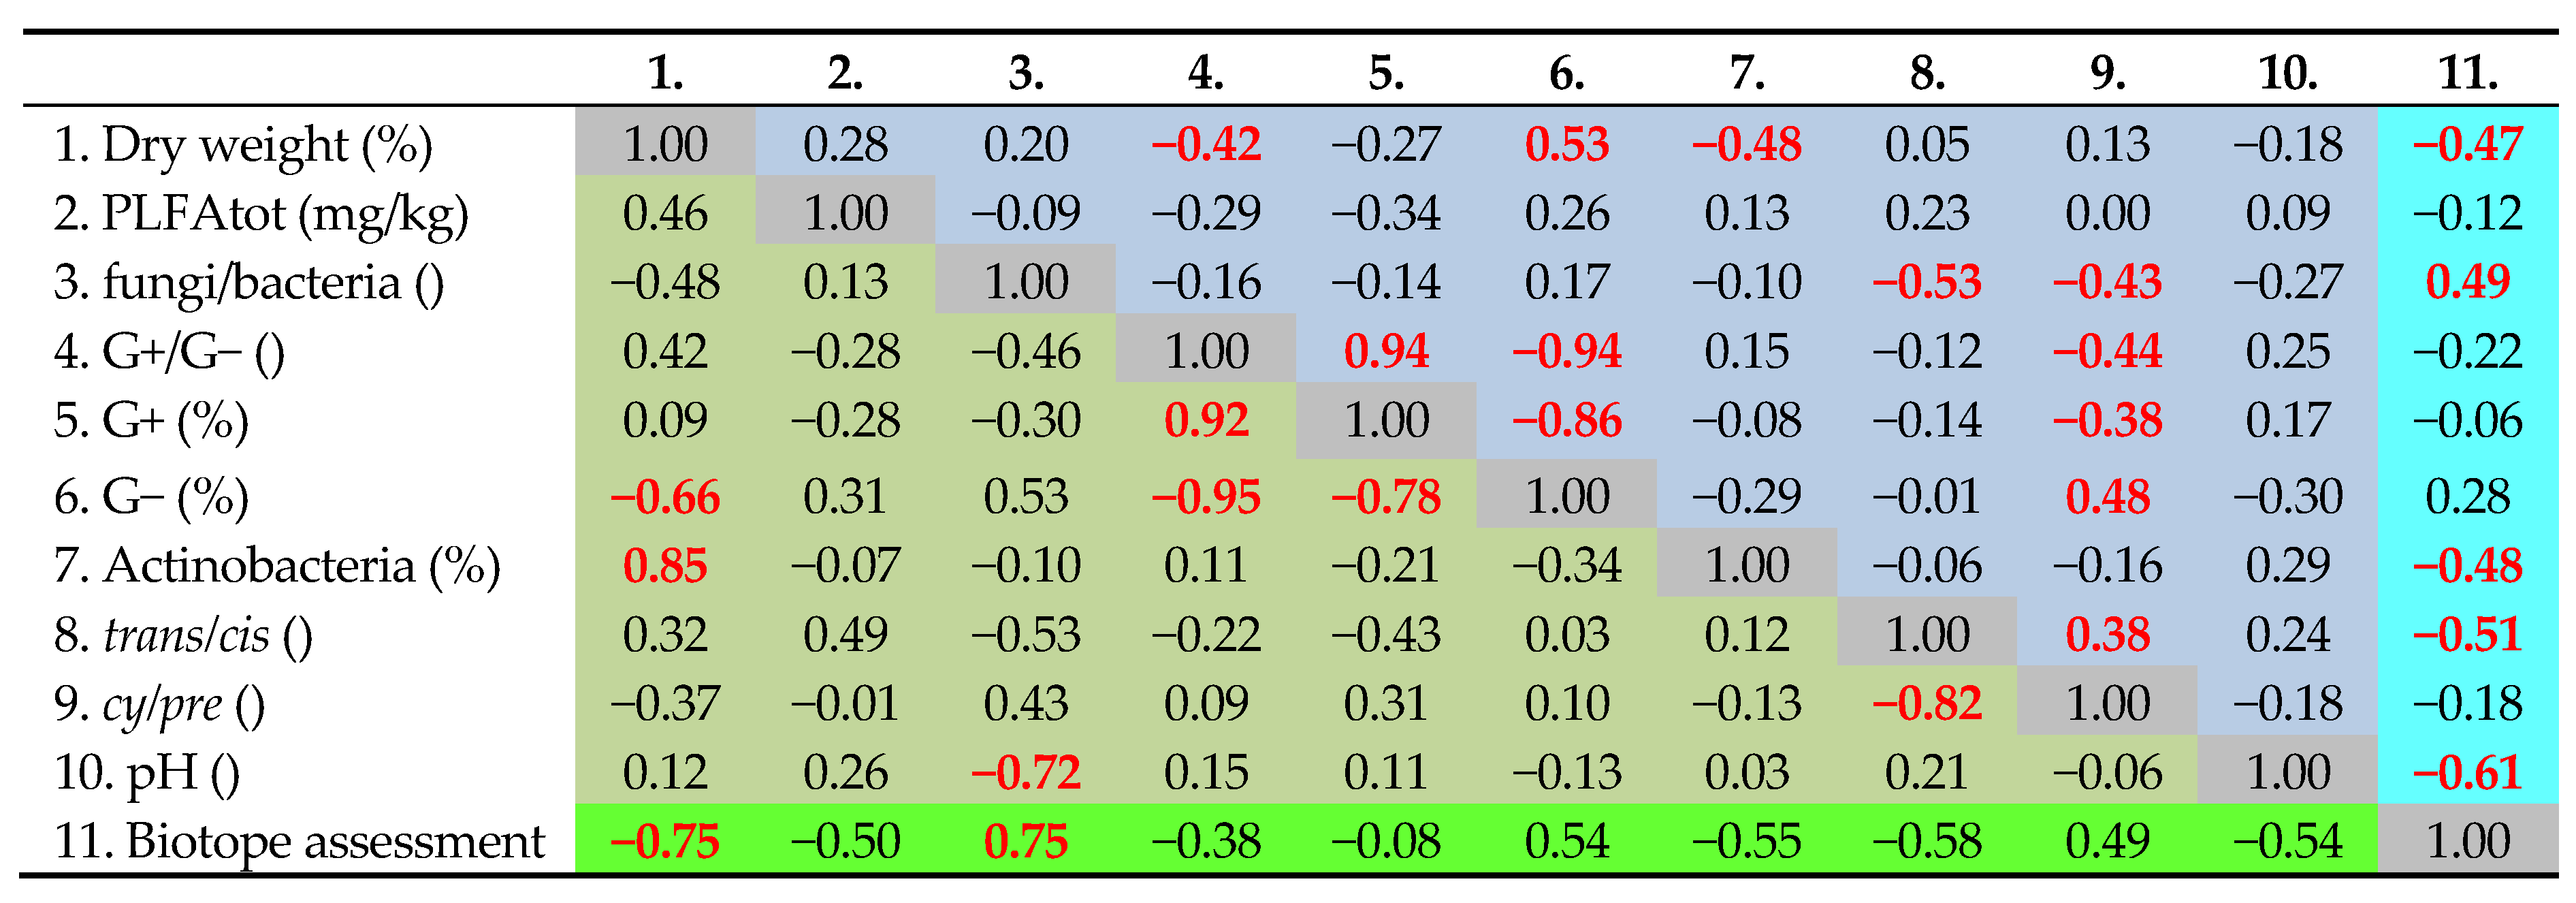
3.2. Relationships of Soil Parameters to Biotope Values

Figure 4 presents correlations analyses between determined parameters, again with separate spring data. Biotope values correlate with soil moisture (better in spring sampling), percentage of Actinobacteria, trans/cis stress indicator, F/B ratio (spring sampling only), and soil pH. On the other hand, they do not correlate significantly with PLFAtot, as well as percentages of G+ and G− bacteria. In accordance with PCA plots, this comparison implicates that the biotope value is determined rather by the quality of microbial community than by its quantity. Better rated biotopes are higher in water retention, lower in pH, higher in fungal content, and they impose lower stress on soil microorganisms. On the other hand, the overall quantity of microorganisms varied. Especially interesting is the spring correlation to soil humidity (blunted in autumn samplings by intensive precipitation) confirming the importance of water retention for ecosystem values.
To identify possible complex relationships between biotope values and determined soil parameters a stepwise linear regression was carried out. In successive steps all possible models were compared, according to Akakie’s information criterion (AIC), and for each number of regression parameters those with minimal value of AIC were retained (Table 4). Due to the limited number of samplings and high correlation between samples, only models up to three parameters were compared (Harrell recommends at least 10 data points per parameter [18]). The comparison revealed that the parameter with the best predicting power is the soil pH, followed by the trans/cis PLFA stress indicator and, finally, the soil dry weight. This three-parameter model was able to fit 63% of data variability. On the other side, parameters G+(%), G−(%), and cy/pre resulted in low explained variability and even insignificant models (i.e., models statistically comparable to y = k equation). Since our principal aim was to look on indicators of microbial communities while the two best regression parameters corresponded to abiotic variables pH and dry weight, we have carried out a second round of stepwise regression, this time with PLFA parameters only. As expected, the models exhibited a worse fit but were still able to explain ~50% of the variability. The variables with the highest predicting power was (again) trans/cis PLFA followed by percentage of actinobacterial PLFA and G+/G− ratio.

3.3. Implications for Biotope Assessment

The results revealed a few interesting relationships between biotope values, PLFA indicators (especially quality and stress indicators), as well as abiotic soil parameters (pH and dry weight). This confirms complexity and robustness of used valuation method, derived using plant cover and above-surface communities. Nevertheless microbial characteristics were able to explain only around 50% of biotope values’ variability, thus indicating they bring partly new information. Amendment of the valuation method is therefore of interest. A particular form of this amendment requires analysis of a significantly larger dataset comparable to the one used for setting biotope values [2]. From indicators used in this study, good candidates are those uncorrelated to biotope values and exhibiting low seasonal variability, such as PLFAtot (however it possess significant inner-locality variability) or percentages of G+ or G− bacteria (these however exhibited low but significant season variability).
PLFA profiling, used in this study, provides rather a complex than a detailed characterization of soil microbial community (i.e., quantification of living microbial biomass, quantification of dominant microbial groups, and stress indication) [8,9,10,16]. Only recently it was standardized [14] ensuring comparability of data worldwide. Alternatively complex and details information of soil microorganisms can be obtained via genetic analyses only (especially transcriptomics). Nevertheless modern equipment (such as sequenators or RNAase-free boxes) is not as widespread as standard chemical laboratory and GC/MS systems required for PLFA analysis [25]. We, therefore, consider PLFA profiling more applicable for routine gathering of microbial characteristics.

4. Conclusions

This preliminary study aimed at the relationship between biotope valuation and soil microbial community characteristics estimated by phospholipid fatty acids (PLFA) profiles. Several interesting relationships were determined, i.e., more valuable biotopes retained more water, exhibited significantly lower trans/cis stress indicators, and contained a higher portion of soil fungi. Microbial characteristics were, however, able to explain only ~50% of biotope value variability, i.e., they presented significantly new information. The results, therefore, show the importance of including soil microbial characteristics into biotope valuation. PLFA profiling seems to be applicable for this purpose since it is standardized and provides rather complex characteristics of soil microorganisms.

Acknowledgments

The research was prepared within the research infrastructure NanoEnviCz (Nanomaterials and Nanotechnologies for Environmental Protection and Sustainable Future, LM2015073) and co-funded by internal grant agency of J.E. Purkyně University in Ústí nad Labem. The authors express their thanks to Jan Benda for English proof-reading.

Author Contributions

Josef Trögl and Josef Seják designed the research and prepared majority of the manuscript. Jana Pavlorková and Pavla Packová carried out sampling and extraction of phospholipid fatty acids. Pavel Kuráň was in charge for GC-MS analysis. Jan Popelka carried out the statistical evaluation of the data. Jan Pacina was in charge of sites localization and preparation of the map.

Conflicts of Interest

The authors declare no conflict of interest.

References

  1. European Cimmision. Council Directive 92/43/EEC of 21 May 1992 on the Conservation of Natural Habitats and of Wild Fauna and Flora; European Commision: Brussels, Begium, 1992; Available online http://eur-lex.europa.eu/legal-content/EN/TXT/?uri=CELEX:31992L0043 (accessed on 7 March 2016).
  2. Sejak, J.; Dejmal, I.; Petricek, V.; Cudlin, P.; Michal, I.; Cerny, K.; Kucera, T.; Vyskot; Strejcek, J.; Cudlinova, E.; et al. Valuation and Pricing the Biotopes of the Czech. Republic; Cesky ekologicky ustav: Prague, Czech Republic, 2003; p. 450. [Google Scholar]
  3. Pithart, D.; Krovakova, K.; Zaloudik, J.; Dostal, T.; Valentova, J.; Valenta, P.; Weyskrabova, J.; Dusek, J. Ecosystem services of natural floodplain segment - Luznice river, Czech Republic. Flood Recovery Innov. Response Ii 2010, 133, 129–139. [Google Scholar]
  4. Darbi, M.; Tausch, C. Loss-gain calculations in german impact mitigation regulation. Occasional Paper Contributed to BBOP. Available online: http://www.forest-trends.org/documents/files/doc_2404.pdf (accessed on 7 March 2016).
  5. European Commission. White Paper on Environmental Liability; European Commission: Luxembourg, Luxembourg, 2000; p. 52. [Google Scholar]
  6. Sejak, J.; Dejmal, I.; Petricek, V.; Cudlin, P.; Michal, I.; Cerny, K.; Kucera, T.; Vyskot, I.; Strejcek, J.; Cudlinova, E.; et al. Method of monetary valuation of territorial ecological functions. Available online: http://fzp.ujep.cz/projekty/bvm/bvm.pdf (accessed on 7 March 2016).
  7. Joergensen, R.G.; Emmerling, C. Methods for evaluating human impact on soil microorganisms based on their activity, biomass, and diversity in agricultural soils. J. Plant Nutr. Soil Sci. Z. Fur Pflanzenernahrung Und Bodenkunde 2006, 169, 295–309. [Google Scholar] [CrossRef]
  8. Xue, D.; Yao, H.Y.; Ge, D.Y.; Huang, C.Y. Soil microbial community structure in diverse land use systems: A Comparative Study Using Biolog, DGGE, and PLFA Analyses. Pedosphere 2008, 18, 653–663. [Google Scholar] [CrossRef]
  9. Frostegard, A.; Tunlid, A.; Baath, E. Use and misuse of PLFA measurements in soils. Soil Biol. Biochem. 2011, 43, 1621–1625. [Google Scholar] [CrossRef]
  10. Kaur, A.; Chaudhary, A.; Choudhary, R.; Kaushik, R. Phospholipid fatty acid—A bioindicator of environment monitoring and assessment in soil ecosystem. Curr. Sci. 2005, 89, 1103–1112. [Google Scholar]
  11. Baldrian, P.; Trogl, J.; Frouz, J.; Snajdr, J.; Valaskova, V.; Merhautova, V.; Cajthaml, T.; Herinkova, J. Enzyme activities and microbial biomass in topsoil layer during spontaneous succession in spoil heaps after brown coal mining. Soil Biol. Biochem. 2008, 40, 2107–2115. [Google Scholar] [CrossRef]
  12. Kuran, P.; Troegl, J.; Novakova, J.; Pilarova, V.; Danova, P.; Pavlorkova, J.; Kozler, J.; Novak, F.; Popelka, J. Biodegradation of spilled diesel fuel in agricultural soil: Effect of Humates, Zeolite, and Bioaugmentation. Sci. World J. 2014. [Google Scholar] [CrossRef]
  13. Troegl, J.; Jirkova, I.; Zemankova, P.; Pilarova, V.; Danova, P.; Pavlorkova, J.; Kuran, P.; Popelka, J.; Kriklavova, L. Estimation of the quantity of bacteria encapsulated in lentikats biocatalyst via phospholipid fatty acids content: A Preliminary Study. Folia Microbiol. 2013, 58, 135–140. [Google Scholar] [CrossRef] [PubMed]
  14. The International Organization for Standardization (ISO). Soil quality—determination of soil microbial diversity—part 2: Method by Phospholipid Fatty acid Analysis (PLFA) Using the Simple PLFA Extraction Method. In International Standard Organisation; ISO: Geneva, Switzerland, 2011. [Google Scholar]
  15. Federici, E.; Giubilei, M.A.; Cajthaml, T.; Petruccioli, M.; D’Annibale, A. Lentinus (Panus) Tigrinus augmentation of a historically contaminated soil: Matrix Decontamination and Structure and Function of the Resident Bacterial Community. J. Hazard. Mater. 2011, 186, 1263–1270. [Google Scholar] [CrossRef] [PubMed]
  16. Moore-Kucera, J.; Dick, R.P. PLFA profiling of microbial community structure and seasonal shifts in soils of a douglas-fir chronosequence. Microb. Ecol. 2008, 55, 500–511. [Google Scholar] [CrossRef] [PubMed]
  17. Akaike, H. New look at statistical-model identification. IEEE Trans. Autom. Control. 1974, AC19, 716–723. [Google Scholar] [CrossRef]
  18. Harrell, F.E. Regression Modeling Strategies: With Applications to Linear Models, Logistic Regression, and Survival Analysis; Springer: New York, NY, USA, 2013. [Google Scholar]
  19. Ponder, F., Jr.; Tadros, M.; Loewenstein, E.F. Microbial properties and litter and soil nutrients after two prescribed fires in developing savannas in an upland Missouri ozark forest. Forest Ecol. Manag. 2009, 257, 755–763. [Google Scholar] [CrossRef]
  20. Jaatinen, K.; Fritze, H.; Laine, J.; Laiho, R. Effects of short- and long-term water-level drawdown on the populations and activity of aerobic decomposers in a boreal peatland. Glob. Change Biol. 2007, 13, 491–510. [Google Scholar] [CrossRef]
  21. Bailey, V.L.; Peacock, A.D.; Smith, J.L.; Bolton, H. Relationships between soil microbial biomass determined by chloroform fumigation-extraction, substrate-induced respiration, and phospholipid fatty acid analysis. Soil Biol. Biochem. 2002, 34, 1385–1389. [Google Scholar] [CrossRef]
  22. Wu, Y.P.; Yu, X.S.; Wang, H.Z.; Ding, N.; Xu, J.M. Does history matter? Temperature effects on soil microbial biomass and community structure based on the phospholipid fatty acid (PLFA) analysis. J. Soils Sediments 2010, 10, 223–230. [Google Scholar] [CrossRef]
  23. Stevenson, B.A.; Hunter, D.W.F.; Rhodes, P.L. Temporal and seasonal change in microbial community structure of an undisturbed, disturbed, and carbon-amended pasture soil. Soil Biol. Biochem. 2014, 75, 175–185. [Google Scholar] [CrossRef]
  24. Birgander, J.; Rousk, J.; Olsson, P.A. Comparison of fertility and seasonal effects on grassland microbial communities. Soil Biol. Biochem. 2014, 76, 80–89. [Google Scholar] [CrossRef]
  25. Lombard, N.; Prestat, E.; van Elsas, J.D.; Simonet, P. Soil-specific limitations for access and analysis of soil microbial communities by metagenomics. FEMS Microbiol. Ecol. 2011, 78, 31–49. [Google Scholar]
Figure 1. Detailed localization of sampling sites.
Sustainability 08 00253 g001
Figure 2. Cumulative PLFA concentrations at four sampling campaigns.
Sustainability 08 00253 g002
Figure 3. Principal component analysis (plot of variables along main components); (ac) all data used; and (df) only spring data used.
Sustainability 08 00253 g003
Figure 4. Correlation of determined parameters. All data = blue background (up right), spring sampling only = green background (down left). Red bold font indicates significant correlations (α = 0.05).
Sustainability 08 00253 g004
Table 1. Characterization of study sites.
Study SiteCharacterizationBVM Value (Points)Localization
A-Roudníky–arableArable natural field, intensive farming1050°39′15′′N, 13°54′54′′E
B-Habrovice–wet fallow landPrimary succession on former spoil heap1750°42′02′′N, 13°57′39′′E
C-Airport Ústí n.L.–grasslandReclaimed spoil dump, regular mowing1950°41′56′′N, 13°58′12′′E
D-Koštov–meadowNatural meadow with seasonal mowing3350°37′49′′N, 13°59′16′′E
E-Rovný hill–woodNatural wood with Quercus dominance4750°37′46′′N, 13°57′33′′E
BVM—Biotope valuation method.
Table 2. Used indicator PLFA and calculated physiological indexes [15].
Microbial SubgroupIndicator PLFA
Microbial groups
All bacteria (PLFAbac)i14:0, i15:0, a15:0, 16:1ω7t, 16:1ω9, 16:1ω7, 18:1ω7, 10Me-16:0, i17:0, a17:0, cy17:0, 17:0, 10Me-17:0, 10Me-18:0, cy19:0
-
Gram-positive (PLFAG+)
i14:0, i15:0, a15:0, i17:0, a17:0
-
Gram-negative (PLFAG-)
cy17:0, cy19:0, 18:1ω7
-
Actinobacteria (PLFAAct)
10Me-16:0, 10Me-17:0, 10Me-18:0
Fungi (PLFAfun)18:2ω6,9
Ratios of microbial groups
Fungi to bacteria (F/B)PLFAfun/PLFAbac
Gram-positive to Gram-negative bacteria (G+/G−)PLFAG+/PLFAG−
Percentage of bacterial groupsPLFAG+/PLFAbac, PLFAG−/PLFAbac, PLFAAct/PLFAbac
Physiological indicators
General stress (trans/cis) [10](16:1ω7t + 18:1ω7t)/(16:1ω7 + 18:1ω7)
Nutrition stress (cy/pre) [16](cy17:0 + cy19:0)/(16:1ω7 + 18:1ω7)
Table 3. Kruskal–Wallis analysis (non-parametric ANOVA) of factors affecting determined soil parameters.
EffectsdwPLFAtotF/BG+/G−G+ (%)G− (%)Act. (%)trans/ciscy/prepH
Locality16.34 ***8.19 *7.435.007.95 *5.0811.65 **11.34 **4.1910.93 **
Season1.160.020.533.34 *3.26 *3.58 *4.02 *4.87 **12.02 ***0.94
* p < 0.1 ** p < 0.05 *** p < 0.01, dw = dry weight (soil moisture), PLFAtot = total PLFA, pH = soil pH determined in water extract, for other parameters see Table 2.
Table 4. Linear models trying to estimate biotope values from soil parameters.
Num. of ParametersModelR2AICp
All variables
1BV=−17.9 × pH+136.20.37145.23.9 × 10−4
2BV=−14.4 × pH − 132.0 × tc + 129.20.48131.02.9 × 10−4
3BV=−13.6 × p − 141.4 × tc − 70.4dw + 129.20.63123.11.9 × 10−5
PLFA parameters only
1BV=−171.0 × tc + 44.60.26138.80.0054
2BV=−180.8 × tc − 760.0 × Act + 57.20.50129.61.6 × 10−4
3BV=−187.0 × tc − 732.9 × Act − 11.2 × gg + 67.80.53130.33.8 × 10−4
AIC = Akaike’s information criterion [17], p = probability of model insignificance, BV = Biotope value, dw = dry weight, tc = trans/cis PLFA stress indicator, Act = percentage of actinobacterial PLFA, gg = G+/G− PLFA ratio.

