Article

Assessment of Reservoir Water Quality Using Multivariate Statistical Techniques: A Case Study of Qiandao Lake, China

1
Institute of Digital Agriculture, Zhejiang Academy of Agricultural Sciences, Hangzhou 310021, China
2
Institution of Remote Sensing and Information System Application, Zhejiang University, Hangzhou 310058, China
3
College of Resource and Environmental Science, Xinjiang University, Urumqi 830046, China
4
Institute of Rural Development and Information, Ningbo Academy of Agricultural Sciences, Ningbo 315040, China
*
Author to whom correspondence should be addressed.
Sustainability 2016, 8(3), 243; https://doi.org/10.3390/su8030243
Submission received: 19 October 2015 / Revised: 23 February 2016 / Accepted: 2 March 2016 / Published: 5 March 2016

Abstract

:
Qiandao Lake (Xin’an Jiang reservoir) plays a significant role in drinking water supply for eastern China, and it is an attractive tourist destination. Three multivariate statistical methods were comprehensively applied to assess the spatial and temporal variations in water quality as well as potential pollution sources in Qiandao Lake. Data sets of nine parameters from 12 monitoring sites during 2010–2013 were obtained for analysis. Cluster analysis (CA) was applied to classify the 12 sampling sites into three groups (Groups A, B and C) and the 12 monitoring months into two clusters (April-July, and the remaining months). Discriminant analysis (DA) identified Secchi disc depth, dissolved oxygen, permanganate index and total phosphorus as the significant variables for distinguishing variations of different years, with 79.9% correct assignments. Dissolved oxygen, pH and chlorophyll-a were determined to discriminate between the two sampling periods classified by CA, with 87.8% correct assignments. For spatial variation, DA identified Secchi disc depth and ammonia nitrogen as the significant discriminating parameters, with 81.6% correct assignments. Principal component analysis (PCA) identified organic pollution, nutrient pollution, domestic sewage, and agricultural and surface runoff as the primary pollution sources, explaining 84.58%, 81.61% and 78.68% of the total variance in Groups A, B and C, respectively. These results demonstrate the effectiveness of integrated use of CA, DA and PCA for reservoir water quality evaluation and could assist managers in improving water resources management.

1. Introduction

Due to the serious pollution in the river, reservoirs have become the most important drinking water resource in Zhejiang Province, which is one of the most developed regions in China [1]. Although kinds of regulations in terms of the water protection have been implemented for years, reservoirs have been undergoing increasing pressure from the development of the economy [2]. Various pollutants from industrial production, agricultural practices and domestic activities find their way into reservoirs, impacting the aquatic environment and leading to water quality deterioration [2,3]. Monitoring networks for reservoir water quality have been widely developed in this area as the critical manner for effectively managing water resources [4]. However, continuous monitoring programs can provide a large amount of records including a variety of parameters with obscure interrelationships and complexities, and it is no easy task to organize, interpret, and obtain meaningful information from these data [5,6]. Thus, it is significant to obtain useful knowledge from the monitoring records using practicable methods to analyze the spatio-temporal trends in the water quality and to characterize the factors impacting water quality [5,7].
Qiandao Lake (Xin’an Jiang reservoir) plays an important role in drinking water supply and sustainable development in eastern China [2]. Thus, to provide meaningful suggestions to planners and managers for better water resource protection, it is essential to characterize the variation patterns of water quality in Qiandao Lake and its potential pollution sources. Some reports related to Qiandao Lake have been published on the assessment of biological community structure [8,9], chlorophyll-a concentration analysis [10,11], ecological assessment [2,8], and eutrophication condition evaluation [12], but no comprehensive water quality evaluation has been carried out using advanced mathematical methods. In this study, we collected data from 12 monitoring sites during four years (2010–2013) for analysis.
Numerous studies regarding water quality in varieties of water bodies have been carried out. Thus, various related approaches have been developed, such as water quality index (WQI) [13,14], multivariate statistical methods [15,16], artificial neural networks (ANNs) [17], and the multivariate relevance vector machine (MVRVM) [18,19,20]. Multivariable statistical methods, including discriminant analysis (DA), cluster analysis (CA), and principal component analysis/factor analysis (PCA/FA), have served as robust tools in studies of environmental issues for complex data processing and interpretation [21,22]. These methods can be applied in water studies for an in-depth knowledge of water quality conditions, and they can be used as practical tools for water resource management [6]. According to previous studies, integrated use of various multivariable approaches is preferable for mutual verification of the results obtained [3].
The present study aims to characterize the spatial and temporal trends in water quality and the latent pollution sources in Qiandao Lake. To realize this objective, the water quality data sets obtained were explored by three multivariate methods: CA was used to divide the sampling sites and months into groups according to the spatial and temporal similarities; DA was applied to identify significant variables to assess the variation trends in water quality; and PCA was finally applied to detect the unidentified, latent pollution sources in Qiandao Lake.

2. Materials and Methods

2.1. Study Area

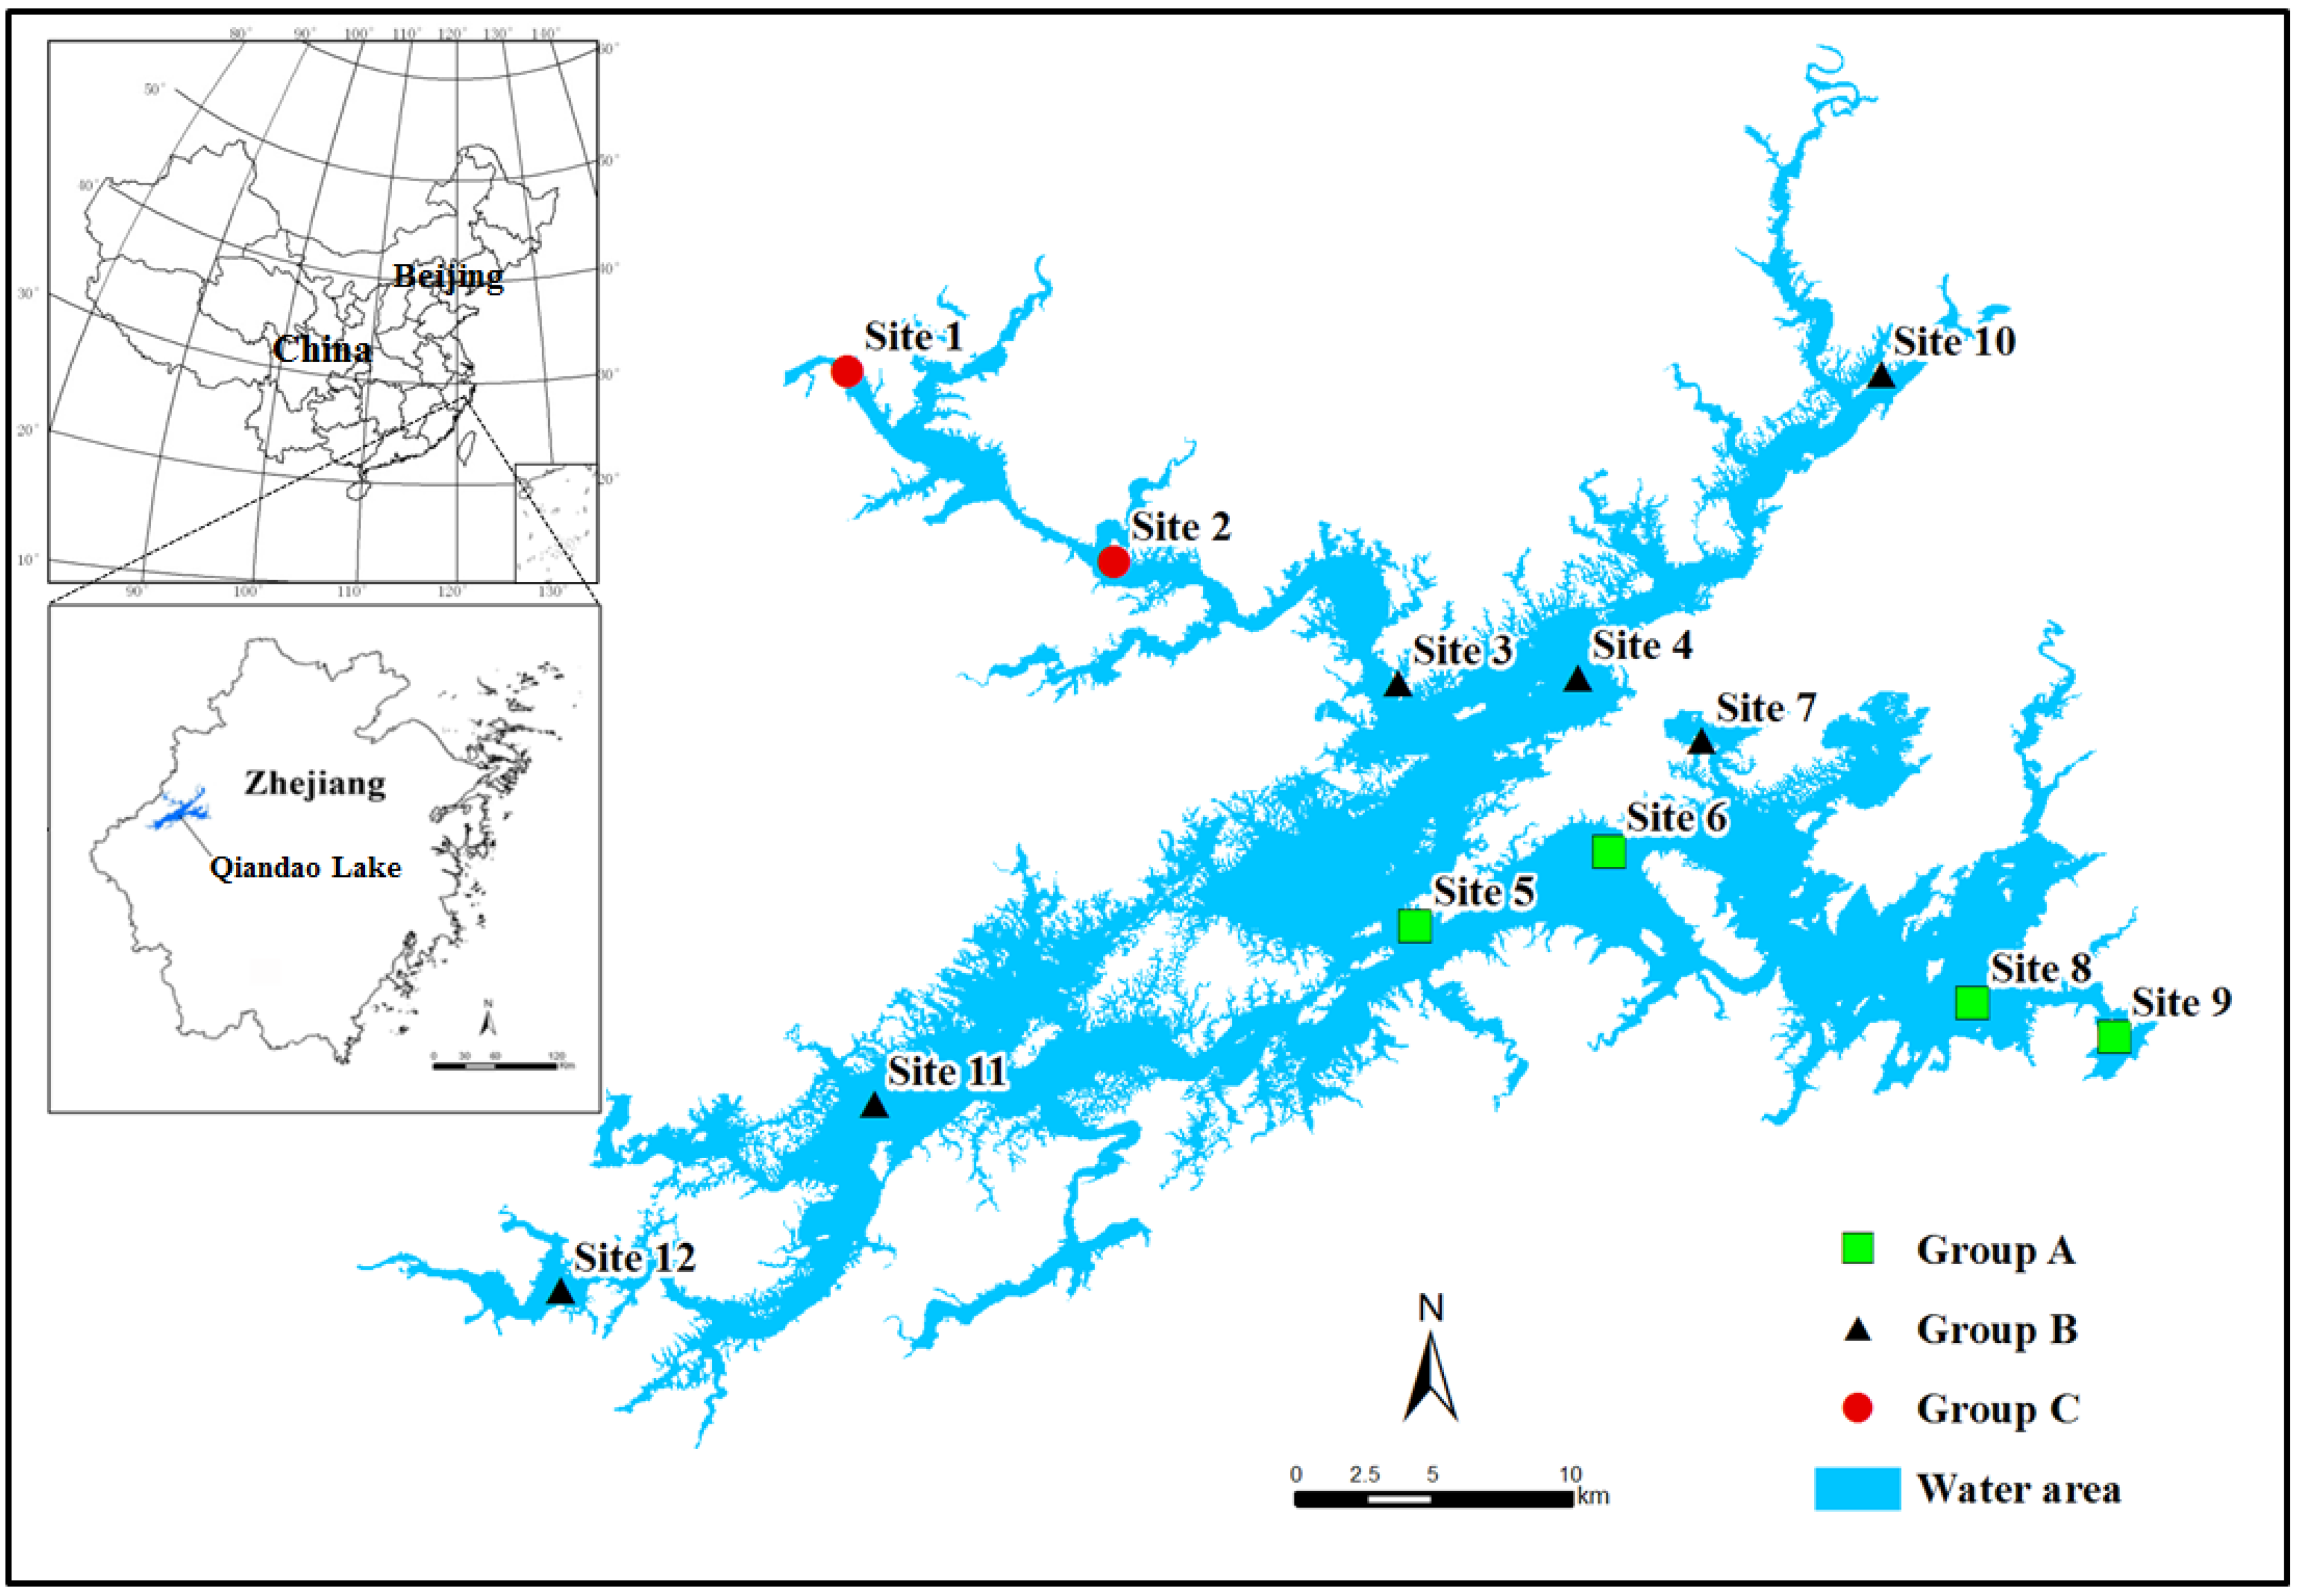
Qiandao Lake (Xin’an Jiang reservoir) is the largest artificial freshwater lake and a renowned place of interest in China, and it is located in Hangzhou City, Zhejiang Province. It was built in the 1950s and has served a variety of purposes, including power generation, flood control, tourism, drinking water supply, industrial usage and irrigation. The watershed of Qiandao Lake covers an area of 4402.4 km2, 60% of which is located in Anhui Province. The water surface area is 574 km2 at high water (108 m), and the corresponding storage capacity is 17.8 billion m3. The water resources in Qiandao Lake account for 30% of the volume of the Qiantang River. Qiandao Lake is of great significance in maintaining the eco-environmental health and water function in the Qiantang River basin [23]. Figure 1 presents the location of Qiandao Lake in Zhejiang Province and in China.

2.2. Data

Monthly data of nine water quality parameters (pH, Secchi disc depth, chlorophyll-a, ammonia nitrogen, total nitrogen, total phosphorus, permanganate index, dissolved oxygen, and fecal coliform) from 12 monitoring sites in Qiandao Lake covering four years (2010–2013) were obtained from the Zhejiang Institute of Environmental Science Research and Design. Secchi disc values were measured in situ, and the measurements of the other parameters were performed in the laboratory of the Chun’an Environmental Monitoring Stations in accordance with the standard methods for observation and analysis in China [24]. Water samples were collected at 0.5 m below water surface, intermediate point, and 0.5 m above the bottom at each site, and the average values were calculated for analysis in this study. Table 1 shows the selected water quality parameters and their measurement methods. Statistical calculations were performed using the software IBM SPSS Statistics 20. The locations of the monitoring stations in Qiandao Lake are displayed in Figure 1.

2.3. Methods

2.3.1. Cluster Analysis (CA)

CA is an unsupervised pattern recognition approach for classifying categories according to the nearness or similarity [25]. The classified categories present strong internal homogeneity and strong external heterogeneity [26]. CA utilizes a wide variety of algorithms, among which hierarchical agglomerative technique is most widely used, where a data set can be sequentially classified into categories by selecting the most similar variable pairs and generating categories in a stepwise way [27]. The results of hierarchical agglomerative CA can be presented in a dendrogram that visually describes the clustering course [27,28]. We employed hierarchical agglomerative CA to the normalized data to assemble monitoring sites and sampling months into aggregations using Ward’s method, with squared Euclidean distances as a metric of similarity [29]. The hierarchical agglomerative CA was performed by the software IBM SPSS Statistics 20.

2.3.2. Discriminant Analysis (DA)

DA is a well-known statistical classification technique that is developed to identify the parameters that make distinctions between two or more categories [25]. DA classifies cases into categorical-dependent variables by constructing a discriminant function for each group. Discriminant functions (DFs) determine boundaries in predictor space between various classes [21]. DA constructs DFs by using the standard, forward stepwise and backward stepwise modes. The standard mode uses all of variables for DF construction, whereas the stepwise procedures determine which variables should be contained in the model [15]. The forward stepwise DA constructs DFs by adding variables one by one. It begins with the most significant parameter and ends with the least significant one. The procedure is the opposite in the backward-stepwise mode: by starting with the least significant one, the variables are removed one by one until no significant changes emerge [3,21]. DA was performed on the raw measurement data without standardization, and DFs were constructed based on the three modes [30,31].

2.3.3. Principal Component Analysis (PCA)

PCA is a widely-used technique that attempts to transform an original data set into a smaller set comprising uncorrelated factors known as principal components (PCs). It uses eigenvalues and eigenvectors associated with the covariance matrix to generate PCs by multiplying the original correlated variables by the eigenvector [25,32]. The PCs allow for data reduction by extracting the most important variables to interpret the original data sets with a minimal loss of information [33]. Then a new set of variables, called varifactors (VFs), is constructed by rotating the axis yielded from PCA [21]. The VFs can be used to identify unobservable, hypothetical and latent variables [7,33]. PCA was performed on three groups of normalized data sets (three sampling regions divided by CA) to generate VFs for each group and to further identify the most significant parameters in different regions [34,35].

2.3.4. Water Quality Classification Guideline

The water quality was analyzed according to the National Environmental Quality Standards for Surface Water (GB 3838-2002) [36]. This standard classifies water quality into five levels: Categories I to V. Category I is the highest standard set to protect water sources and national natural conservation area. Category II is applicable to a key protection area of drinking water sources, habitats for rare aquatic organisms, aquaculture, etc. Category III is applied to determine the secondary protection zone for drinking water supplies, fishery area, and swimming regions. Category IV indicates the water bodies that are suitable for ordinary industrial use and recreational purposes that do not involve direct contact of the human body. Category V is set to establish the water area for irrigation and for ordinary landscape demand.

3. Results and Discussion

3.1. Descriptive Statistics of Data

The statistical characteristics for the obtained data sets comprising nine parameters are displayed in Table 2. Referring to the quality standards for surface water (GB 3838-2002), the mean values of TP and FC reached the category II, the mean concentration of TN reached the category III, and the remaining parameters all reached category I. The maximum concentrations of CODMn and TP exceeded the category I, and the maximum FC concentration exceeded the second category. Significantly, the minimum and maximum values of TN reached the second and fourth levels of the standard, respectively. Chl-a and SD are not listed in the standard (GB 3838-2002), but they are important parameters for the indication of water quality, and they have been widely used in previous investigations [37,38].

3.2. Cluster Analysis

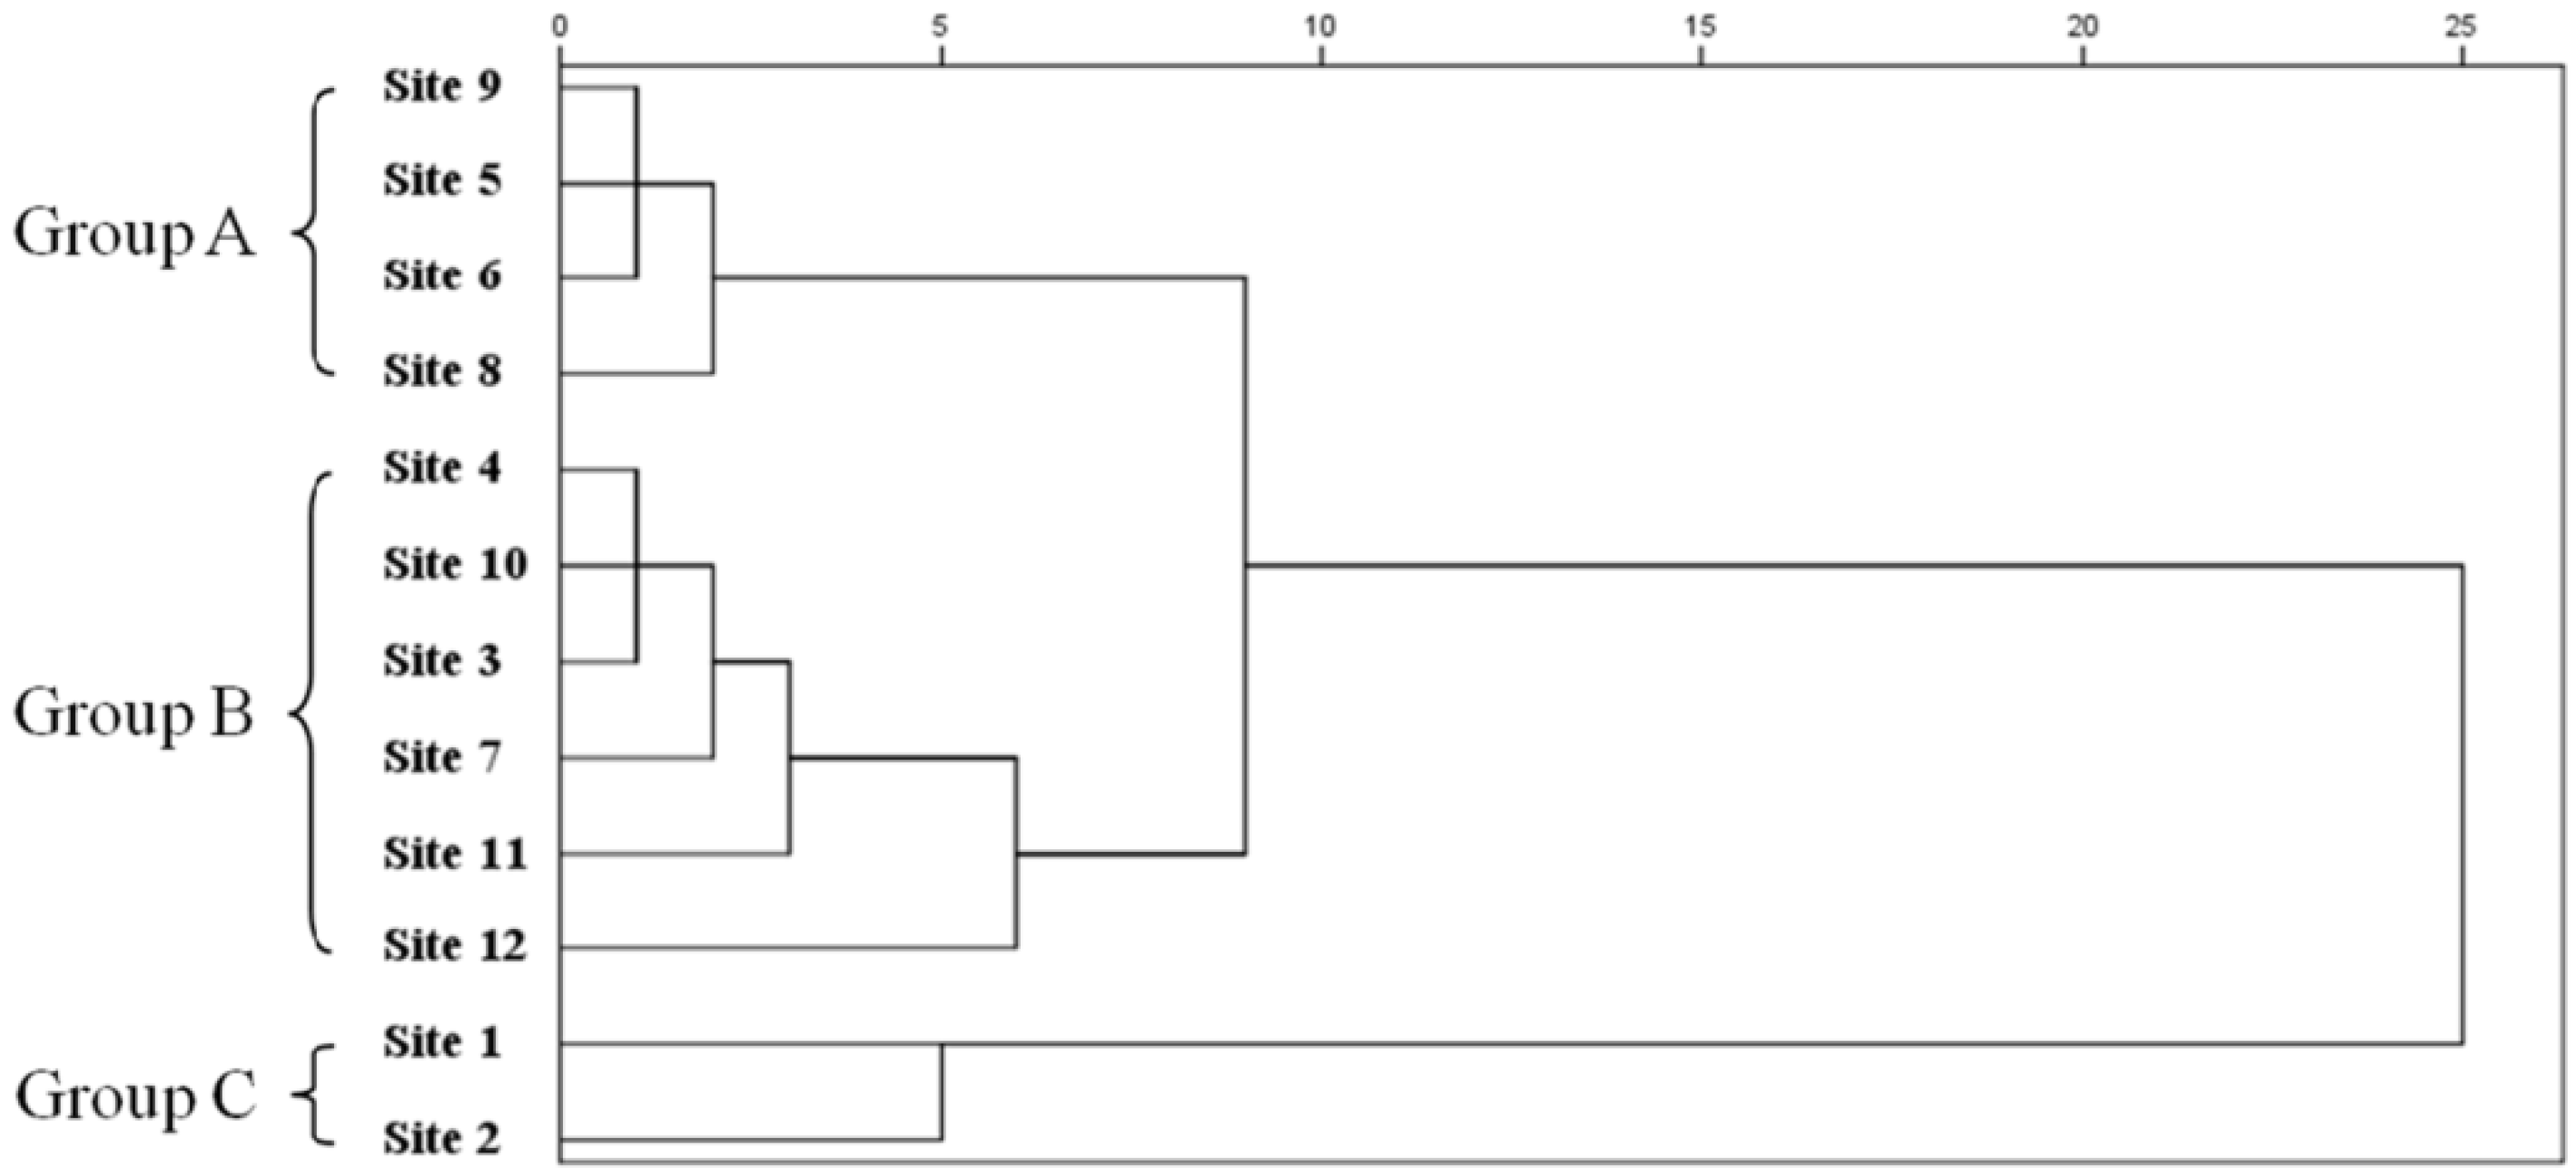
The 12 sampling sites were clustered through CA process into groups A, B and C (Figure 2). Group A included four sites (sites 9, 5, 6 and 8), Group B included six sites (sites 4, 10, 3, 7, 11 and 12), and group C consisted of two sites (sites 1 and 2). As shown in Figure 1, sites in Group A were situated near the center and the outflow of Qiandao Lake, corresponding to low-pollution regions. The sites in Group B were distributed from northeast to southwest of the lake, corresponding to moderate-pollution regions. The Group C sites were located in areas of high-risk pollution, where they accepted pollutants mostly from inflow from the Xin’an Jiang River. Site 1 presented the highest average values of most parameters, especially Chl-a, TN, TP and NH3-N. Overall, water quality presented a tendency of improvement from the inflow to the outflow of the lake.
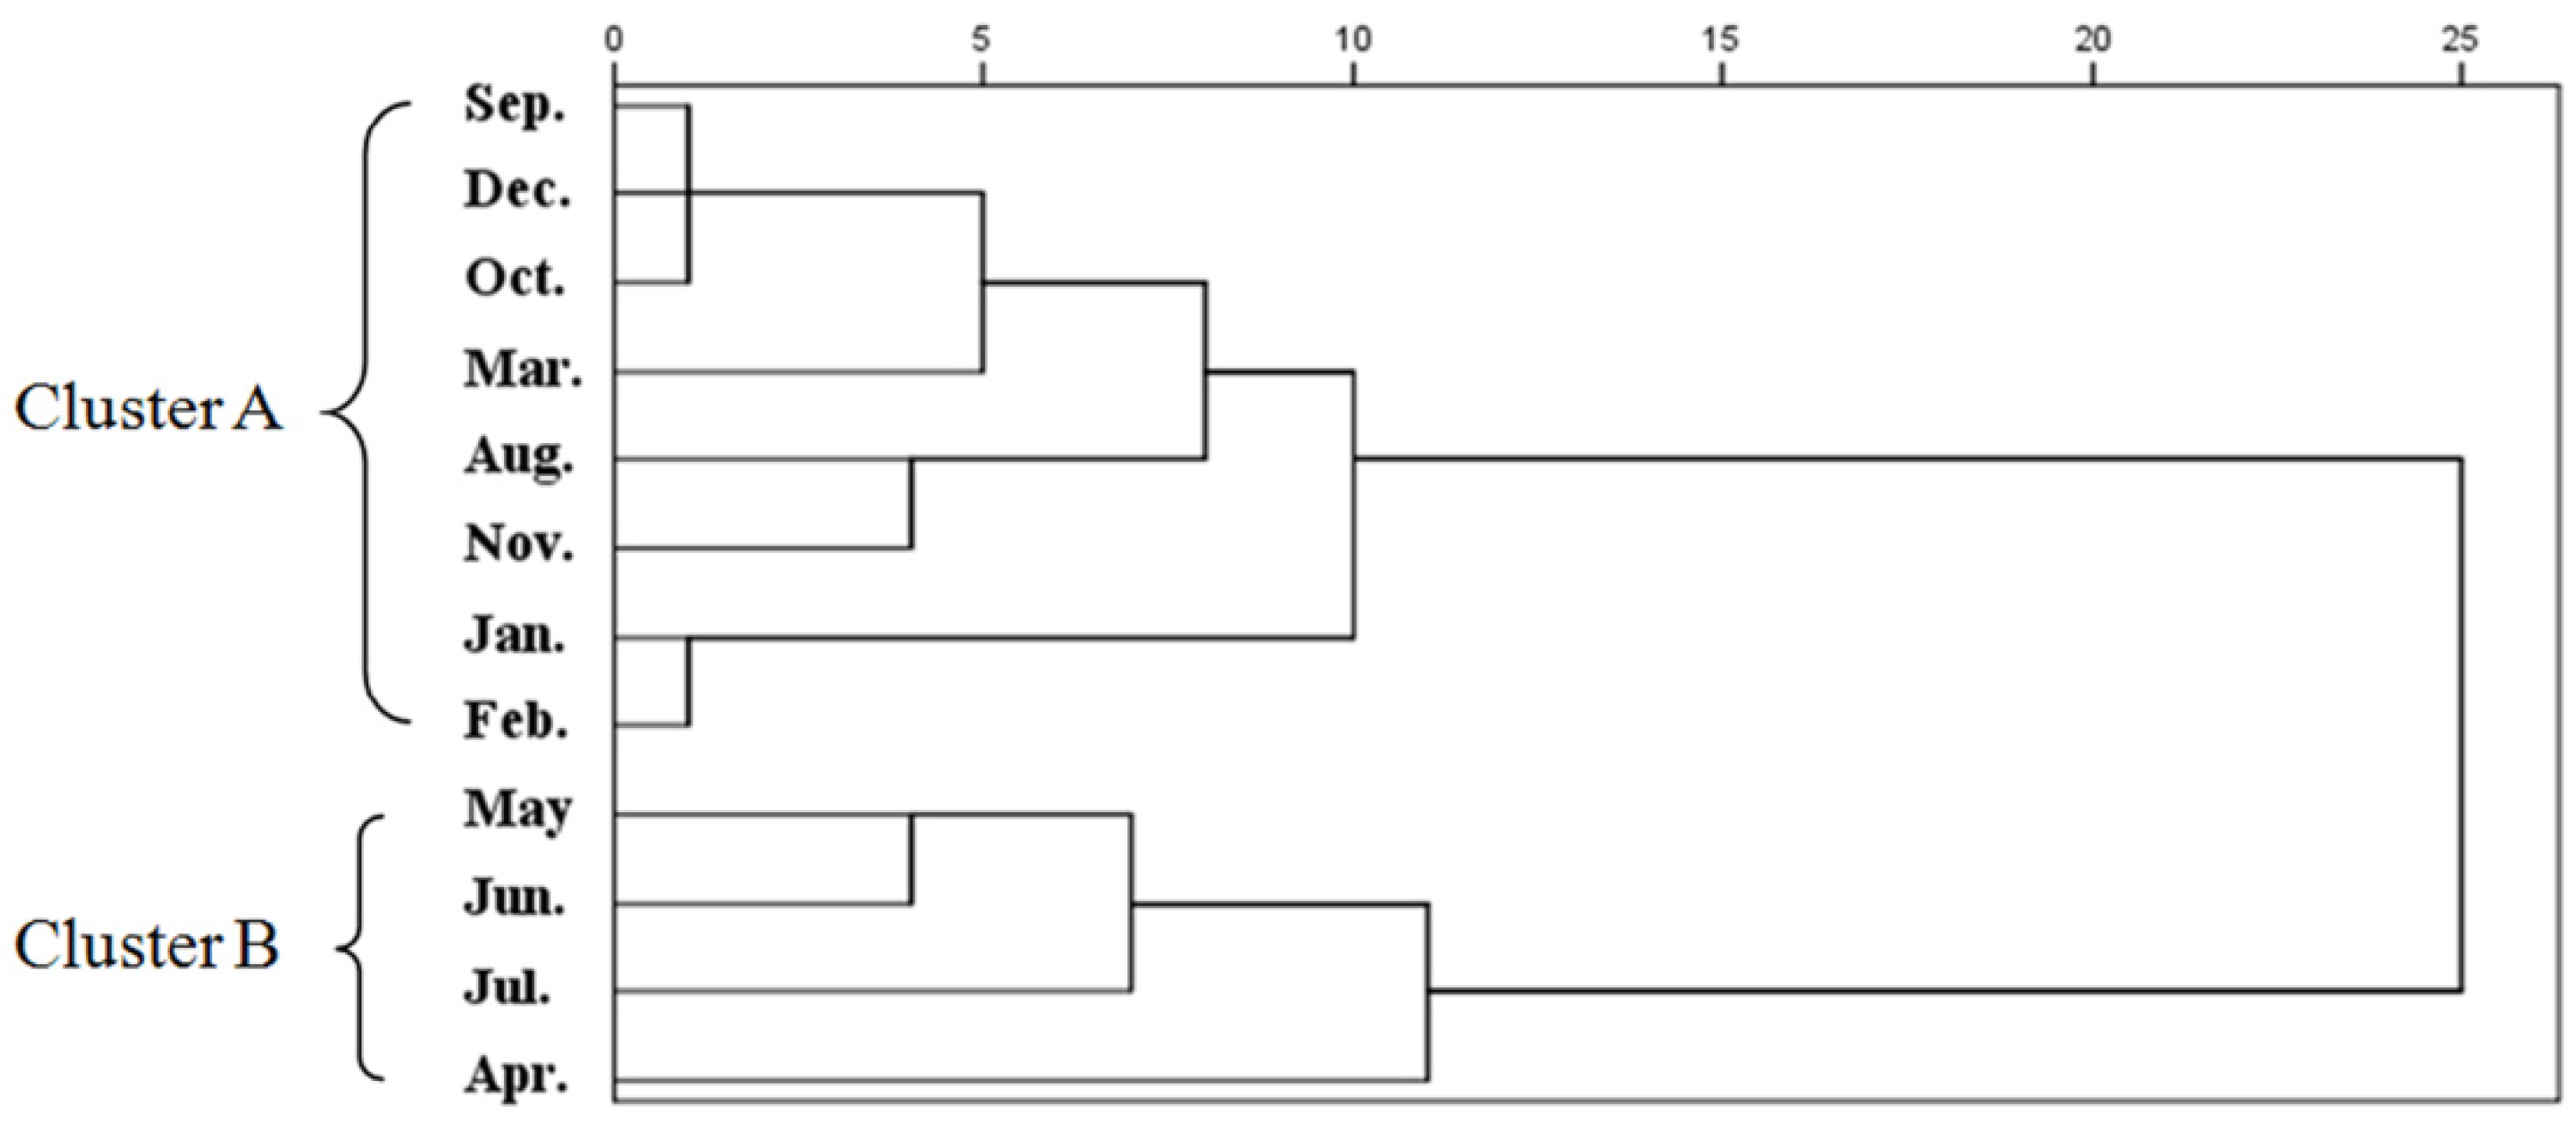
Temporal CA clustered the 12 sampling months into two groups, as presented by the dendrogram (Figure 3). Cluster A consisted of six months (January, February, March, August, September, October, November, and December), corresponding approximately to the drought period in the study area (September to February). Cluster B consisted of four months (April, May, June, and July), roughly equal to the wet period (March to August). Thus, 12 months were classified into two clusters by the actual water quality rather than the drought/wet period. This partition of sampling periods is more practical because the water quality variation was not strictly consistent with the natural seasons and the drought/wet period.

3.3. Discriminant Analysis

To characterize the temporal pattern of water quality among the four years, DA was applied to recognize the most significant discriminant parameters according to the differences between the years. The values of Wilk’lambda, chi-square and p-level for each discriminant function are shown in Table 3, where the values of Wilk’lambda varied between 0.091 and 0.943, chi-square varied between 5.7 and 118.3, and the p-levels were below 0.01, denoting that the DA performance was statistically meaningful. The proposed three modes of DA were performed on the raw data, from which the discriminant functions (DFs) were obtained, as shown in Table 4. The DFs constructed by standard DA mode, including all of the nine independent variables, produced the classification matrices (CMs), rightly identifying 87.5% of the cases. The coefficients for the FC were zero. The DFs obtained through the forward-stepwise mode, selecting SD, DO, CODMn, TN and TP as the discriminant parameters, generated CMs identifying 81.4% of the cases rightly. The DFs constructed by the backward-stepwise DA mode provided CMs with 79.9% correct assignations using SD, DO, CODMn and TP as the discriminant variables. Therefore, the parameters SD, DO, CODMn and TP were the most significant expected to interpret the temporal variations in water quality during the study years.
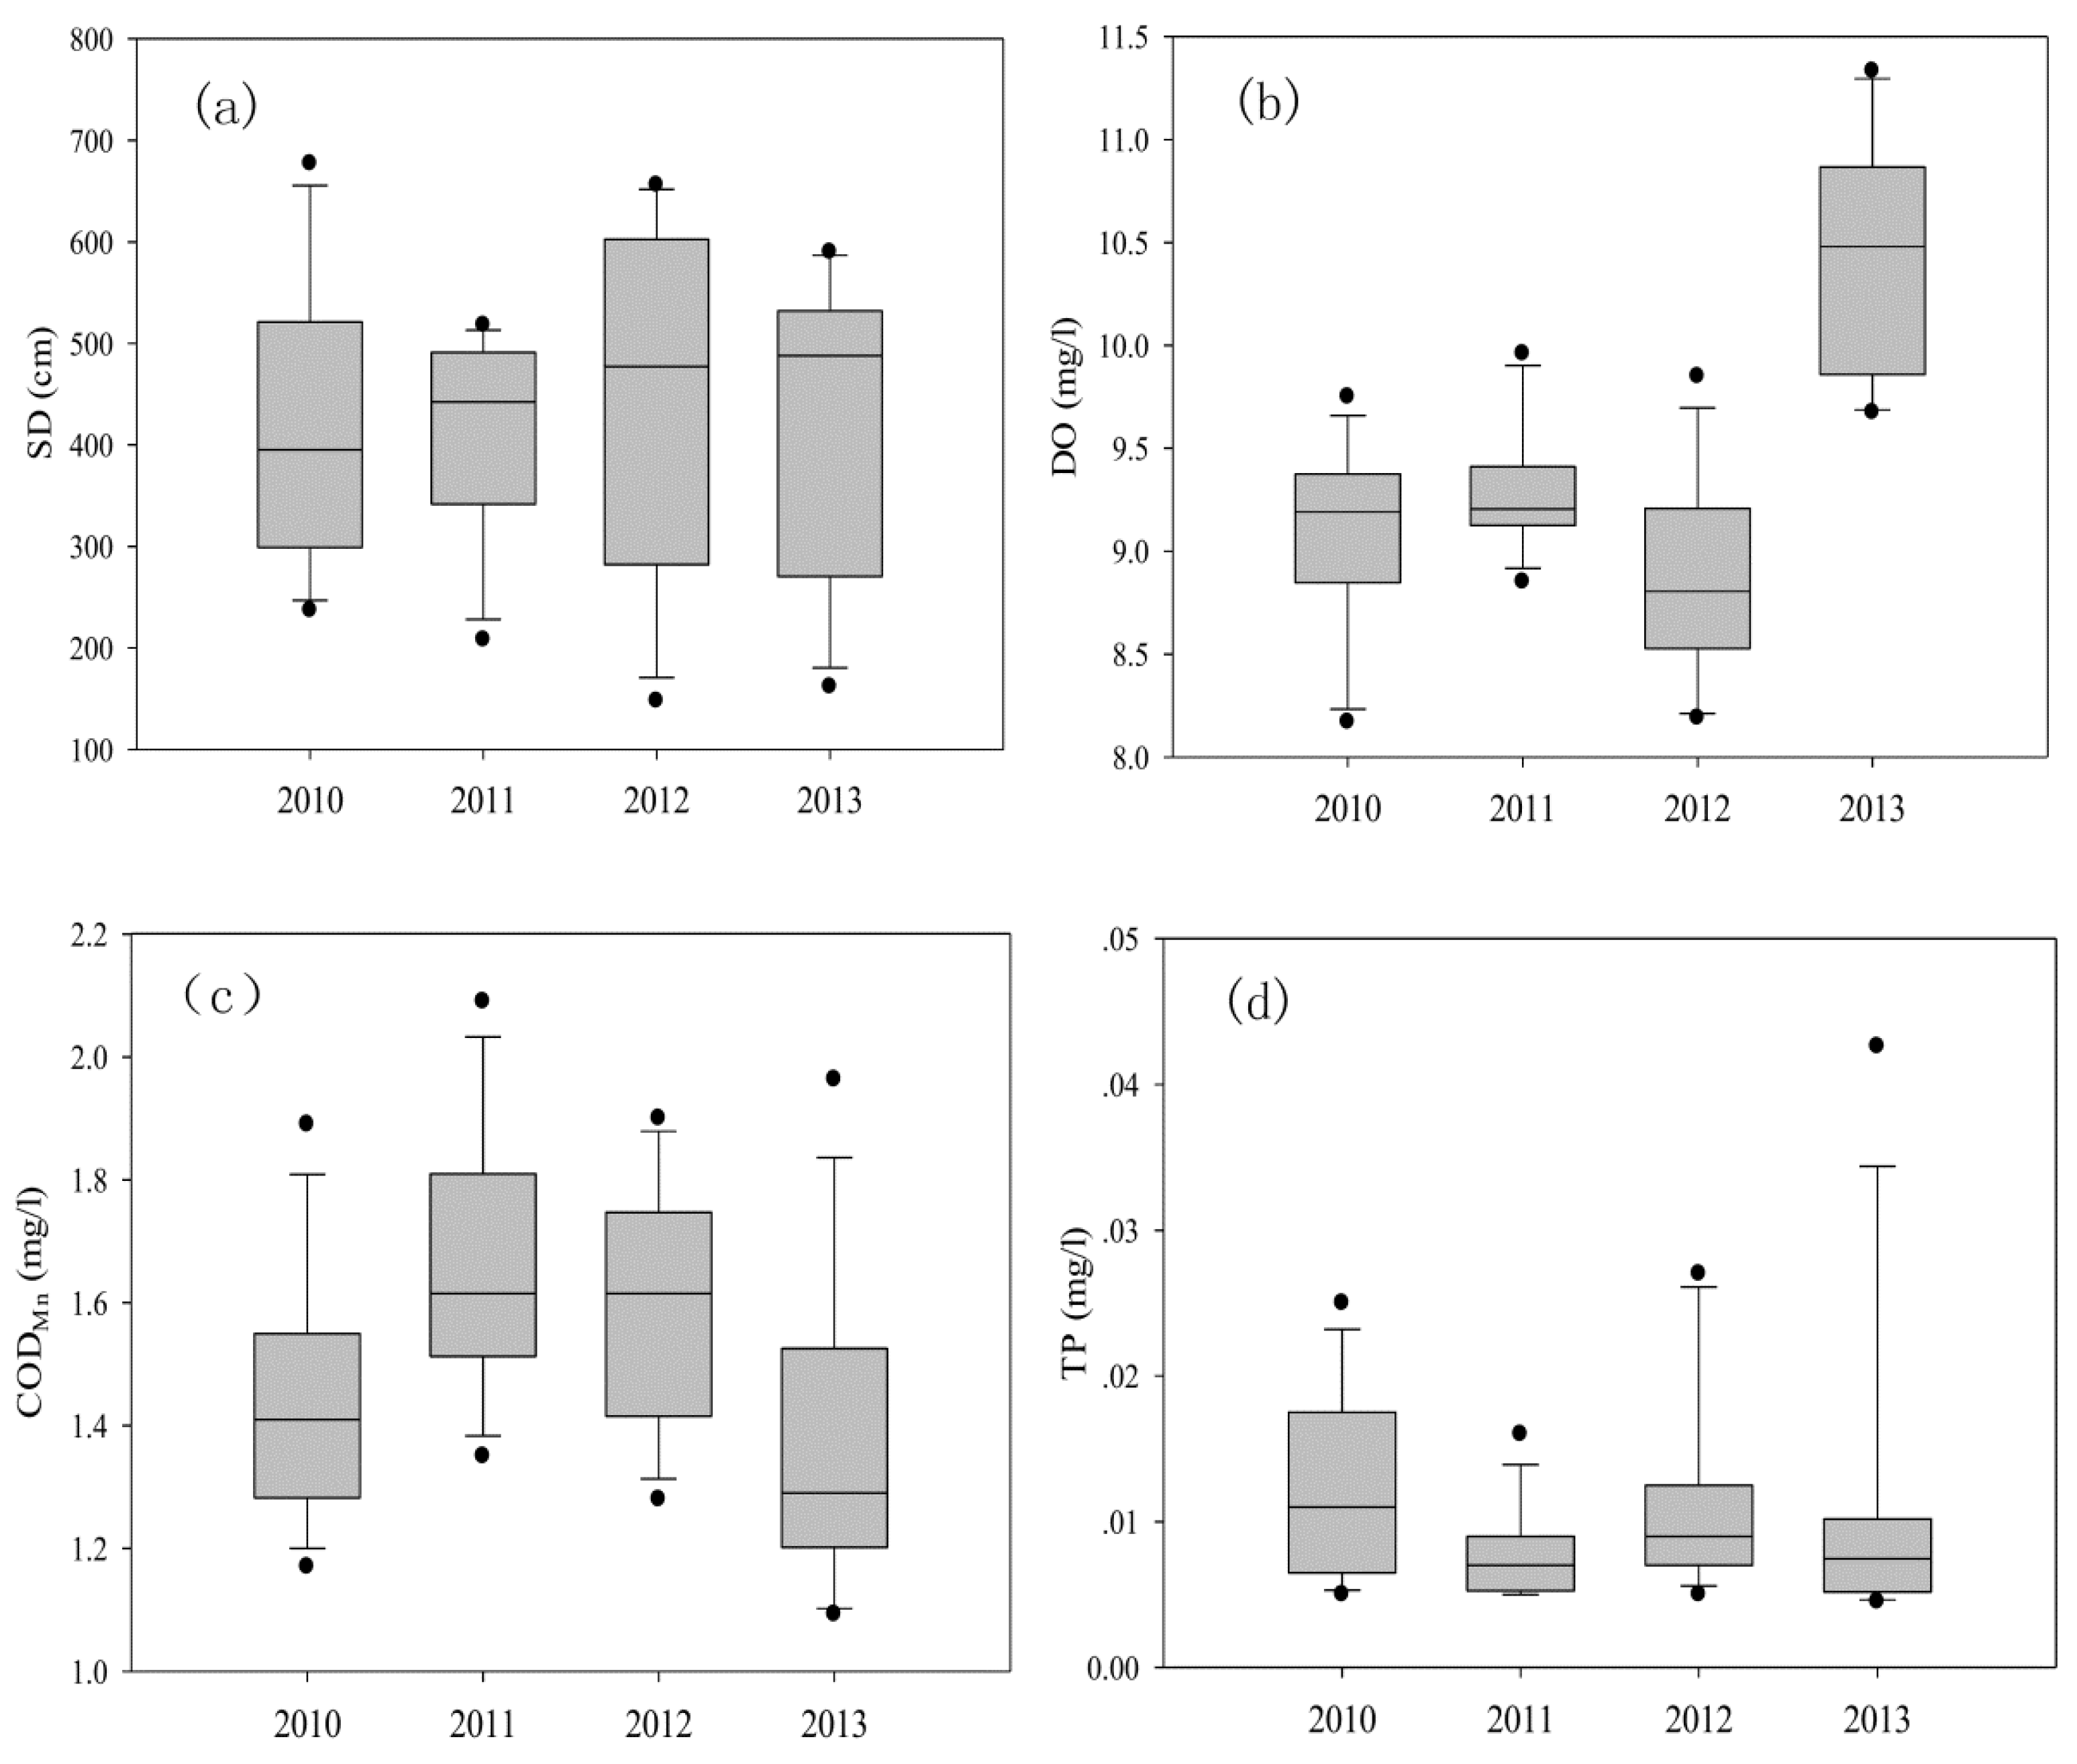
Figure 4 shows the temporal trend of the four discriminant variables obtained through DA. The variation in SD was larger in 2012 compared with the other three years, and significant sudden changes were not detected. The concentration of DO was higher in 2011, with a smaller variation than in 2010, and it was highest in 2012. The concentration of CODMn was observed to be the highest in 2011, and then it declined from 2011 to 2013. The trend for TP showed that the variation in 2011 was the smallest, followed by 2010 and 2012, and it was the largest in 2013. According to the tendencies of the four parameters during 2010 to 2013, the water quality in 2013 was somewhat superior compared with 2010.
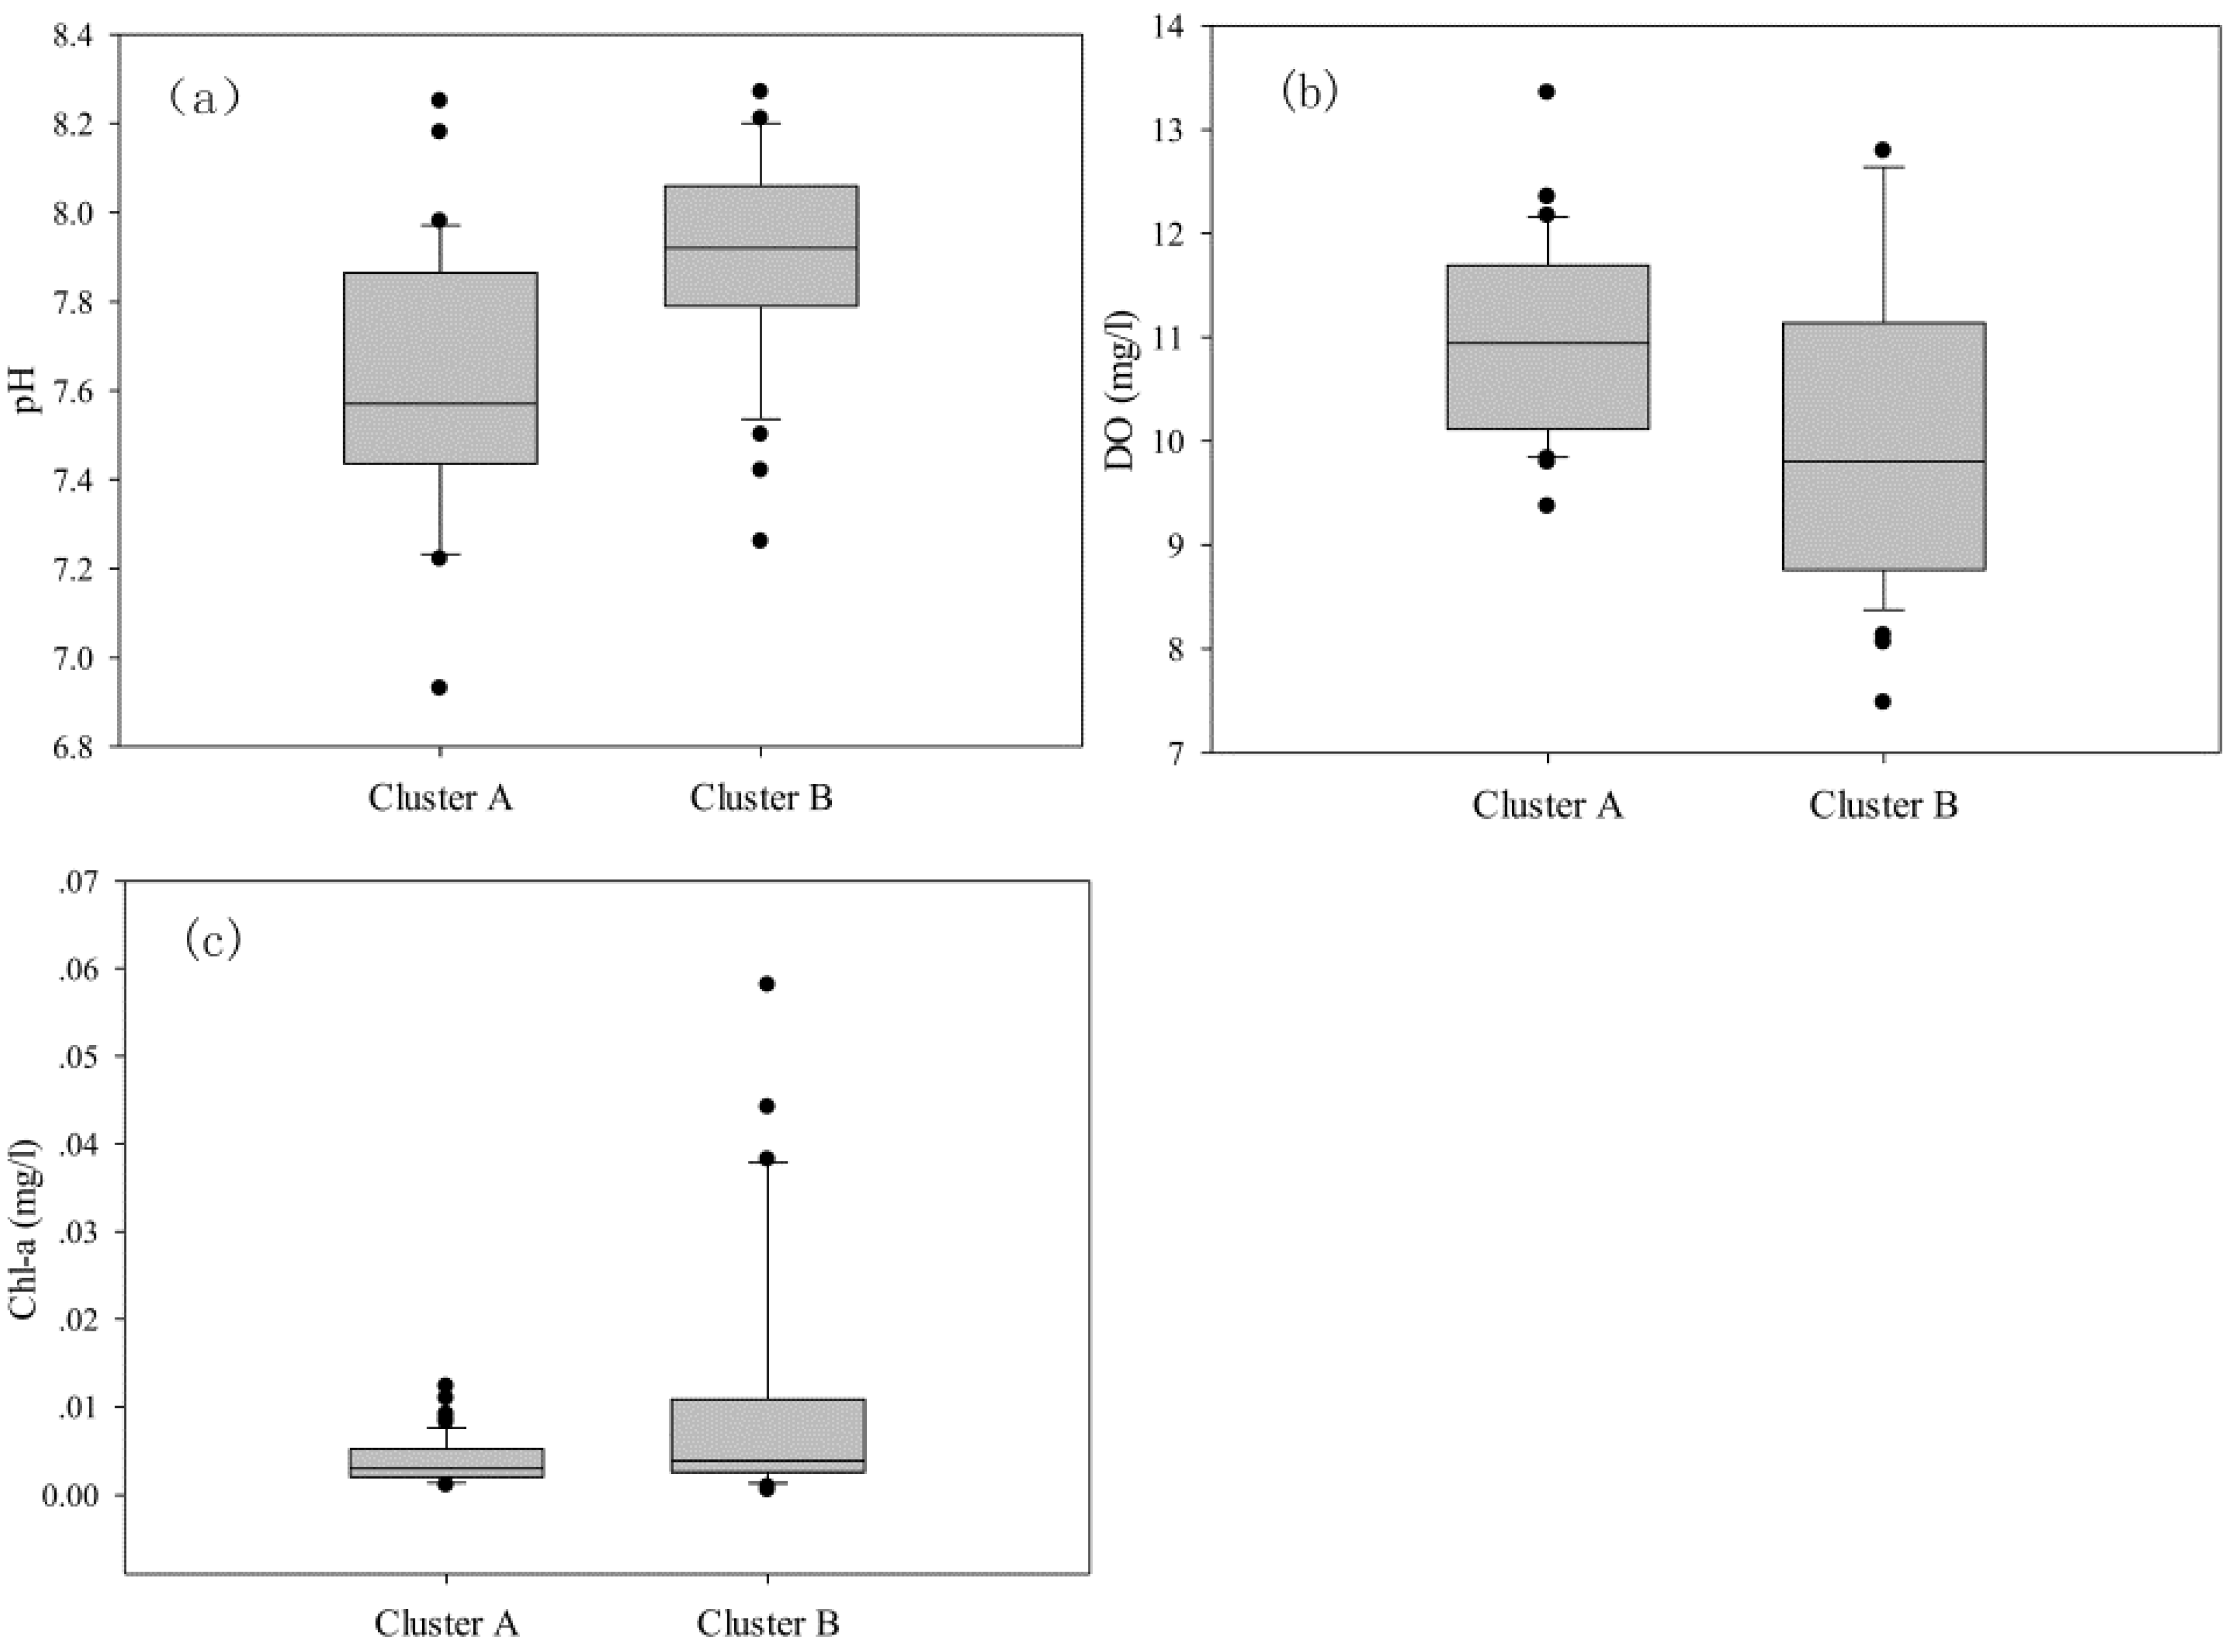
Temporal DA was applied to the two clusters (Cluster A and Cluster B) obtained through CA to recognize the most significant discriminant water quality parameters among the sampling periods. The values of Wilk’lambda and chi-square and the p-levels showed in Table 5 indicate that the DA performance was statistically meaningful. The DFs yielded from the different modes of DA are shown in Table 6. The DFs from the standard and forward-stepwise modes, comprising nine and five parameters, respectively, produced CMs with total correct assignments close to 90% (88.5% and 88.2%, respectively). The DFs from the backward-stepwise mode yielded a similar result, identifying 87.8% of the cases using three variables: pH, DO and Chl-a. Thus, it indicated that pH, DO and Chl-a were the most significant parameters accounting for the variations in water quality between the two sampling periods.
Box plots of pH, DO and Chl-a show the temporal trends between the sampling periods (Figure 5). The pH value was significantly higher in Cluster B than in Cluster A, and some dispersed points were observed, which indicated very high or very low values. The concentration of DO decreased in Cluster B, with a larger variation than in Cluster A. An opposite relationship between DO and Chl-a can be found. Compared with Cluster A, the Chl-a values in Cluster B was higher, and the values were more dispersed. Additionally, some points with very high concentrations were found in Cluster B. The temporal trend of significant parameters suggested that the water quality in Qiandao Lake was inferior in the wet period (Cluster B) compared with the drought period (Cluster A), which can be attributed to the increased agricultural activities during the wet period and the higher river contribution leading to washout of agricultural soils [27].
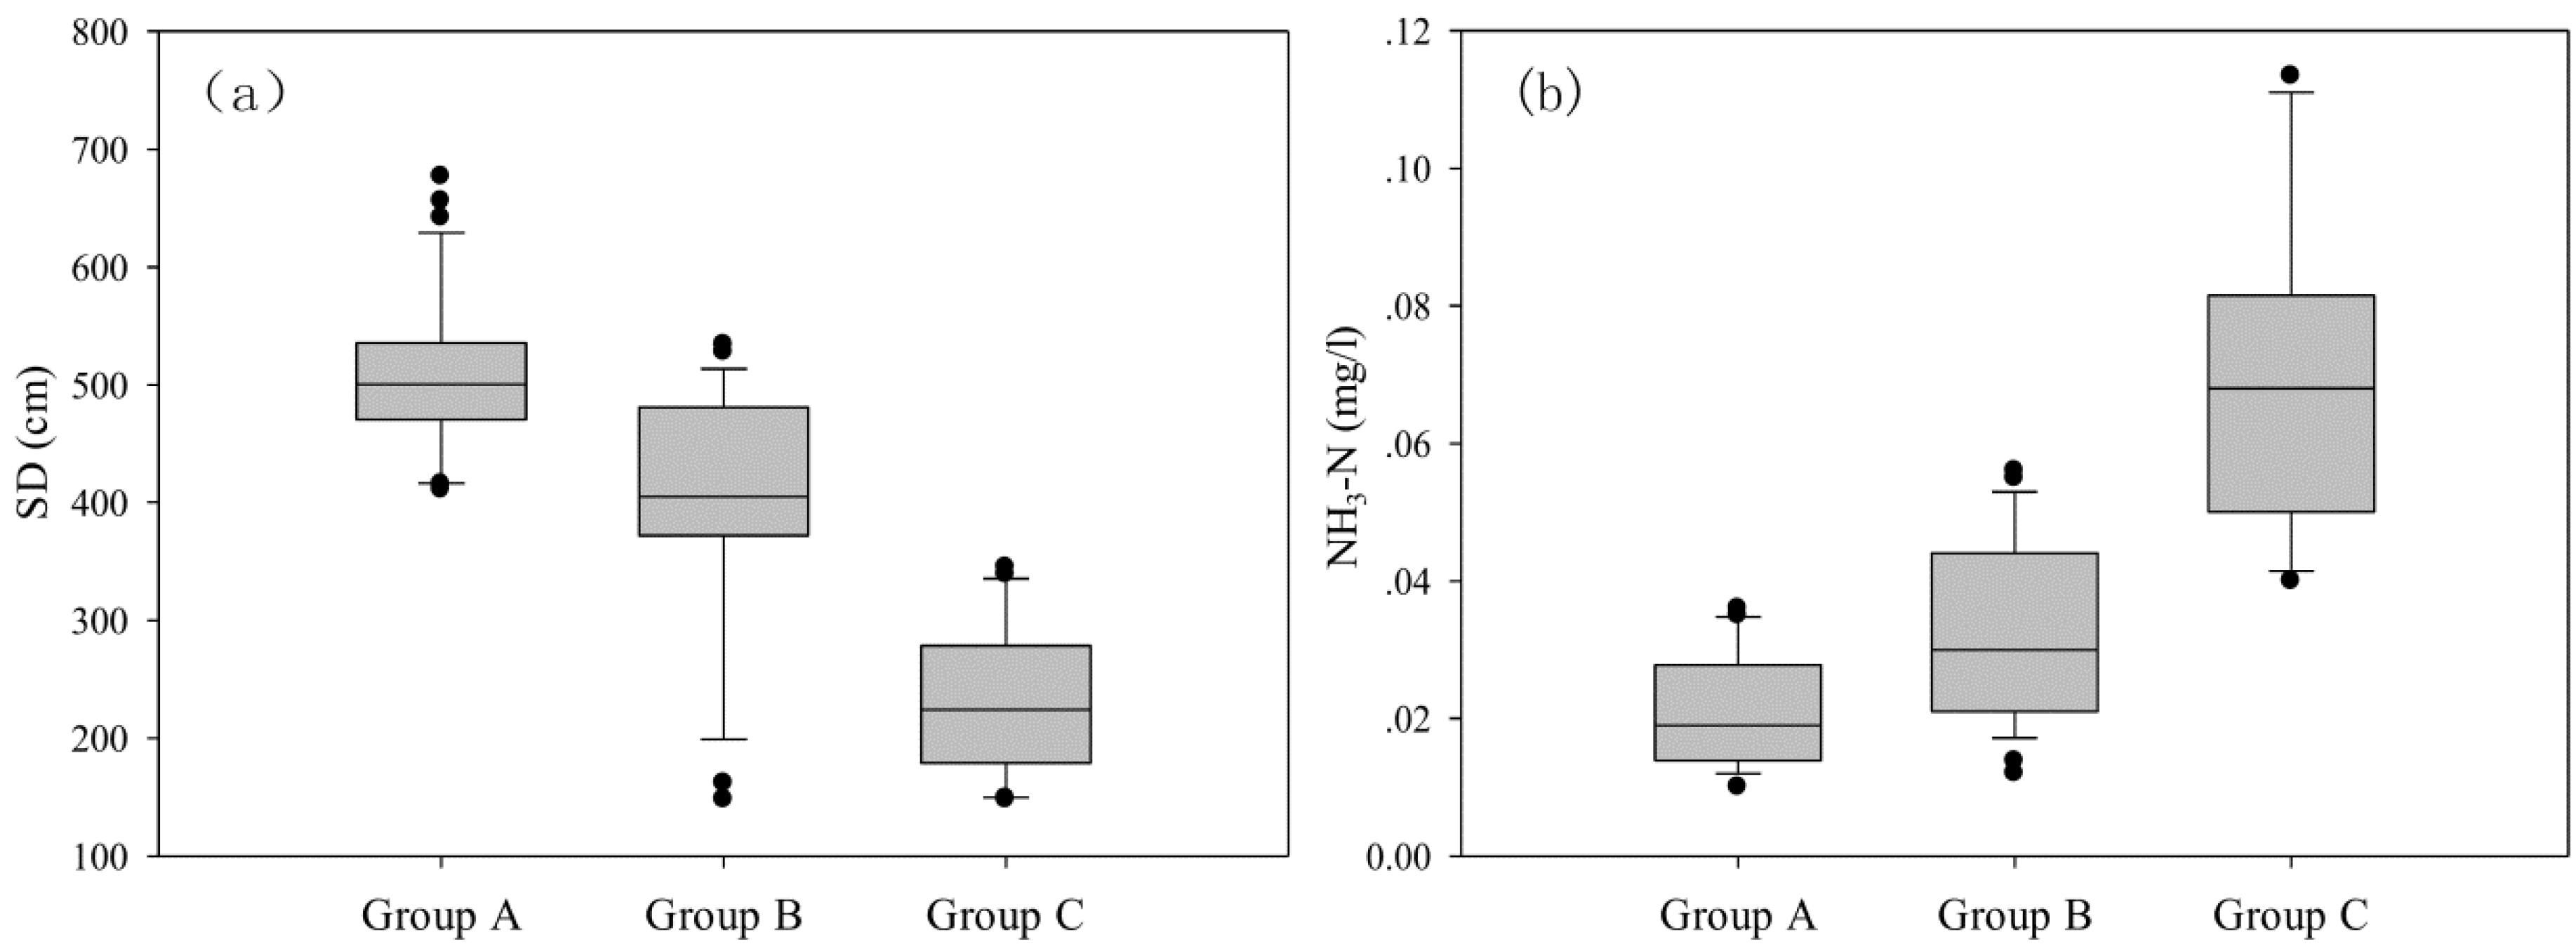
Spatial DA was applied to characterize the spatial variations in water quality between the three groups of sampling sites delineated by CA. Table 7 shows the values of Wilk’lambda, chi-square and p-level for each discriminant function, where the values of Wilk’lambda varied between 0.080 to 0.660, and chi-square varied between 18.5 and 103.8. The DA results were significant, as indicated by the p-levels below 0.01. The three DA modes were again performed to obtain the DFs, as shown in Table 8. The DFs produced by the standard and forward-stepwise modes, including nine and six discriminant variables, correctly assigned 85.1% and 83.3% of the cases, respectively. The DFs constructed by the backward-stepwise mode obtained CMs with 81.6% right assignations using SD and NH3-N, suggesting that they were the significant discriminating parameters.
Box plots of SD and NH3-N show different spatial patterns of the water quality of Qiandao Lake (Figure 6). The SD was highest in the Group A sites, followed by Group B, whereas Group C had the lowest. An obvious opposite relationship between SD and NH3-N can be found. The concentration of NH3-N was highest at the Group C sites, and it was lowest at the Group A sites. The spatial pattern in the water quality of Qiandao Lake exhibited a trend of improvement from the northwest (inflow) to the southeast (outflow) of the lake. Among all of the sampling sites, the Group C sites were located at the most upstream site, and the water quality was mostly impacted by inflow from the Xin’an Jiang River, which received substantial amounts of domestic sewage, agricultural pollution, and industrial wastewater discharge from the upstream contributing area.

3.4. Identification of Potential Pollution Sources

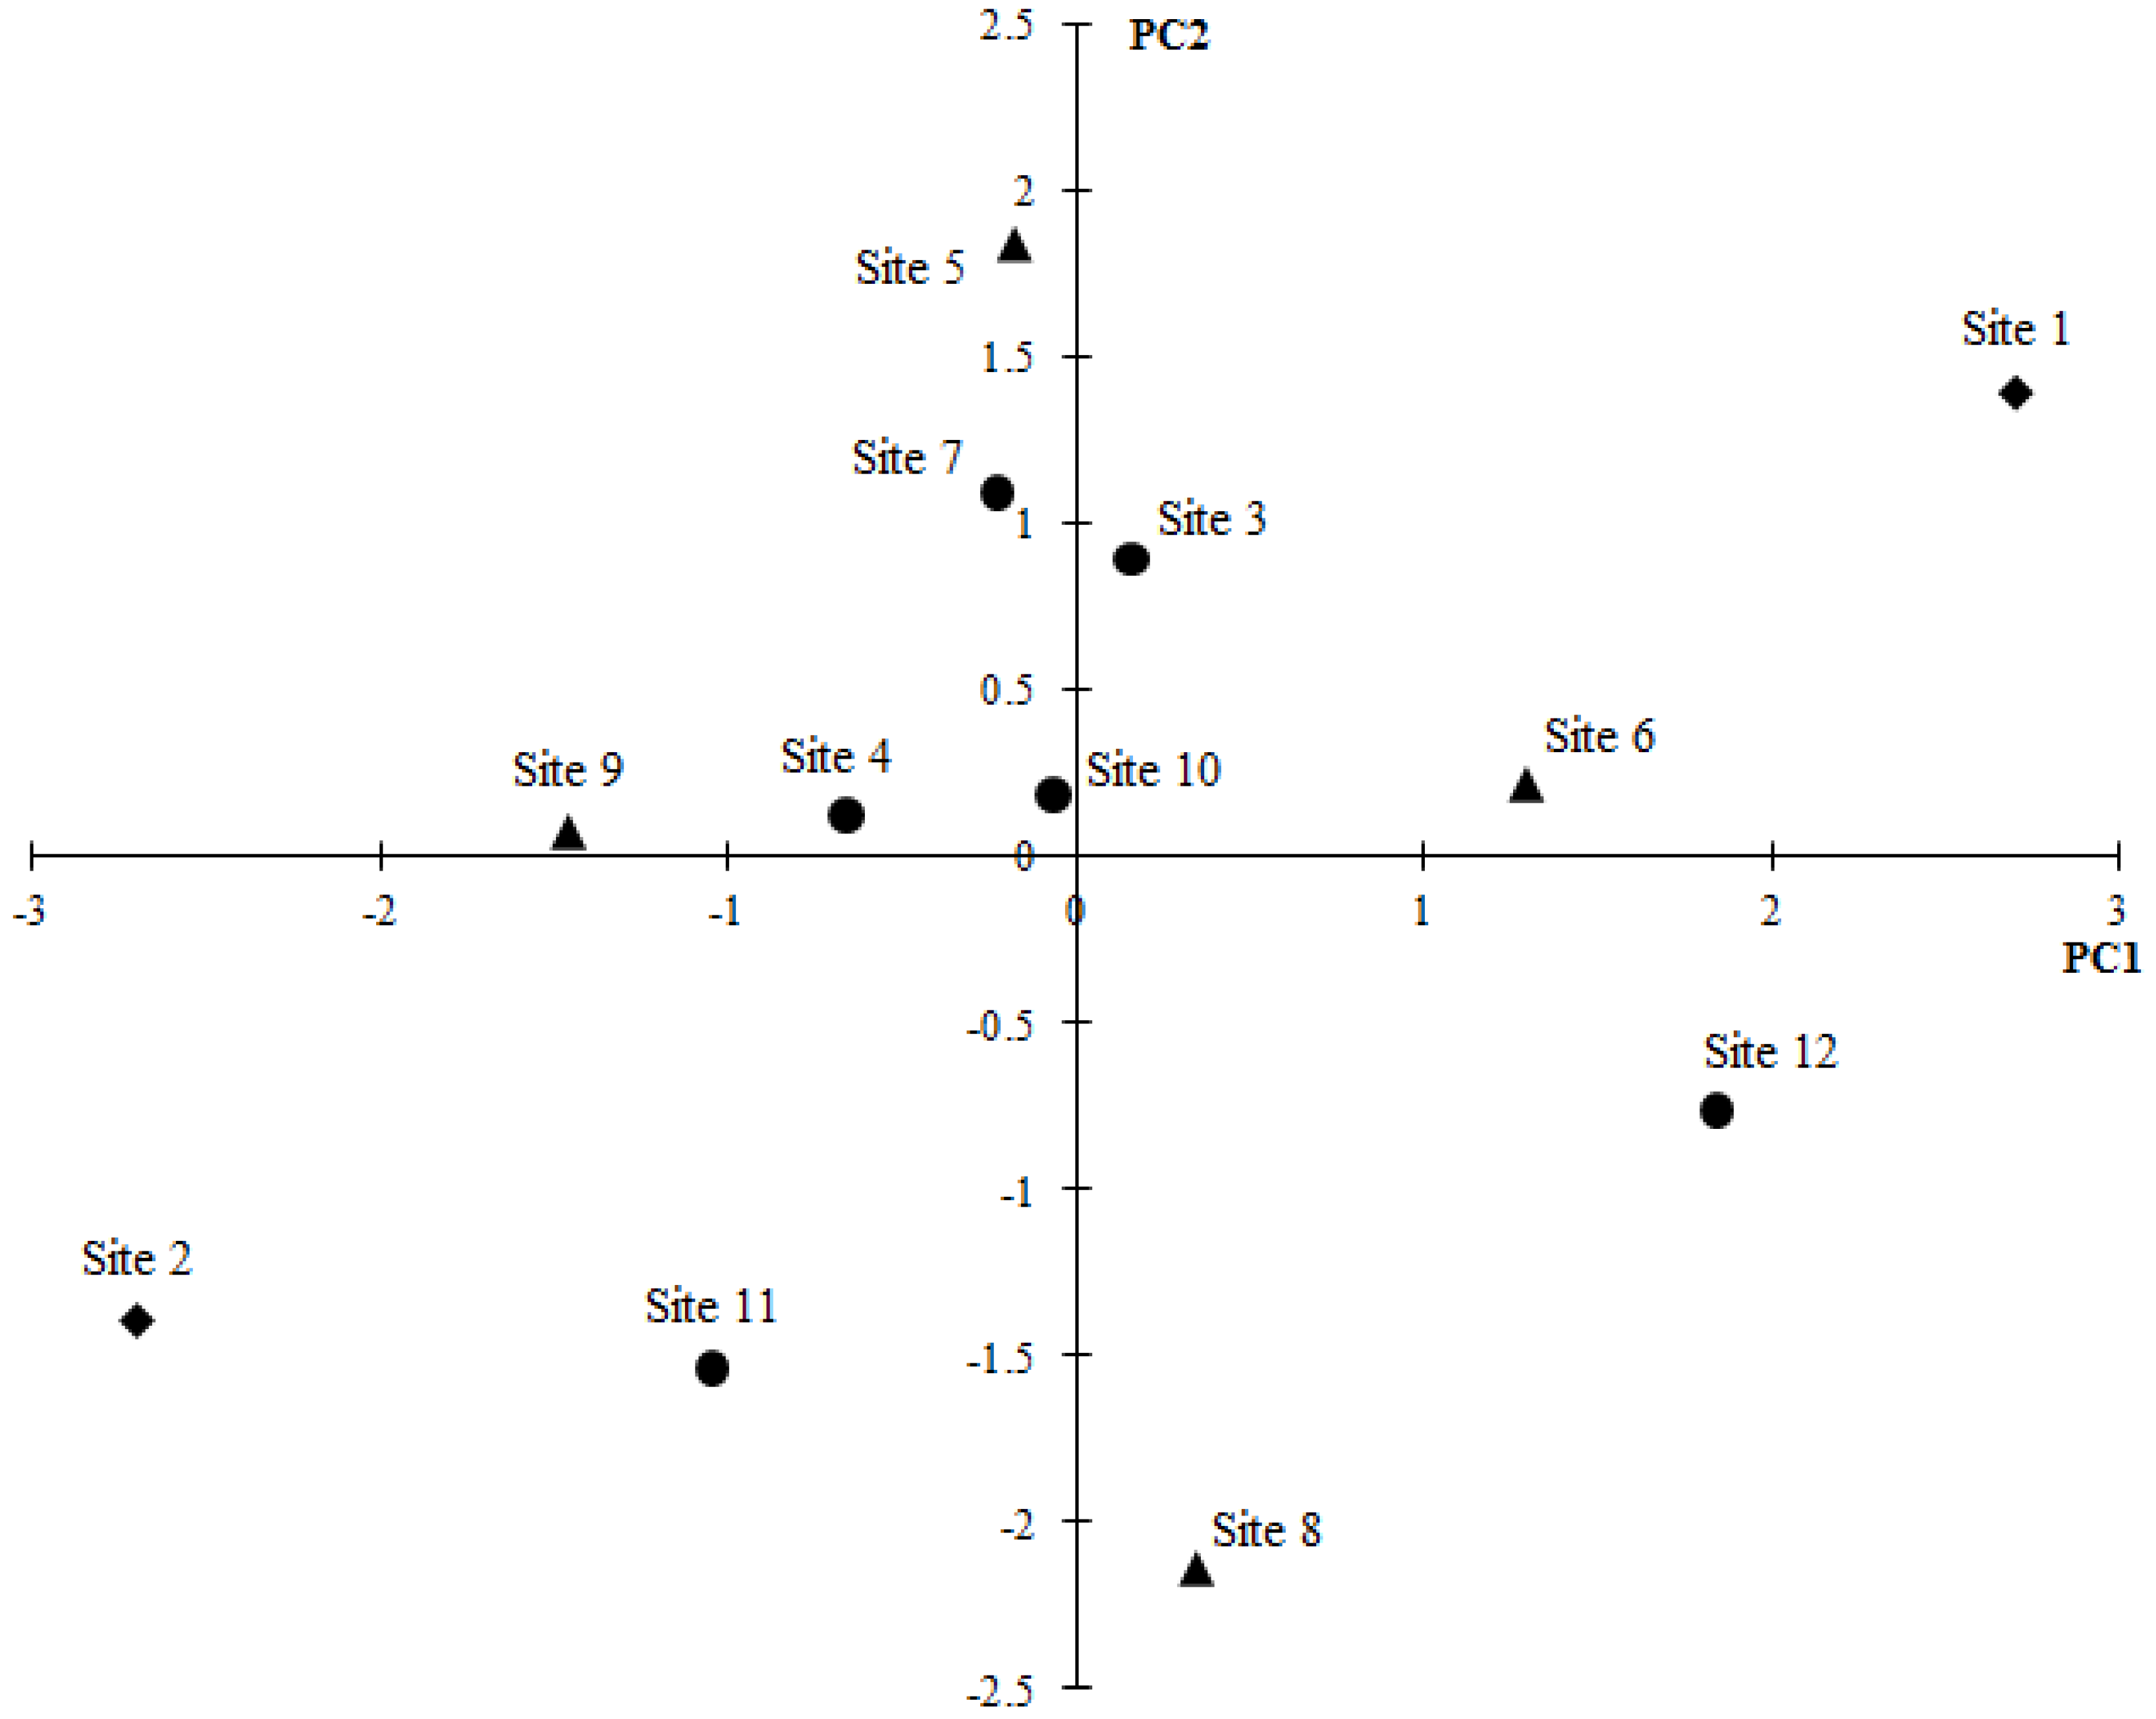
After normalization for the data sets of the three groups of sampling sites (as obtained through CA), PCA was applied to assess the compositional patterns between variables and to detect the sources influencing water quality for different regions. PCA produced four PCs for Groups A and B and three PCs for Group C with eigenvalues greater than 1, explaining 84.58%, 81.61% and 78.68% of the total variance in Groups A, B and C, respectively. Table 9 shows the parameter loadings and explained variance. Figure 7 shows the scores of sampling sites for the first two principal components. The variable loadings were classified as strong, moderate and weak, corresponding to absolute loading values of >0.75, 0.75–0.50 and 0.50–0.30, respectively [39].
For Group A, the VF1 accounted for 29.43% of the variance, and it had strongly positive loadings on CODMn and Chl-a and a moderately positive loading on NH3-N. CODMn was an organic pollution indicator, and it could be attributed to uncontrolled domestic discharges [3]. Chl-a was an index for phytoplankton abundance, and it likely represented the impacts of anthropogenic activities, including fish culture and agricultural runoff [40]. NH3-N can originate from various sources, including municipal waste, soil erosion and fertilizer applications [3,41]. Therefore, VF1 represented the contribution of nutrient pollution such as domestic wastewater and agricultural runoff. VF2, accounting for 24.50% of the variance, displayed a strongly positive loading on DO and a strongly negative loading on SD, and it can be ascribed to biochemical pollution [31]. VF3, which explained 17.54% of the variance, showed a strongly positive loading on FC and a moderately positive loading on TN. This factor can be ascribed to pollution from domestic discharge and agricultural and surface runoff [31,42]. VF4 explained the lowest variance (13.11%) and had a strongly positive loading on pH, representing the variability in physico-chemical aspects [21,32].
Among the four significant VFs of Group B, VF1 accounted for 30.46% of the total variance, and it was weighted on NH3-N, SD, TP, FC and TN. VF1 identified the nutrient pollution from anthropogenic activities such as domestic sewage and agricultural non-point source pollution [31,43]. VF2 represented 22.65% of the variance and had a strongly positive loading on Chl-a. It may be ascribed to organic pollution from domestic wastewater. VF3 constituted 15.20% of the variance, and it had a strongly negative loading on CODMn and a moderately positive loading on DO. This factor can be resulted from biochemical pollution [42]. VF4 explained 13.31% of the variance and was only marked by pH, representing the physico-chemical source of variability.
The sources in Group C were similar to that in Group B. VF1 explained 38.28% of the variance, and it was weighted on TN, TP and NH3-N. Agricultural non-point source pollution can be the explanation for this factor [27,43]. VF2, accounting for 25.25% of the variance, had strongly positively loadings on Chl-a and FC and a moderately positive loading on SD, likely representing organic pollution from domestic wastewater [31]. As with VF3 of Group B, VF3 (15.15% of the total variance) had a strongly positive loading on DO and a moderately negative loading on CODMn, and it can be attributed to biochemical pollution [42].

3.5. Water Quality Variations within the Lake

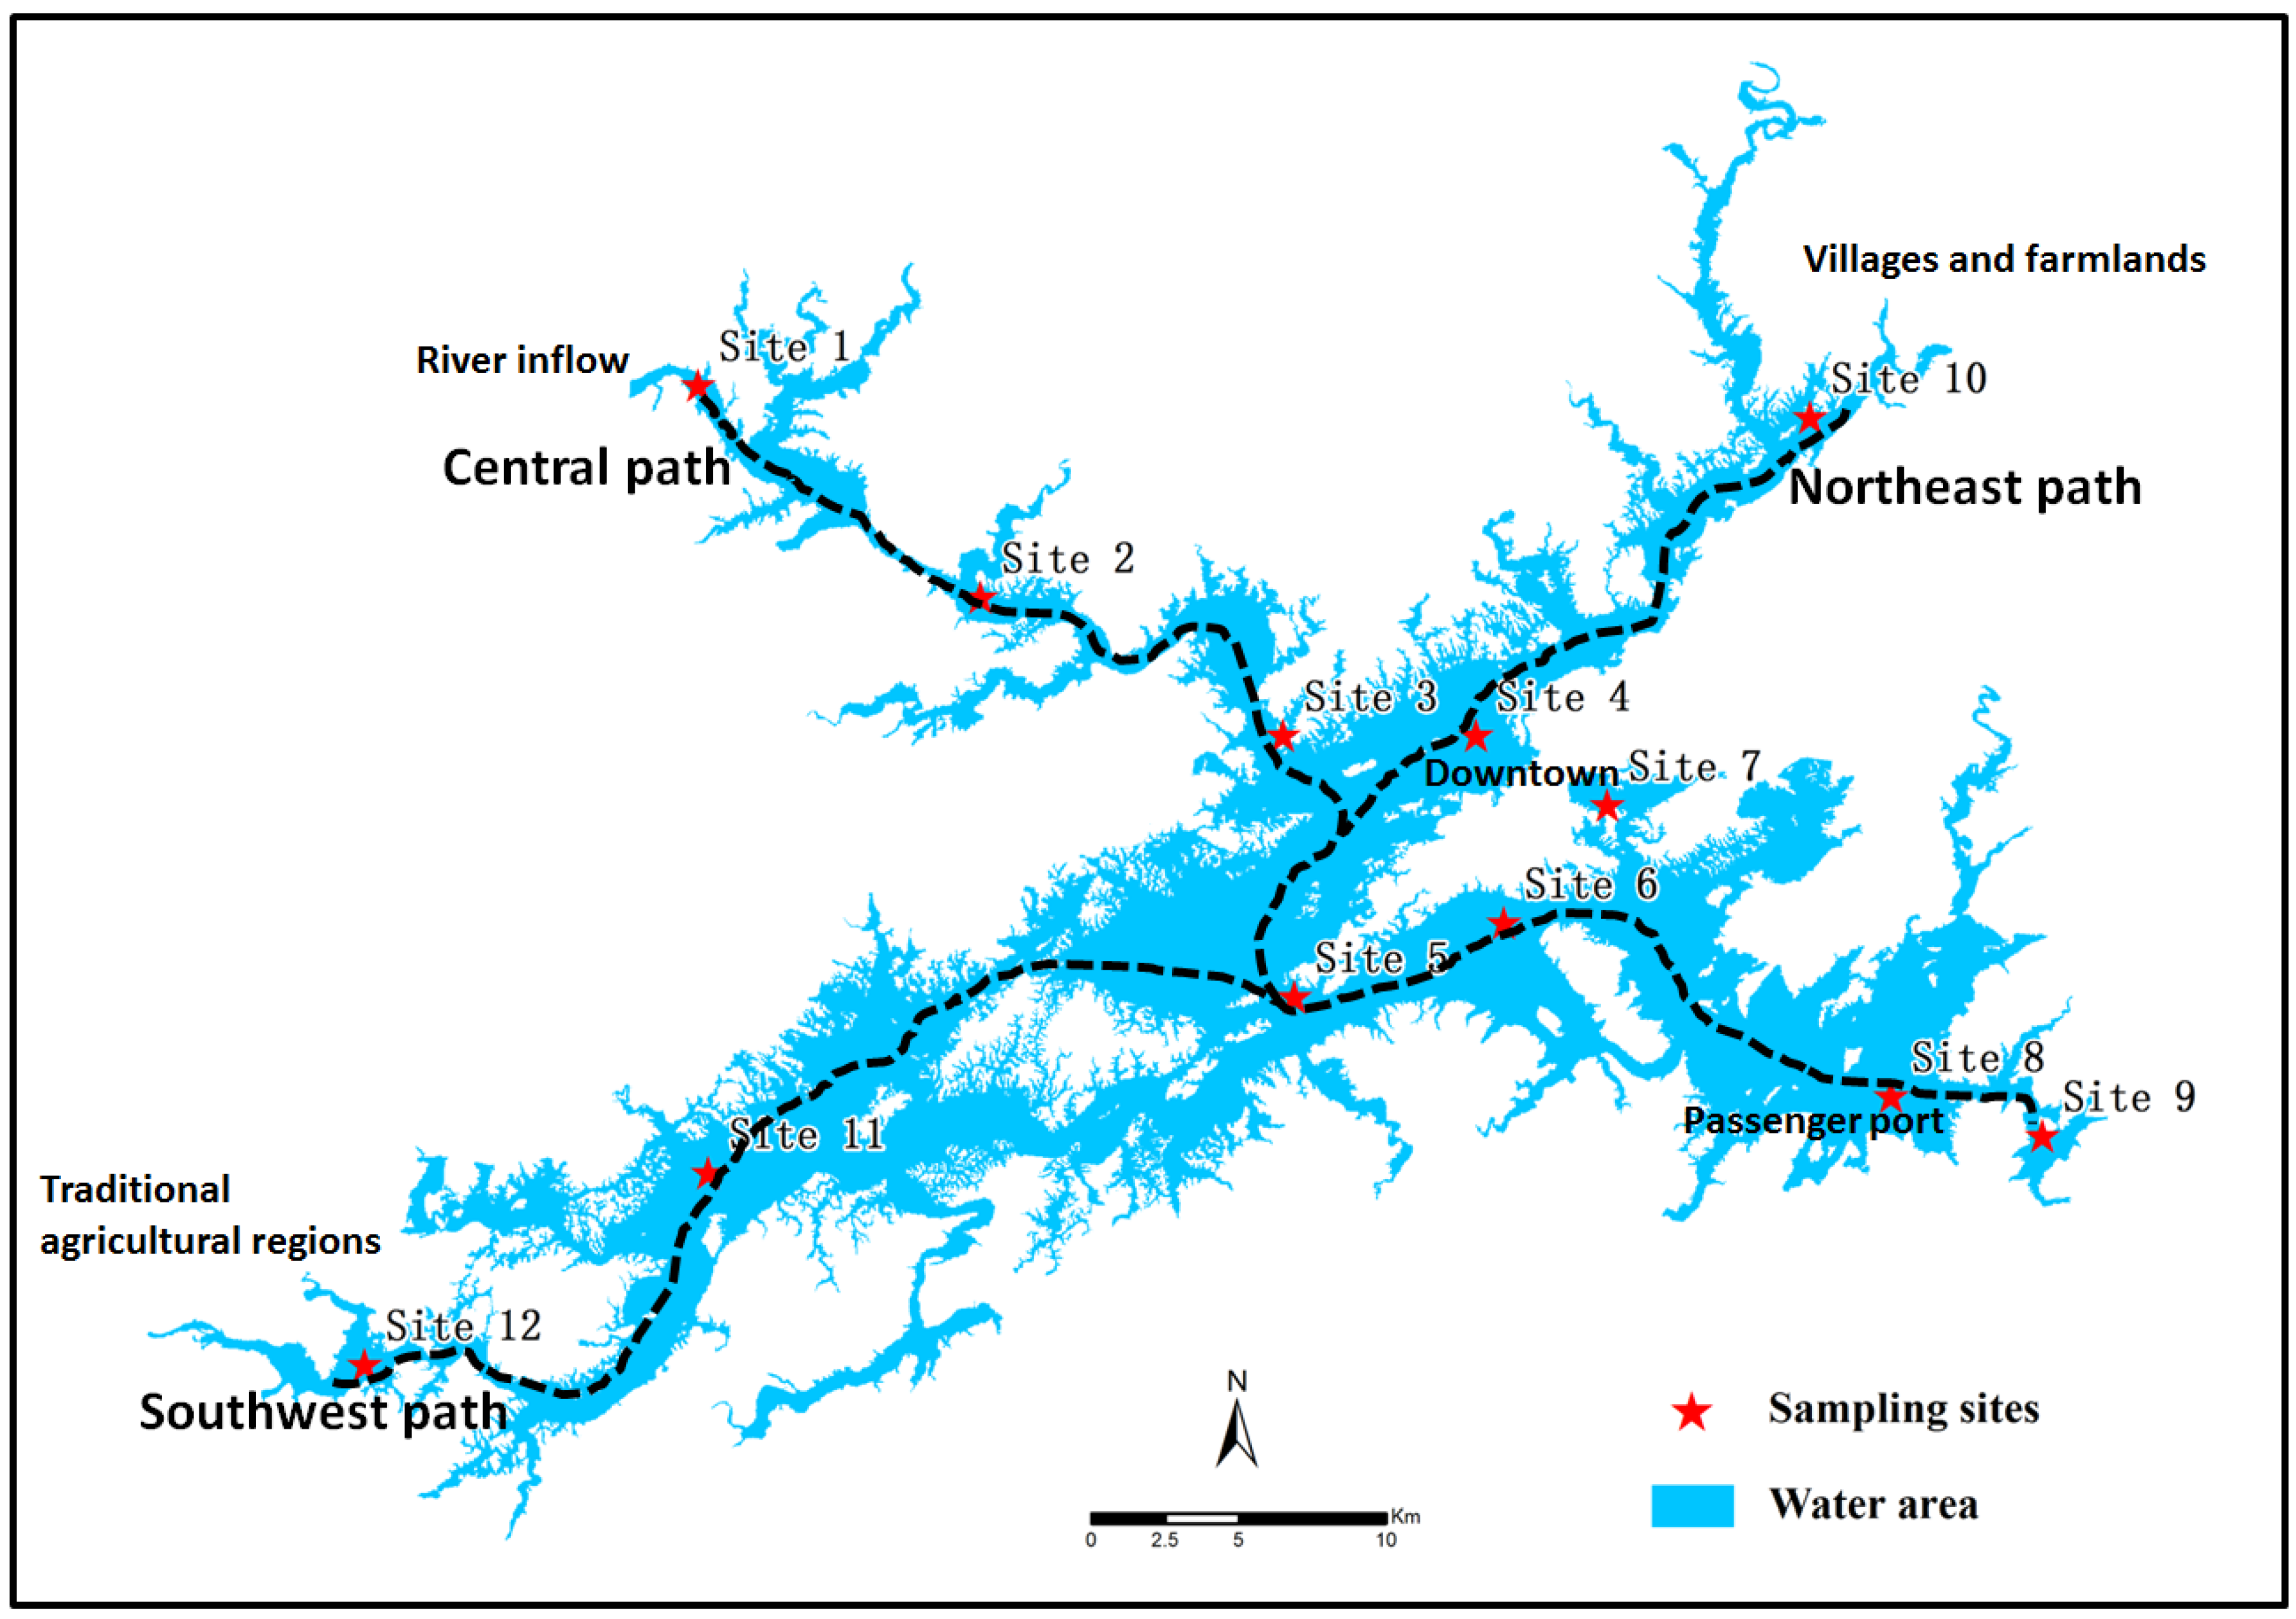
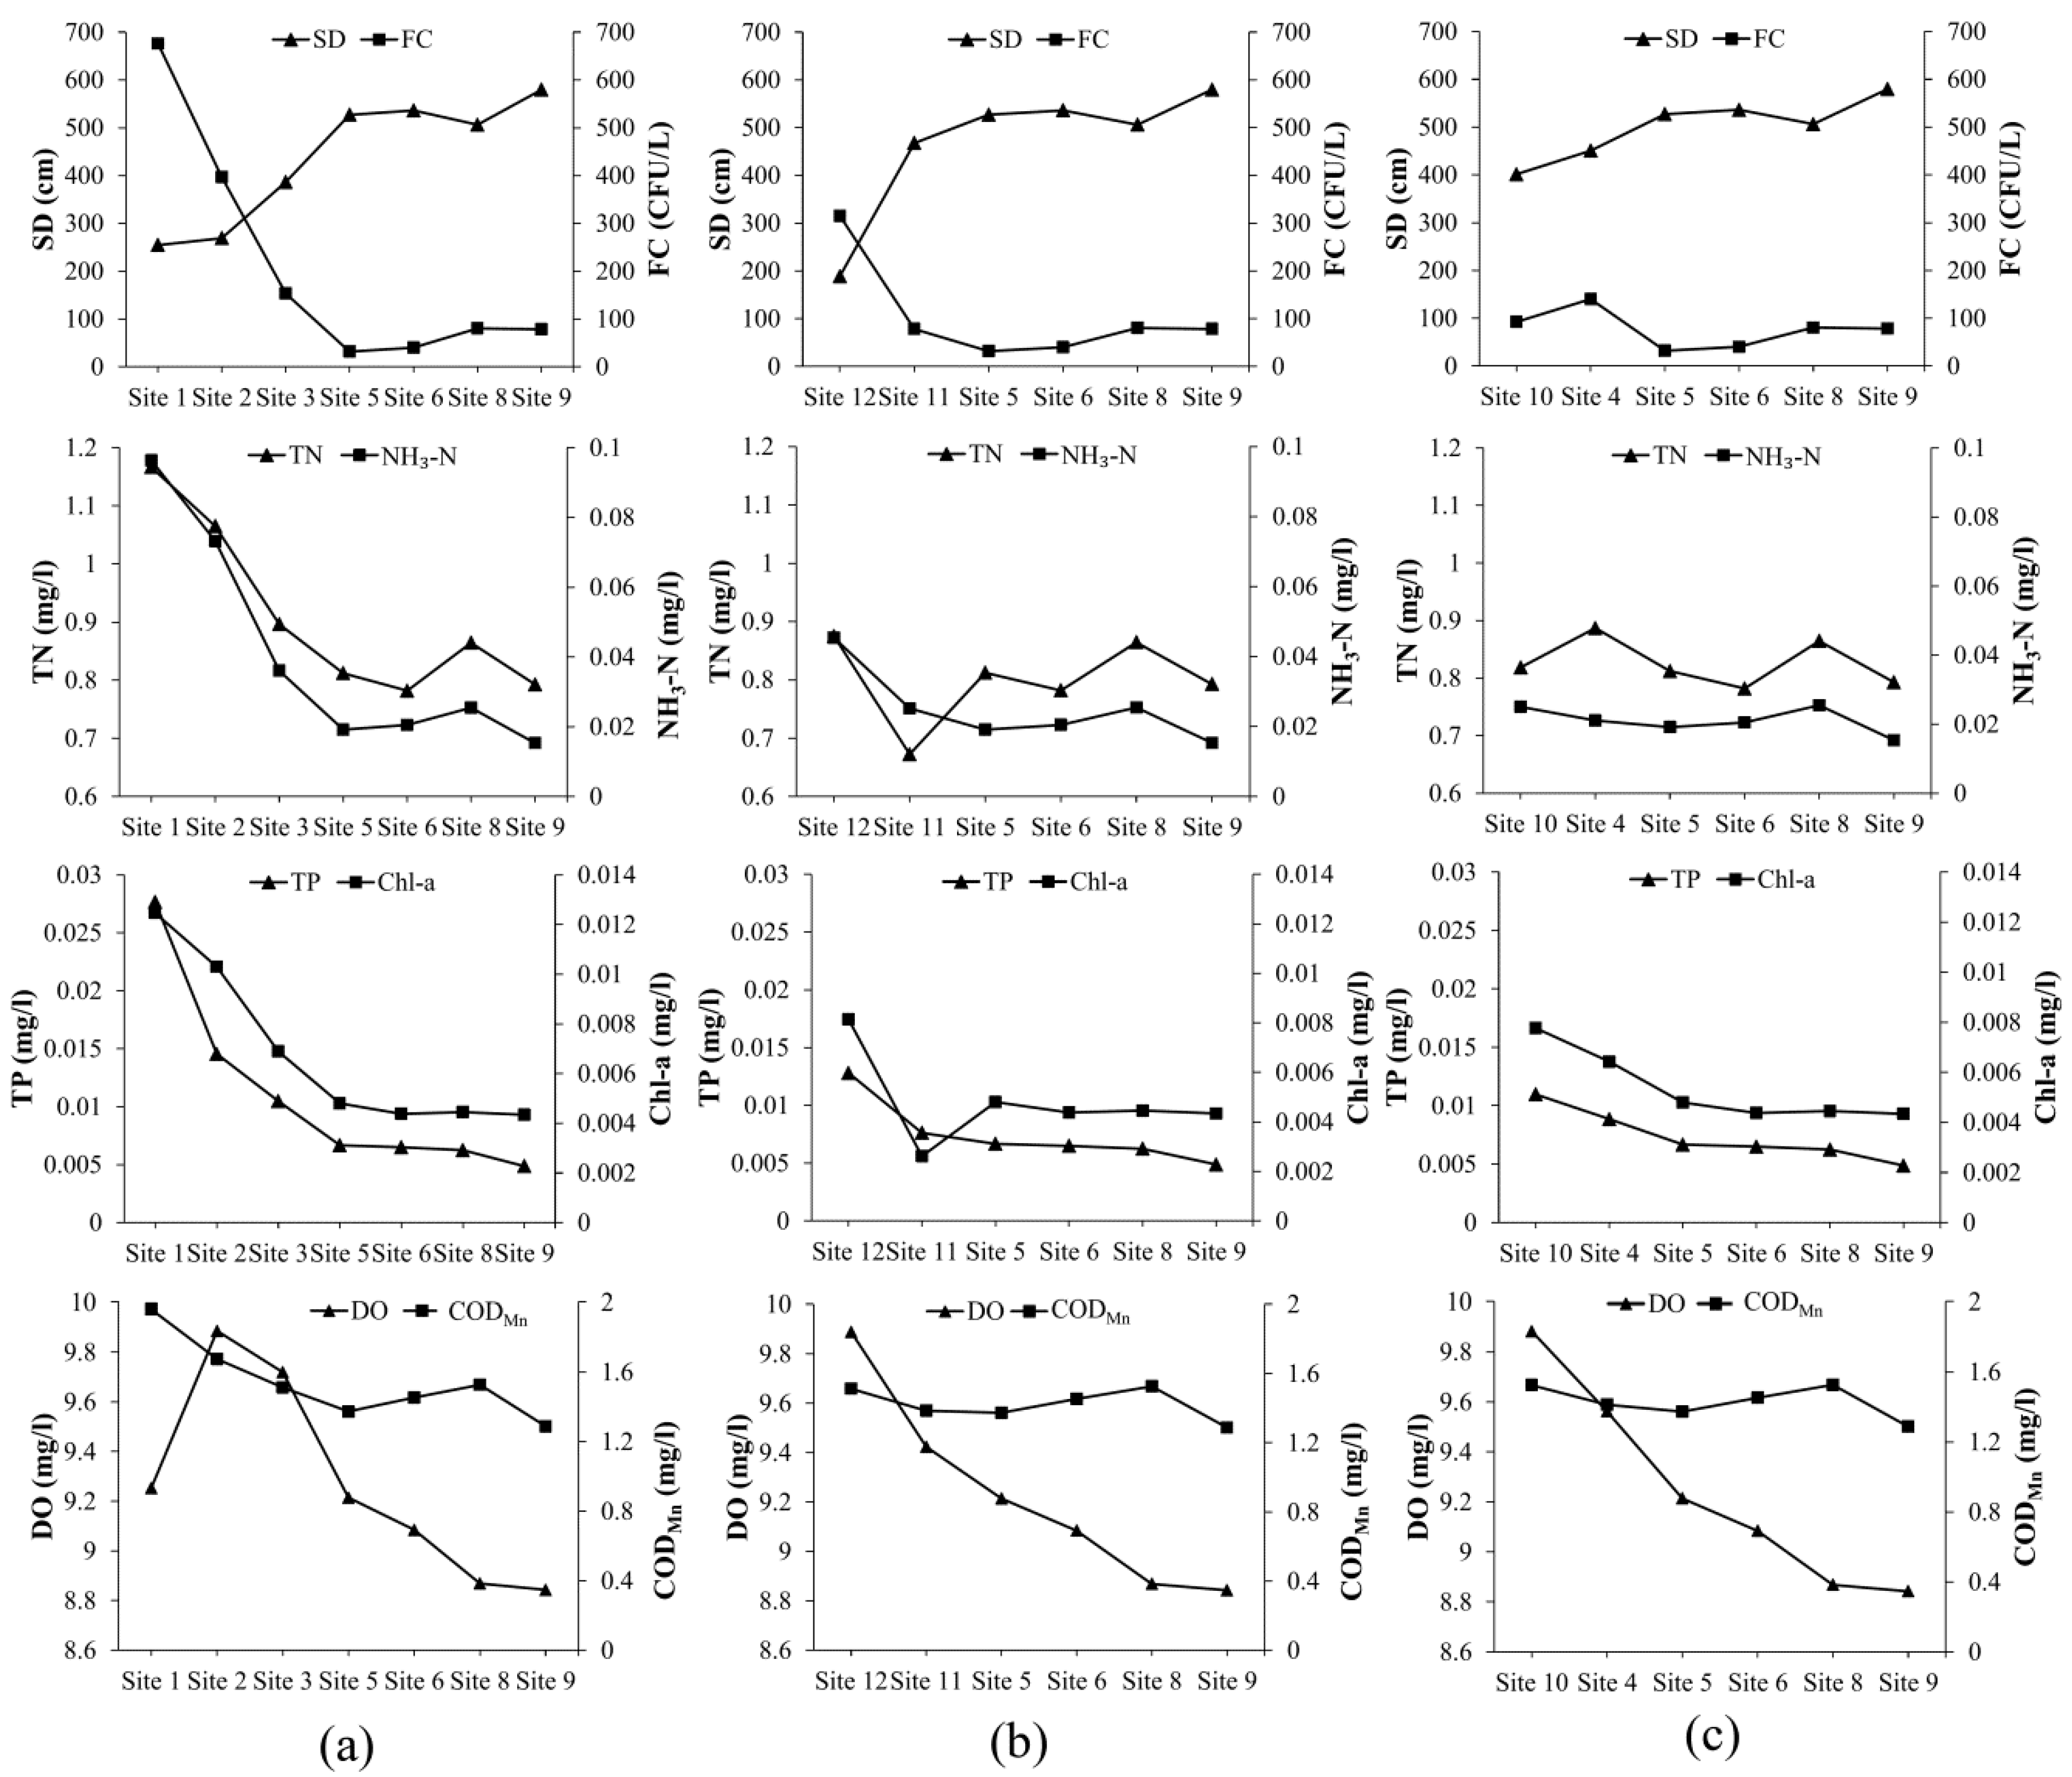
Pollutant transport from the river to the water reservoir is strongly controlled by hydrology. We roughly divided Qiandao Lake into three parts based on the water flow direction, which was indicated using three flow paths constituted by the sampling sites (Figure 8), to analyze the water quality variations within the lake. The three paths are the central path (site 1-site 2-site 3-site 5-site 6-site 8-site 9), the southwest path (site 12-site 11-site 5-site 6-site 8-site 9) and the northeast path (site 10-site 4-site 5-site 6-site 8-site 9). The potential pollutant sources of the drainage basin were also described in Figure 8. Figure 9 showed the trends of 4-year averages of the water quality parameters for the three paths.
The Xin’an Jiang River received substantial amounts of domestic sewage, agricultural pollution, and industrial wastewater discharge from the upstream contributing area. Therefore, the water quality of the inflow into Qiandao Lake was undesirable. Site 1 was nearest to the river inflow, and the 4-year averages of most of the parameters (CODMn, TN, TP, NH3-N, Chl-a, and FC) were the highest and the SD values were the lowest among all of the sampling sites. SD, TN, TP, CODMn, NH3-N, Chl-a and FC showed similar variation trends along the central path (Figure 9a), presenting an overall improvement of water quality from the inflow to the outflow, which suggested a strong capacity for self-purification in Qiandao Lake. Appreciably increased levels of CODMn, TN, NH3-N and FC, as well as a decreased level of SD, were observed at site 8 compared with the adjacent sites, indicating degraded water quality at this location. The explanation was that site 8 was an important passenger port with intensified anthropogenic activities. The variation along the southwest path was similar to that along the central path (Figure 9b), showing an overall improvement of water quality from site 12 to site 9. Three peaks can be found at sites 12, 5 and 8, reflecting the purification process of water quality within the lake. Site 12 is close to traditional agricultural regions where amounts of nutrients can be easily shifted from the surrounding arable lands into the lake. Site 5 is located at the intersection of waters from the central, southwest and northeast directions, resulting in increased TN concentrations at this site. Along the northeast path, we can see peak values of TP, NH3-N and Chl-a at site 10, and TN and FC at sites 4 and 8 (Figure 9c). Site 10 was close to villages and farmlands, and it was mainly impacted by agricultural runoff and domestic sewage. Site 4 received waters from the central and northeast directions and was close to the downtown where rapid urbanization and population growth had recently occurred, and thus it was strongly influenced by the pollutants brought by the central path and domestic sewage from the dense population. Site 7 was also near the downtown and was impacted by the intense human activities, leading to the relatively inferior water quality compared with sites 6 and 8. In addition, compared with the other parameters, a larger decline in TP concentration was found for each path, without an increase at site 8. There are two possible explanations. First, phosphorus was mainly transferred into water in a granular state, and its transmission distance is shorter than those of nitrogen and other pollutants in the reservoir. Second, phytoplankton absorbed more phosphorus than the other nutrients during the growth period [44].
In addition, we have also explored the water quality variation in different depths. Overall, the higher DO values were observed in surface water compared with the bottom and the medium waters. The relatively active photosynthetic oxygen production associated with phytoplankton growth in surface water may be responsible for the variation in depth [45]. As for the other parameters (CODMn, TN, TP, NH3-N, Chl-a, and FC), the deeper samplers showed decreased levels of concentrations, and this can be ascribed mainly to the fluxion of surface water and the dilution of pollutants with depth [46].

3.6. Implications for Water Resources Management

The comprehensive use of different multivariable methods in trend analysis for water quality and identification of pollution sources could offer effective support for government implementing reservoir water resources management. The results obtained from CA provide insights into the spatial and temporal trends in water quality, making it possible to carry out a sampling arrangement in a more rational way [32,37]. After detecting the similarity in water quality between different sampling sites and periods, the number of sites could be optimized by selecting representative sites from each group, and the sampling frequency could be reduced by selecting typical periods from each cluster. In this manner, the surveying efficiency would be increased and the cost would be lowered without losing any significance of the results. The identification of discriminating parameters between different sampling periods and sites by DA would help with enacting holistic regulations by taking into account the spatial and temporal variations. The spatial pattern of water quality may also help local governments to understand the pollution conditions in the area under administration and to take responsibility for conservation of the respective aquatic ecosystems. The PCA method can be used to detect the pollution sources in different regions, and it helps manages determine their priorities by emphasizing the regional distinction. Based on the information extracted from PCA, different policies can be established to treat the pollution sources in different areas.

4. Conclusions

The presented study comprehensively applied different multivariate methods to explore the dynamics of water quality and the factors impacting water quality in Qiandao Lake using a 4-year (2010–2013) data set. The results indicated that the integrated application of multivariate methods may serve as an operational analysis tool for reservoir water quality assessment and water resource management.
To represent different water quality characteristics, the 12 monitoring sites were divided through the CA method into three categories (Groups A, B and C), and the 12 months were divided into two groups (April-July, and the remaining months). According to the results from DA, the parameters SD, DO, CODMn and TP were the most significant (79.9% correct assignments), accounting for temporal variations in water quality between the study years, and pH, DO and Chl-a significantly discriminated between the two sampling periods classified through CA, with 87.8% correct assignments. For spatial variation, DA identified SD and NH3-N as the significant discriminating parameters, with 81.6% correct assignments. PCA yielded four PCs for Groups A and B and three PCs for Group C (groups were classified by spatial CA), explaining 84.58%, 81.61% and 78.68% of the total variance, respectively. Organic pollution, nutrient pollution, domestic wastewater, and agricultural and surface runoff were recognized as primary latent sources affecting the water quality of Qiandao Lake.

Acknowledgments

This work was supported by grants from Youth Training Project of Zhejiang Academy of Agricultural Sciences (No.2015R28R08E05) and Scientific Project of Ningbo Academy of Agricultural Sciences (No.2015NKYP002). We thank Samuel Yang, Hailei Zhan, Editor Yaqiong Guo and the two anonymous reviewers for their valuable comments and help in improving our manuscript.

Author Contributions

Qing Gu and Yao Zhang conceived the original outline for the study, and Xiaobin Zhang, Kefeng Zheng and Li Sheng designed the methodology. Qing Gu, Jiadan Li and Ligang Ma were responsible for the data processing and result analysis. Qing Gu wrote the manuscript. Ke Wang helped perform the analysis with constructive discussions. The authors read and approved the final manuscript.

Conflicts of Interest

The authors declare no conflict of interest.

References

  1. Gu, Q.; Deng, J.; Wang, K.; Lin, Y.; Li, J.; Gan, M.; Ma, L.; Hong, Y. Identification and assessment of potential water quality impact factors for drinking-water reservoirs. Int. J. Environ. Res. Public Health 2014, 11, 6069–6084. [Google Scholar] [CrossRef] [PubMed]
  2. Gu, Q.; Li, J.; Deng, J.; Lin, Y.; Ma, L.; Wu, C.; Wang, K.; Hong, Y. Eco-environmental vulnerability assessment for large drinking water resource: A case study of Qiandao Lake Area, China. Front. Earth Sci. 2015, 9, 578–589. [Google Scholar] [CrossRef]
  3. Su, S.; Zhi, J.; Lou, L.; Huang, F.; Chen, X.; Wu, J. Spatio-temporal patterns and source apportionment of pollution in Qiantang River (China) using neural-based modeling and multivariate statistical techniques. Phys. Chem. Earth 2011, 36, 379–386. [Google Scholar] [CrossRef]
  4. Ouyang, Y. Evaluation of river water quality monitoring stations by principal component analysis. Water Res. 2005, 39, 2621–2635. [Google Scholar] [CrossRef] [PubMed]
  5. Zhang, Y.; Guo, F.; Meng, W.; Wang, X.-Q. Water quality assessment and source identification of Daliao River basin using multivariate statistical methods. Environ. Monit. Assess. 2009, 152, 105–121. [Google Scholar] [CrossRef] [PubMed]
  6. Kazi, T.; Arain, M.; Jamali, M.; Jalbani, N.; Afridi, H.; Sarfraz, R.; Baig, J.; Shah, A.Q. Assessment of water quality of polluted lake using multivariate statistical techniques: A case study. Ecotoxicol. Environ. Saf. 2009, 72, 301–309. [Google Scholar] [CrossRef] [PubMed]
  7. Su, S.; Li, D.; Zhang, Q.; Xiao, R.; Huang, F.; Wu, J. Temporal trend and source apportionment of water pollution in different functional zones of Qiantang River, China. Water Res. 2011, 45, 1781–1795. [Google Scholar] [CrossRef] [PubMed]
  8. Li, G.; Yu, Z. Community structure of rotifera and ecological assessment of water quality in Qiandao Lake. J. Lake Sci. 2002, 15, 169–176. [Google Scholar]
  9. Mazzolani, F.M.; Landolfo, R.; Faggiano, B.; Esposto, M.; Perotti, F.; Barbella, G. Structural analyses of the submerged floating tunnel prototype in Qiandao Lake (PR of China). Adv. Struct. Eng. 2008, 11, 439–454. [Google Scholar] [CrossRef]
  10. Lu, H.; Wang, F.; Chen, Y.; Yu, Z.; Fang, Z.; Zhou, G. Multianalysis between chlorophyll-a and environmental factors in Qiandao Lake water. Chin. J. Appl. Ecol. 2003, 14, 1347–1350. [Google Scholar]
  11. Li, P.; Shi, W.; Liu, Q.; Yu, Y.; He, G.; Chen, L.; Ren, L.; Hong, R. Spatial and temporal distribution patterns of chlorophyll-a and the correlation analysis with environmental factors in Lake Qiandao. J. Lake Sci. 2011, 23, 568–574. [Google Scholar]
  12. Liu, H.; Yan, L. Back-propagation network model for predicting the change of eutrophication of Qiandao Lake. Bull. Sci. Technol. 2008. [Google Scholar] [CrossRef]
  13. Hector, R.A.; Manuel, C.C.; Quintana, R.M.; Ruben Alfonso, S.; Adan, P.M. An overall water quality index (WQI) for a man-made aquatic reservoir in Mexico. Int. J. Environ. Res. Public Health 2012, 9, 1687–1698. [Google Scholar]
  14. Meng, X.; Zhang, Y.; Yu, X.; Zhan, J.; Chai, Y.; Critto, A.; Li, Y.; Li, J. Analysis of the temporal and spatial distribution of lake and reservoir water quality in China and changes in its relationship with GDP from 2005 to 2010. Sustainability 2015, 7, 2000–2027. [Google Scholar] [CrossRef]
  15. Smeti, E.M.; Golfinopoulos, S.K. Characterization of the quality of a surface water resource by multivariate statistical analysis. Anal. Lett. 2015. [Google Scholar] [CrossRef]
  16. Duan, W.; He, B.; Nover, D.; Yang, G.; Chen, W.; Meng, H.; Zou, S.; Liu, C. Water Quality Assessment and Pollution Source Identification of the Eastern Poyang Lake basin Using Multivariate Statistical Methods. Sustainability 2016, 8. Article 133. [Google Scholar] [CrossRef]
  17. Daliakopoulos, I.N.; Coulibaly, P.; Tsanis, I.K. Groundwater level forecasting using artificial neural networks. J. Hydrol. 2005, 309, 229–240. [Google Scholar] [CrossRef]
  18. Batt, H.; Stevens, D. Can suspended fine-sediment transport in Shallow Lakes be predicted using MVRVM with limited observations? J. Environ. Eng. 2015. [Google Scholar] [CrossRef]
  19. Batt, H.; Stevens, D. How to utilize relevance vectors to collect required data for modeling water quality constituents and fine sediment in natural systems: Case study on Mud Lake, Idaho. J. Environ. Eng. 2014. [Google Scholar] [CrossRef]
  20. Batt, H.A.; Stevens, D.K. Relevance vector machine models of suspended fine sediment transport in a shallow lake—I: Data collection. Environ. Eng. Sci. 2013, 30, 681–688. [Google Scholar] [CrossRef]
  21. Shrestha, S.; Kazama, F. Assessment of surface water quality using multivariate statistical techniques: A case study of the Fuji River basin, Japan. Environ. Model. Softw. 2007, 22, 464–475. [Google Scholar] [CrossRef]
  22. Huang, F.; Wang, X.; Lou, L.; Zhou, Z.; Wu, J. Spatial variation and source apportionment of water pollution in Qiantang River (China) using statistical techniques. Water Res. 2010, 44, 1562–1572. [Google Scholar] [CrossRef] [PubMed]
  23. Tan, X.; Min, H. Analysis of eco-environmental problems and control countermeasure in Qiandao Lake. Environ. Pollut. Control 2004, 26, 200–203. [Google Scholar]
  24. Huang, X.; Chen, W.; Cai, Q. Survey, observation and analysis of lake ecology. In Standard Methods for Observation and Analysis in Chinese Ecosystem Research Network; Series V; Standards Press of China: Beijing, China, 1999. (In Chinese) [Google Scholar]
  25. Varol, M.; Gökot, B.; Bekleyen, A.; Şen, B. Spatial and temporal variations in surface water quality of the dam reservoirs in the Tigris River basin, Turkey. Catena 2012, 92, 11–21. [Google Scholar] [CrossRef]
  26. Yu, H.; Xi, B.; Jiang, J.; Heaphy, M.J.; Wang, H.; Li, D. Environmental heterogeneity analysis, assessment of trophic state and source identification in Chaohu Lake, China. Environ. Sci. Pollut. Res. 2011, 18, 1333–1342. [Google Scholar] [CrossRef] [PubMed]
  27. Wang, Y.; Wang, P.; Bai, Y.; Tian, Z.; Li, J.; Shao, X.; Mustavich, L.F.; Li, B.-L. Assessment of surface water quality via multivariate statistical techniques: A case study of the Songhua River Harbin region, China. J. Hydro-Environ. Res. 2013, 7, 30–40. [Google Scholar] [CrossRef]
  28. Hastie, T.; Tibshirani, R.; Friedman, J.; Hastie, T.; Friedman, J.; Tibshirani, R. The Elements of Statistical Learning; Springer: Berlin, Germany, 2009; Volume 2. [Google Scholar]
  29. Kotti, M.E.; Vlessidis, A.G.; Thanasoulias, N.C.; Evmiridis, N.P. Assessment of river water quality in northwestern Greece. Water Resour. Manag. 2005, 19, 77–94. [Google Scholar] [CrossRef]
  30. Wang, Q.; Wu, X.; Zhao, B.; Qin, J.; Peng, T. Combined multivariate statistical techniques, Water Pollution Index (WPI) and daniel trend test methods to evaluate temporal and spatial variations and trends of water quality at Shanchong River in the Northwest Basin of Lake Fuxian, China. PLoS ONE 2015, 10, e0118590. [Google Scholar] [CrossRef] [PubMed]
  31. Zhou, F.; Huang, G.H.; Guo, H.; Zhang, W.; Hao, Z. Spatio-temporal patterns and source apportionment of coastal water pollution in eastern Hong Kong. Water Res. 2007, 41, 3429–3439. [Google Scholar] [CrossRef] [PubMed]
  32. Simeonov, V.; Stratis, J.A.; Samara, C.; Zachariadis, G.; Voutsa, D.; Anthemidis, A.; Sofoniou, M.; Kouimtzis, T. Assessment of the surface water quality in northern Greece. Water Res. 2003, 37, 4119–4124. [Google Scholar] [CrossRef]
  33. Helena, B.; Pardo, R.; Vega, M.; Barrado, E.; Fernandez, J.M.; Fernandez, L. Temporal evolution of groundwater composition in an alluvial aquifer (Pisuerga River, Spain) by principal component analysis. Water Res. 2000, 34, 807–816. [Google Scholar] [CrossRef]
  34. Huang, J.; Huang, Y.; Zhang, Z. Coupled effects of natural and anthropogenic controls on seasonal and spatial variations of river water quality during baseflow in a coastal watershed of Southeast China. PLoS ONE 2014. [Google Scholar] [CrossRef] [PubMed]
  35. Zhou, F.; Guo, H.; Liu, Y.; Jiang, Y. Chemometrics data analysis of marine water quality and source identification in southern Hong Kong. Mar. Pollut. Bull. 2007, 54, 745–756. [Google Scholar] [CrossRef] [PubMed]
  36. Environmental Protection Bureau (EPB). Environmental Quality Standards for Surface Water; GB 3838–2002; EPB: Beijing, China, 2002. [Google Scholar]
  37. Varol, M.; Gökot, B.; Bekleyen, A.; Şen, B. Water quality assessment and apportionment of pollution sources of Tigris River (Turkey) using multivariate statistical techniques—A case study. River Res. Appl. 2012, 28, 1428–1438. [Google Scholar] [CrossRef]
  38. Qin, B.; Zhu, G.; Gao, G.; Zhang, Y.; Li, W.; Paerl, H.W.; Carmichael, W.W. A drinking water crisis in Lake Taihu, China: Linkage to climatic variability and lake management. Environ. Manag. 2010, 45, 105–112. [Google Scholar] [CrossRef] [PubMed]
  39. Liu, C.; Lin, K.; Kuo, Y. Application of factor analysis in the assessment of groundwater quality in a blackfoot disease area in Taiwan. Sci. Total Environ. 2003, 313, 77–89. [Google Scholar] [CrossRef]
  40. Çamdevýren, H.; Demýr, N.; Kanik, A.; Keskýn, S. Use of principal component scores in multiple linear regression models for prediction of chlorophyll-a in reservoirs. Ecol. Model. 2005, 181, 581–589. [Google Scholar] [CrossRef]
  41. Boyacioglu, H.; Boyacioglu, H. Water pollution sources assessment by multivariate statistical methods in the Tahtali Basin, Turkey. Environ. Geol. 2008, 54, 275–282. [Google Scholar] [CrossRef]
  42. Zhou, F.; Liu, Y.; Guo, H. Application of multivariate statistical methods to water quality assessment of the watercourses in Northwestern New Territories, Hong Kong. Environ. Monit. Assess. 2007, 132, 1–13. [Google Scholar] [CrossRef] [PubMed]
  43. Singh, K.P.; Malik, A.; Singh, V.K.; Mohan, D.; Sinha, S. Chemometric analysis of groundwater quality data of alluvial aquifer of Gangetic plain, North India. Anal. Chim. Acta 2005, 550, 82–91. [Google Scholar] [CrossRef]
  44. Wen, J. Study on Ecological Risk Assessment in Qiandao Lake Area. Ph.D. Thesis, Central South University of Forestry and Technology, Changsha, China, 2004. [Google Scholar]
  45. Xu, H.; Paerl, H.W.; Qin, B.; Zhu, G.; Gao, G. Nitrogen and phosphorus inputs control phytoplankton growth in eutrophic Lake Taihu, China. Limnol. Oceanogr. 2010, 55, 420–432. [Google Scholar] [CrossRef]
  46. Hansen, E.A.; Harris, A.R. Validity of soil-water samples collected with porous ceramic cups. Soil Sci. Soc. Am. J. 1975, 39, 528–536. [Google Scholar] [CrossRef]
Figure 1. Location of the Qiandao Lake and sampling sites and spatial pattern of the three classified groups derived by CA.
Sustainability 08 00243 g001
Figure 2. The result of cluster analysis performed on the sampling sites.
Sustainability 08 00243 g002
Figure 3. The result of cluster analysis performed on the sampling months.
Sustainability 08 00243 g003
Figure 4. Temporal variations of discriminant parameters identified by DA in Qiandao Lake between 2010 and 2013. (a) SD; (b) DO; (c) CODMn; (d) TP.
Sustainability 08 00243 g004
Figure 5. Temporal variations of discriminant parameters identified by DA in Qiandao Lake between sampling periods. (a) pH; (b) DO; (c) Chl-a.
Sustainability 08 00243 g005
Figure 6. Spatial variations of discriminant parameters identified by DA in Qiandao Lake between sampling sites. (a) SD; (b) NH3-N.
Sustainability 08 00243 g006
Figure 7. Scores of sampling sites for the first two principal components produced by PCA.
Sustainability 08 00243 g007
Figure 8. Locations of the three water flow paths constituted by the sampling sites and the potential pollutant sources.
Sustainability 08 00243 g008
Figure 9. Trends of 4-year averages of the water quality parameters for the three paths. (a) Central path; (b) Southwest path; (c) Northeast path.
Sustainability 08 00243 g009
Table 1. Water quality parameters and the corresponding measurement methods.
ParametersAbbreviationsUnitsMeasurement Methods
pHpHpH unitGlass electrode method
Secchi disc depthSDcmManual
Dissolved oxygenDOmg/LElectrochemical probe method
Total phosphorusTPmg/LSpectrophotometric method
Total nitrogenTNmg/LUltraviolet spectrophotometric method
Permanganate indexCODMnmg/LAcidic potassium permanganate method
Ammonia nitrogenNH3-Nmg/LSpectrophotometric method with salicylic acid
Chlorophyll-aChl-amg/LSpectrophotometry method
Fecal coliformFCCFU/LMembrane filter method
Table 2. The statistical characteristics for the water quality parameters and the quality standards for surface water (GB 3838-2002) (units: mg/L).
ParametersMin.Max.MeanS.D. Environmental Guides
IIIIIIIVV
pH7.328.117.740.12 6~9
DO8.1711.339.420.767.56532
CODMn1.092.091.520.242461015
TN0.491.310.860.160.20.511.52
TP0.0050.0430.0110.0070.010.0250.050.10.2
NH3-N0.0120.1130.0370.0260.150.511.52
FC (CFU/L)104132275632200200010,00020,00040,000
Chl-a0.00200.01860.00620.0034
SD148677427136
Table 3. Results of temporal DA performed in the four years during 2010–2013.
ModelsDFWilks’lambdaChi-Squarep-Level
Standard10.054118.30.000
20.36540.80.000
30.72213.20.00
Forward10.091101.80.000
20.54925.40.00
30.9326.20.00
Backward10.11194.30.000
20.55525.40.000
30.9435.70.00
Table 4. Classification functions coefficients from temporal DA performed in the four years during 2010–2013.
ParametersStandard ModelForward Stepwise ModeBackward Stepwise Mode
201020112012201320102011201220132010201120122013
pH1122.681131.161135.011143.28
SD0.890.880.890.930.290.290.290.320.290.290.290.32
DO129.76130.80128.66145.5595.7396.1093.44108.8389.7290.0987.79101.41
CODMn119.70135.63134.52111.8718.3133.3529.249.6944.0159.0353.4241.42
TN−8217.64−8821.62−8606.28−8595.3278.2778.2173.6496.66
TP3063.823134.713147.813274.32811.90350.21613.02850.171358.81896.741127.611525.63
NH3-N533.01535.17534.95560.43
Chl-a−6660.64−6757.03−7157.36−7379.22
FC0.000.000.000.00
Constant−5387.62−5486.12−5493.76−5732.25−548.89−569.47−537.19−693.54−510.50−531.13−503.21−634.99
Table 5. Results of temporal DA performed on the two groups of sampling periods.
ModelsWilks’lambdaChi-squarep-level
Standard0.38161.30.000
Forward0.38462.70.000
Backward0.45452.50.000
Table 6. Classification functions coefficients from temporal DA performed on the two groups of sampling periods.
ParametersStandard ModelForward Stepwise ModeBackward Stepwise Mode
Group AGroup BGroup AGroup BGroup AGroup B
pH126.15134.11110.73118.61107.65113.93
SD0.030.03−0.01−0.02
DO5.763.63−0.03−2.160.47−1.36
CODMn43.1442.87
TN−26.89−29.73−7.27−9.88
TP−593.26−602.74
NH3-N239.25240.60
Chl-a−594.68−437.73−444.08−295.58−432.94−263.58
FC0.010.01
Constant−535.49−569.65−414.53−448.39−411.92−442.29
Table 7. Results of spatial DA performed on the three groups of sampling sites.
ModelsDFWilks’lambdaChi-squarep-level
Standard10.080103.80.000
20.52626.40.00
Forward10.086104.20.000
20.56124.50.000
Backward10.14785.50.000
20.66018.50.000
Table 8. Classification functions coefficients from spatial DA performed on the three groups of sampling sites.
ParametersStandard ModeForward Stepwise ModeBackward Stepwise Mode
Group AGroup BGroup CGroup AGroup BGroup CGroup AGroup BGroup C
pH901.29902.14896.46
SD0.450.430.420.130.110.100.090.070.07
DO0.481.62−1.6631.0532.0528.74
CODMn135.13139.32132.7383.4786.3280.25
TN242.34242.16275.301.552.0934.96
TP−3056.61−2978.11−3127.22
NH3-N293.07277.92653.423.186.04348.20350.11365.92697.39
Chl-a1545.771396.762270.16−2285.39−2459.52−1518.53
FC0.010.000.00
Constant−3788.48−3800.01−3770.61−232.44−234.52−251.41−31.08−20.46−40.76
Table 9. Loadings of selected parameters on significant principal components for the three sites groups.
ParametersGroup AGroup BGroup C
VF1VF2VF3VF4VF1VF2VF3VF4VF1VF2VF3
pH−0.0240.2060.3820.8340.338−0.032−0.419−0.8450.4530.4130.278
SD−0.456−0.8040.1150.048−0.763−0.3550.2770.042−0.4980.572−0.208
DO−0.1460.8680.3450.2100.2460.4410.557−0.469−0.1650.0540.928
CODMn0.864−0.2580.2050.102−0.2490.373−0.7530.4420.6130.263−0.510
TN−0.3650.0970.594−0.247−0.5090.4310.3740.1620.9160.1060.330
TP0.287−0.1650.3350.4510.720−0.1250.2370.3670.9230.1890.053
NH3-N0.7180.1430.4370.2170.7930.216−0.1800.2090.851−0.285−0.086
Chl-a0.7710.381−0.040−0.0090.3160.8650.0810.125−0.2030.865−0.043
FC0.0670.0490.780−0.4160.624−0.4260.2940.381−0.0320.788−0.001
Eigenvalue2.652.201.581.182.742.041.371.203.452.271.36
% Total variance29.4324.5017.5413.1130.4622.6515.2013.3138.2825.2515.15
Cumulative %29.4353.9371.4784.5830.4653.1168.3181.6138.2863.5378.68