1. Introduction
Urban growth tends to occur in the major urban regions of developed and developing countries. In the latter, countries are consolidated as massive agglomerations of more than 20 million people, particularly in Asia, Latin America, and Africa [
1]. The global urban population has grown precipitously from 746 million in 1950 to 3.9 billion in 2014, a figure that is projected to increase to 2.5 billion people by 2050. Approximately 50% of the world’s urban dwellers live in smaller settlements of less than 500,000 inhabitants, whereas approximately 80% reside in one of 28 megacities containing over 10 million people [
2].
Cities are recognized as important generators of development, growth, innovation, and poverty reduction mainly because of the concentration of national economic activity, commerce, public service provision, and transportation. Key links between cities and rural areas also improve the infrastructure of countries [
1,
2,
3]. Moreover, cities are related to higher levels of learning and education, better health, easier access to social services, and enhanced opportunities for cultural and political participation. However, cities have negative aspects, such as vehicular congestion, higher levels of pollution, and higher demand for resources, that drive unsustainable production and consumption patterns [
4,
5,
6]. These patterns suggest an unsustainable model of cities, which implies the need to rethink the means of urban planning and growth to improve overall performance and urban efficiency to produce more competitive, equitable, and sustainable urban areas.
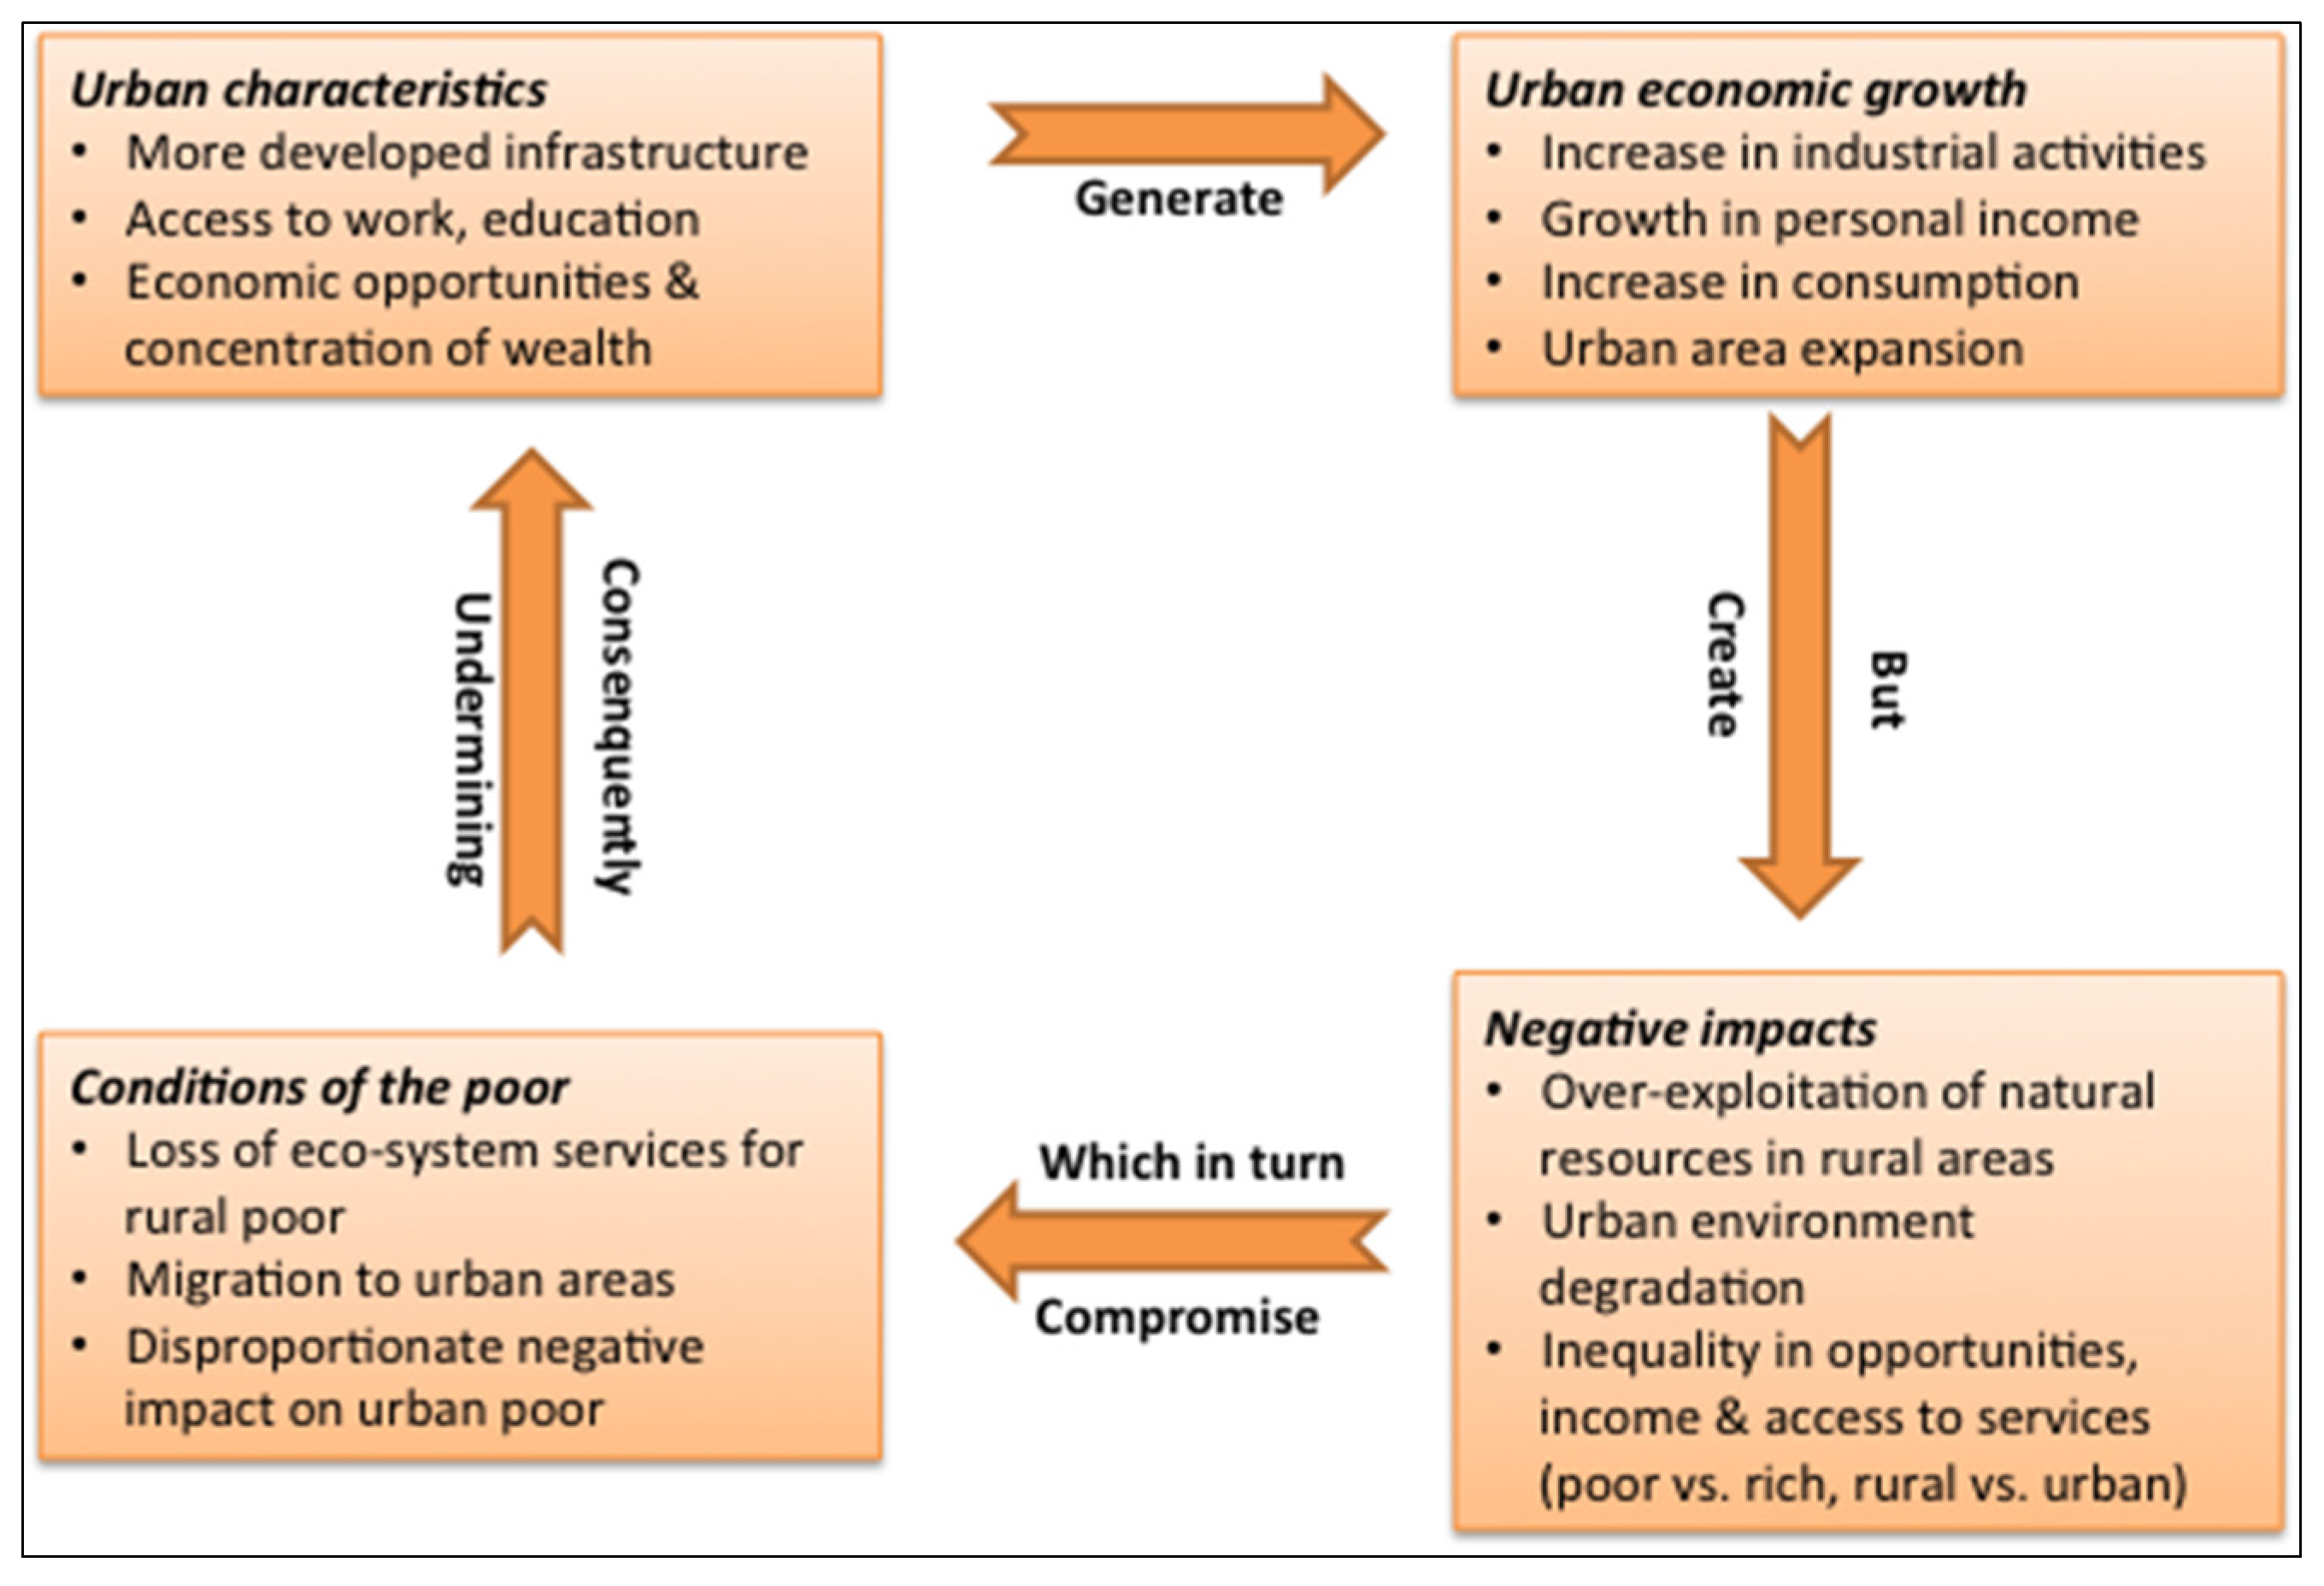
Figure 1 shows the urbanization cycle and its environmental impacts [
7].
Figure 1.
The urbanization cycle and environmental impacts.
Figure 1.
The urbanization cycle and environmental impacts.
The concept of urban efficiency derives from different theories and concepts developed in the 20th century, such as the notion of sustainable cities. A sustainable city is defined by the combination of economic development, social development, and environmental protection that includes all human rights and fundamental freedoms, including the right to development and the right to work, so that all its citizens are able to meet their needs without compromising the wellbeing of the natural world or the living conditions of other people, currently or in the future [
8,
9]. Green architecture seeks to reduce the negative environmental impact of buildings, urban designs and settlements through efficiency and moderation in the use of materials, energy, and development space; this concept includes systemic reforms in architectural and urban design, land use planning, transportation, agriculture, and energy production [
10]. A compact city’s objective is a high-density, mixed-use, and intensified urban form that emphasizes that activities should be located closer together to ensure better access to services and facilities via public transport, walking and cycling and that utility and infrastructure provision should be more efficient [
11]. In addition, an eco-city is a human settlement modelled on the self-sustaining, resilient structure and function of natural ecosystems that minimizes waste and pollution, maximizes energy efficiency in buildings and transportation, utilizes renewable energy and resources as much as possible, provides high-quality public spaces for citizens, and conserves valued features of the local ecology and landscape [
12,
13]. These concepts and theories demonstrate the importance of measuring urban efficiency to ensure progress and improve sustainability.
In cities, efficiency has been studied for in following areas. (i) Specific sectors: [
14] studied various tools to stimulate and improve the urban efficiency of small and medium enterprises (SMEs) in Venezuela using qualitative methods, such as stakeholder analysis and policy Delphi, finding that the main barriers to efficiency in SMEs are a lack of buyers and end user sensitivity. In addition, these methods indicated that the best mix of public administration tools include command and control, responsible consumption, ecoefficient products, and environmental responsibility education/training. In European SMEs, the main barriers to efficiency are a lack of infrastructure and technology, and the main stimuli are legislation and customer requirements [
15]; (ii) Urban metabolism: Sustainable operation suggests mutualism and symbiosis between socioeconomic development and ecological environment protection. Studies have shown that urban features such as form and compactness ratios are key to urban efficiency and resource efficiency, whereas high population density increases pollution costs and decreases environmental efficiency [
16,
17]; (iii) Data envelopment analysis (DEA): [
18] examined the environmental protection mechanisms and economic development of 211 cities in China from an environmental efficiency perspective and found that local governments should develop appropriate policies to maximize the use of technology and develop management practices that enhance both growth and protection. In addition, [
19] evaluated the urban environmental sustainability of Chinese cities, determining that environmental sustainability requires resource, environmental, and economic balance. These studies demonstrate the importance of analyzing efficiency in cities as a strategy for formulating adequate policies that promote sustainable development.
Moreover, methods of measuring efficiency can be divided into three types: (i) The single-ratio model of economic output/environmental impact. This model has been accepted and aggregates different environmental impacts into one score using life cycle analysis. The single-ratio model is easy to understand and communicate and is mainly used to analyze the efficiency of products and technologies [
20,
21]; (ii) Substitution of the numerator with other composite indicators, such as energy indicators [
22], ecological footprint indicators [
23], and material flow analysis indicators [
24]. This method can be used to evaluate the environmental performance of the system; (iii) Models for assessing efficiency, such as the Range Adjusted Measure (RAM) model. These models explain desirable and undesirable outputs in the production process [
25] and positive matrix factorization [
26]. In recent years, various studies have used DEA to calculate efficiency using different models with multiple inputs and outputs [
27,
28,
29].
Against this background, this research seeks to estimate and evaluate the urban efficiency of a developing country, Colombia, using DEA to determine the change over the 2005–2013 period and to evaluate the relationship between inputs and outputs across different models. The main contributions of this study are in identifying the main factors that increase urban sustainability in Colombian cities and in considering the different inputs and desirable and undesirable outputs from a quantitative perspective, which allows us to identify both sources and levels of inefficiency and to determine how cities can improve sustainability and development. Thus, this study provides more accurate measurements of sustainable efficiency in various Colombian cities and contributes to the literature on efficiency and development measurement, as the integration of efficiency and development performance is very new. This study also contributes to the limited empirical evidence on the relation between sustainable development and efficiency.
It is expected that the findings of this study will aid researchers and policymakers. For researchers, this study provides interesting insights into the current literature on the joint assessment of environmental and development elements to measure efficiency in urban contexts. This study also provides policymakers with useful information with which to design more effective environmental protection policies in cities such that development is balanced with sustainable performance.
This paper is organized into four sections.
Section 2 explains the conceptual model. The results and discussion are delineated in
Section 3. The final section discusses the conclusions and provides avenues for future work based on this research.
3. Results and Discussion
In this section, we present the results of the DEA analysis for the selected cities in Colombia. The analysis framework is based on the above-mentioned models and formulas. First, the cities are divided into cities of larger size and higher production and cities of medium size and production levels. The proposed DEA models are then used to determine the trends in and differences among the selected cities. Finally, the models’ results are compared to determine the cause-effect relations.
3.1. Division of Cities
To ensure homogeneity among the Colombian cities selected for this study, the cities are grouped by size and production level using cluster analysis to reflect the city’s overall characteristics. In this study, the eleven sample cities were divided into two groups whose major characteristics are listed in
Table 2.
Table 2.
Division of cities.
Table 2.
Division of cities.
| Groups | Composition and characteristics | Cities |
|---|
| Large, high-production cities | These are major cities in Colombia. These cities are characterized by a strong economic base and urban services, and they have relatively advanced technologies and convenient transportation. Their economic activity is strong. | Five cities: Barranquilla, Bogotá, Bucaramanga, Cali, Medellín |
| Medium-sized, mid-level production cities | These are intermediate cities in Colombia.These cities are small or medium sized, with improvements in economic and technical conditions. Their competitiveness needs to be improved overall, and their transportation and urban infrastructure is insufficient. | Six cities: Cartagena, Ibague, Manizales, Pasto, Pereira, Villavicencio |
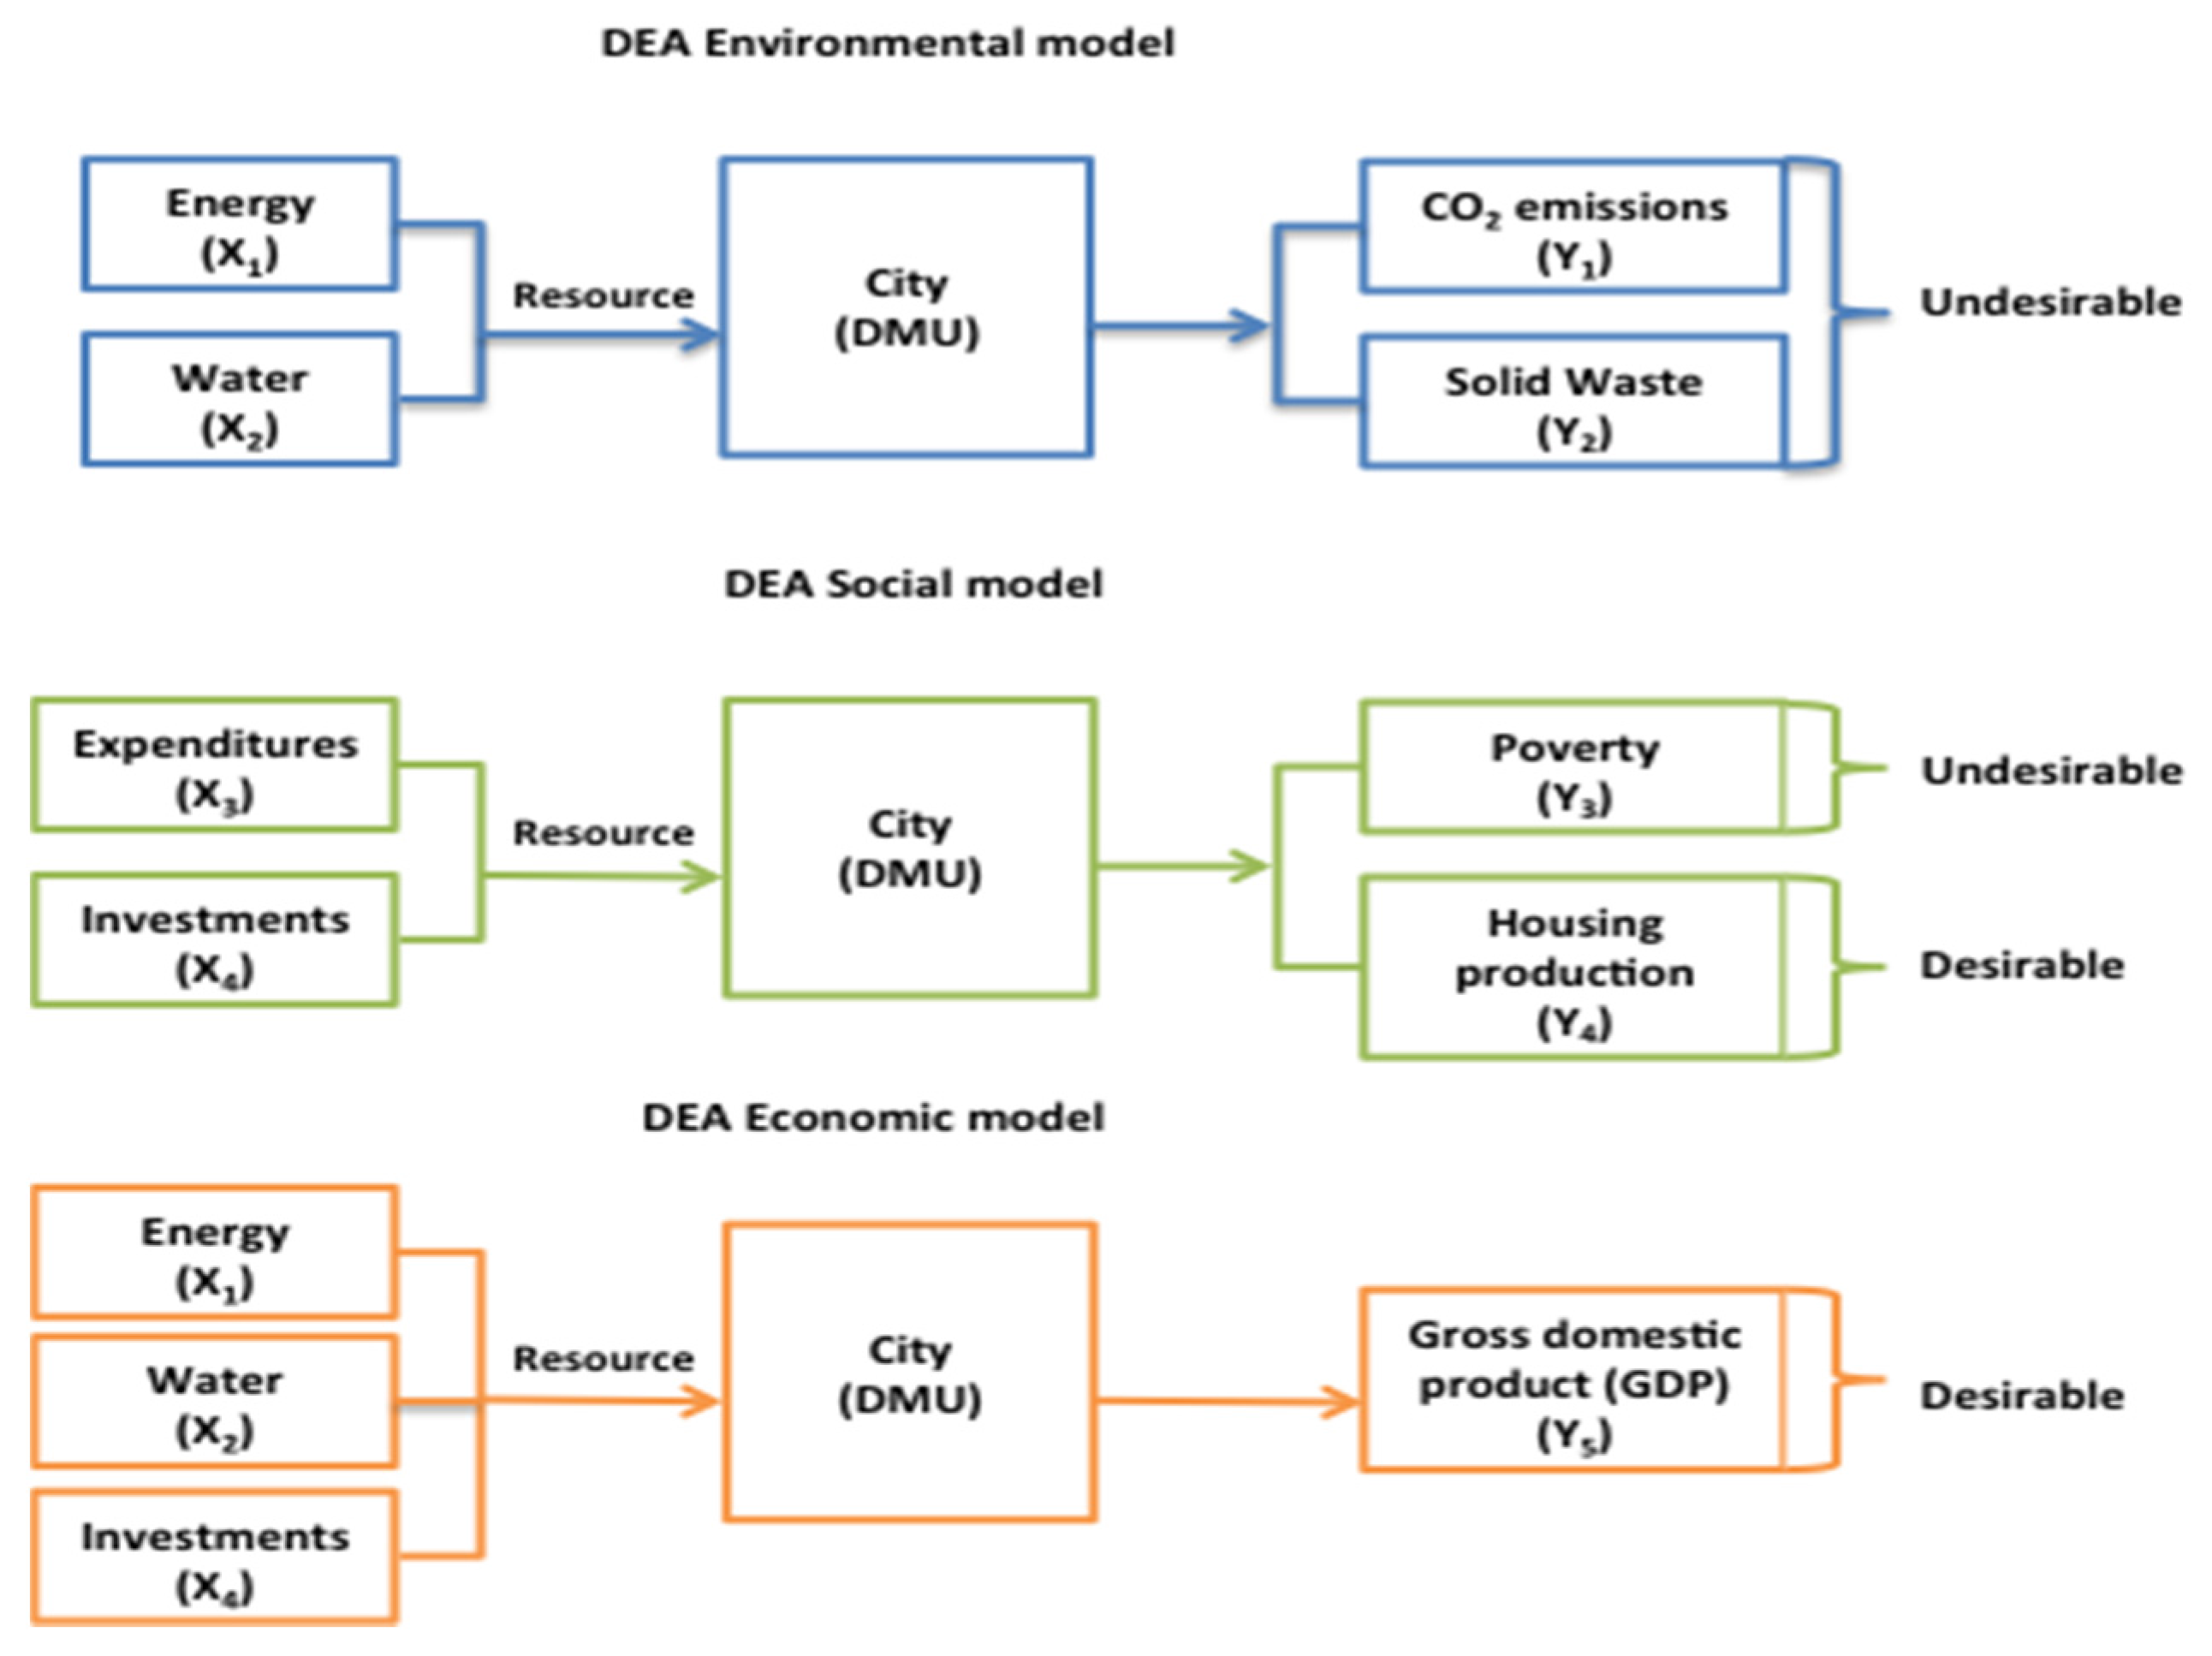
3.2. DEA Environmental Model
Table 3 and
Table 4 show the results of the DEA environmental model for Colombian cities. Among the large, high-production cities, Bucaramanga, Medellin, and Cali are characterized by higher efficiency, whereas among the medium-sized cities, Pasto, Villavicencio, and Pereira exhibit higher efficiency under the CRS assumption (TE). These cities are more efficient in terms of the relation between resource use (energy and water) and lower pollution (CO
2 emissions and solid waste) and are therefore more environmentally sustainable. Policies, management, and other conditions in these cities allow efficient resource use, better resource consumption and reduce environmental impacts. According to the [
43], in recent years, less material input has been required to produce one unit of real GDP, indicating that economic output is maintained while reducing negative environmental effects.
For VRS (PTE), the same cities are considered efficient in both groups, but when city scale increases, urban environmental sustainability decreases, as in the case of Bogotá, which is recognized as a megacity. In terms of SE, the inefficient cities (Barranquilla, Bogotá, Cartagena, and Ibague) present decreasing returns to scale, suggesting that urban environmental sustainability declines as the scale of these cities increases. This result occurs particularly through uncontrolled increases in population, resource use and production caused mainly by uncontrolled immigration resulting from violence or from people seeking better opportunities. This behavior generates an uncontrolled urbanization process. [
44] have demonstrated that rapid urban expansion and population growth require more resources that in turn generate more consumption and production. Hence, increasing production and consumption in cities produce different environmental problems, such as air, water, and land pollution, as well as ecosystem degradation, which is consistent with the results related to city scale because a larger city creates greater environmental problems. Moreover, the results for cities should demonstrate that the intensity effect can be studied as a resource efficiency effect of the production chain in which resource efficiency is the inverse of pressure intensity [
45].
Table 3.
Results of the DEA environmental model for large, high-production cities.
Table 3.
Results of the DEA environmental model for large, high-production cities.
| Cities | Technical Efficiency |
| 2005 | 2006 | 2007 | 2008 | 2009 | 2010 | 2011 | 2012 | 2013 | Mean |
| Barranquilla | 0.604 | 0.661 | 0.714 | 0.774 | 0.792 | 0.820 | 0.871 | 0.833 | 1 | 0.785 |
| Bogotá | 0.616 | 0.649 | 0.659 | 0.681 | 0.703 | 0.716 | 0.746 | 0.751 | 0.748 | 0.697 |
| Bucaramanga | 0.958 | 1 | 0.958 | 1 | 0.968 | 0.995 | 1 | 1 | 1 | 0.987 |
| Cali | 0.704 | 0.714 | 0.757 | 1 | 0.797 | 0.813 | 0.840 | 0.862 | 0.831 | 0.813 |
| Medellin | 0.769 | 0.821 | 0.806 | 0.892 | 0.861 | 0.838 | 0.874 | 0.881 | 0.852 | 0.844 |
| Cities | Pure Technical Efficiency |
| 2005 | 2006 | 2007 | 2008 | 2009 | 2010 | 2011 | 2012 | 2013 | Mean |
| Barranquilla | 0.623 | 0.688 | 0.742 | 0.811 | 0.809 | 0.878 | 0.881 | 0.858 | 1 | 0.810 |
| Bogotá | 0.649 | 0.671 | 0.673 | 0.760 | 0.743 | 0.766 | 0.775 | 0.782 | 0.790 | 0.734 |
| Bucaramanga | 1 | 1 | 0.973 | 1 | 0.977 | 1 | 1 | 1 | 1 | 0.994 |
| Cali | 0.724 | 0.728 | 0.765 | 1 | 0.821 | 0.823 | 0.853 | 0.884 | 0.848 | 0.827 |
| Medellin | 1 | 0.842 | 0.824 | 0.913 | 0.876 | 0.883 | 0.891 | 0.896 | 0.872 | 0.889 |
| Cities | Scale Efficiency |
| 2005 | 2006 | 2007 | 2008 | 2009 | 2010 | 2011 | 2012 | 2013 | Mean |
| Barranquilla | 0.970 | 0.961 | 0.962 | 0.954 | 0.979 | 0.934 | 0.989 | 0.971 | 1 | 0.969 |
| Bogotá | 0.949 | 0.967 | 0.979 | 0.896 | 0.946 | 0.935 | 0.963 | 0.960 | 0.947 | 0.949 |
| Bucaramanga | 0.958 | 1 | 0.985 | 1 | 0.991 | 0.995 | 1 | 1 | 1 | 0.992 |
| Cali | 0.972 | 0.981 | 0.990 | 1 | 0.971 | 0.988 | 0.985 | 0.975 | 0.980 | 0.982 |
| Medellin | 0.769 | 0.975 | 0.978 | 0.977 | 0.983 | 0.949 | 0.981 | 0.983 | 0.977 | 0.952 |
Table 4.
Results of the DEA environmental model for cities of medium size and production levels.
Table 4.
Results of the DEA environmental model for cities of medium size and production levels.
| Cities | Technical Efficiency |
| 2005 | 2006 | 2007 | 2008 | 2009 | 2010 | 2011 | 2012 | 2013 | Mean |
| Cartagena | 0.610 | 0.618 | 0.621 | 0.622 | 0.624 | 0.826 | 0.689 | 0.713 | 0.677 | 0.667 |
| Ibague | 0.652 | 0.653 | 0.691 | 0.747 | 0.751 | 0.836 | 0.695 | 0.849 | 0.919 | 0.765 |
| Manizales | 0.807 | 0.807 | 0.763 | 0.768 | 0.631 | 0.716 | 0.838 | 0.758 | 0.722 | 0.757 |
| Pasto | 1 | 0.955 | 1 | 0.979 | 1 | 0.985 | 0.903 | 1 | 1 | 0.980 |
| Pereira | 0.816 | 0.842 | 0.814 | 0.709 | 1 | 0.671 | 0.756 | 0.674 | 0.611 | 0.766 |
| Villavicencio | 0.849 | 0.743 | 0.829 | 0.871 | 0.635 | 0.652 | 1 | 0.578 | 0.783 | 0.771 |
| Cities | Pure Technical Efficiency |
| 2005 | 2006 | 2007 | 2008 | 2009 | 2010 | 2011 | 2012 | 2013 | Mean |
| Cartagena | 0.650 | 0.681 | 0.682 | 0.692 | 0.682 | 0.872 | 0.743 | 0.759 | 0.709 | 0.719 |
| Ibague | 0.659 | 0.669 | 0.748 | 0.763 | 0.766 | 0.854 | 0.765 | 0.957 | 0.932 | 0.779 |
| Manizales | 0.893 | 0.842 | 0.823 | 0.818 | 0.665 | 0.762 | 0.870 | 0.794 | 0.746 | 0.801 |
| Pasto | 1 | 0.961 | 1 | 0.988 | 1 | 0.994 | 0.956 | 1 | 1 | 0.989 |
| Pereira | 1 | 0.860 | 0.822 | 0.756 | 1 | 0.691 | 0.917 | 0.707 | 0.681 | 0.826 |
| Villavicencio | 0.887 | 0.769 | 0.853 | 0.894 | 0.643 | 0.708 | 1 | 0.678 | 0.889 | 0.813 |
| Cities | Scale Efficiency |
| 2005 | 2006 | 2007 | 2008 | 2009 | 2010 | 2011 | 2012 | 2013 | Mean |
| Cartagena | 0.938 | 0.907 | 0.911 | 0.899 | 0.915 | 0.947 | 0.927 | 0.939 | 0.955 | 0.927 |
| Ibague | 0.989 | 0.976 | 0.924 | 0.979 | 0.980 | 0.979 | 0.908 | 0.991 | 0.986 | 0.981 |
| Manizales | 0.904 | 0.958 | 0.927 | 0.939 | 0.949 | 0.940 | 0.963 | 0.955 | 0.968 | 0.945 |
| Pasto | 1 | 0.994 | 1 | 0.991 | 1 | 0.991 | 0.945 | 1 | 1 | 0.991 |
| Pereira | 0.816 | 0.979 | 0.990 | 0.938 | 1 | 0.971 | 0.824 | 0.953 | 0.897 | 0.930 |
| Villavicencio | 0.957 | 0.966 | 0.972 | 0.974 | 0.988 | 0.921 | 1 | 0.853 | 0.881 | 0.946 |
3.3. DEA Social Model
The results of the DEA social model are presented in
Table 5 and
Table 6. In both groups, Bucaramanga, Cali, Villavicencio, and Manizales exhibit higher TE based on the CRS assumption; this pattern indicates that these cities are more efficient at utilizing their expenditures and investments to decrease poverty and to increase housing production, particularly for lower socioeconomic segments.
These results suggest that, in these cities, investment and expenditure strategies have focused on the population segments with the highest need, which could contribute to decreasing social inequality and positively affect a city’s productivity. In these cities, investments and expenditures should be intended to create measurable social benefits in addition to financial returns. Opportunities exist to make better use of scarce resources to support important social benefits and to identify potential interventions that balance the needs of public asset owners (particularly for scale, comparability and comfort) while ensuring the delivery of social benefits [
46].
Table 5.
Results of the DEA social model for larger, high-production cities.
Table 5.
Results of the DEA social model for larger, high-production cities.
| Cities | Technical Efficiency |
| 2005 | 2006 | 2007 | 2008 | 2009 | 2010 | 2011 | 2012 | 2013 | Mean |
| Barranquilla | 0.849 | 0.851 | 0.839 | 0.776 | 0.775 | 0.732 | 0.746 | 0.832 | 0.800 | 0.800 |
| Bogotá | 0.639 | 0.634 | 0.635 | 0.652 | 0.657 | 0.638 | 0.643 | 0.646 | 0.647 | 0.643 |
| Bucaramanga | 0.956 | 0.966 | 1 | 1 | 0.982 | 0.985 | 0.993 | 1 | 1 | 0.987 |
| Cali | 0.844 | 0.818 | 0.802 | 0.818 | 0.907 | 0.763 | 0.719 | 0.768 | 0.873 | 0.812 |
| Medellin | 0.746 | 0.727 | 0.721 | 0.697 | 0.772 | 0.744 | 0.685 | 0.684 | 0.681 | 0.717 |
| Cities | Pure Technical Efficiency |
| 2005 | 2006 | 2007 | 2008 | 2009 | 2010 | 2011 | 2012 | 2013 | Mean |
| Barranquilla | 0.870 | 0.876 | 0.897 | 0.794 | 0.897 | 0.904 | 0.857 | 0.881 | 0.886 | 0.874 |
| Bogotá | 0.648 | 0.639 | 0.639 | 0.653 | 0.661 | 0.646 | 0.652 | 0.651 | 0.651 | 0.649 |
| Bucaramanga | 1 | 0.999 | 1 | 1 | 1 | 0.998 | 0.997 | 1 | 1 | 0.999 |
| Cali | 0.912 | 0.871 | 0.843 | 0.856 | 0.947 | 0.866 | 0.760 | 1 | 1 | 0.895 |
| Medellin | 0.774 | 0.743 | 0.735 | 0.808 | 0.818 | 0.884 | 0.815 | 0.722 | 0.726 | 0.781 |
| Cities | Scale Efficiency |
| 2005 | 2006 | 2007 | 2008 | 2009 | 2010 | 2011 | 2012 | 2013 | Mean |
| Barranquilla | 0.976 | 0.971 | 0.935 | 0.977 | 0.864 | 0.810 | 0.870 | 0.944 | 0.903 | 0.917 |
| Bogotá | 0.986 | 0.992 | 0.994 | 0.998 | 0.994 | 0.988 | 0.986 | 0.992 | 0.994 | 0.992 |
| Bucaramanga | 0.956 | 0.967 | 1 | 1 | 0.982 | 0.987 | 0.996 | 1 | 1 | 0.988 |
| Cali | 0.925 | 0.939 | 0.951 | 0.956 | 0.958 | 0.881 | 0.946 | 0.76 | 0.873 | 0.911 |
| Medellin | 0.964 | 0.978 | 0.981 | 0.863 | 0.944 | 0.842 | 0.840 | 0.947 | 0.938 | 0.922 |
Table 6.
Results of the DEA social model for cities of medium size and production levels.
Table 6.
Results of the DEA social model for cities of medium size and production levels.
| Cities | Technical Efficiency |
| 2005 | 2006 | 2007 | 2008 | 2009 | 2010 | 2011 | 2012 | 2013 | Mean |
| Cartagena | 0.762 | 0.717 | 0.718 | 0.701 | 0.771 | 0.758 | 0.788 | 0.813 | 0.694 | 0.747 |
| Ibague | 1 | 0.975 | 0.839 | 0.735 | 0.808 | 0.757 | 0.981 | 0.902 | 0.917 | 0.879 |
| Manizales | 0.948 | 0.775 | 0.751 | 0.831 | 0.929 | 0.872 | 0.918 | 1 | 1 | 0.892 |
| Pasto | 0.905 | 0.666 | 0.641 | 0.754 | 1 | 0.714 | 1 | 0.902 | 0.725 | 0.812 |
| Pereira | 0.888 | 0.969 | 0.810 | 0.846 | 0.853 | 0.945 | 0.878 | 0.769 | 1 | 0.884 |
| Villavicencio | 0.827 | 0.911 | 0.877 | 1 | 0.997 | 0.953 | 0.881 | 0.986 | 0.824 | 0.917 |
| Cities | Pure Technical Efficiency |
| 2005 | 2006 | 2007 | 2008 | 2009 | 2010 | 2011 | 2012 | 2013 | Mean |
| Cartagena | 0.809 | 0.755 | 0.729 | 0.720 | 0.798 | 0.813 | 0.791 | 0.827 | 0.712 | 0.773 |
| Ibague | 1 | 0.999 | 0.874 | 0.763 | 0.818 | 0.831 | 1 | 0.936 | 0.938 | 0.907 |
| Manizales | 0.984 | 0.859 | 0.753 | 0.846 | 1 | 0.974 | 0.980 | 1 | 1 | 0.933 |
| Pasto | 0.908 | 0.667 | 0.647 | 0.763 | 1 | 0.892 | 1 | 0.908 | 0.781 | 0.841 |
| Pereira | 0.895 | 1 | 0.814 | 0.847 | 0.859 | 1 | 0.885 | 0.812 | 1 | 0.901 |
| Villavicencio | 0.831 | 0.945 | 0.903 | 1 | 0.998 | 0.973 | 0.914 | 1 | 0.846 | 0.934 |
| Cities | Scale Efficiency |
| 2005 | 2006 | 2007 | 2008 | 2009 | 2010 | 2011 | 2012 | 2013 | Mean |
| Cartagena | 0.942 | 0.950 | 0.985 | 0.974 | 0.966 | 0.932 | 0.996 | 0.983 | 0.975 | 0.967 |
| Ibague | 1 | 0.976 | 0.960 | 0.963 | 0.988 | 0.911 | 0.981 | 0.964 | 0.978 | 0.969 |
| Manizales | 0.963 | 0.902 | 0.997 | 0.982 | 0.929 | 0.895 | 0.937 | 1 | 1 | 0.956 |
| Pasto | 0.997 | 0.999 | 0.991 | 0.988 | 1 | 0.800 | 1 | 0.993 | 0.928 | 0.966 |
| Pereira | 0.992 | 0.969 | 0.995 | 0.999 | 0.993 | 0.945 | 0.992 | 0.947 | 1 | 0.981 |
| Villavicencio | 0.995 | 0.964 | 0.971 | 1 | 0.999 | 0.979 | 0.964 | 0.986 | 0.974 | 0.981 |
For the VRS assumption, the results for PTE indicate that the same cities in both groups are considered efficient as for the CRS assumption. When city scale increases, urban social sustainability decreases because of the increase in the complexity and the demands of social needs, which in certain cases, the city is unable to solve due to scarce resources or lack of capacity to respond. These results concur with the [
47,
48], which states that as cities grow in size and population, it is important to seek harmony among spatial, social, and environmental aspects based on two key pillars: equity and sustainability. Moreover, cities that experience high levels of inequality and poverty increase their risk of political tension and social conditions that undermine security and economic development, which in turn reduce incentives for investment and increase the amount of public resources needed to maintain national security. Hence, resources that can strengthen productivity, development, social services, and infrastructures must be used for security; however, this choice leads to deterioration of the cities’ social conditions [
49].
3.4. DEA Economic Model
This model analyses the relation between resources and GDP.
Table 7 and
Table 8 show the results of this model. In both models (CRS and VRS), Bucaramanga, Medellin, Cali, Cartagena, and Pasto show higher efficiency. Therefore, in the first case CRS assumption, these cities are more efficient in the use of resources (energy, water, and investments) to generate a higher GDP; they have better economic sustainability, indicating that management drives the lower use of resources to generate more economic production.
For VRS (PTE), the results indicate that the same cities are considered efficient in both categories, and when city scale increases, urban economic sustainability declines. The SE results show that inefficient cities experience a reduction in returns to scale, indicating that urban economic sustainability decreases as these cities increase in size.
Table 7.
Results of the DEA economic model for larger, high-production cities.
Table 7.
Results of the DEA economic model for larger, high-production cities.
| Cities | Technical Efficiency |
| 2005 | 2006 | 2007 | 2008 | 2009 | 2010 | 2011 | 2012 | 2013 | Mean |
| Barranquilla | 0.723 | 0.664 | 0.810 | 0.651 | 0.589 | 0.647 | 0.715 | 0.678 | 1 | 0.720 |
| Bogotá | 0.847 | 0.845 | 0.843 | 0.876 | 0.756 | 0.805 | 0.848 | 0.806 | 0.911 | 0.838 |
| Bucaramanga | 0.891 | 1 | 0.958 | 1 | 0.924 | 0.890 | 1 | 0.906 | 1 | 0.952 |
| Cali | 0.885 | 0.854 | 0.857 | 1 | 1 | 1 | 0.961 | 0.772 | 1 | 0.925 |
| Medellin | 1 | 0.992 | 0.988 | 0.964 | 0.799 | 0.966 | 0.931 | 1 | 1 | 0.960 |
| Cities | Pure Technical Efficiency |
| 2005 | 2006 | 2007 | 2008 | 2009 | 2010 | 2011 | 2012 | 2013 | Mean |
| Barranquilla | 0.742 | 0.669 | 0.868 | 0.660 | 0.730 | 0.826 | 0.895 | 0.687 | 1 | 0.786 |
| Bogotá | 0.848 | 0.850 | 0.847 | 0.878 | 0.822 | 0.816 | 0.859 | 0.883 | 0.913 | 0.857 |
| Bucaramanga | 0.898 | 1 | 0.995 | 1 | 1 | 0.917 | 1 | 0.907 | 1 | 0.946 |
| Cali | 0.914 | 0.879 | 0.859 | 1 | 1 | 1 | 1 | 0.815 | 1 | 0.941 |
| Medellin | 1 | 1 | 1 | 1 | 0.809 | 0.968 | 0.933 | 1 | 1 | 0.968 |
| Cities | Scale Efficiency |
| 2005 | 2006 | 2007 | 2008 | 2009 | 2010 | 2011 | 2012 | 2013 | Mean |
| Barranquilla | 0.974 | 0.993 | 0.933 | 0.986 | 0.807 | 0.783 | 0.799 | 0.987 | 1 | 0.918 |
| Bogotá | 0.999 | 0.994 | 0.995 | 0.998 | 0.920 | 0.987 | 0.987 | 0.913 | 0.998 | 0.977 |
| Bucaramanga | 0.992 | 1 | 0.963 | 1 | 0.924 | 0.971 | 1 | 0.999 | 1 | 0.983 |
| Cali | 0.968 | 0.972 | 0.998 | 1 | 1 | 1 | 0.961 | 0.947 | 1 | 0.983 |
| Medellin | 1 | 0.992 | 0.988 | 0.964 | 0.988 | 0.998 | 0.998 | 1 | 1 | 0.992 |
Table 8.
Results of the DEA economic model for cities of medium size and production levels.
Table 8.
Results of the DEA economic model for cities of medium size and production levels.
| Cities | Technical Efficiency |
| 2005 | 2006 | 2007 | 2008 | 2009 | 2010 | 2011 | 2012 | 2013 | Mean |
| Cartagena | 0.732 | 0.942 | 0.945 | 1 | 0.567 | 1 | 0.989 | 1 | 0.948 | 0.903 |
| Ibague | 0.673 | 0.955 | 0.646 | 0.880 | 0.619 | 0.661 | 0.579 | 0.858 | 0.728 | 0.733 |
| Manizales | 0.897 | 0.805 | 0.684 | 0.772 | 0.542 | 0.658 | 0.704 | 0.815 | 0.514 | 0.710 |
| Pasto | 0.820 | 0.655 | 1 | 1 | 1 | 0.946 | 0.604 | 1 | 0.621 | 0.850 |
| Pereira | 0.767 | 0.822 | 0.776 | 0.669 | 0.836 | 0.682 | 0.721 | 0.772 | 0.537 | 0.731 |
| Villavicencio | 0.502 | 0.618 | 0.647 | 0.697 | 0.629 | 0.538 | 1 | 0.829 | 0.953 | 0.713 |
| Cities | Pure Technical Efficiency |
| 2005 | 2006 | 2007 | 2008 | 2009 | 2010 | 2011 | 2012 | 2013 | Mean |
| Cartagena | 0.751 | 0.945 | 0.947 | 1 | 0.592 | 1 | 1 | 1 | 1 | 0.915 |
| Ibague | 0.746 | 1 | 0.708 | 0.901 | 0.843 | 0.926 | 0.634 | 1 | 0.833 | 0.843 |
| Manizales | 1 | 0.859 | 0.734 | 0.815 | 0.585 | 0.999 | 0.970 | 1 | 0.589 | 0.839 |
| Pasto | 1 | 0.675 | 1 | 1 | 1 | 0.958 | 0.708 | 1 | 0.654 | 0.888 |
| Pereira | 0.827 | 0.857 | 0.828 | 0.697 | 1 | 0.774 | 0.863 | 0.859 | 0.602 | 0.812 |
| Villavicencio | 0.768 | 0.683 | 0.953 | 0.911 | 0.888 | 0.545 | 1 | 0.867 | 1 | 0.846 |
| Cities | Scale Efficiency |
| 2005 | 2006 | 2007 | 2008 | 2009 | 2010 | 2011 | 2012 | 2013 | Mean |
| Cartagena | 0.975 | 0.997 | 0.998 | 1 | 0.958 | 1 | 0.989 | 1 | 0.948 | 0.985 |
| Ibague | 0.902 | 0.955 | 0.912 | 0.977 | 0.734 | 0.714 | 0.913 | 0.858 | 0.874 | 0.871 |
| Manizales | 0.897 | 0.937 | 0.932 | 0.947 | 0.926 | 0.659 | 0.726 | 0.815 | 0.873 | 0.857 |
| Pasto | 0.820 | 0.970 | 1 | 1 | 1 | 0.987 | 0.853 | 1 | 0.950 | 0.953 |
| Pereira | 0.927 | 0.959 | 0.937 | 0.960 | 0.836 | 0.881 | 0.835 | 0.899 | 0.892 | 0.903 |
| Villavicencio | 0.654 | 0.905 | 0.679 | 0.765 | 0.708 | 0.987 | 1 | 0.956 | 0.953 | 0.845 |
The results indicate that medium-sized cities more closely balance population and productivity activities to become efficient. In contrast, large cities show disproportionate population growth increases demands for housing resources, decreasing the productivity relation.
These results show that it is important to generate new processes and innovations to promote greener economic development. These processes and innovations include cost savings through the effective and efficient use of resources, less reliance on unsustainable energy sources, new jobs, and economic investment created through sustainable consumption and production, generating urban sustainability by improving resource efficiency, reducing carbon emissions, minimizing environmental risks, and enhancing ecosystems [
50]. In Colombia, medium-sized cities have achieved improvements in urban sustainability through better urban planning and management, promoting economic development, reducing environmental impacts, and improving social welfare.
Economic growth and sustainability require solutions in which both are balanced and coexist. This balance implies the development of innovation strategies and solutions that allow growth spirals of the economy and the population, prevent resource depletion, reduce environmental impacts, and improve social conditions. However, environmental problems reflect the tension between short-term growth and long-term survival [
51], which requires the development of adequate sustainability policies, particularly in cities that tend to have larger populations and generate more social and pollution problems.
The DEA models proposed in this study have different advantages: (i) these models can handle multiple inputs and output to evaluate sustainability from different approaches; (ii) they do not require the assumption of a functional form relating inputs to outputs; (iii) cities are directly compared against a peer or a combination of peers; (iv) inputs and outputs can have very different units; and (v) this technique allows efficiency evaluation of sustainability over time in the selected cities. However, the DEA models suggested have some limitations: (i) these models are not adequate for calculating absolute efficiencies (they are adequate for comparing peers but not comparing performance to a theoretical maximum); (ii) DEA is a nonparametric technique, and statistical hypothesis testing is complex; (iii) it is not meaningful to compare the scores between two different studies; (iv) all efficient cities are assigned the same score (1.00); thus, a further ranking is not possible; (v) this is a quantitative analysis that should be complemented with qualitative analyses that should include urban governance and policy processes to strengthen the analysis and design of urban instruments and programs to achieve sustainable and balanced economic and social development in cities.
The results of the three models reveal differences in the two categories of cities selected for this study. Colombian cities achieve higher efficiency in three sustainability areas (environmental, social, and economic factors). These results suggest that policies are integral to achieving sustainable development, which includes higher economic growth and development, improved social performance and quality of life, and lower environmental impacts.
The models proposed in this study can be applied in other Latin American cities to analyze sustainable efficiency and to compare performance along different dimensions of sustainability, which will allow the adequate design of urban policies to promote better environmental resource use, greater social inclusion, and economic growth.
This study suggests that achieving sustainability requires quantitative and qualitative analysis and evaluation, where the urban governance strategy is key to balancing conditions related to social equity without risking the harmony, productivity, and employment of urban systems. It is important to promote cleaner production, innovation, social inclusion, adequate public management, and new livelihood opportunities to effectively enable sustainable urban development.
4. Conclusions
This study uses various DEA models to evaluate the relative sustainable development of typical Colombian cities and to determine the different relations and factors that influence these results. The following conclusions can be drawn:
(1) In this study, DEA is applied to assess the relative sustainable development of 11 Colombian cities. The majority of these cities (i.e., Bucaramanga, Medellin, Cali, Pasto, Villavicencio, and Pereira) exhibit relatively sustainable development.
(2) The results for Colombian cities suggest that inefficiency is present when decreasing returns to scale exist and that when city scale increases, urban sustainability tends to decline.
(3) Efficiency is decreased by several factors, such as changes in scale (increased size tends to generate a higher concentration of population with higher demands for services, which decreases the efficiency of resource and energy use). Moreover, in megacities or large cities, investments are atomized in social areas, such as housing, which should increase social inequality and reduce productivity.
(4) A city’s scale also affects the environment because of coupling (i.e., the relation between exponential growth in demand for goods and consumption). Hence, megacities and large cities experience increased material and energy flows, generating more environmental processes and higher air pollution and waste, while productivity is maintained or decreased. In contrast, medium-sized cities are characterized by a better relation between material and energy use, resulting in increased efficiency.
(5) Sustainable development requires resource, environmental, economic, and social balance. For megacities and large cities, it is necessary to promote decoupling, which implies decreasing the exponential growth of goods and services demands in relation to lineal population growth. This change would increase efficiency and decrease environmental and social impacts. Moreover, it is important to balance social investment to decrease inequality. In Colombian cities of both categories, more efficient cities use resources adequately, decrease environmental impacts, improve social conditions, and guarantee economic growth and development.
The findings of this study are important for developing adequate urban policies based on the size and features of cities, promoting sustainable development based on balancing economic, social, and environmental conditions and considering each city’s situation and features to improve urban planning and development, particularly in developing countries. Moreover, it is important to continue analyzing sustainable performance using other approaches and to determine the main factors that contribute more sustainable development.
Future studies should consider additional cities in Latin America, other inputs and outputs, and time series, depending on data availability. One possible extension is to measure dynamic urban sustainability using other techniques, such as meta-frontier analysis and the Malmquist index. Research could also be extended to parametric analysis, qualitative analysis, and cause-effect relationships applying panel data techniques.


