Abstract
With increasing urbanization, the populations in China’s cities are growing, and the cities themselves are gradually expanding. Competition for access to the national territory’s resources is also growing. Thus, the quality of national territory use is worsening. Quality assessments on national territory use can provide a basis for solving this issue. By combining the implications of new urbanization in China, we established an assessment index system relating to the quality of national territory use, from the perspective of harmoniously developing spaces for production, living and ecology. A subjective and objective integrated weighting method was developed based on principal component analysis and planning review. Then, a comprehensive discriminative model was established to assess the quality of national territory use. The evaluation results showed that harmonious development of spaces for production, living and ecology did not occur in either the ecology-oriented or production-oriented regions. The integrated quality of national territory use in the production-oriented region had a significant advantage over that of the ecology-oriented region. The integrated quality of national territory use was highest in Changzhou’s city center and vicinity. The results can support the implementation of China’s new urbanization strategy and provide evidence to improve the criteria for the intensive use of national territorial resources.
1. Introduction
“National territory” refers to the geographical zone under the jurisdiction of a national sovereignty. It is the location meant for citizens’ survival and includes ecological, living and production spaces, which shall be abbreviated as “production-living-ecology spaces” [1]. “Ecological space” alleviates environmental degradation by mitigating problems, such as erosion and pollution; it can be understood as the total amount of space needed or occupied by a species under macro-stable conditions. “Living space” provides homes for people and gives them opportunities to make purchases, enjoy recreational activities and be entertained; it includes residential areas, shopping centers and holiday resorts. “Production space”, which can be agricultural, industrial or touristic, facilitates the export of products [1].
China’s new urbanization includes the following aspects: urban-rural coordination, urban-rural integration, the interactions between industries and cities, economical and intensive use, ecological livability and harmonious development. When considering the implications of China’s new urbanization in relation to the use of national territories, “urban-rural coordination” and “urban-rural integration” require the integration of urban-rural planning, basic infrastructure and public services, as well as a reasonable arrangement of spatial patterns. For example, spatial patterns include the construction of cities and townships, the protection of agricultural land, the localization of industry, the distribution of villages and ecological preservation. Government workers should guide the building of rural homes and settlements scientifically, facilitate more convenient production capabilities and improve living conditions for farmers. In addition, urban planners should contribute to a rational pattern of urban and rural spatial patterns and the structural optimization and intensive use of the national territory [2,3]. “Interactions between industries and cities” require coordinating the transformation of city districts, building new cities and districts, improving the efficiency with which a city uses space, controlling the extent of land use allocated for new construction in new cities and districts, adjusting the land use policy in production parks and encouraging the transformation of production parks into urban functional areas [2,4]. “Economical and intensive use” requires tight controls over the scope of land use development in cities and townships, strict planning to ensure the long-term protection of basic arable land for future uses, moderate control over urban development borders and optimization of the cities’ internal spatial structures, while promoting intensive development. The goal is to improve the efficiency with which the national territory is used [2]. “Ecological livability” necessitates merging the concepts of ecological civilization and urbanization, thereby using resources such as land, water and energy most efficiently [2]. “Harmonious development” is premised on achieving “harmony between humans and land”, including the scientific allocation of land resources in terms of their extent, design, time sequences and urban-rural areas [3].
As China’s strategy for new urbanization develops, the following dimensions have significant implications for the sustainable development of national territory: (1) effectively strengthening production space; (2) the livability of residential areas; and (3) pleasant scenery in ecological space. These dimensions satisfy the needs of future population growth and help achieve a balanced gradient of national territory.
However, with the rapid progress of urbanization, the population and scale of cities are gradually expanding [5,6]. Conflicts between growing cities’ spatial needs and increasingly scarce national territorial resources have become more prominent [7,8]. At present, the main problems of national territory in China include the disorderly expansion of production space in central urban areas, uneven development between urban and rural living spaces and the degradation of the environment in ecological zones. To solve these challenges, the first task is to assess the current quality of national territory use. Such an evaluation often refers to the comprehensive appraisal of aspects of production-living-ecology spaces; for example, land use, the rural-urban coordination level and land ecological safety. Related research by domestic and international scholars mainly includes assessments of: (1) sustainable land use; (2) intensive land use; and (3) land use suitability.
Appraisals of sustainable land use encompass environmental, economic and social sustainability [9]. Related research evolved from establishing criterion for assessment indicators [10] to developing evaluation tools and service systems [11] and optimizing assessment methods and systems [9,12,13,14,15,16].
The evaluation of intensive land use primarily focused on assessing the extent of reasonable land development and usage intensity, with different index systems and research foci established by different scholars. For instance, Yang et al. [17] created an assessment model of intensive land use in urban centers from three aspects: buildings, land and transport. Hui et al. [8] conducted an empirical analysis of the actual coupling relationships between the scale of the city and intensive land use in 120 Chinese metropolises. Hui’s index system on intensive land use included four characteristics: the level of land input, the degree of land use, land use structure and land output efficiency.
Assessments of land use suitability aim to confirm the optimal spatial pattern for future land use [18,19]. The current scholarship has multiple perspectives. For example, Malczewski [20] summarized GIS-based analytical techniques for land use suitability from the angles of techno-positivism, socio-politics and public participation. The current research methods are relatively sophisticated. They mostly include the ideal point method [21,22], the parametric method [23], fuzzy logic technology [23] and multi-criteria decision analysis, which is based on spatially-explicit sensitivity analysis [24,25]. Relevant research is being developed in the direction of integration, precision and dynamics.
In terms of China’s new urbanization, the problems of national territory use are unique. Land urbanization generally occurs faster than population urbanization; the two phenomena do not develop in a balanced way [26]. Local governments’ control of a large amount of land resources and the relatively low price of land and labor costs in small and medium-sized towns lead to local governments intervening excessively in relevant space planning policies [27]. The situation of wasting territorial resources remains a serious matter [28]. Against the unique background of China’s new urbanization, the assessment indicators and models of existing studies do not apply to the quality evaluation of national territory use in China.
First, we established an assessment index system of the quality of national territory use. It is more suitable for China’s new urbanization than previous research work. We did so by combining the implications of new urbanization with the aim of promoting intensive and efficient production zones, livable, modest living spaces and picturesque ecological areas.
Second, we innovatively developed a subjective and objective integrated weighting method based on principal component analysis (PCA) and planning review. Compared to the existing weighting methods [29,30,31,32], this method combined the advantages of the subjective and objective weighting methods, and China’s spatial planning policies were integrated into the process of weighting. Therefore, the weighting results are closer to the actual situation of the study area, and the evaluation results are more reasonable. “Planning review” refers to selecting authoritative and representative land use planning policies in China; the goal is to review the index system and to rank various elements and factors by importance. The chosen policies generally share the following characteristics: (1) compiled by trained and certified technical professionals; (2) working principles that adhere to governments’ organization, experts leadership, sector cooperation, public participation, scientific decision-making, interdepartmental co-operation, public participation and scientific decision-making; (3) implementation approved by competent authorities and in-depth preparatory work, such as basic research on key issues; and (4) protection from related legal policies.
Finally, based on the assessment index system and weighting method, we formed a comprehensive discriminative model that encompasses multiple elements and factors. Next, we developed an appraisal system to evaluate the quality of use of production-living-ecology spaces, as well as the integrated quality of national territory use in Changzhou, one of the regions undergoing the most rapid urbanization in China’s Yangtze River Delta.
2. Study Area and Data Sources
2.1. Study Area
Changzhou (31°09′ N–32°04′ N, 119°08′ E–120°12′ E) is located in eastern China in the southern part of Jiangsu Province, along the central part of the Yangtze River Delta (Figure 1). As of 2012, Changzhou is comprised of two county-level cities (Liyang and Jintan) and five municipal districts (Wujin, Xinbei, Tianning, Zhonglou and Qishuyan), with a total of 58 townships and streets, which are the same level of administrative units in Changzhou, and a total area of 4372 km2 (the urban area comprises approximately 1862 km2, accounting for 43% of the overall sector). Southwestern Changzhou has a higher altitude, whereas the northeastern region is lower. The west and south are mostly mountain ranges, while the central and eastern zones are vast plains.
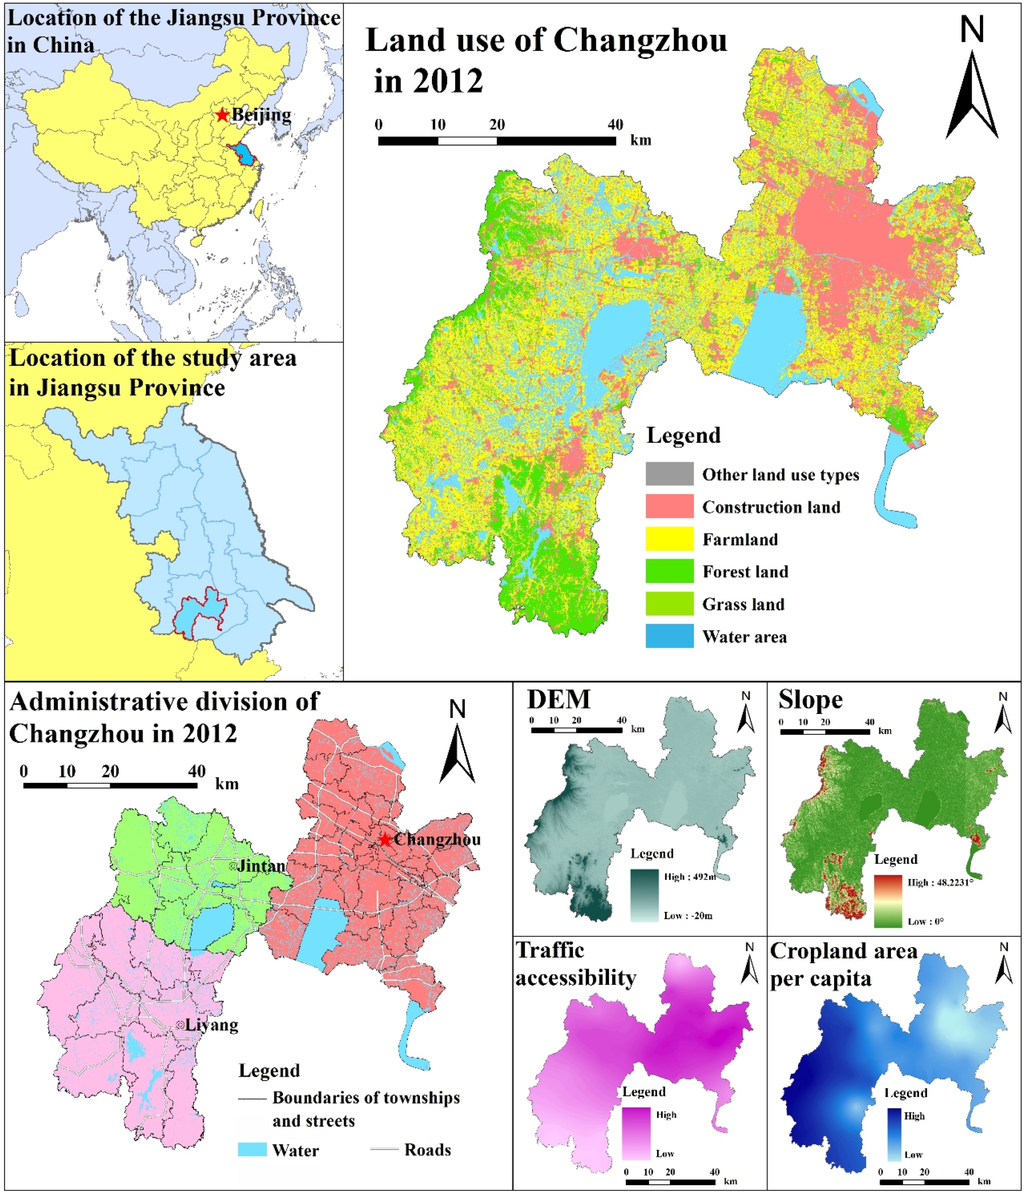
Figure 1.
The study area.
Changzhou neighbors Shanghai, Nanjing and Hangzhou; together with Suzhou and Wuxi, they form the Suxichang Megaregion. There is accessible water, land and air transport. Changzhou’s geographical location is superior, and it is one of the most rapidly, newly-urbanized areas in the Yangtze River Delta. As of 2012, Changzhou’s total population was 4,690,000 (whereas the urban population was 3.1 million, accounting for about 66% of all people). The population density was 1072 people/km2, much higher than the countrywide average in the same period (141 people/km2) [33,34]. In 2012, Changzhou’s gross domestic product (GDP) per capita was RMB 85,039, which was much higher than the national average of RMB 38,420 [33,34]. In 2012, Changzhou’s GDP reached RMB 397 billion; the added value of primary production was 3%, while the added value of the secondary and tertiary industries was 53% and 44%, respectively [34].
Nevertheless, while industrialization, urbanization and modernization have accelerated in Changzhou, the city is also facing a series of obstacles related to the low quality of national territory use. These difficulties include conflicts between the supply and demand of land, the low efficiency of saving and intensive land use and emerging ecological problems. To a certain extent, these impediments have affected Changzhou’s sustainable development.
2.2. Data Sources and Pre-Processing
This study used both spatial and statistical data. We used 2012 data on land use in Changzhou (1:50,000) to obtain information, such as the forest coverage rate, the grass coverage rate, the amount of wetlands and the index on the intensity of development. A digital elevation model (DEM, 30 m) of Changzhou was used to extract elevation and slope. Transport vector data from 2012 were used to calculate the density of road networks and accessibility. We calculated transportation accessibility using the network analysis function in ArcGIS. The benchmark for transport accessibility was the shortest amount of time needed to travel between each township or street to the remaining townships and streets. According to standard local railway mileage and speed and the technical standard of highway engineering, the speeds permitted on different roads are as follows: railways are 100 km/h; highways are 120 km/h; national roads are 80 km/h; provincial roads are 60 km/h; and county roads are 40 km/h. Data on the city’s geological environment and soil quality was used to obtain information on the geological environment, the soil pH value, soil organic carbon content and soil depth. We used data on the city’s water and atmospheric environments to calculate their quality.
We mostly processed spatial data using ArcGIS and employed GIS spatial analysis techniques. We combined data from administrative districts and dot distribution data from township governments, to perform statistical analyses on townships, streets and regions. We processed socio-economic data from 2012 using Microsoft Office Excel and SPSS; the information included population density, GDP per unit area, the per capita disposable income of urban residents, per capita net income of rural residents and the total power of agricultural machinery per unit area.
3. Creating an Assessment Model
Figure 2 illustrates the steps for building a comprehensive discriminative model that involves multiple elements and factors. The process includes data extraction, establishing an index system, weighting confirmation and creating the integrated assessment model.
First, we obtained various forms of data and built multiple databases. Using the corresponding criteria of index selection, we developed an index system. Then, through the subjective and objective integrated weighting method based on PCA and planning review, we confirmed the weights of elements and factors. Finally, by combining the weights with the assessment results of single factors of the index system, we performed integration using the weighted summation method [35] and created a comprehensive discriminative model [30,36]. Afterward, the quality assessment outcomes of production-living-ecology spaces and national territory use were obtained.
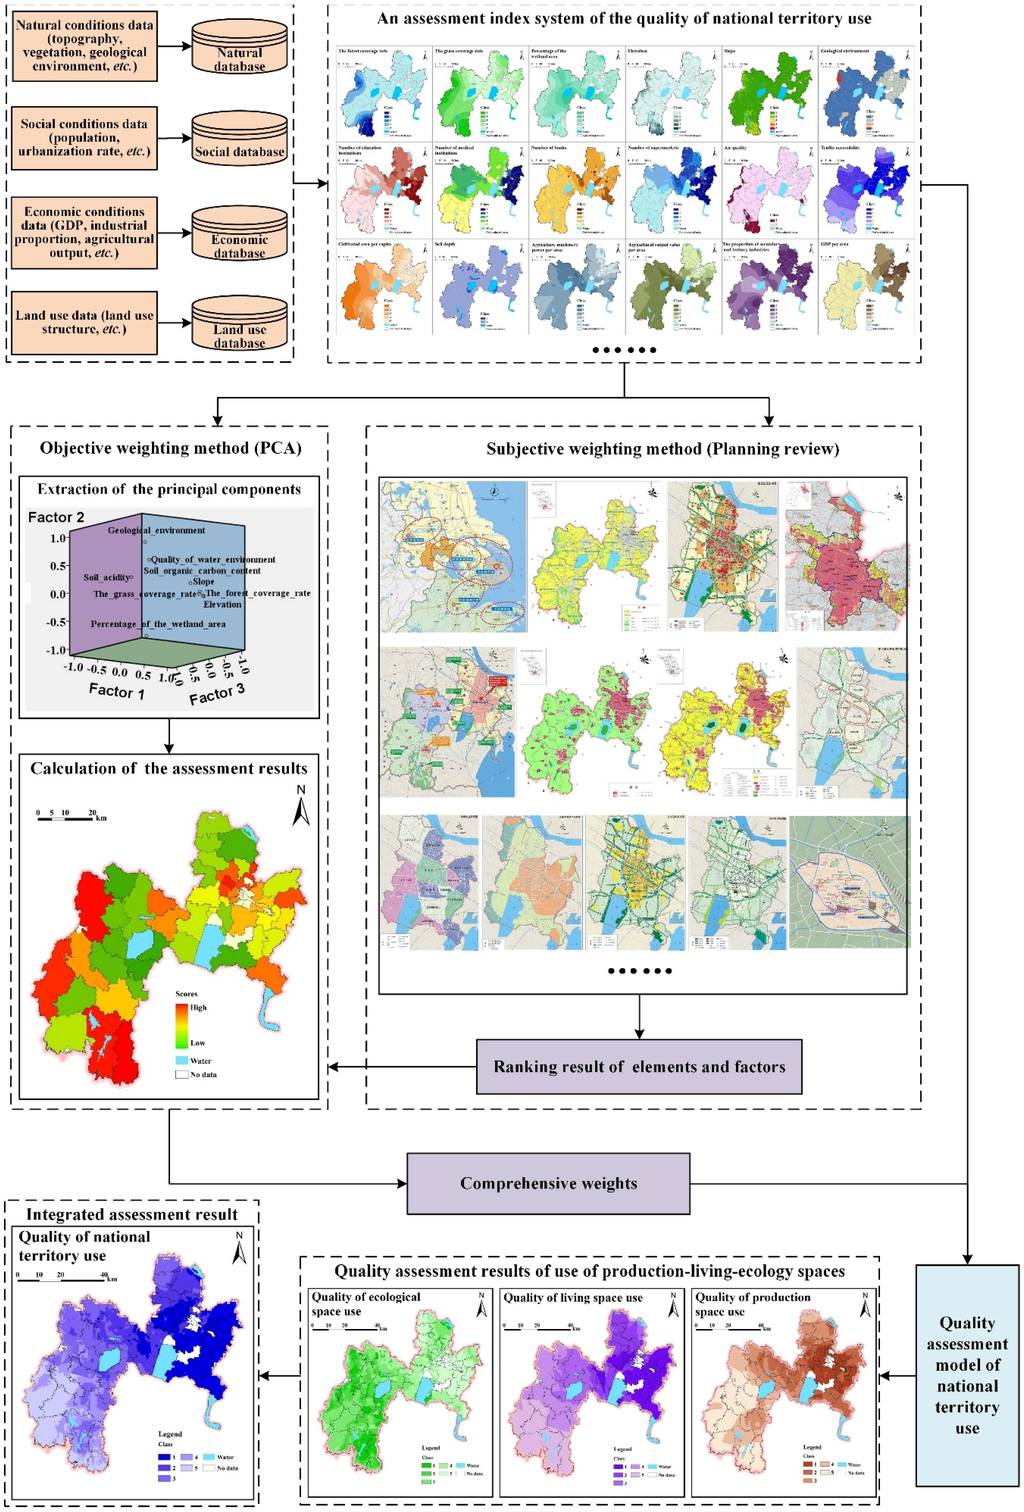
Figure 2.
Technical flowchart.
3.1. Creating an Index System
Data on land use, as well as natural, social, and economic conditions were gathered to build four corresponding databases. We examined related research findings [35,37,38,39,40,41,42,43] and tailored them to Changzhou’s circumstances. Then, an index system that assesses the quality of national territory use was created within the context of harmoniously developing production-living-ecology spaces. We built the index based on the scientific content of the quality of national territory use and by adhering to the principles of systematicity, science, objectivity and independence [36,39,43]. Using grids (100 m × 100 m) as the unit of assessment, we performed interpolation and natural break classification on the factors of evaluation.
3.2. Confirmation of Weights
The rational confirmation of weighting is an important step in the assessment process. When confirming the weighting, an appropriate method should be chosen according to the specific conditions, in order to confirm adherence to scientific principles and precision. There are generally two methods for confirming weighting. The first type is the subjective weighting method, such as the analytic hierarchy process (AHP) and the Delphi method, which are qualitative in nature and based on the experiences or preferences of experts. These techniques involve comparing, assigning and calculating the weights for various indexes based on the level of importance [29,30]. The other type is the objective weighting method, such as PCA and factor analysis. The objective weighting method generally employs a mathematical technique to obtain weighting, thereby preventing human errors [31,32].
We developed an integrated weighting method based on PCA and planning review. The main workflow involved: (1) extracting the principal components of the quality of use of production-living-ecology spaces via PCA; the goal was to obtain the evaluation results; (2) selecting various planning policies to review the index system and ranking the elements and factors; and (3) making adjustments to the PCA results according to the review outcomes, thus obtaining the weighting values for the index system’s various levels.
4. Results
4.1. Index System
The assessment index system can be divided into the target, element and factor layers. The “target layer” is the quality of national territory use. The “element layer” refers to the three dimensions: the quality of use of production-living-ecology spaces. Considering the accessibility of data and the comprehensiveness of the index system, for the “factor layer”, we chose 27 assessment factors (Figure 3).
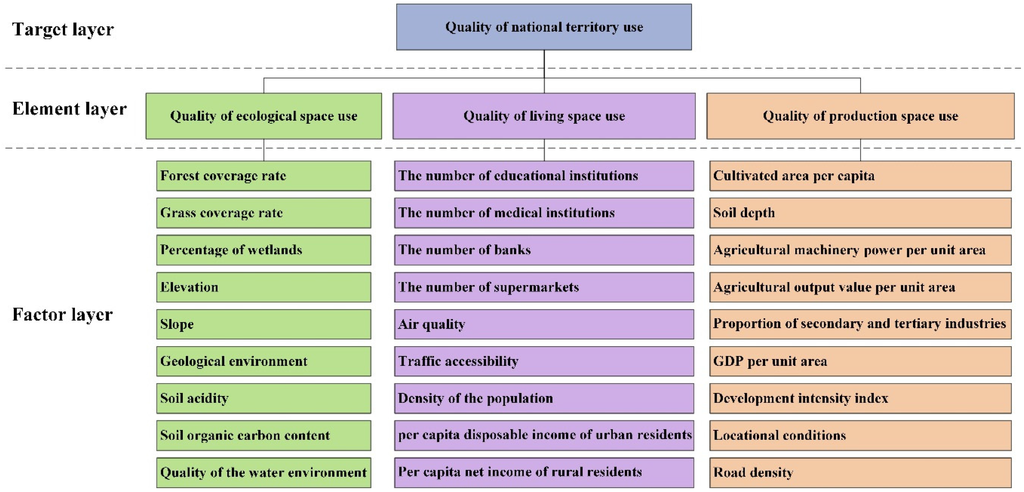
Figure 3.
The assessment index system of quality.
We evaluated and ranked the 27 single factors and obtained the ranking table of single factors (refer to Appendix A), as well as the assessment results for single factors (Figure 4).
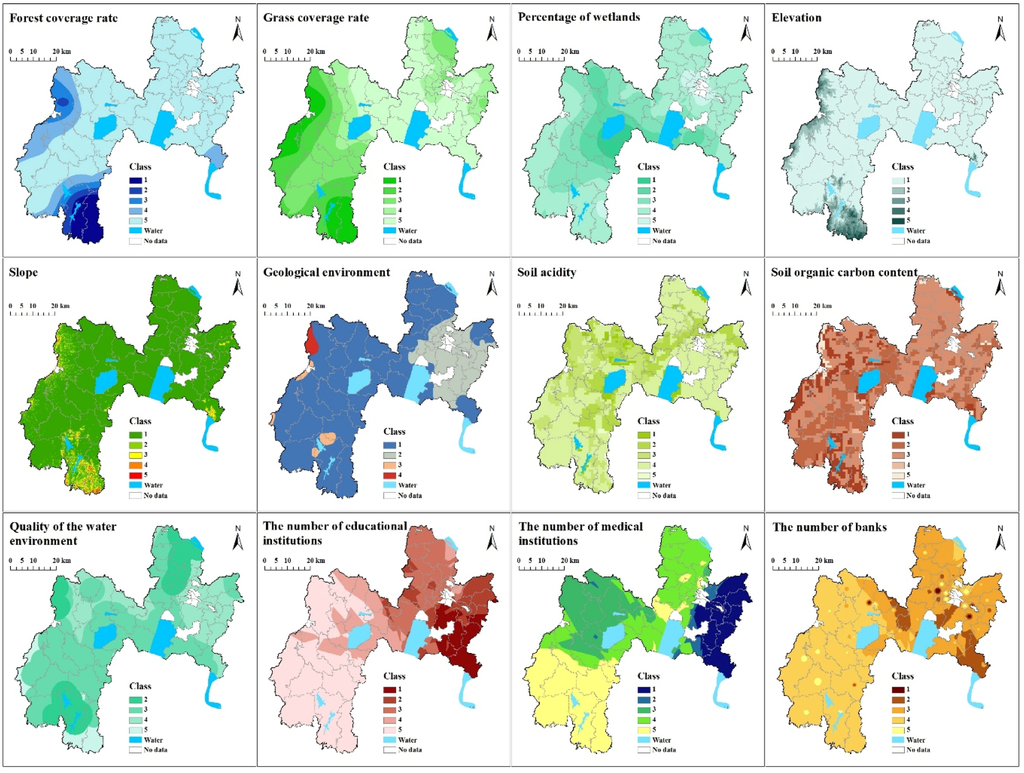
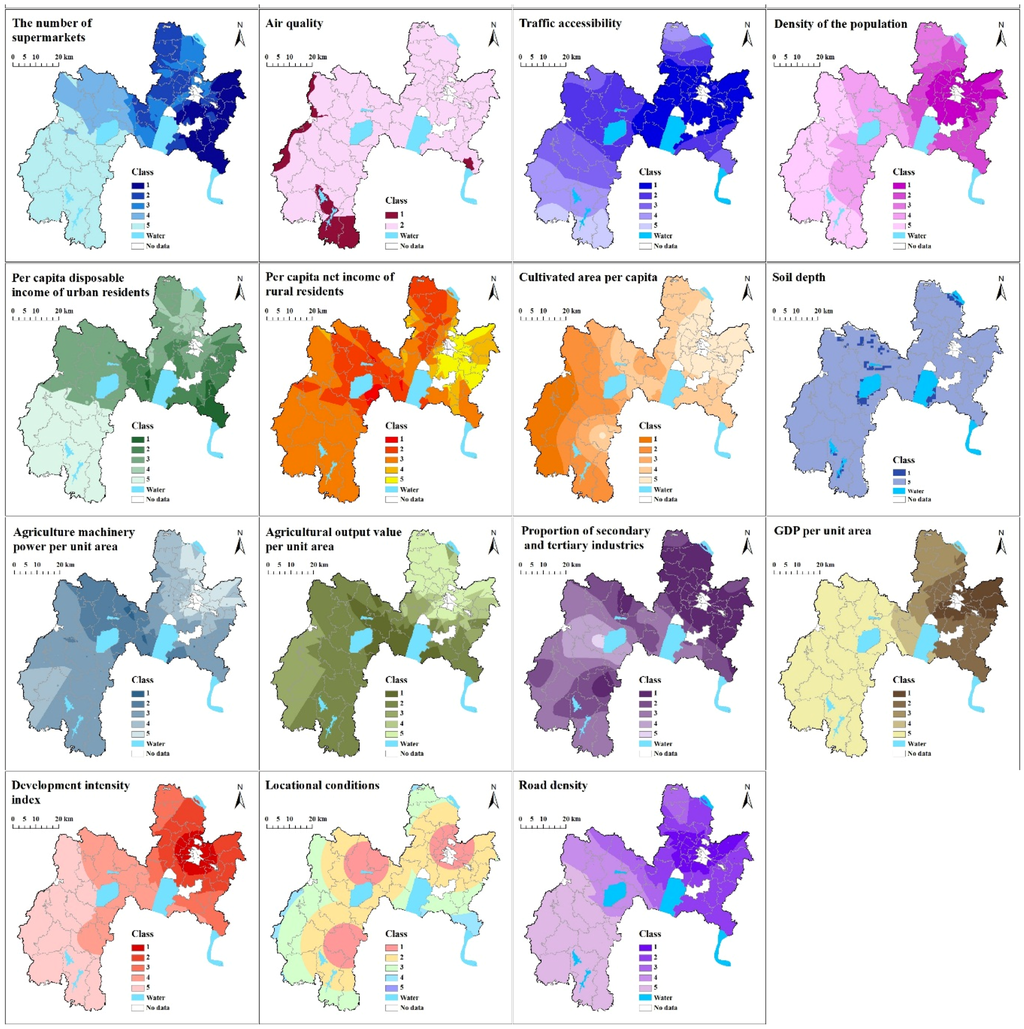
Figure 4.
Assessment results of single factors.
Assessment indicators on the quality of ecological space use: The ecological space of Changzhou is mainly comprised of forest, grassland and bodies of water that have important functions in ecosystem services. Thus, by referring to existing research [43,44,45], forest coverage rate, grass coverage rate and the percentage of wetlands are considered to be indicators of the circumstances of ecosystem services and biodiversity. Elevation, slope, the soil environment, the geological environment and the quality of the water environment demonstrated ecological fragility to a certain extent.
Assessment indicators on the quality of living space use: The number of educational and medical institutions, banks, supermarkets, as well as air quality and traffic accessibility reflected elements, such as the levels of comfort and convenience of living. To a certain extent, population density demonstrates the level of a region’s socio-economic development and the urban population’s quality of life. The per capita disposable income of urban residents and the per capita net income of rural residents reflect the economic situations of city and rural residents. Urban residents' disposable income is comprised of the income that can be used to arrange daily life. It is the most important, and most commonly used, index for estimating the income levels and living standards of urban residents. The net income of rural residents is the income that remains after deducting the costs of spending. This indicator is used to observe actual income levels and the ability to improve the lives of farmers.
Assessment indicators of the quality of production space use: Agriculture’s production efficiency is shown by cultivated area per capita, soil depth, agricultural machinery power per unit area and agricultural output value per unit area. The proportion of secondary and tertiary industries reveals the extent of coordination among industries. To a certain extent, GDP per unit area, the development intensity index, locational conditions and road density reflect the efficiency of land use. “GDP per unit area” indicates land use efficiency, the density of production value and the level of economic development. The “development intensity index” refers to the percentage of construction space as a proportion of the region’s total area. “Locational conditions” refers to the geographical distance from a location to the governments of Changzhou, Jintan and Liyang. “Road density” is the framework for transport and development, which affects the pattern of urban land use.
4.2. Weighting of Elements and Factors
4.2.1. Results of Objective Weighting
The PCA used townships and streets as the unit of assessment. Due to a lack of data on certain townships and streets in the Changzhou Statistical Yearbook, the PCA contained a total of 49 township and street units. After obtaining the actual values of the 27 single factors, we performed PCA (Table 1, Table 2 and Table 3) and obtained the assessment results on the quality of use of production-living-ecology spaces (Figure 5).

Table 1.
Rotated factor loading matrix of quality of ecological space use.
| Factor 1 | Factor 2 | Factor 3 | |
|---|---|---|---|
| Forest coverage rate | 0.982 | −0.009 | 0.071 |
| Percentage of wetlands | −0.190 | −0.900 | −0.031 |
| Elevation | 0.980 | −0.004 | 0.069 |
| Slope | 0.981 | 0.048 | −0.014 |
| Geological environment | −0.171 | 0.822 | −0.216 |
| Soil acidity | 0.016 | 0.393 | −0.753 |
| Soil organic carbon content | 0.089 | 0.082 | 0.915 |
| Initial eigenvalues | 2.997 | 1.932 | 1.141 |
| % of variance | 42.819 | 27.601 | 16.302 |
| Cumulative % | 42.819 | 70.420 | 86.722 |
Table 2.
Rotated factor loading matrix of quality of living space use.
| Factor 1 | Factor 2 | Factor 3 | |
|---|---|---|---|
| The number of educational institutions | 0.949 | 0.156 | −0.008 |
| The number of banks | 0.909 | 0.011 | 0.249 |
| The number of supermarkets | 0.923 | 0.153 | 0.060 |
| Traffic accessibility | −0.269 | −0.826 | −0.122 |
| Density of the population | −0.010 | 0.903 | −0.061 |
| Per capita disposable income of urban residents | 0.197 | 0.070 | 0.807 |
| Per capita net income of rural residents | −0.007 | −0.024 | 0.867 |
| Initial eigenvalues | 3.037 | 1.426 | 1.267 |
| % of variance | 43.384 | 20.369 | 18.107 |
| Cumulative % | 43.384 | 63.753 | 81.860 |
Table 3.
Rotated factor loading matrix of quality of production space use.
| Factor 1 | Factor 2 | Factor 3 | |
|---|---|---|---|
| Cultivated area per capita | −0.961 | 0.017 | 0.132 |
| Soil depth | 0.214 | 0.787 | 0.084 |
| Agricultural machinery power per unit area | −0.136 | −0.092 | 0.952 |
| Agricultural output value per unit area | −0.118 | −0.801 | 0.293 |
| Proportion of secondary and tertiary industries | 0.834 | 0.253 | −0.199 |
| Development intensity index | 0.813 | 0.271 | −0.433 |
| Road density | 0.787 | 0.324 | 0.241 |
| Initial eigenvalues | 3.645 | 1.122 | 1.025 |
| % of variance | 52.067 | 16.034 | 14.642 |
| Cumulative % | 52.067 | 68.101 | 82.743 |
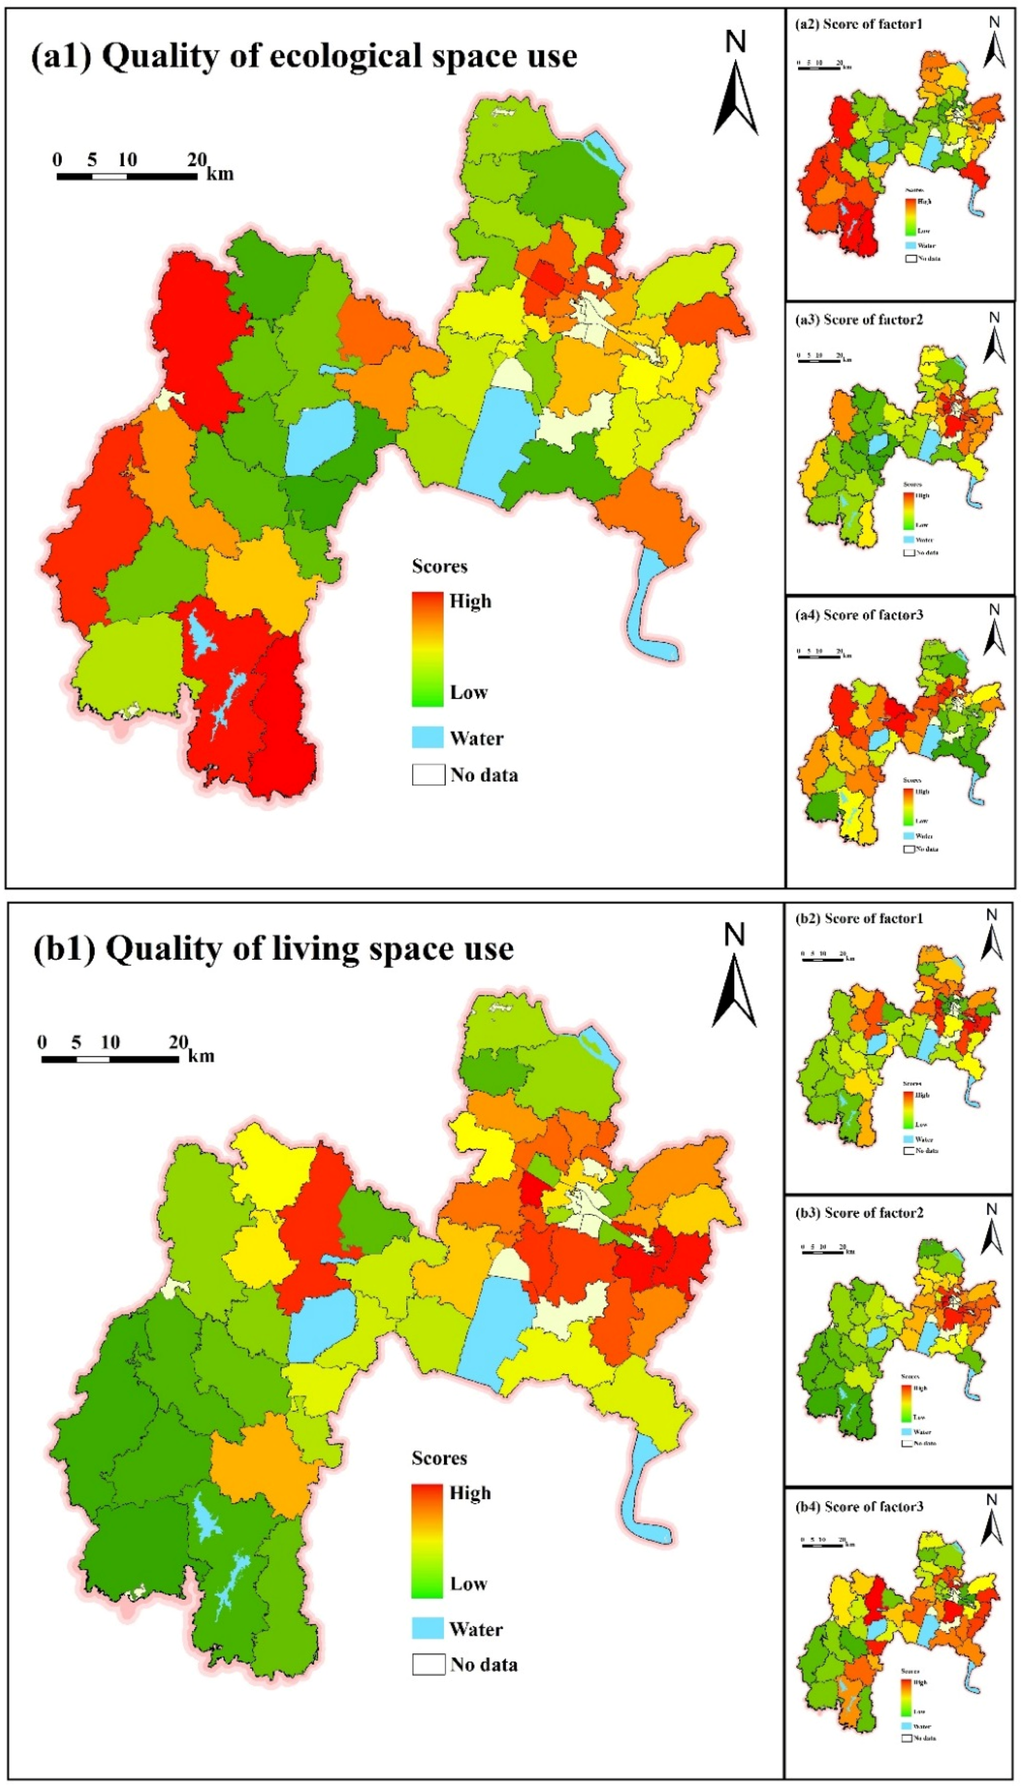
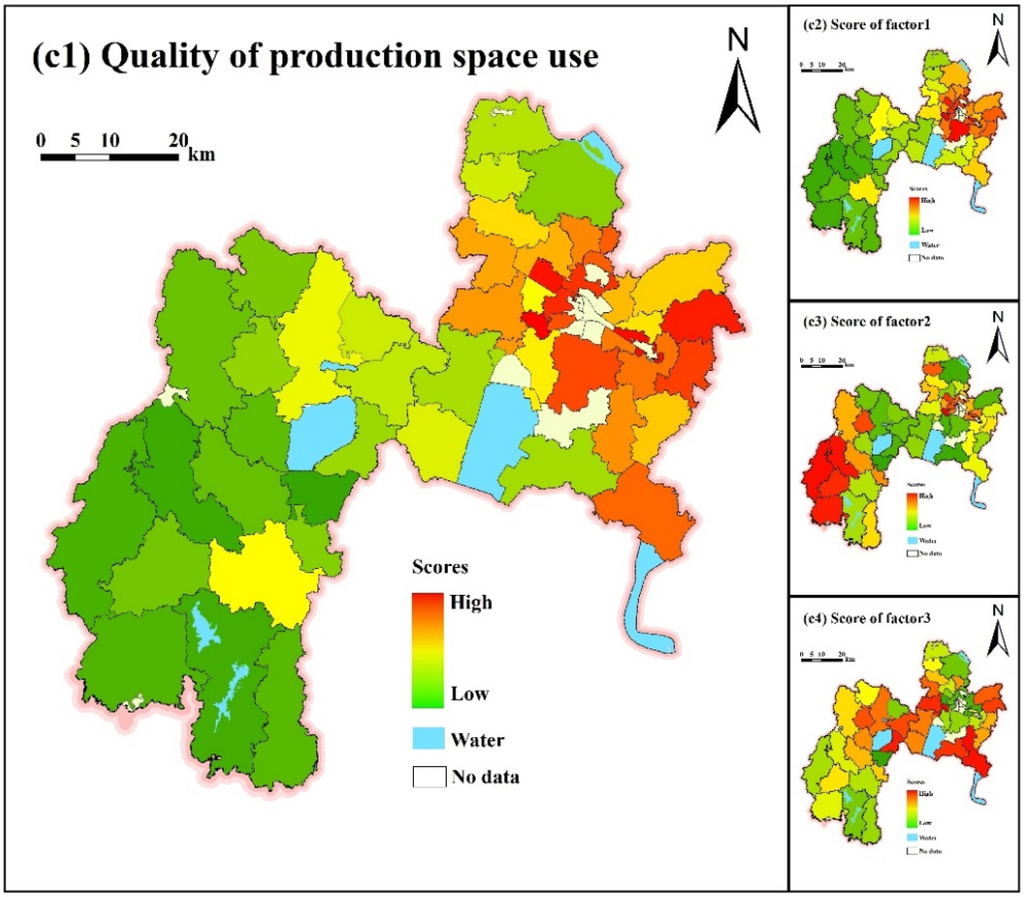
Figure 5.
Results of PCA.
PCA on the quality of ecological space use: Factor 1 (Figure 5(a2)) mainly included information on elevation and forest coverage. Regions with high sub-values were mostly distributed in the western parts of Liyang and Jintan. Factor 2 (Figure 5(a3)) primarily included information on the geological environment, for which Changzhou’s city center had a great advantage. Factor 3 (Figure 5(a4)) included information on the soil environment; Jintan had a relatively higher overall score. We generated the map on the quality of ecological space use (Figure 5(a1)); the figure showed that western Jintan, as well as southern and western Liyang, had a high overall score. Compared to other regions of Changzhou’s urban area, the northwestern part of Changzhou’s city center and the surrounding area of Lake Tai had relatively higher scores.
PCA on the quality of living space use: Factor 1 (Figure 5(b2)) chiefly represented the degree of convenience for basic infrastructure, for which Changzhou’s urban area was the most convenient, followed by Jintan. Factor 2 (Figure 5(b3)) mainly represented the population distribution, with Changzhou’s city center being the central point, and an apparent circle layered structure was displayed. Factor 3 (Figure 5(b4)) described the economic situations of urban and rural residents; on average, the sub-values of Changzhou’s urban southern areas had a higher score, while the sub-value of central Jintan was significantly higher than that of other regions in that city. Based on Figure 5(b1), we can conclude that sub-values were higher in the vicinity of the city centers of Changzhou and Jintan.
PCA on the quality of production space use. Factor 1 (Figure 5(c2)) primarily represented the intensity of development. With Changzhou’s city center as the focal point, a circle layered structure is presented. Factor 2 (Figure 5(c3)) mainly represented the conditions of agricultural production, for which the city of Liyang had the highest sub-value. Factor 3 (Figure 5(c4)) showed the level of agricultural mechanization; the scores of southeast Jintan and urban southern and western Changzhou were higher. In general (Figure 5(c1)), the quality of production space use was highest in Changzhou’s city center and vicinity, followed by the zone around Lake Tai. Compared to the quality of production space use in the surrounding area, the city centers of Jintan and Liyang had an advantage.
We used PCA to analyze a number of key aspects of the quality of use of production-living-ecology spaces. The assessment results and scores of principal components serve as a basis for subjective and objective integrated weighting.
4.2.2. Results of Subjective and Objective Integrated Weighting Based on PCA and Planning Review
Figure 6 illustrates the four steps for subjective and objective integrated weighting. For the details, refer to Appendix B
- (1)
- Selection of planning: Focusing on the different characteristics and assessment needs of national territory, we chose the corresponding planning policies for reviewing elements and factors.
- (2)
- Initial ranking of elements and factors: By combining the various index systems for planning and the effect of planning on the positioning of national territory use in Changzhou, we generated the element and factor ranking results under different planning policies.
- (3)
- Ranking of planning: We ranked the planning policies according to their legal statuses and implementation strength, as well as the strength of improving quality with respect to different uses of national territory.
- (4)
- Integrated ranking of elements and factors: Based on 1 and 2, we obtained integrated ranking results of elements and factors on the quality of use of production-living-ecology spaces and national territory, as well as the ranking result of the 27 single factors.
After obtaining the integrated ranking results of elements and factors for the quality of use of production-living-ecology spaces and national territory, we generated 27 single factors for ranking results. We made adjustments for the PCA outcomes based on review results and confirmed the weighting of elements and factors via subjective and objective integration (as shown in Table 4).
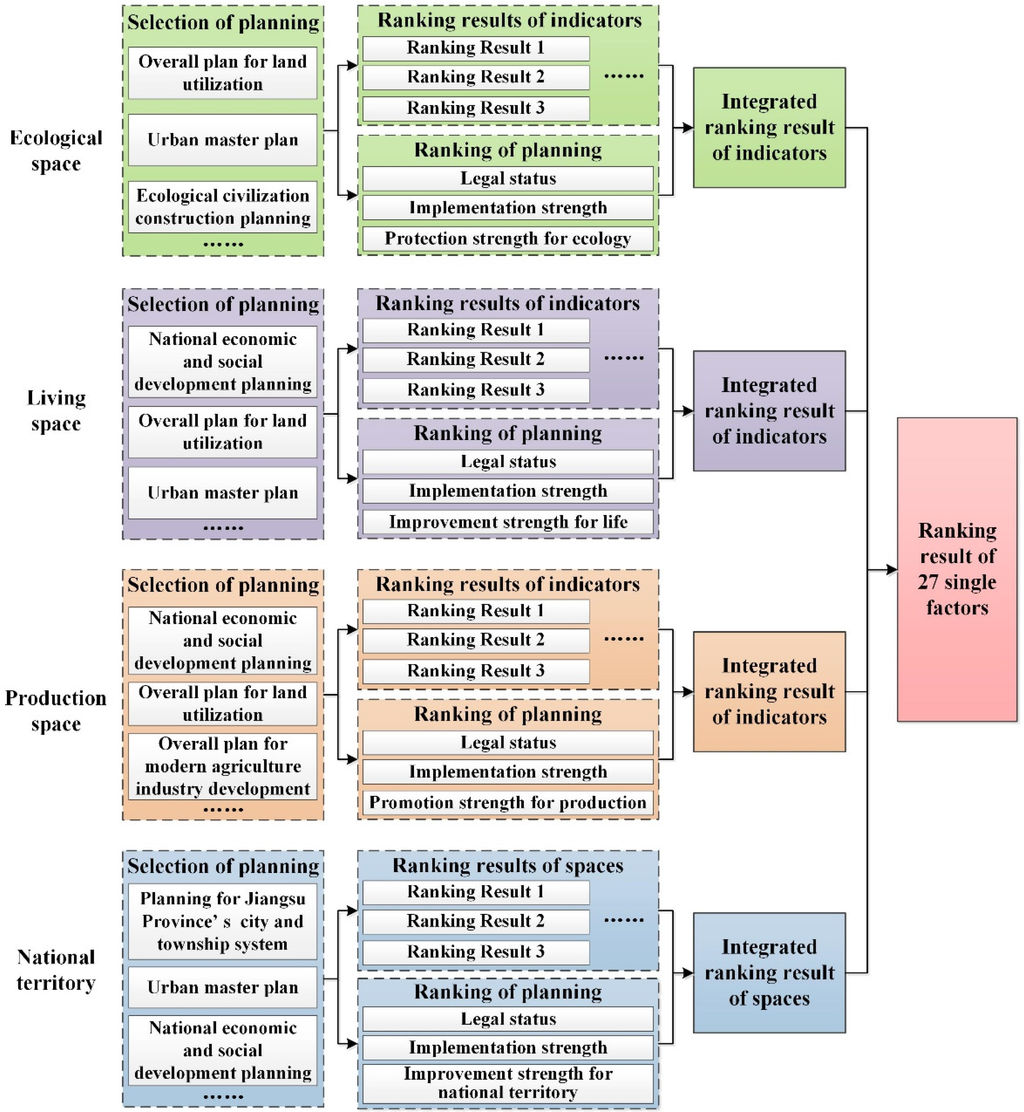
Figure 6.
Subjective weighting based on planning review.
Table 4.
Weights of elements and factors.
| Element Layer | Weights | Factor Layer | Weights |
|---|---|---|---|
| Quality of ecological space use | 0.3307 | Forest coverage rate | 0.0365 |
| Grass coverage rate | 0.0345 | ||
| Percentage of wetlands | 0.0305 | ||
| Elevation | 0.0365 | ||
| Slope | 0.0374 | ||
| Geological environment | 0.0414 | ||
| Soil acidity | 0.0401 | ||
| Soil organic carbon content | 0.0339 | ||
| Quality of the water environment | 0.0399 | ||
| Quality of living space use | 0.3333 | The number of educational institutions | 0.0389 |
| The number of medical institutions | 0.0380 | ||
| The number of banks | 0.0375 | ||
| The number of supermarkets | 0.0389 | ||
| Air quality | 0.0349 | ||
| Traffic accessibility | 0.0328 | ||
| Density of the population | 0.0402 | ||
| Per capita disposable income of urban residents | 0.0377 | ||
| Per capita net income of rural residents | 0.0344 | ||
| Quality of production space use | 0.3360 | Cultivated area per capita | 0.0313 |
| Soil depth | 0.0402 | ||
| Agricultural machinery power per unit area | 0.0360 | ||
| Agricultural output value per unit area | 0.0338 | ||
| Proportion of secondary and tertiary industries | 0.0404 | ||
| GDP per unit area | 0.0386 | ||
| Development intensity index | 0.0398 | ||
| Locational conditions | 0.0354 | ||
| Road density | 0.0405 |
4.3. Assessment Model and Quality Assessment
After confirming weighting, a model that evaluates the quality of national territory use was created. We used weighted summation to integrate the single factors. Then, the assessment outcomes for the quality of use of production-living-ecology spaces were obtained. Next, the integrated assessment results for national territory use were obtained (Figure 7). In order to demonstrate the spatial differences, the city was subdivided into three sub-regions: the urban area, Jintan and Liyang. According to the positioning of these regions in the key points of the 12th Five-Year Plan, we defined the urban area of Changzhou and Jintan as the production-oriented regions and Liyang as the ecology-oriented region. We performed sub-region statistics on the assessment outcomes (Figure 7) and analyzed the proportions of the quality of national territory use in each region.
Use of ecological space: Regarding the quality of ecological space use, according to Figure 7a, districts in Changzhou at Levels 1 or 2 were mainly distributed in the ecology-oriented region (Liyang) and one of the production-oriented regions (Jintan). Southern Liyang and western Jintan had significantly better quality of ecological space use. These districts had better biodiversity and conditions of ecosystem services, as well as superior soil and water environments. Districts at Levels 4 and 5 were mostly spread across another production-oriented region (the urban area). Based on the sub-region statistical results, the proportion of top-notch districts was higher in Liyang and Jintan; 56.14% of Liyang consisted of districts ranked at Levels 1 and 2, while that figure was 41.32% in Jintan.
Use of living space: According to Figure 7b, the distribution of the quality of living space use presented a stepped pattern from the urban area to Jintan and then to Liyang. The quality of life in the southeastern part of the urban area was significantly higher than in the north and west. Education and health level, the degree of convenience and the economic situation of rural and urban residents were higher in the southeastern part of the urban zone. In regards to the sub-regional statistical results, most districts in the production-oriented region (the urban area) were ranked at Levels 1 and 2, with a proportion of 93.19%; the proportion of districts at Levels 4 and 5 was higher in the ecology-oriented region (Liyang), at 97.47%. Thus, quality of life in Liyang was significantly lower compared to the two production-oriented regions.
Use of production space: According to Figure 7c, the quality of production space use had a circle layered distribution. The quality was the highest in Changzhou’s city center and vicinity. Certain aspects improved, such as locational conditions, the agricultural production rate, the degree of industry coordination and the efficiency of national territory use, followed by Jintan’s city center and Liyang’s city center. According to the sub-regional statistical results, most districts in the production-oriented regions had a high quality of production space use. Districts in the urban area ranked from Levels 1–3 comprised 96.02%. Almost no districts in Jintan were at Level 1, while the proportions between Levels 2, 3, 4 and 5 were balanced. No districts in the ecology-oriented region (Liyang) ranked at Levels 1 and 2, while the proportion of districts at Level 5 was relatively higher, at 65.18%.
Integrated use of national territory: The integrated quality of national territory use in Changzhou colligated the quality of use of production-living-ecology spaces. According to Figure 7d, the production-oriented regions had a higher quality of national territory use than the ecology-oriented region. Most of the districts at Level 1 were spread across the central and southeastern parts of the urban area, while a small number of districts were distributed along the border between the urban area and Jintan. Level 1 districts had a good ecological environment and a comfortable, convenient life, while the level of intensive use of national territory was higher. Level 5 districts were mainly spread across western Liyang. According to the sub-regional statistical results, the proportions of districts at Levels 1, 2 and 3 in the urban area were 61.41%, 29.08% and 9.52%, respectively. There were no districts at Levels 4 and 5. Jintan mainly had districts ranked at Levels 2 and 3. The proportions of districts at Levels 3, 4, and 5 in Liyang were very high.
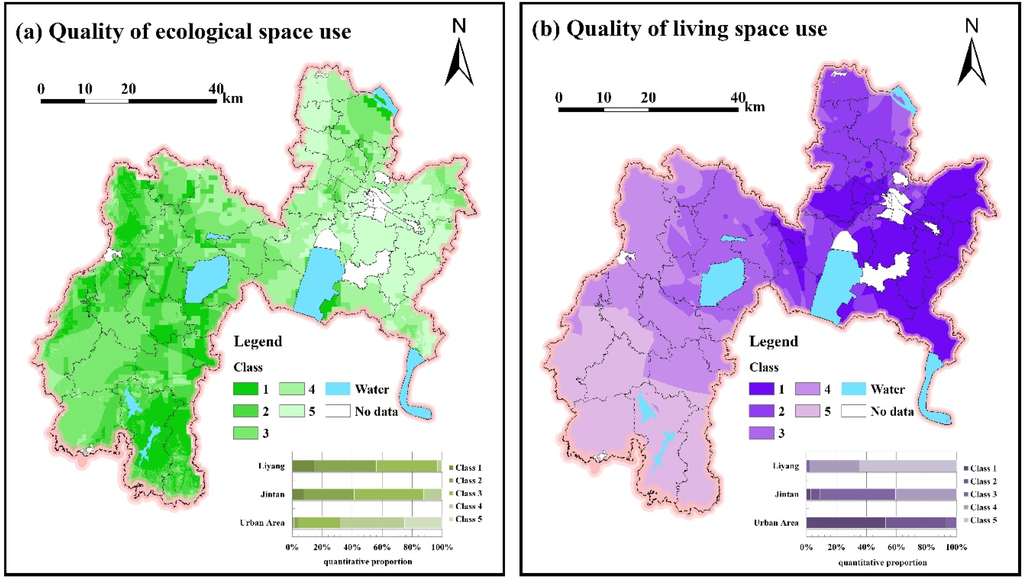
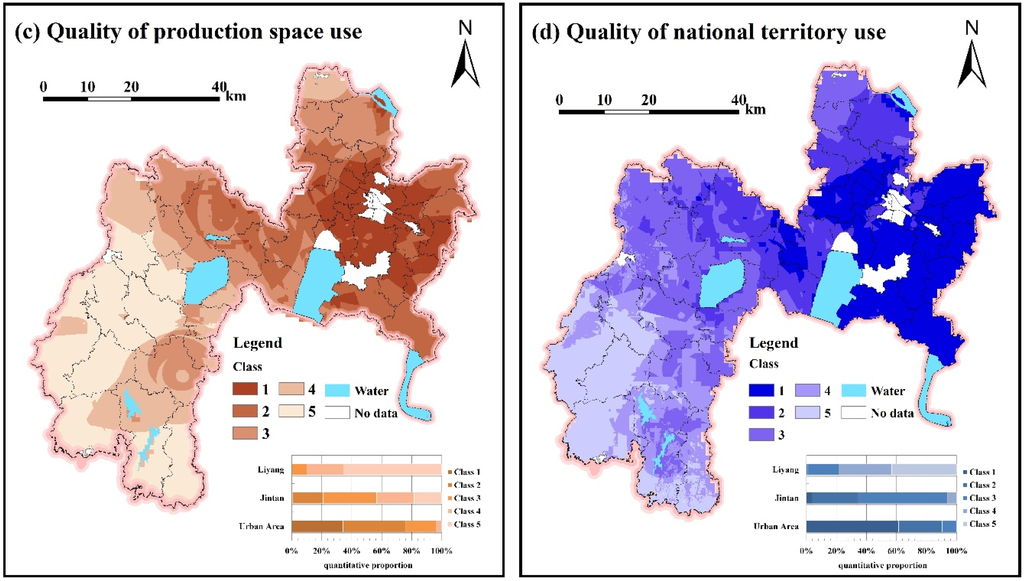
Figure 7.
Assessment results of the quality of national territory use.
5. Discussion
5.1. The Quality Assessment Index System of National Territory Use Plays a Role in Research on Enhancing the Intensive Use of Such Space
The National Plan on New Urbanization (2014–2020) requires “deepening the land management reform system, implementing the strictest cultivated land protection system, and a saving and intensive land use system” [2]. Daming Jiang, the Minister of Land and Resources, pointed out that promoting high-efficiency land allocation, as well as saving and intensive land use is necessary for developing new urbanization [4].
In theory, urbanization is a process of attaining urban-rural integration in basic infrastructure and public services. This can be conducive to the saving and intensive use of national territory [5]. Yet in reality, construction land use has grown, and the extensive use of national territorial resources is very common. This is because China has a long-held practice of relying on government investment to drive economic growth and on low-cost land to develop industries and projects, in addition to the fact that land has become an important financing tool for local governments [27,28,46].
In the quality assessment index system of national territory use in Changzhou, the saving and intensive use of production-living-ecology spaces was represented by aspects such as the degree of use, input level and output efficiency. These can provide technical methods for understanding the situation of saving and intensive use in regards to national territory. The single-factor assessment results (Figure 4) and the integrated assessment outcomes (Figure 7) provide a reference for research in improving the level of saving and intensive use of national territory. The goal is to explore suggestions and techniques for improving the level of saving and intensive use of national territory. Related policies and laws can be adjusted according to the circumstances.
For instance, rural areas of west Jintan and western and southern Liyang generally have a low quality of use of living and production spaces; in these areas, the living standards, basic infrastructure convenience and level of agricultural mechanization should be improved. Thus, the optimization techniques for rural settlement space layouts should be researched by viewing urban-rural coordination and integration as a starting point. These techniques can improve the quality of living and production spaces in rural areas and enhance the convenience of public services and basic infrastructure in rural areas (such as educational and medical hygiene conditions). Hence, farmers’ quality of life could be improved, and economic development in rural areas could be stimulated [47,48,49]. By focusing on problems such as the disorderly expansion of production and living spaces, as well as the low quality of ecological space use in Changzhou’s urban area we can apply the multi-planning integration technique to increase planning efficiency. We can do so via the strict division of a development border between cities and townships, basic farmland and an ecological protection red line. In turn, the management of national territory will be strengthened, chaotic city expansion will be controlled scientifically and farmland and the ecological environment will be rigorously protected [50,51,52]. During the process of urbanization, large numbers of migrant workers and farmers without farmland provide an important motivation for restructuring urban populations. Great challenges face the quality of use of production and living spaces in cities and towns. Transformations in rural family structure, production mode and lifestyle have affected the needs of rural living space. Faced with this situation, we can strengthen the research on allocation technology of humans and land, with a prerequisite for coordinately organizing the population, resources and environment. Technology can promote a reasonable supply of national territorial resources during the process of new urbanization [3,27].
5.2. The Quality Assessment Index System of National Territory Use Can Provide a Reference for Other Areas with Rapid Urbanization
Considering that the National Plan on New Urbanization in China (2014–2020) [2] proposed new requirements for national territory use based on production, living and ecology, in the process of building an index system, this study considered three dimensions of the quality of use of production-living-ecology spaces. In the weighting process, the spatial planning policies of Changzhou city were considered. Compared to the weights obtained by PCA, the integrated weights are more in line with the actual situation of Changzhou, which is more convincing.
The index system is applicable to Chinese cities in the Yangtze River Delta, the Pearl River Delta, Beijing-Tianjin-Hebei region and other eastern coastal regions, where the populations and extents of cities are increasing with the rapid urbanization. There is a widespread disorderly expansion of production space, uneven development of living space and degradation of the environment in ecological zones in these regions.
This assessment index system also has a significant reference value to other cities in the process of rapid urbanization in other developing countries with a low quality of national territory use, such as many cities in India. According to the United Nations, India’s urban population will increase by nearly 500 million between 2010 and 2050 [53]. Urban land expansion resulting from urban population growth has put pressure on the country's agricultural resources, and Varughese et al. (2009) [54] reported that roughly 50% of India’s land resources are degraded.
5.3. Limitations
The index system proposed in this paper includes general indicators associated with production-living-ecology spaces, in which some indicators represent regional characteristics of Changzhou. For example, taking into account the severe smog that has occurred in the central and eastern cities of China in recent years, air quality was considered in the assessment indicators of the quality of living space use. Therefore, the index system has extendibility. For example, the assessment indicators on the quality of ecological space use were based on the vegetation and natural conditions of the current study area. If the vegetation cover type in other research areas is very rich, it will be necessary to expand the index system.
However, in the specific evaluation process, the index system and the weighting process should be adjusted according to the local characteristics. Some indicators can be generic, such as elevation, slope, geological environment, access to transport, population density and a development intensity index. Some indicators cannot be completely copied, such as the percentage of wetlands, quality of the water environment, the per capita net income of rural residents or the proportion of secondary and tertiary industries. Researchers should give full consideration to local natural conditions and the industrial structure. The weighting method from the perspective of the planning review should also be combined with local planning policies in the specific application.
The present study is an evaluation of the current status of the quality of national territory use. We will carry out a comprehensive analysis of the changes in the temporal and spatial patterns in a follow-up study. Further research is needed to improve the validity of the interpretation of the planning policy during the planning review process.
6. Conclusions
This article assessed the quality of national territory use at the city level within the context of new urbanization. Based on an original subjective and objective integrated weighting method from the perspective of planning review and using the GIS spatial analysis method, an index system and a comprehensive discriminative model were created. Furthermore, the quality assessment results of national territory use were obtained and discussed. The outcomes reveal that, neither the ecology-oriented region, nor the production-oriented region achieved harmonious development of production-living-ecology spaces. The integrated quality of national territory use in the production-oriented region had a significant advantage over that of the ecology-oriented region. The integrated quality of national territory use was highest in Changzhou’s city center and vicinity.
The quality assessment model of national territory use at the city level established by this research can: (1) serve as evidence for fine-tuning the criteria of the saving and intensive use of national territorial resources; and (2) help us explore techniques to raise the level of optimal and intensive use of national territory.
Acknowledgments
This work is supported by the Special Research Fund of the Ministry of Land and Resources for Non-Profit Sector (No. 201411014-03) and the National Key Technology R & D Program of China (No. 2012BAH28B04). Sincere thanks are given for the comments and contributions of the anonymous reviewers and members of the editorial team.
Author Contributions
Both authors contributed equally to this work. In particular, Liyan Wang had the original idea for the study, and both coauthors conceived of and designed the methodology. Liyan Wang drafted the manuscript, which was revised by Feixue Li, Yuan Gong, Penghui Jiang, Qiuhao Huang, Wuyang Hong and Dong Chen. All authors have read and approved the final manuscript.
Conflicts of Interest
The authors declare no conflict of interest.
Appendix A
Table A1.
Classification of Single Factors.
| Name of Factors | Unit of Measure | Threshold Interval and Scores | ||||
|---|---|---|---|---|---|---|
| 1 (100 Points) | 2 (80 Points) | 3 (60 Points) | 4 (40 Points) | 5 (20 Points) | ||
| Forest coverage rate (0–28) | % | 20–30 | 15–20 | 10–15 | 5–10 | 0–5 |
| Grass coverage rate (0–1.22) | % | 1.0–1.3 | 0.7–1.0 | 0.4–0.7 | 0.2–0.4 | 0.0–0.2 |
| Percentage of wetlands (0–52) | % | 40–60 | 30–40 | 20–30 | 10–20 | 0–10 |
| Elevation (-20–492) | m | 0–25 | 25–50 | 50–100 | 100–200 | >200 |
| Slope (0–48) | ≤2 | 2–6 | 6–15 | 15–25 | >25 | |
| Geological environment | - | Appropriate development zone | Restraining development zone | Restoration and management zone | Protection zone | - |
| Soil acidity (0–8.9) | 1 | 6.5–7.5 | 6.0–6.5, 7.5–8.0 | 5.5–6.0, 8.0–8.5 | 4.5–5.5, 8.5–9.5 | <4.5, >9.5 |
| Soil organic carbon content (3–10) | % | >8 | 7–8 | 6–7 | 5–6 | 0–5 |
| Quality of the water environment | - | I | II | III | IV | V |
| The number of educational institutions (0–36) | a per one hundred thousand people | 30–40 | 25–30 | 20–25 | 15–20 | 0–15 |
| The number of medical institutions (0–14) | A per one hundred thousand people | 12–14 | 10–12 | 9–10 | 8–9 | 0–8 |
| The number of banks (0–142) | A per one hundred thousand people | 60–150 | 40–60 | 30–40 | 20–30 | 0–20 |
| The number of supermarkets (0–138) | A per one hundred thousand people | 110–140 | 90–110 | 60–90 | 40–60 | 0–40 |
| Air quality | - | I | II | III | - | - |
| Traffic accessibility (30–73) | h | 30–40 | 40–50 | 50–60 | 60–70 | 70–80 |
| Density of the population (460–2860) | people per km2 | >2000 | 1500–2000 | 1000–1500 | 600–1000 | 0–600 |
| Per capita disposable income of urban residents (13,000–35,000) | yuan | 30,000–35,000 | 25,000–30,000 | 20,000–25,000 | 15,000–20,000 | 13,000–15,000 |
| Per capita net income of rural residents (16,000–19,000) | yuan | 18,000–18,600 | 17,600–18,000 | 17,300–17,600 | 17,100–17,300 | 16,000–17,100 |
| Cultivated area per capita (0–0.1239) | ha | 0.100–0.125 | 0.075–0.100 | 0.050–0.075 | 0.025–0.050 | 0–0.025 |
| Soil depth (0–100) | cm | 80–100 | 60–80 | 40–60 | 20–40 | 0–20 |
| Agricultural machinery power per unit area (10–1000) | kw per km2 | 500–1000 | 400–500 | 300–400 | 200–300 | 0–200 |
| Agricultural output value per unit area (200–1400) | 10,000 yuan per km2 | 1000–1400 | 800–1000 | 700–800 | 600–700 | 0–600 |
| Proportion of secondary and tertiary industries (77–100) | % | 95–100 | 90–95 | 85–90 | 80–85 | 75–80 |
| GDP per unit area (2800–42500) | 10,000 yuan per km2 | 32,000–43,000 | 24,000–32,000 | 16,000–24,000 | 8000–16,000 | 3000–8000 |
| Development intensity index (10–80) | % | 60–80 | 40–60 | 30–40 | 20–30 | 10–20 |
| Locational conditions (0–75) | km | 0–10 | 10–20 | 20–30 | 30–50 | 50–80 |
| Road density (0–1.20) | km per km2 | 0.70–1.20 | 0.60–0.70 | 0.50–0.60 | 0.40–0.50 | 0.00–0.40 |
Appendix B: Details of Subjective Weighting Based on Planning Review
- The main considerations for the quality assessment of ecological space use in Changzhou consisted of the overall plan for land utilization (2006–2020), the urban master plan (2011–2020) and secondary considerations for the ecological civilization construction planning. The overall plan for land utilization (2006–2020) divides Changzhou’s urban areas into different functional zones, where the appraisal of the degree of land ecological protection included the weighting for individual elements and factors. The planning sections for ecological and environmental protection within the urban master plan (2011–2020) also divided Changzhou into four ecological sectors according to relevant criteria. The ecological civilization construction planning depicted the importance of key items for assessing the environmental quality of dimensions, such as water, air, noise and soil. The index system for ecological protection also included the different ratio indicators of ecological land use, such as water sources, forest and wetlands. By summing up the effects of the aforementioned preparation for positioning the assessment factors related to Changzhou’s ecological space, we obtained ranking results for the geological environment, soil acidity, the quality of the water environment, slope, forest coverage rate, elevation, grass coverage rate, soil organic carbon content and the percentage of wetlands.
- The main considerations for the quality assessment of living space use in Changzhou were the key points of the 12th Five-Year Plan for National Economic and Social Development (“12th Five-Year Plan”), followed by secondary considerations for the overall plan for land utilization (2006–2020) and the urban master plan (2011–2020). Within the key points of the 12th Five-Year Plan, the index system for livelihood and happiness stipulated different requirements for the various predictive and constraining indicators; for example, income per capita of rural and urban residents, schooling rate, the number of hospital beds/1000 people and the natural population growth rate. The overall plan for land utilization (2006–2020) divided Changzhou into different land use functional zones, where the assessment of the suitability for land development included the weighting of various factors. In the urban master plan (2011–2020), the criteria and index system for planning the use of residential land and public facilities stipulated different requirements for living conditions, population density, living standards, public service facilities and transport systems. By summing up the aforementioned preparation for positioning the assessment factors of Changzhou’s living spaces, we generated an integrated ranking: population density, the number of educational institutions, supermarkets, banks and medical institutions, per capita disposable income of urban residents, air quality, per capita net income of rural residents and traffic accessibility.
- The primary considerations for the quality assessment of production space use were the key points of the 12th Five-Year Plan and the overall plan for land utilization (2006–2020), followed by secondary considerations for the overall plan for modern agriculture industry development. The key points listed major development goals such as GDP and the ratio of different industries. The index system of the total predicted volume and structural adjustment contributed to different predictive and constraining requirements for GDP, as well as the ratio between secondary and tertiary industries and the proportion of agriculture. The assessment for the suitability of land development in the overall plan for land utilization (2006–2020) included the weighting of various factors. The overall plan for modern agriculture industry development provided a detailed description of the requisites of contemporary agricultural growth and functional positioning. By summing up the aforementioned design of the positioning of the factors that assess Changzhou’s production space, we obtained integrated ranking results for road density, the proportion of secondary and tertiary industries, soil depth, the development intensity index, GDP per unit area, agricultural machinery power per unit area, locational conditions, agricultural output value per unit area and cultivated area per capita.
- The chief considerations for the integrated quality of national territory use is included in the planning for Jiangsu Province’s city and township system (2012–2030), followed by secondary considerations for Changzhou’s urban master plan (2011–2020) and the key points of the 12th Five-Year Plan. The scheme for Jiangsu Province’s city and township system (2012–2030) presented Changzhou as an advanced, national manufacturing center, a key logistic base of the Yangtze River Delta Region, a renowned cultural tourism city and a central metropolis of the Suxichang Megaregion. The urban master plan (2011–2020) listed Changzhou’s urban characteristics as being a main metro in the Yangtze River Delta Region, a trailblazing, national manufacturing center and an acclaimed cultural tourism city. The aims of development described Changzhou as an economic powerhouse where modern manufacturing industries would boom, people would live prosperously, a famous cultural city with historical traits, modern science and education, a regional hinterland city connecting east and west, north and south and a metropolis that is people-centered, where humans coexist harmoniously with nature. The key points of the 12th Five-Year Plan stated that the city should become a place for innovative business start-ups, with modern production. In addition, the key points stipulated that the city should be ecologically livable. By encapsulating the aforementioned design for the positioning of national space and functions in Changzhou, we carried out a ranking on the quality of use of production-living-ecology spaces.
References
- Jin, G. Study on Comprehensive Function Regionalization of National Spatial Territory: A Case Study of Wuhan Metropolitan Area; China University of Geosciences: Wuhan, China, 2014. (In Chinese) [Google Scholar]
- National New-Type Urbanization Plan (2014–2020). Available online: http://www.gov.cn/zhengce/2014-03/16/content_2640075.htm (accessed on 11 March 2015). (In Chinese)
- Study and Implement the National New-Type Urbanization Plan (2014–2020). Available online: http://www.gtzyb.com/zhengcejiedu/20140408_61568.shtml (accessed on 8 April 2015). (In Chinese)
- Support the Transformation and Development of Urbanization through Land Saving and Intensive Use and Hold the Bottom Line and Principles of Land Management System Reform. Available online: http://www.mlr.gov.cn/xwdt/jrxw/201306/t20130625_1231657.htm (accessed on 4 November 2015). (In Chinese)
- Ding, C.R. Building height restrictions, land development and economic costs. Land Use Policy 2013, 30, 485–495. [Google Scholar] [CrossRef]
- Wu, Y.Z.; Zhang, X.L.; Shen, L.Y. The impact of urbanization policy on land use change: A scenario analysis. Cities 2011, 28, 147–159. [Google Scholar] [CrossRef]
- Gong, J.Z.; Chen, W.L.; Liu, Y.S.; Wang, J.Y. The intensity change of urban development land: Implications for the city master plan of Guangzhou, China. Land Use Policy 2014, 40, 91–100. [Google Scholar] [CrossRef]
- Hui, E.C.M.; Wu, Y.Z.; Deng, L.J.; Zheng, B.B. Analysis on coupling relationship of urban scale and intensive use of land in China. Cities 2015, 42, 63–69. [Google Scholar] [CrossRef]
- Xu, Z.; Li, Q.M. Integrating the empirical models of benchmark land price and GIS technology for sustainability analysis of urban residential development. Habitat Int. 2014, 44, 79–92. [Google Scholar] [CrossRef]
- Cornforth, I.S. Selecting indicators for assessing sustainable land management. J. Environ. Manag. 1999, 56, 173–179. [Google Scholar] [CrossRef]
- Hurni, H. Assessing sustainable land management (SLM). Agric. Ecosyst. Environ. 2000, 81, 83–92. [Google Scholar] [CrossRef]
- Munda, G. Social multi-criteria evaluation for urban sustainability policies. Land Use Policy 2006, 23, 86–94. [Google Scholar] [CrossRef]
- Musakwa, W.; Niekerk, A.V. Implications of land use change for the sustainability of urban areas: A case study of Stellenbosch, South Africa. Cities 2013, 32, 143–156. [Google Scholar] [CrossRef]
- Weiland, U.; Kindler, A.; Banzhaf, E.; Ebert, A.; Reyes-Paecke, S. Indicators for sustainable land use management in Santiago de Chile. Ecol. Indic. 2011, 11, 1074–1083. [Google Scholar] [CrossRef]
- Yang, Z.S.; Liu, Y.S.; Tao, W.X.; Xu, J.J.; Zhao, Q.G. Method for evaluating the degrees of land use sustainability of mountainous county and its application in Yunnan Province, China. J. Mt. Sci. 2008, 5, 98–112. [Google Scholar] [CrossRef]
- Zhang, X.L.; Wu, Y.Z.; Shen, L.Y. An evaluation framework for the sustainability of urban land use: A study of capital cities and municipalities in China. Habitat Int. 2011, 35, 141–149. [Google Scholar] [CrossRef]
- Yang, J.Y.; Yang, Y.; Tang, W. Development of evaluation model for intensive land use in urban centers. Front. Archit. Res. 2012, 1, 405–410. [Google Scholar] [CrossRef]
- Collins, M.G.; Steiner, F.R.; Rushman, M.J. Land-use suitability analysis in the United States: Historical development and promising technological achievements. Environ. Manag. 2001, 28, 611–621. [Google Scholar] [CrossRef] [PubMed]
- Hopkins, L.D. Methods for generating land suitability maps—Comparative evaluation. J. Am. Inst. Plan. 1977, 43, 386–400. [Google Scholar] [CrossRef]
- Malczewski, J. GIS-based land-use suitability analysis: A critical overview. Prog. Plan. 2004, 62, 3–65. [Google Scholar] [CrossRef]
- Jankowski, P. Integrating geographical information-systems and multiple criteria decision-making methods. Int. J. Geogr. Inf. Syst. 1995, 9, 251–273. [Google Scholar] [CrossRef]
- Liu, R.; Zhang, K.; Zhang, Z.; Borthwick, A.G. Land-use suitability analysis for urban development in Beijing. J. Environ. Manag. 2014, 145, 170–179. [Google Scholar] [CrossRef] [PubMed]
- Elaalem, M. A comparison of parametric and fuzzy multi-criteria methods for evaluating land suitability for olive in Jeffara Plain of Libya. APCBEE Procedia 2013, 5, 405–409. [Google Scholar] [CrossRef]
- Ligmann-Zielinska, A.; Jankowski, P. Spatially-explicit integrated uncertainty and sensitivity analysis of criteria weights in multicriteria land suitability evaluation. Environ. Model. Softw. 2014, 57, 235–247. [Google Scholar] [CrossRef]
- Xu, E.; Zhang, H.Q. Spatially-explicit sensitivity analysis for land suitability evaluation. Appl. Geogr. 2013, 45, 1–9. [Google Scholar] [CrossRef]
- Long, H.L.; Li, Y.R.; Liu, Y.S.; Woods, M.; Zou, J. Accelerated restructuring in rural China fueled by ‘increasing vs. decreasing balance’ land-use policy for dealing with hollowed villages. Land Use Policy 2012, 29, 11–22. [Google Scholar]
- Wang, X.R.; Hui, E.C.M.; Choguill, C.; Jia, S.H. The new urbanization policy in China: Which way forward? Habitat Int. 2015, 47, 279–284. [Google Scholar] [CrossRef]
- Wang, Y.H. Study on the intensive use of urban land—A case study of hill area in the middle of Sichuan Province. Energy Procedia 2011, 5, 85–89. [Google Scholar]
- Akıncı, H.; Özalp, A.Y.; Turgut, B. Agricultural land use suitability analysis using GIS and AHP technique. Comput. Electron. Agric. 2013, 97, 71–82. [Google Scholar] [CrossRef]
- Jozi, S.A.; Ebadzadeh, F. Application of multi-criteria decision-making in land evaluation of agricultural land use. J. Indian Soc. Remote Sens. 2014, 42, 363–371. [Google Scholar] [CrossRef]
- Hosseini, H.M.; Kaneko, S. Dynamic sustainability assessment of countries at the macro level: A principal component analysis. Ecol. Indic. 2011, 1, 811–823. [Google Scholar] [CrossRef]
- Singh, R.K.; Murty, H.R.; Gupta, S.K.; Dikshit, A.K. An overview of sustainability assessment methodologies. Ecol. Indic. 2012, 15, 281–299. [Google Scholar] [CrossRef]
- National Bureau of Statistics of China. China Population & Employment Statistics Yearbook; China Statistics Press: Beijing, China, 2013. (In Chinese)
- Changzhou Statistical Bureau. Changzhou Statistical Yearbook; China Statistics Press: Changzhou, China, 2013. (In Chinese)
- Li, G.; Weng, Q. Measuring the quality of life in city of Indianapolis by integration of remote sensing and census data. Int. J. Remote Sens. 2007, 28, 249–267. [Google Scholar] [CrossRef]
- Romano, G.; Dal Sasso, P.; Trisorio Liuzzi, G.; Gentile, F. Multi-criteria decision analysis for land suitability mapping in a rural area of Southern Italy. Land Use Policy 2015, 48, 131–143. [Google Scholar] [CrossRef]
- Marans, R.W. Quality of urban life & environmental sustainability studies: Future linkage opportunities. Habitat Int. 2014, 45, 47–52. [Google Scholar]
- Discoli, C.; Martini, I.; San Juan, G.; Barbero, D.; Dicroce, L.; Ferreyro, C.; Esparza, J. Methodology aimed at evaluating urban life quality levels. Sustain. Cities Soc. 2014, 10, 140–148. [Google Scholar] [CrossRef]
- Rinner, C. A geographic visualization approach to multi-criteria evaluation of urban quality of life. Int. J. Geogr. Inf. Sci. 2007, 21, 907–919. [Google Scholar] [CrossRef]
- Xu, Y.; Tang, Q.; Fan, J.; Bennett, S.J.; Li, Y. Assessing construction land potential and its spatial pattern in China. Landsc. Urban Plan. 2011, 103, 207–216. [Google Scholar] [CrossRef]
- Joseph, M.; Wang, F.; Wang, L. GIS-based assessment of urban environmental quality in Port-au-Prince, Haiti. Habitat Int. 2014, 41, 33–40. [Google Scholar] [CrossRef]
- Radford, K.G.; James, P. Changes in the value of ecosystem services along a rural–urban gradient: A case study of Greater Manchester, UK. Landsc. Urban Plan. 2013, 109, 117–127. [Google Scholar] [CrossRef]
- Ying, X.; Zeng, G.M.; Chen, G.Q.; Tang, L.; Wang, K.L.; Huang, D.Y. Combining AHP with GIS in synthetic evaluation of eco-environment quality—A case study of Hunan Province, China. Ecol. Model. 2007, 209, 97–109. [Google Scholar] [CrossRef]
- Lawler, J.J.; Lewis, D.J.; Nelson, E.; Plantinga, A.J.; Polasky, S.; Withey, J.C.; Helmers, D.P.; Martinuzzi, S.; Pennington, D.; Radeloff, V.C. Projected land-use change impacts on ecosystem services in the United States. Proc. Natl. Acad. Sci. USA 2014, 111, 7492–7497. [Google Scholar] [CrossRef] [PubMed]
- Tian, Y.; Jim, C.Y.; Wang, H. Assessing the landscape and ecological quality of urban green spaces in a compact city. Landsc. Urban Plan. 2014, 121, 97–108. [Google Scholar] [CrossRef]
- Kong, W.H.; Wang, R.; Wang, Y.; Cao, J.R. Research and practice of intensive use of land based on the fuzzy evaluation. Procedia Environ. Sci. 2011, 10, 1502–1508. [Google Scholar] [CrossRef]
- Conrad, C.; Rudloff, M.; Abdullaev, I.; Thiel, M.; Löw, F.; Lamers, J.P.A. Measuring rural settlement expansion in Uzbekistan using remote sensing to support spatial planning. Appl. Geogr. 2015, 62, 29–43. [Google Scholar] [CrossRef]
- Song, W.; Liu, M.L. Assessment of decoupling between rural settlement area and rural population in China. Land Use Policy 2014, 39, 331–341. [Google Scholar] [CrossRef]
- Tan, M.H.; Li, X.B. The changing settlements in rural areas under urban pressure in China: Patterns, driving forces and policy implications. Landsc. Urban Plan. 2013, 120, 170–177. [Google Scholar] [CrossRef]
- Hu, S.G.; Tong, L.Y.; Frazier, A.E.; Liu, Y.S. Urban boundary extraction and sprawl analysis using Landsat images: A case study in Wuhan, China. Habitat Int. 2015, 47, 183–195. [Google Scholar] [CrossRef]
- Long, H.L.; Liu, Y.Q.; Hou, X.G.; Li, T.T.; Li, Y.R. Effects of land use transitions due to rapid urbanization on ecosystem services: Implications for urban planning in the new developing area of China. Habitat Int. 2014, 44, 536–544. [Google Scholar] [CrossRef]
- Deng, X.Z.; Huang, J.K.; Rozelle, S.; Zhang, J.P.; Li, Z.H. Impact of urbanization on cultivated land changes in China. Land Use Policy 2015, 45, 1–7. [Google Scholar] [CrossRef]
- United Nations. World Urbanization Prospects the 2011 Revision; Department of Economic and Social Affairs, United Nations: New York, NY, USA, 2012. [Google Scholar]
- Varughese, G.; Lakshmi, K.; Kumar, A.; Rana, N. State of Environment Report: India, 2009; Ministry of Environment & Forests Government of India: New Delhi, India, 2009.
© 2016 by the authors; licensee MDPI, Basel, Switzerland. This article is an open access article distributed under the terms and conditions of the Creative Commons by Attribution (CC-BY) license (http://creativecommons.org/licenses/by/4.0/).