Article

Emerging Development Pathways of Urban Livestock Production in Rapidly Growing West Africa Cities

Group Animal Husbandry in the Tropics and Subtropics, University of Kassel and Georg-August-Universitaet Goettingen, Steinstr. 19, 37213 Witzenhausen, Germany
*
Author to whom correspondence should be addressed.
Sustainability 2016, 8(11), 1199; https://doi.org/10.3390/su8111199
Submission received: 1 September 2016 / Revised: 15 November 2016 / Accepted: 16 November 2016 / Published: 19 November 2016
(This article belongs to the Special Issue Sustainable Agriculture and Development)

Abstract

:
In this study, we try to capture the degree of specialization or integration, and of intensification or extensification, of (peri-) urban livestock production, along with the factors that influence such decisions and their impact on natural resource uses. A total of 181 and 187 structured questionnaires were completed in livestock-keeping households in Ouagadougou (Burkina Faso) and Tamale (Ghana). Categorical principal component and two-step cluster analysis were used to identify homogenous groups of livestock-keeping households. Cross tabulation and logistic regression analysis revealed factors that influence livestock husbandry, showing their impacts on resource use by livestock keepers in the two cities. A diversity of livestock species was kept, mostly integrated with crop farming. Yet, some households specialized in either sheep, pig or commercial milk production, and partly intensified their production. The decision to specialize and/or intensify livestock production is site-specific and influenced by the education level of the household head and security of land ownership. Higher inputs in livestock systems do not necessarily lead to higher outputs, and specialization inevitably leads to higher manure wastages. Therefore, links of livestock producers to crop farmers and markets for livestock manure must be strengthened to enable recycling of resources and limit negative externalities of specialized livestock production. Strategies need to be identified to improve livestock productivity by enhancing outputs as input use increases.

1. Introduction

The increasing demand for livestock products in developing countries is mainly driven by urbanization, a notable growth in population and increasing incomes [1,2]. Urbanization has been associated with changes in lifestyle, particularly with people consuming more animal-derived foods [1,3]. Given the often poor rural infrastructure, a very dynamic urban and peri-urban livestock production sector has evolved in many African countries [4,5,6]. Several factors such as geographical location, livestock species and numbers, socio-economic background of livestock keepers and livestock management are important determinants of the diversity of urban and peri-urban livestock farm types [7,8,9]. According to [10], urban livestock keeping is small-scale, often dominated by poultry, pigs and pet animals such as rabbits, and the space devoted to animals is relatively small [11]. Animals are fed on food wastes from the household, restaurants and communal institutions, as well as from industrial processes of e.g., breweries or canning factories [10]. Abdulkadir et al. [4] identified households in Kano (Nigeria), Sikasso (Mali) and Bobo Dioulasso (Burkina Faso) that predominantly managed small ruminants in an extensive way, being integrated with commercial gardening or crop production. On the other hand, livestock production in and around cities is increasingly commercially oriented including large holdings/herds and different livestock species, as shown by [5] for the same cities. Particularly farms with cattle increase inputs into livestock feeding, turning from the traditional grazing system towards zero-grazing with concentrate feeding. In Bobo Dioulasso, specialized (semi-) intensive landless beef cattle farms have been developing in intra-urban areas, while peri-urban cattle production is mostly oriented towards milk production, still relying on grazing and integrating milk with crop production [12]. In Pakistan, the high demand of urban dwellers for milk resulted in the establishment of intensive commercial dairy buffalo farms in urban and peri-urban areas [13]. Especially in many Asian and African countries, livestock production has shifted from extensive ruminant production in rural areas to intensive pig and poultry production in peri-urban areas, close to feed markets and consumers [14].
The present study aimed at systematically analyzing the degree of specialization or integration, and of intensification or extensification of urban livestock production, along with factors that may influence such management decisions and their impact on resource use of livestock keepers. We hypothesized that livestock production in the periphery of cities is dominated by dairy cattle as well as by pig and poultry production. These systems are intensifying due to their proximity to urban markets for purchasing inputs and selling products to traders/retailers and consumers, and availability of grazing land for herbivore livestock in the transitional zone between urban centers and rural areas. We further postulated that livestock production in urban areas is mostly extensive and integrates small livestock keeping with other income-generating activities.
Following the conceptional framework suggested in [15], we defined livestock intensification as an increase in the use of external production factors, in our case labor, purchased feeds, animal health care, improved animal housing as well as breeding management. Extensification of livestock production, in contrast, is reflected in the limited use of the mentioned production factors. According to [16], crop and livestock activities are integrated if population density increases and land becomes scarce, while specialized livestock production is more common in areas with low population density and therefore more available land for livestock keeping. Through the integration of cropping and livestock keeping, recycling of resources is enabled: Crop residues are used as animal feed and manure as crop fertilizer. Specialization, i.e., the focus on one livestock species or livestock product such as dairy cattle, amplifies negative environmental impacts of livestock production. This study provides a starting point for further in-depth analyses of the use of resources by urban livestock producers in fast growing West African cities. Finally, we hope that it advances the knowledge for the development of appropriate optimization strategies for an economically viable and ecologically sound urban livestock production for livestock keepers, extensionists, researchers (scientists) and policy makers.

2. Materials and Methods

2.1. Study Locations

To complement earlier studies on urban livestock farming in West Africa, we selected one capital and one secondary city in the Sudano-Sahelian zone. This zone currently experiences a particularly high population growth and urbanization [17] due to immigration of people from the more rural and politically increasingly insecure (northern) Sahelian zone. Ouagadougou (OUA) is the capital of Burkina Faso. The rainy season stretches from June to September; the annual rainfall is about 808 mm. The dry season runs from October to May. Average daily temperature is lowest in December and January with no rainfall [18]. The municipality (commune urbaine) of Ouagadougou is divided in 12 districts (arrondissements) and 55 sectors and villages (secteurs et villages), forming together the urban and peri-urban area and covering a surface of about 318 km2. In 2012, the population size of Ouagadougou was estimated at 1.9 million [19]. Tamale (TAM) Metropolis is one of the 26 districts of Ghana and the capital of the country’s Northern Region. It is divided into 115 communities. The land size of the metropolis is approximately 647 km2. According to the 2010 Population and Housing Census, Tamale Metropolitan Area hosts a population of 371,351, of which the majority (80.8%) is living in urban communities [20]. The dry season lasts from November to March and the rainy season from April to October. The average annual temperature is 27.9 °C. The average annual rainfall is higher than in Ouagadougou (1082 mm) [18].

2.2. Sampling Approach and Data Collection

Lists of livestock keepers provided by public institutions, livestock farmers’ associations and extension workers were used to randomly select 13 out of 55 sectors in OUA and 15 out of 115 communities in TAM by probability proportional to size (PPS) sampling. In each selected sector (OUA) or community (TAM), market-oriented livestock keepers were stratified according to livestock species kept, i.e., ruminant vs. non-ruminant farms. Market orientation was defined as the keeping of livestock primarily for commercial purposes. Simple random sampling was then applied to select 10 households per community (TAM), 5 out of each stratum. In OUA, 10 households were selected for 12 sectors and 20 households for the 13th sector because of the higher number of households in that sector as compared to the other sectors. This resulted in 140 households in OUA and 150 households in TAM. In addition, 41 and 37 households which owned at least 5 tropical livestock units (TLU; 1 TLU represents 0.8 cattle, 0.2 pigs, 0.1 sheep or goats and 0.01 poultry; [12]) were included from a precedent survey of the GlobE—UrbanFoodPlus project [21] within which the present study was also realized. Hence, a total of 181 and 187 households were interviewed in OUA and TAM, respectively. Interviews were conducted from January to April 2014 using a semi-structured questionnaire to collect data related to household socio-economic characteristics, farm assets, crop production, livestock ownership and management, as well as livestock in- and offtakes in the last 12 months, covering the last dry and rainy season to account for seasonal differences in inputs and outputs (Appendix A). The questionnaire was developed based on former research in the study area, thereby relating to the conceptional framework [15] and the above hypotheses. The interviews were conducted in English (Tamale) or French (Ouagadougou), respectively, with the help of trained local assistants who interpreted into the local languages (Dagbani in Tamale, Moré in Ouagadougou) if needed.

2.3. Statistical Analyses

After screening for consistency and completeness of data, 175 (TAM) and 157 (OUA) households remained for the categorical principal component analysis (catPCA) and two-step cluster analysis. The latter was used to classify livestock keeping households into homogenous clusters. Classification was done separately for each city to reduce the need for aggregation and to avoid loss of information. In total, 29 potential classification variables were pre-selected for catPCA, including socio-economic variables, farm characteristics and livestock related variables (Supplementary Table S1). Variables were tested for correlations. Spearman correlation test (correlation coefficient of ≥0.7 as benchmark) was used to assess the independence of continuous variables, η2 statistics served to estimate the effect sizes between nominal (independent) and continuous (dependent) variables (benchmark of 0.25 as suggested by [22]) and the strength of the association between nominal variables was measured by Cramer’s V using a benchmark of ≥0.7. The significance level for correlations was set at p < 0.01. The exclusion of strongly correlated variables finally resulted in 24 (OUA) and 20 (TAM) variables used for catPCA (Supplementary Table S1). The number of dimensions was set at a default value of 2 [23]. Variables with a loading score ≥0.5 on one of the two components were retained as the most discriminating ones for the subsequent two-step cluster analysis. The last step resulted in the exclusion of variables that do not explain heterogeneity in livestock keeping households and are therefore not useful in differentiating groups of livestock keeping households. It does by no means ignore the importance of removed variables, such as sheep and goats that are widely used by (peri-) urban households. They are summarized in Supplementary Table S1. Several cluster solutions were explored. The variables with the lowest impact on cluster creation were eliminated. The final cluster solution was selected based on a sound equilibrium between the number of variables and the cluster quality (“silhouette measure of cohesion and separation”; [24]). The silhouette value is a measure of how similar an object is to its own cluster (cohesion) compared to other clusters (separation) and ranges from −1 to 1. A high value indicates that an object matches well to its own cluster but poor to other clusters [25]. For OUA, the best cluster solution was found with 6 variables and 4 clusters with a silhouette measure of cohesion and separation of 0.5 (goodness-of-fit statistics BIC = 1042.69). For TAM, the best cluster solution included 5 variables and 4 clusters (silhouette measure of cohesion and separation of 0.6, BIC = 734.29). The cluster-determining variables are summarized in Figure 1 (OUA) and Figure 2 (TAM). Simple descriptive statistics were used to characterize households in each cluster and to derive names for the clusters. After two-step cluster analysis, another three outliers were removed from TAM dataset.
This resulted in 329 households that were subjected to binary logistic regression and cross tabulation to capture characteristics of livestock production within and across cities, to identify influential factors and to examine their impacts on the use of feed and manure. For binary logistic regression, we used the default method of Enter to assess the odds of livestock keepers’ involvement in crop farming (yes/no), production of milk (yes/no), application of animal health care practices in the last 12 months (yes/no), keeping of animals in barns (yes/no) and application of controlled mating (yes/no) from a set of independent predictor variables. The latter included city, location within the city (urban, peri-urban), education level of the household head, available household labor force, land ownership and number of TLU owned. Land ownership had three levels, namely land title (land used for livestock activities was owned by the household, the household had a written land title), allocated land (the land where animals were kept had been allocated to the household by the local leadership) and borrowed/rented land (the household used a piece of land for animal activities that was borrowed or rented from the owner of the land). Labor force was calculated according to the definition of the International Labor Organization of working age groups which excludes persons younger than 16 years, and by applying the following conversion factors: 1.0 for males aged 16 to 55 years, 0.75 for females between 16 and 55 years, 0.75 for males above 55 years and 0.5 for females above 55 years.
The main occupation of the household head was self-assessed, whereby interviewees distinguished between livestock keeper, crop-livestock farmer, self-employment off-farm (e.g., butcher, trader, and entrepreneur), private employment off-farm, employment as public servant and retired. It served cross tabulation to identify if livestock keepers specialized and/or intensified livestock production. Intensification of feeding management (grazing/free range, stall feeding) was assessed through cross tabulation since minor statistical differences did not allow the use of binary logistic regression. The majority of household heads were men (93.0% in OUA, 98.3% in TAM), who were on average 51.9 ± 12.01 years old in OUA and 50.3 ± 12.92 years old in TAM, with no differences between cities and clusters within cities (p > 0.05). Therefore, these variables were not considered as predictor variables for cross tabulation and logistic regression.
Multicollinearity of predictor variables was tested with Spearman correlation test, using a correlation coefficient threshold of ≥0.7. Fisher’s exact test was used as statistical significance test for cross tabulation, and Kruskal-Wallis test by rank was used to assess statistical differences for scale variables between clusters within the same city and between cities. Significance was declared at p < 0.05.

3. Results

We structured the results as follows: In the first two Section 3.1 and Section 3.2, the outcomes from the two-step cluster analysis and simple descriptive statistics to characterize households in each cluster are presented. Differences between the clusters within OUA and TAM are emphasized. In Section 3.3 and Section 3.4, factors that influence the decision to specialize or integrate and to intensify or extensify livestock production are described, comparing households within and between the clusters. Furthermore, the impacts of such decisions on the use of feed and manure by (peri-) urban livestock producers (Section 3.5) are explained. The main outcomes are in detail depicted in tables and figures. Interesting secondary results are summarized in the form of text.

3.1. Identified Types of Livestock Keepers in OUA

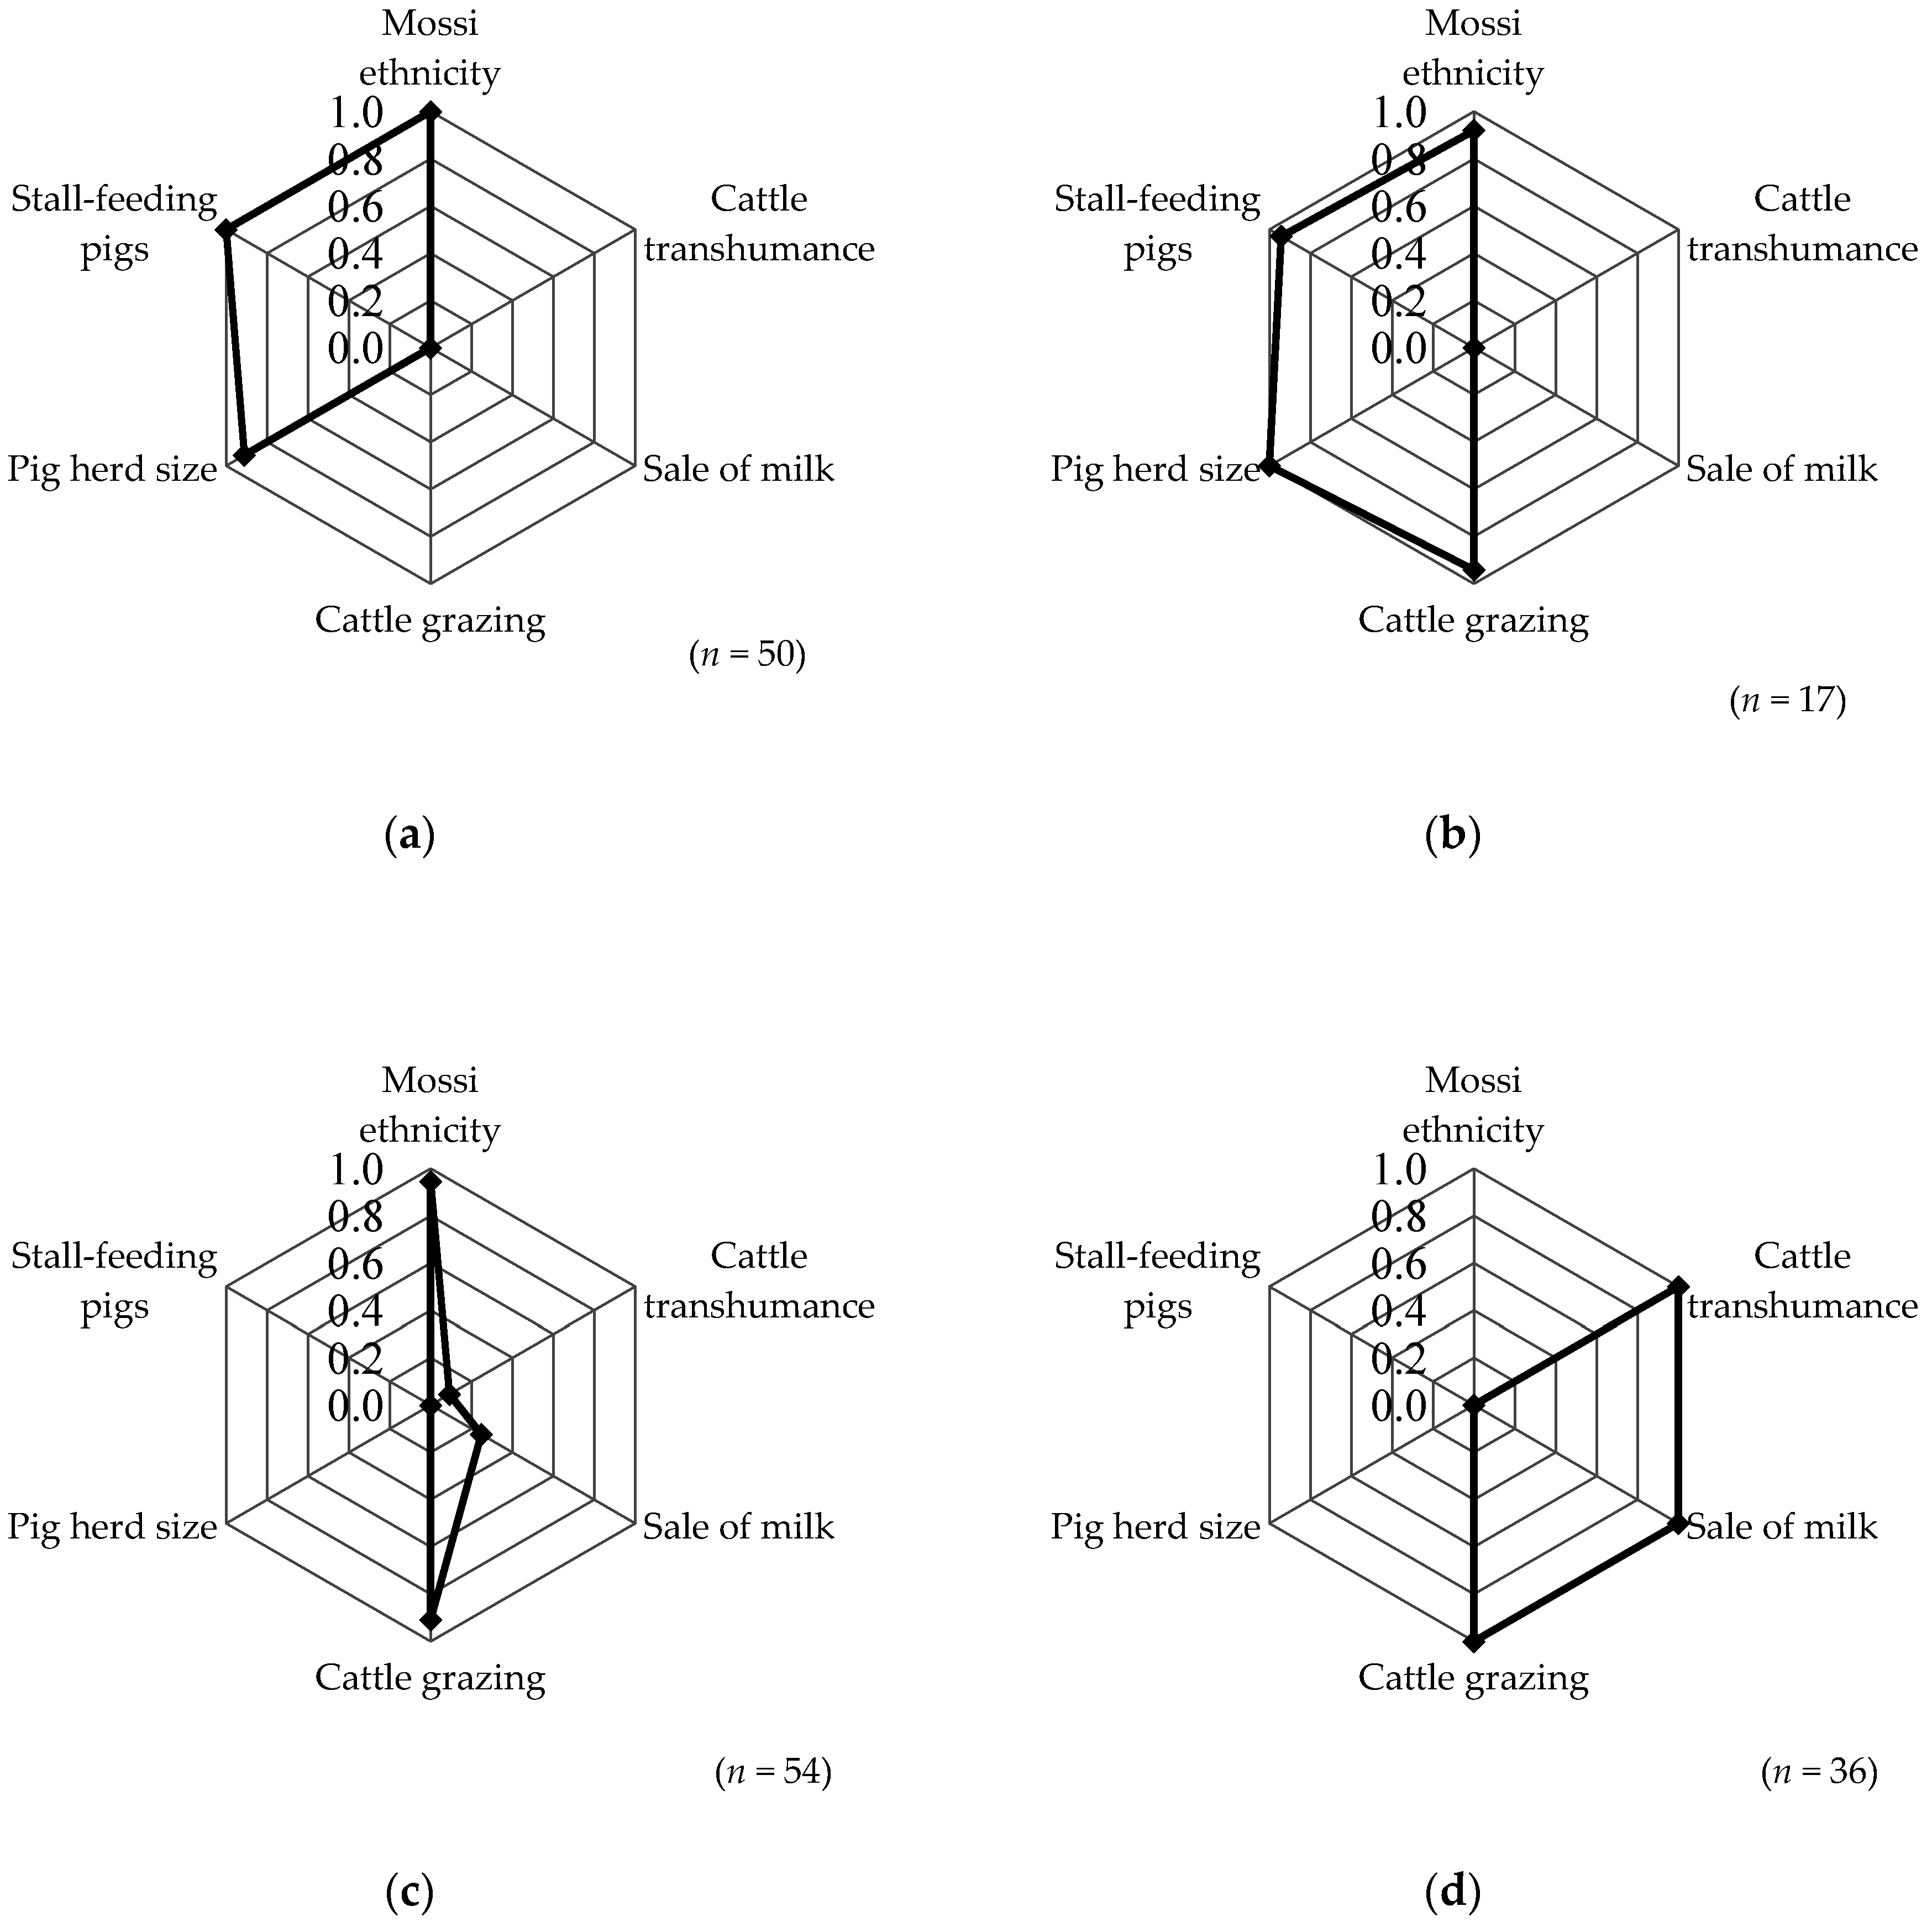
3.1.1. OUA, Cluster 1 (OUA-1): No Cattle, Intensifying Pig Production, 40% Urban, 60% Peri-Urban; n = 50 (31.8%)

Principally, the absence of cattle (and related management variables) differentiated all households of OUA-1 from households of the other clusters (Figure 1). In addition, pigs were owned by three quarters of the households which further delimited them from clusters OUA-3 and OUA-4 (Table 1). Pig herd sizes and feeding management of pigs were similar to households in OUA-2, but a lower proportion of pig keepers allowed pigs to scavenge (Figure 1, Table 1 and Table 2). All but two households were Mossi, no Fulani households were found in this cluster.

3.1.2. OUA, Cluster 2 (OUA-2): Mixed Crop-Cattle/Pig Production, 100% Peri-Urban; n = 17 (10.8%)

The presence of cattle separated households in OUA-2 from households in OUA-1. None of the households sold milk and transhumance for cattle was not practiced, which, in addition to pig keeping, also delineated households in OUA-2 from OUA-3 and OUA-4 (Figure 1). Again, the majority of households were Mossi (88.2%), and no Fulani were present in this cluster.

3.1.3. OUA, Cluster 3 (OUA-3): Mixed Crop-Cattle Production, 33.3% Urban, 66.7% Peri-Urban; n = 54 (34.4%)

All households owned cattle of which 25.9% produced milk (Figure 1; Table 3). Among these households, the average amount of milk produced per household and day was higher than in OUA-4, as was the amount of milk sold (Table 3). Cattle transhumance was less frequently practiced than in OUA-4, but like in OUA-4, ruminant grazing was the main feeding system used by households in OUA-3 (Table 2). The majority of households were Mossi which further delimited households in this cluster from households in OUA-4 (Figure 1).

3.1.4. OUA, Cluster 4 (OUA-4): Mixed Crop-Dairy Production (Fulani Keepers), 11.1% Urban, 88.9% Peri-Urban; n = 36 (22.9%)

Ethnicity of the household head (Fulani; 100%) was different from the other clusters (Figure 1). All households owned cattle and produced milk (Table 1, Table 3). Grazing of cattle was common among households. Yet, in contrast to OUA-2 and OUA-3, about 20% of OUA-4 households practiced transhumance, mostly during the dry (57.1%) but also in the rainy season (28.6%) and year round (14.3%). Mean duration of cattle transhumance was 3.1 ± 1.35 months and total travel distance covered 59.3 ± 66.74 km.

3.2. Identified Types of Livestock Keepers in TAM

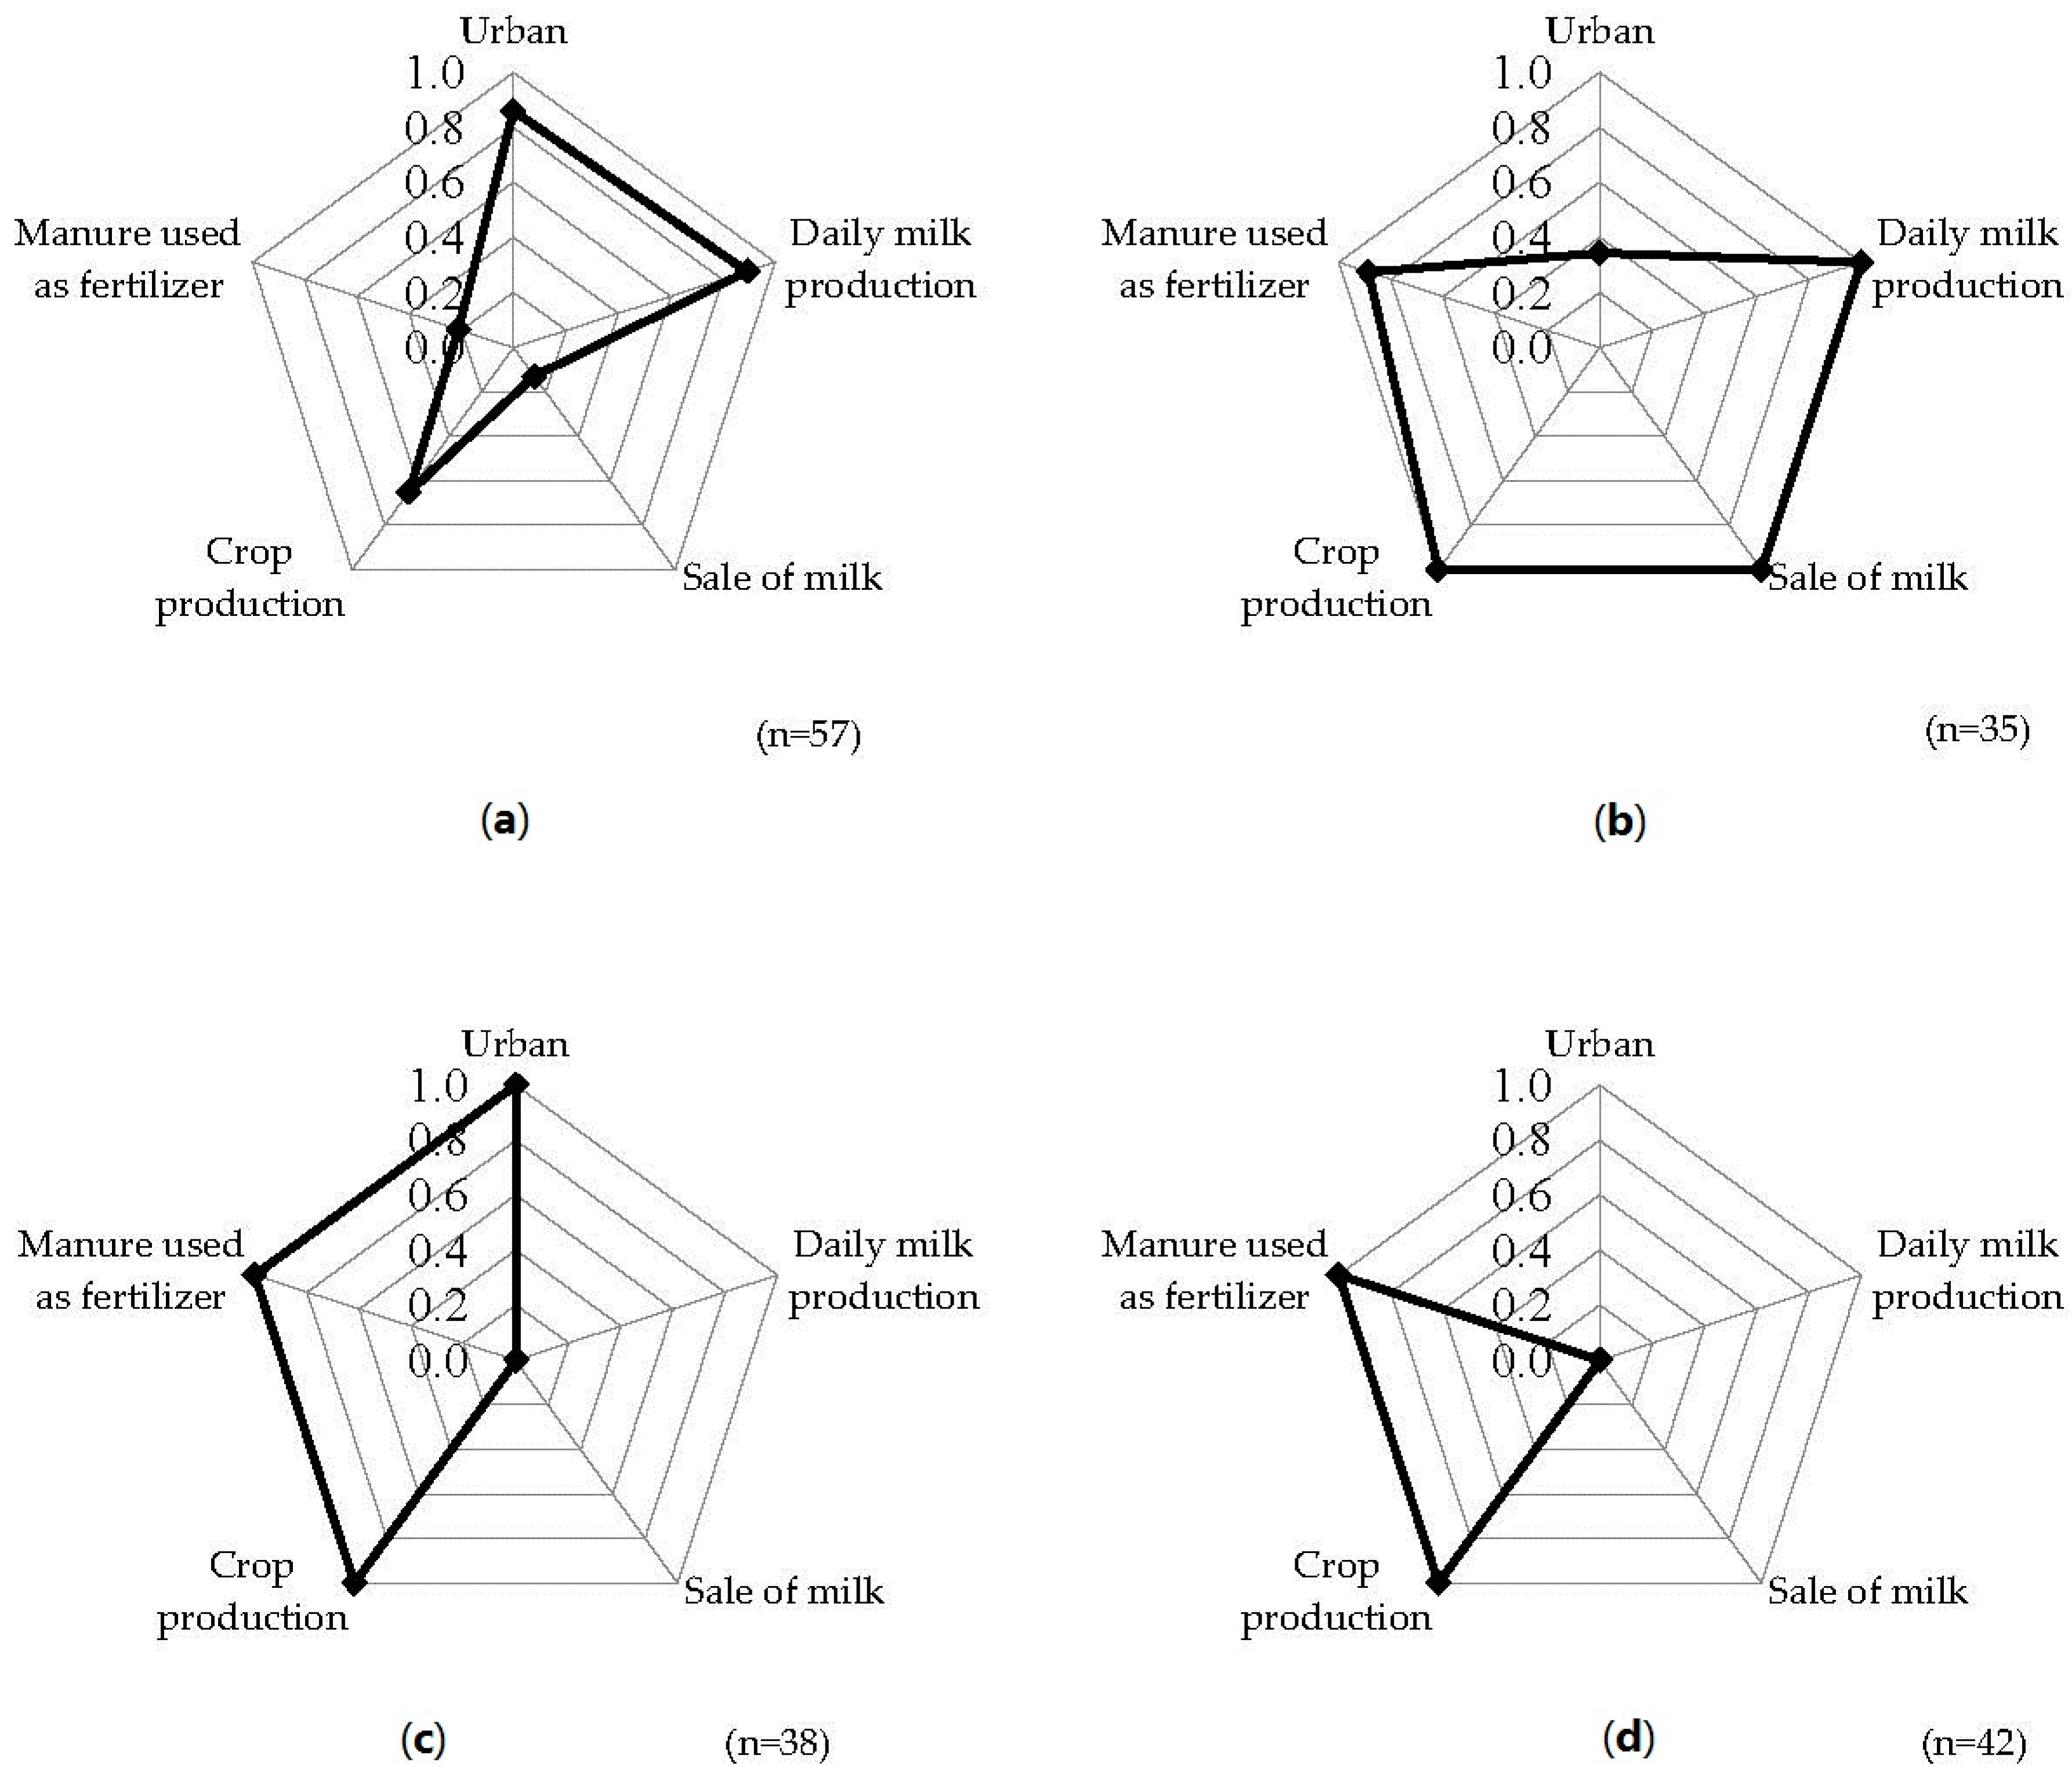
3.2.1. TAM, Cluster 1 (TAM-1): Specializing Urban Ruminant Production, 86% Urban, 14% Peri-Urban; n = 57 (33.1%)

Nearly one third of households of TAM-1 were not involved in crop farming. This mostly differentiated them from households in the other three clusters (Figure 2). As a consequence, a higher proportion of TAM-1 households wasted manure while a lower proportion used it as crop fertilizer (Figure 2 and Figure 3). Despite a relatively high prevalence of households in urban areas, households cultivated larger areas than in the other clusters in TAM (15.4 ± 16.52 ha vs. 8.3 ± 5.28 ha, 7.0 ± 4.53 ha and 9.9 ± 6.33 ha in TAM-2, TAM-3 and TAM-4; p < 0.05 with TAM-3). Milking cattle and selling milk was less widespread than in TAM-2 (Figure 2, Table 3). The highest proportion of households with sheep and largest sheep flocks were found among households in this cluster; yet differences with other clusters were not significant (Table 1). In contrast, animal sales per household and year were higher than in TAM-3 and TAM-4 (Table 3).

3.2.2. TAM, Cluster 2 (TAM-2): Peri-Urban Mixed Crop-Dairy Production, 34.3% Urban, 65.7% Peri-Urban; n = 35 (20.3%)

The production and sale of milk were the most important variables that differentiated households of TAM-2 from TAM-3 and TAM-4 (Figure 2, Table 2). Cattle were more important than in other clusters in TAM, reflected in a larger proportion of households owning cattle (Table 1). All cattle keepers produced and 80% sold milk. Yet, the daily amount of milk produced and sold were not different to TAM-1 (Table 1). All households grew crops. About two thirds of households were located in peri-urban areas, which further differentiated them from TAM-1 and TAM-3 (Figure 2).

3.2.3. TAM, Cluster 3 (TAM-3): Urban Mixed Crop-Livestock Production, 100% Urban; n = 38 (22.1%)

All households of TAM-3 were located in urban areas. Sheep and poultry were the most frequently kept livestock species (Table 1). The largest poultry flocks were found in this cluster; yet differences in number of poultry kept per household were not statistically significant to other clusters in TAM (Table 3). In contrast to TAM-2 and also TAM-1, no milk was produced and sold by cattle owners (Figure 2, Table 3). As in TAM-4, all households exclusively used manure as crop fertilizer (Figure 2 and Figure 3).

3.2.4. TAM, Cluster 4 (TAM-4): Peri-Urban Mixed Crop-Small Livestock Production, 100% Peri-Urban; n = 42 (24.4%)

TAM-4 is the only cluster in the city where some households owned pigs. Their herd size averaged 11.9 ± 8.67 pigs per household. The predominant livestock species kept by households in TAM-4 were however goats, followed by sheep and poultry (Table 1). In contrast, a lower proportion than in the other three clusters kept cattle. Their peri-urban location (100%) separated TAM-4 from the other clusters, particularly from purely urban TAM-3 (Figure 2). All households cultivated crops and used manure as crop fertilizer, no other manure uses were reported (Figure 2 and Figure 3). No milk was produced and sold (Figure 2, Table 3).

3.3. Integration or Specialization of Livestock Production

The majority of livestock keepers in both cities integrated livestock with cropping activities (74.8%). However, in both cities, differences between clusters in the same city were observed, with fewer households in OUA-1 (50.0% vs. 94.1% in OUA-2, 75.9% in OUA-3 and 80.6% in OUA-4; p < 0.01) and TAM-1 (35.1% vs. 100% in TAM-2 to TAM-4; 
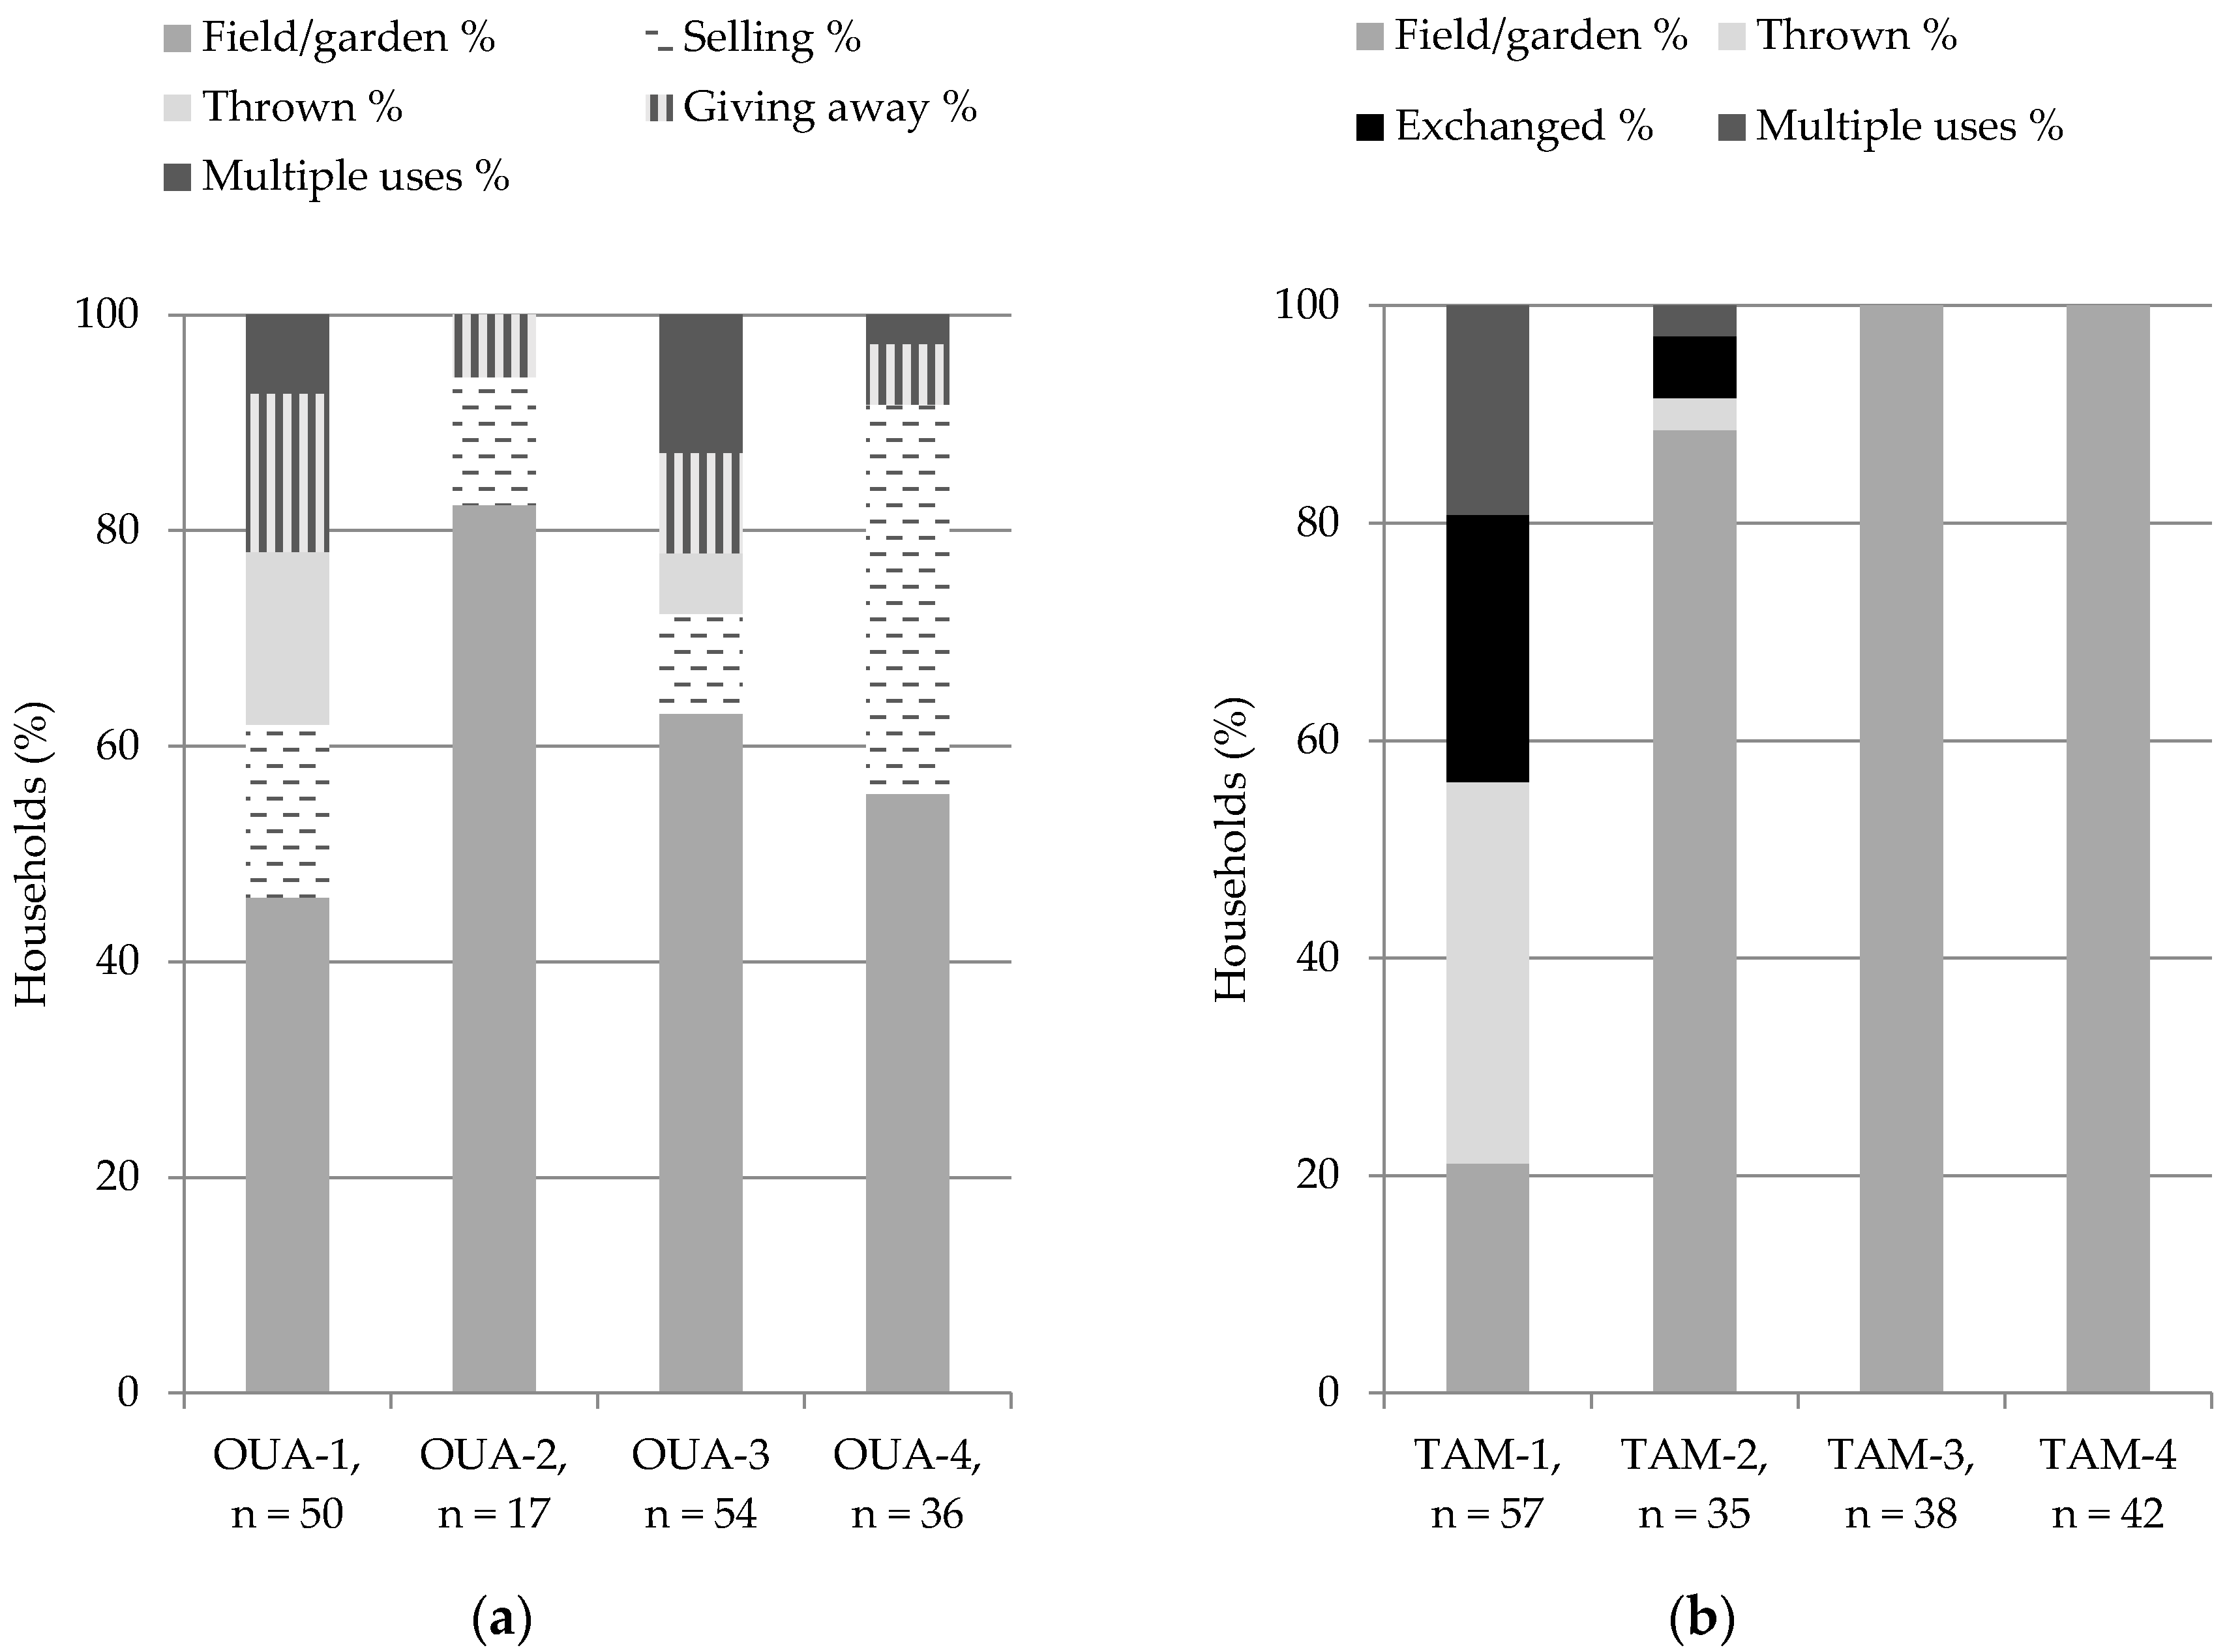
p < 0.001) cultivating crops than in the other clusters. Consequently, a considerably higher share of households in OUA-1 wasted livestock manure or gave it to other households (Figure 3). Accordingly, fewer livestock keepers in OUA-1 and TAM-1 mentioned to be crop-livestock farmers, while significantly more household heads in TAM-1 considered themselves as pure livestock keepers (Table 4). According to their own assessment, 46.5% of the household heads stated to be crop-livestock farmers, 17.3% were self-employed off-farm, e.g., as butcher or trader, and 12.5% were employed off-farm in the private sector or as public servant.
Generally, 87.8% of households across OUA and TAM owned more than one livestock species. A significantly higher proportion of households in OUA than in TAM owned three livestock species (Table 5). Across cities, sheep were the most frequently encountered species, followed by chickens and guinea fowl (69.0%), cattle and goats (61.4% each). Pigs were less important, with more pig keepers in OUA than in TAM (Table 1). In OUA, the majority of pig keepers clustered in OUA-1 (68.5% of all pig keepers, representing 74% of households in OUA-1), the remaining 31.5% in OUA-2, representing 100% of all households in OUA-2. In TAM, all pig keepers were found in TAM-4. In OUA, local poultry (chickens, guinea fowl) were generally the most widespread livestock species, followed by cattle. Exotic poultry (broilers, layers) were uncommon in both cities and none of the finally analyzed household used exotic poultry types. Unlike households in OUA, most households in TAM owned sheep. Except for local poultry, livestock herds/flocks were larger in OUA than in TAM, whereby significant differences between the two cities only existed for sizes of pig herd and sheep flock (Table 1).
However, some livestock keepers used a single species or produced a single product, e.g., milk. In OUA, most households with one species owned pigs (81.2%), all of which were grouped in OUA-1, and the remaining households owned cattle (18.8%) (Table 5). In TAM, livestock species kept by specialized producers were more divers. Most of the specialized livestock keepers focused on sheep (grouped in TAM-1 and in TAM-3), 16.7% each on cattle or local poultry, 12.5% on pigs and the remaining 8.3% on goats (Table 5). Finally, about 45% of all cattle keepers produced milk, with no differences between OUA and TAM. In TAM, a larger share of milk producers was classified into TAM-2, the remaining clustered in TAM-1. In OUA, milk producers were predominantly grouped in OUA-4 (Table 3).
Households with just one species less frequently integrated livestock keeping with crop farming (52.5% vs. 77.9%; p < 0.001), and more often considered livestock keeping as their principal activity (25% vs. 8.2% for households keeping more than one livestock species; p < 0.01). They were predominantly located in urban areas of the cities (60% in urban vs. 40% in peri-urban areas; p < 0.05). Therefore, their cultivated land area was smaller than that of farms keeping multiple species (p > 0.05). Particularly households that only kept sheep or poultry (all in TAM) were exclusively (sheep; p < 0.001) or mostly (poultry: 75.0%; p < 0.001) located in urban areas of the city. In contrast, dairy cattle owners and specialized pig producers were more frequently located in peri-urban areas (dairy cattle: 66.3% and pigs: 81.2%, together in both cities), compared to 18.8% and 33.7% in urban areas, respectively (p < 0.05).
The results of the logistic regression analysis (Table 6) indicated that households in TAM were more likely to cultivate crops and produce milk than households in OUA. In addition, the education of household head affected livestock keepers’ decision to cultivate crops or to produce milk. Households in which the head had completed secondary or tertiary school less likely cultivated crops than those without formal education, while livestock keepers who had completed primary school were less likely to adopt milk production than those with no formal education. Crop cultivation was also more likely to be practiced by households living in peri-urban than in urban areas and by households with borrowed land. As could be expected, milk production was more likely adopted with increasing number of TLU owned, because one cattle head is equivalent to 0.8 TLU compared to 0.001 TLU for one chicken or 0.1 TLU for one sheep or goat. Accordingly, clusters with a high proportion of milk producers, namely OUA-4 and TAM-2, owned a larger number of TLU with larger cattle herds (Table 1).

3.4. Intensification or Extensification of Livestock Production

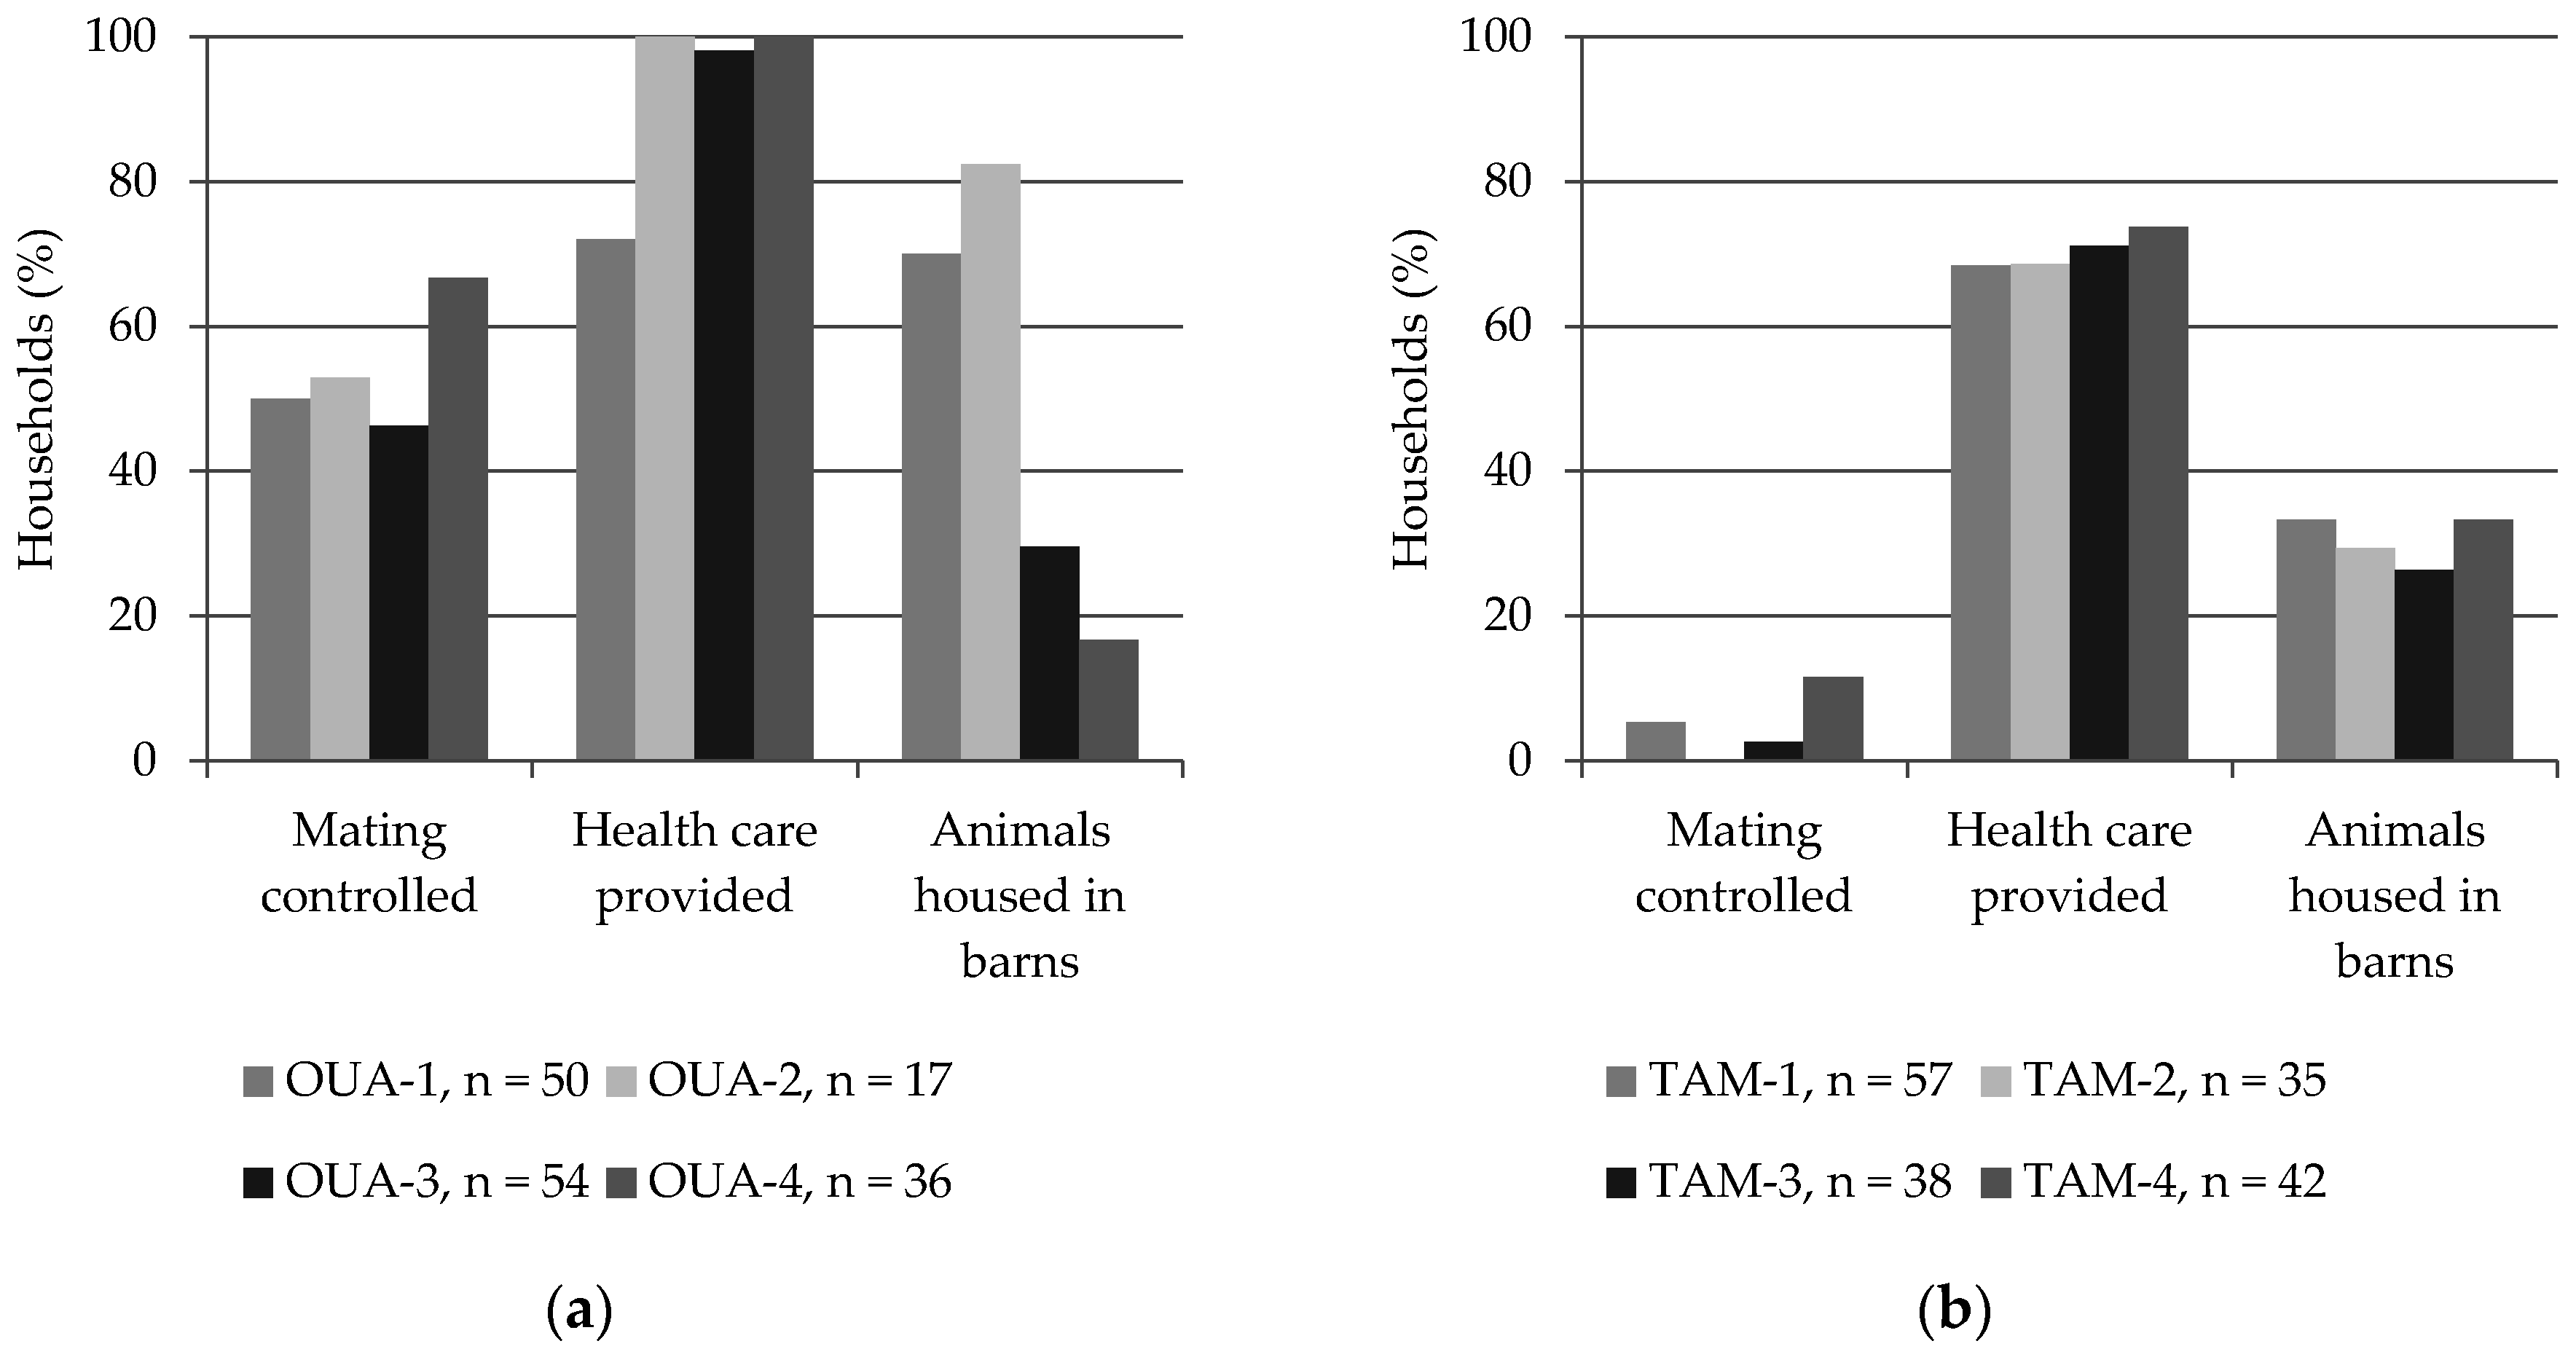
Intensification of livestock production was assumed if inputs such as labor, feed, housing facilities, breeding and health care and if also the output of animal-based outputs was comparatively high. In contrast, extensification was characterized by low inputs of labor, materials and management efforts, and relatively low animal-derived outputs.
Our results showed that controlled mating was not widely practiced in both cities (Figure 4). It was most frequently reported for pigs, particularly in TAM, and cattle in OUA, and least for local poultry. Artificial insemination (AI) was used by 12.7% of cattle keepers in OUA, mostly in clusters OUA-3 and OUA-4 (Supplementary Table S2). In addition, animals were rarely kept in barns, with the exception of predominantly pig-keeping clusters OUA-1 and OUA-2 (Figure 4). Different to the poor housing and breeding management, the majority of livestock keepers stated to provide health care to their animals, i.e., prophylactic vaccination, curative medical treatment or veterinary services. Goats received less health care (affirmative: 37.6% of goat keepers) than cattle (69.3%), pigs (65.6%) and sheep (60.8%). In OUA, a lower proportion of households in OUA-1 than in the other three clusters provided health care to their animals (Figure 4).
Across cities, the decision to provide better management and housing conditions to their animals was influenced by the education level of the household head. Those who had completed secondary or tertiary school were more likely to keep animals in barns or to control mating than those with no formal education. In addition, the odds of providing health care to animals were higher for household heads with a secondary school education as compared to household heads with no formal education. Households that owned a larger number of TLU were less likely to keep animals in barns. In general, livestock keepers in TAM were less likely to provide health care to animals and to control mating of animals as compared to OUA, while households with allocated land were more likely to control mating of animals (Table 7).
Households predominantly used family labor for livestock activities (95.7%), even though the proportion was lower in OUA than in TAM. Across the two cities, 31% of households also hired labor for livestock activities, with a higher number in OUA than in TAM. Within OUA, households in OUA-1 and OUA-3 less frequently used hired labor, although the family labor force was lower in OUA-1 than in the other clusters (3.8 ± 2.39 vs. 5.34 ± 2.42 in OUA-2, 6.1 ± 3.52 in OUA-3 and 5.7 ± 2.54 in OUA-4; p < 0.001). No differences were obtained for clusters in TAM, although a higher proportion of households in TAM-2 than in the other clusters used hired labor (Table 8).
Similar to the results on inputs into livestock production, the amount of livestock-related outputs (number of TLU sold, daily amount of eggs and milk produced and sold) was much lower in TAM than in OUA (Table 3). Within cities, we observed comparatively higher outputs of OUA-2 (animal sales, sale of eggs) and of TAM-1 (animal sales) households. While the sale of milk was stated more frequently in OUA than in TAM, the sale of eggs was more common among households in TAM. Within cities, the proportion of cattle keepers who sold milk was highest in OUA-4 and TAM-2.

3.5. Feed and Manure Use

Almost all ruminant keeping households relied on grazing their animals, but additionally provided homestead feeding, using forages and/or grains. In TAM, no differences were observed for the feeding management of ruminants between clusters. Yet, more than half of the households in TAM-1 were feeding grains to their sheep (56.7% vs. 40.7% in TAM-2, 17.4% in TAM-3 and 33.3% in TAM-4; p < 0.05). In OUA, all ruminant keeping households in OUA-3 and OUA-4 provided supplement feeds to their animals at the homestead whereas this was only practiced by 82% in OUA-2. For pigs, homestead feeding was common (95.3%), but scavenged feeding was also practiced by 35.9% of pig keepers across the two cities. In OUA-1, homestead feeding of pigs was practiced by all pig keepers, while scavenged feeding was less common. Similarly in TAM, homestead feeding of pigs was common; still, 70% of pig keeping households additionally relied on scavenged feeding of pigs (Table 2).
The most common feedstuffs used for homestead feeding included maize bran, cowpea and groundnut hay, cereal straws, fresh grass, brewer’s spent grain (OUA), rice bran and cassava peels (TAM). Although some of the feed was home-grown, other feed sources were more important in both cities. Brans mostly originated from mills (92% in TAM, 58% in OUA), but also from fodder markets (OUA: 38.9% for maize bran; TAM: 7.7% for rice bran, 28.6% for maize bran). In OUA, fodder markets were also an important source of cereal straws (14%), groundnut hay (25%), grass hay (21%) and cotton seed cake (88.1%). Households in OUA also used crop residues from the own farm (55.9% for cowpea hay, 32.1% for groundnut hay, 27.1% for cereal straws) or from peri-urban farms (26.5% for cowpea hay, 19.4% for grass hay, 14% for cereal straw); furthermore hay (43.5% of households) and fresh grasses (86.9%) were cut and carried from open grasslands in peri-urban areas. Within this city, more households in OUA-1 purchased livestock feed, e.g., maize bran from grain mills (80.4% vs. 52.9% in OUA-2, 45.0% in OUA-3 and 42.9% in OUA-4; p < 0.05) or groundnut hay from urban fodder markets (81.4% vs. 17.5% in OUA-3 and 0% in OUA-2 and OUA-4; p < 0.001). For households in OUA-4, peri-urban farms were the most important suppliers of groundnut hay (55.6% vs. 18.2% in OUA-1, 25% in OUA-2 and 10.7% in OUA-3; p < 0.001), while other sources were less important. In TAM, cowpea hay mostly originated from peri-urban (52.5%) or rural farms (20.0%), only 13.8% of households produced their own cowpea hay, with the highest share being observed in TAM-3 (42.9% in TAM-3 vs. 7.7% in TAM-1, 4.3% in TAM-2 and 11.8% in TAM-4; p < 0.001). In addition, cassava peels mostly originated from other farms (52.3% from peri-urban farms, 23.3% from rural farms, 11.6% own production).
Manure use was different between TAM and OUA. In TAM, the majority of livestock keepers used manure as crop fertilizer on their own land. In OUA, the highest share of households that used manure as fertilizer on their cropland was found in OUA-2, whereas particularly livestock keepers from cluster OUA-4 sold their manure to other farmers. This practice was not found in TAM where some livestock keepers however exchanged manure mostly against crop residues for animal feeding; on the other hand, a higher proportion of households in TAM, particularly in TAM-1 just wasted the manure (Figure 3).

4. Discussion

In OUA as well as in TAM, four distinct types of urban and peri-livestock keepers were identified. In OUA, the importance attached to different livestock species, their management intensity and main production purpose differentiated the surveyed livestock keepers. In TAM, location of the household, integration of livestock keeping with crop farming and the related manure management, as well as the engagement in milk production and the amount of milk produced separated clusters, whereas livestock management intensity was similar between the four clusters of livestock keepers in this city. Similarly, different household-based livestock production systems have been identified in other West African cities, which differed in their integration of farming activities, production orientation and input intensities as well as in the socio-economic characteristics of households [4,6,12,26].
Livestock production in OUA and TAM was frequently integrated with crop farming and included a variety of livestock species. The integration with crop farming in one farm unit enables livestock-keeping households to recycle animal wastes as crop fertilizer, particularly in TAM where more livestock-keeping households also practiced crop cultivation on comparatively larger cropping areas. In addition, in other parts of Africa, manure is used as crop fertilizer, e.g., 90% of livestock keepers in (peri-) urban areas of Morogoro in Tanzania fertilize their fields with animal manure [27]. The application of livestock manure as crop fertilizer bears the risk of microbial contamination of crops and vegetables, e.g., with Salmonella spp. and Escherichia coli, and of excess nutrient accumulations in the soil, as has been reported for Niamey in Niger [28]. The limited provision of health care to livestock herds and restricted confinement of animals, particularly among the participating households in TAM, can be an additional risk factor for increased infectious disease transmission and outbreaks due to the proximity to other livestock herds and humans and high population densities, not only through inappropriate livestock waste disposal (uncovered manure heaps and slurry pits, livestock waste disposal in the streets) but also through direct contact of humans with the animals. Furthermore, informal food markets increase the risk for the spread of zoonotic diseases in cities, as concluded by [29] for four zoonotic diseases in urban and peri-urban areas of Kampala in Uganda. While in OUA some livestock keepers sold manure to crop/vegetable farmers, livestock keepers in TAM lacked this opportunity, probably due to highly subsidized mineral fertilizer in the region which limited the demand for organic fertilizer [30]. Moreover, a higher degree of specialized livestock keeping, as observed in clusters TAM-1 (sheep) and OUA-1 (pigs), was associated with higher manure wastage and a higher reliance on purchased feeds. At present, the share of urban production systems in the global non-CO2 greenhouse gas (GHG) emissions from ruminant production is low as compared to mixed-farming systems, particularly in sub-Saharan Africa [31]. If (peri-) urban livestock production in the region intensifies and specializes, we will inevitably observe an overall increase in non-CO2 GHG emissions, particularly due to a shift from nitrogen balance deficits to surpluses [32]. Measures to reduce nitrogen losses include improved handling of livestock manure (e.g., covering manure heaps) and feeding management (feeding animals based on their nutrient requirements) [33,34]. Purchasing feedstuffs at local fodder markets and grain mills tended to be more important for households in TAM-1 and OUA-1 than for the other clusters, while feeding of crop residues was less important. For the other clusters in TAM, purchases of feedstuffs—mostly cereal straws and legume hays—from farms in peri-urban or rural areas were widespread. Overall, most livestock keepers in our sample still strongly relied on grazing and scavenge systems for their livestock, which might explain the low outputs and low use of hired labor of most (peri-) urban livestock-keeping households. In addition, many households of our study used crop residues for feeding livestock, particularly in OUA, which was also reported for OUA by [35]. Tiffen [36] underlined the increasing importance of crop residue feeding in West Africa due to an increasing population, particularly in urban areas, and shrinking grazing areas, such as in the northern region of Ghana [37], as well as feed scarcity [
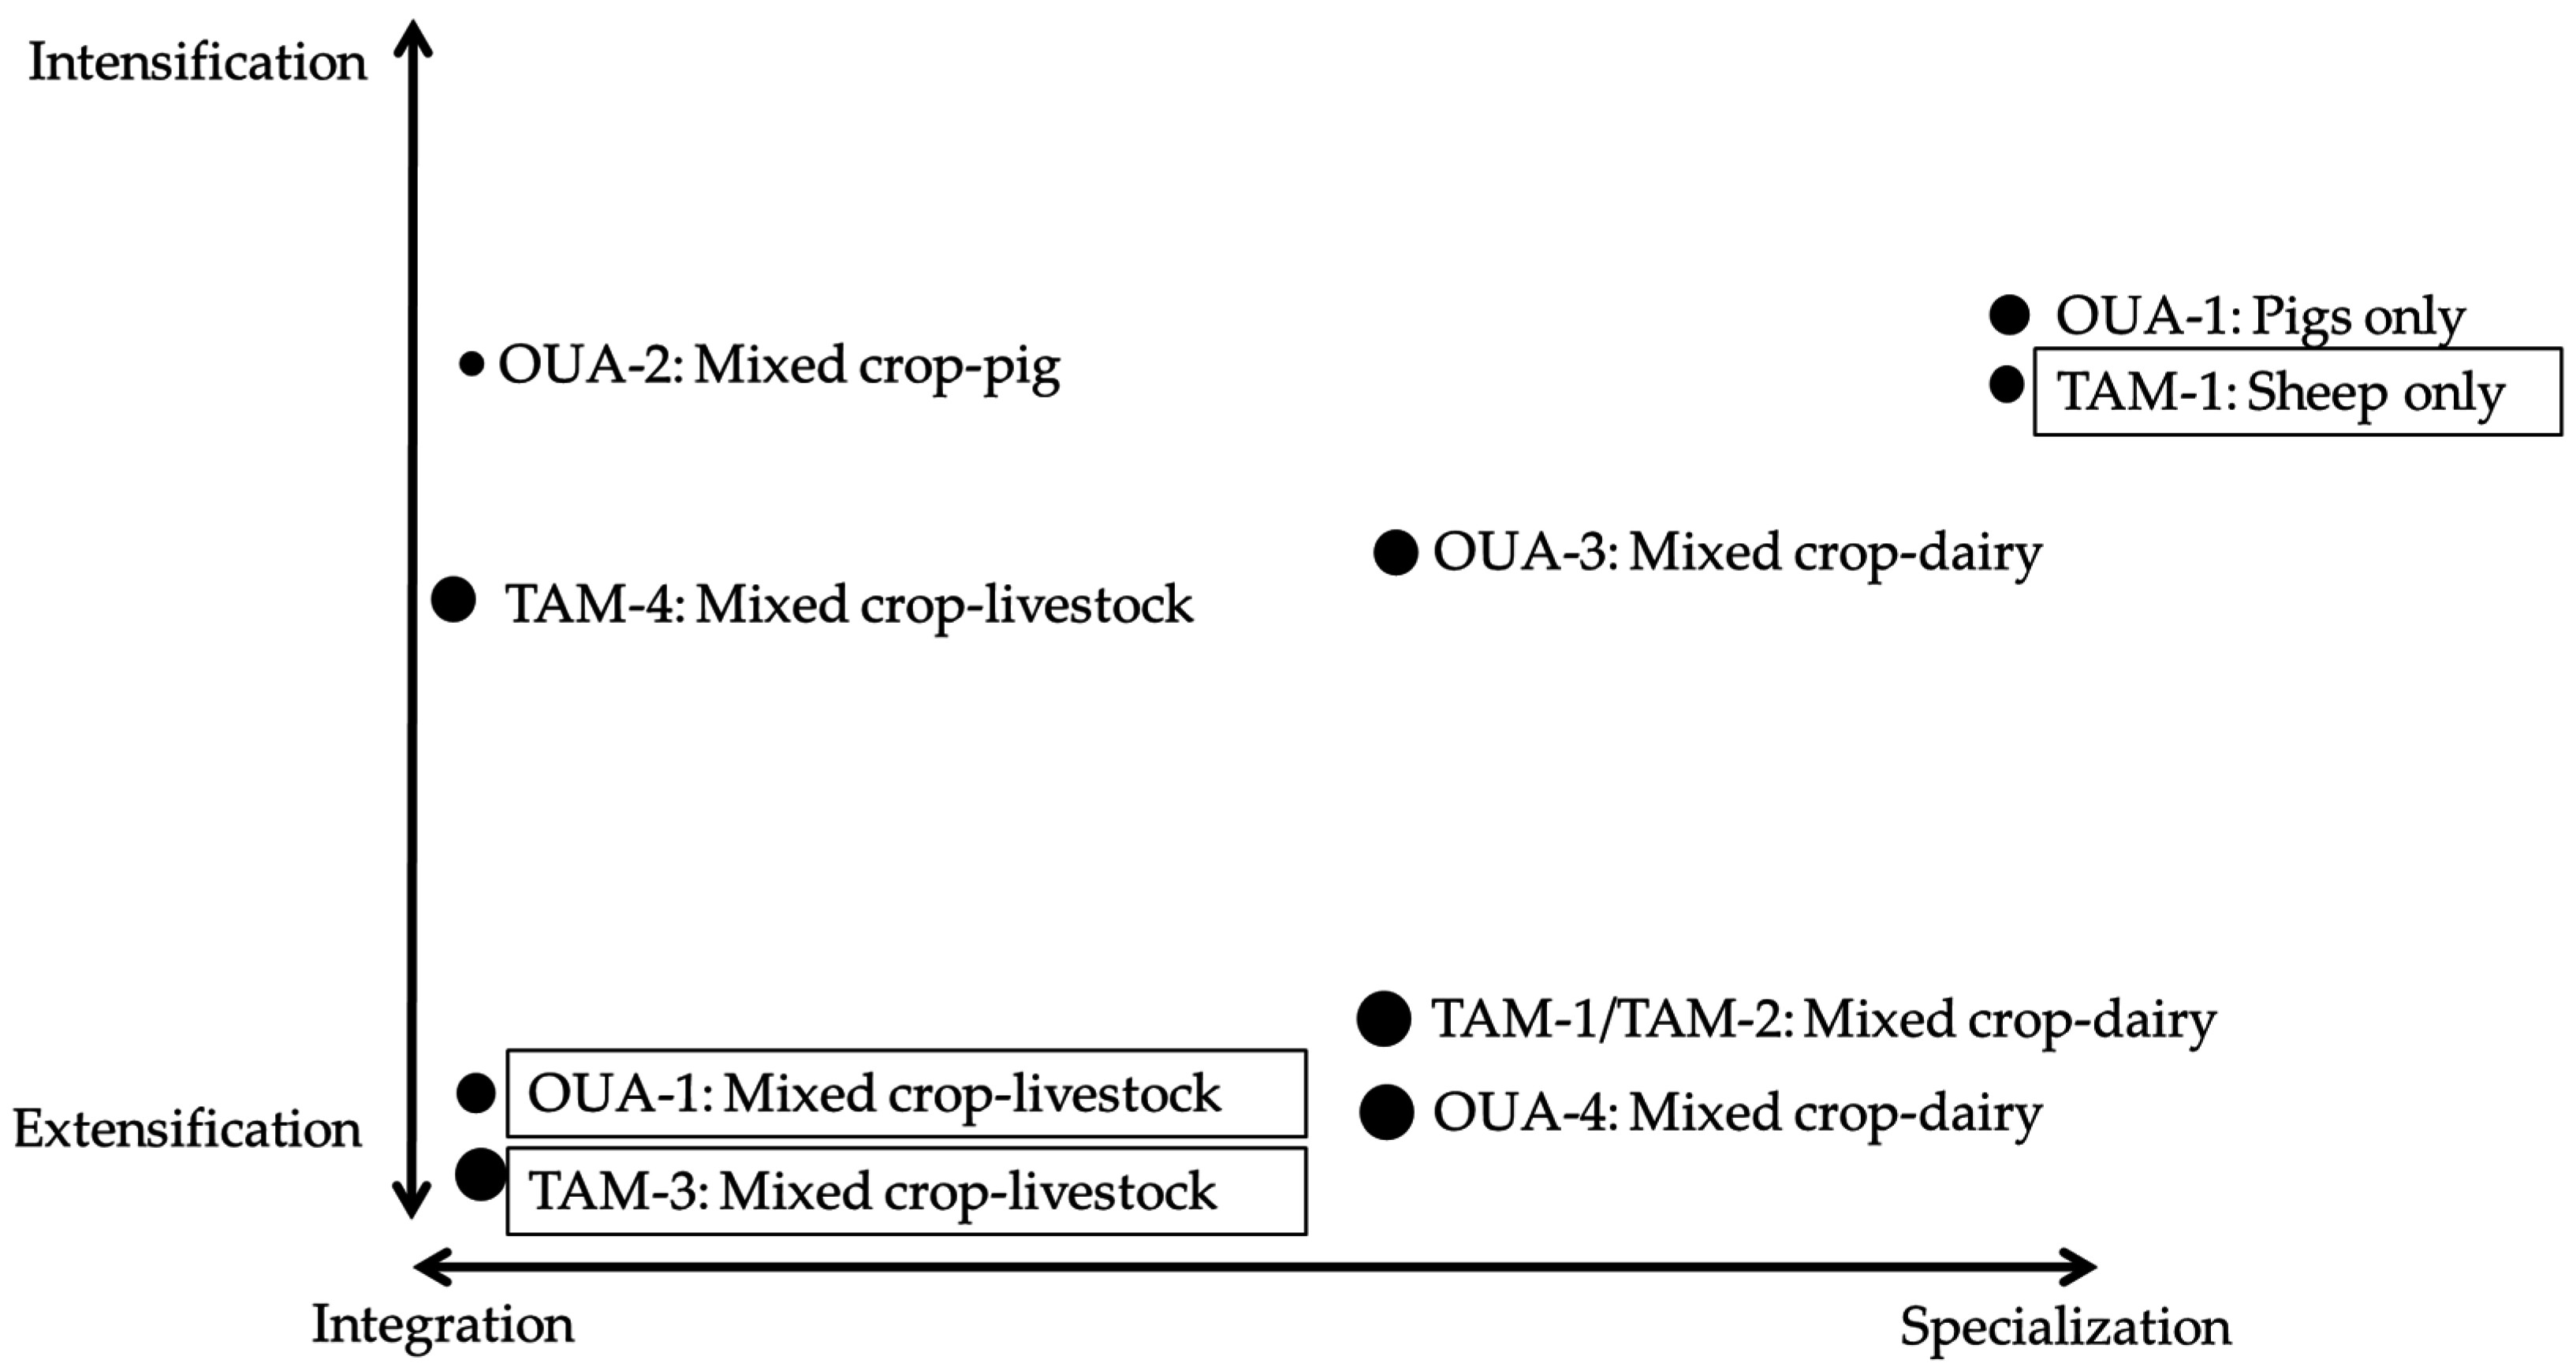
38]. Strong reliance on poor quality crop residue feeding, which was also observed in the present study, points to a still quite extensive nature of livestock production, particularly in TAM (TAM-1—except sheep, TAM-2, TAM-3) (Figure 5). Due to the low intensification level of livestock production, livestock outputs per farm (live animals, milk, eggs) were generally low, particularly so in those HHs within OUA-1 that do not keep pigs, and in TAM-3. The high intake of forage feed together with the low production performances in (peri-) urban livestock production systems in TAM and OUA result in high methane emissions from ruminants which could be reduced through improved feeding (higher quality feed) and higher production efficiency [39,40].
At the same time, we observed that some households specialized, as hypothesized, in intensive dairy cattle (OUA-3) and pig production (OUA-1) in the peri-urban areas of OUA, as well as in sheep rearing in the urban areas of TAM (TAM-1). Contrary to our assumption that livestock production in more densely populated areas of the cities will be extensive, specialized urban sheep production (TAM-1) was more intensive than other livestock operations that were located in peri-urban areas of TAM (Figure 5). This also contradicts [41] who reported that agricultural intensification and commercialization takes place in peri-urban areas of TAM. Yet, a relatively high intensity of inputs into feeding, housing and health care was also reported for urban sheep keeping households in Kumasi and Effiduasi in Ghana [42]. The specialization and intensification towards sheep production and the low importance of pigs in TAM are explained by a predominantly Muslim population in the metropolis and the high importance of sheep for the two Muslim Eid festivals celebrated in TAM [20].
Due to an increasing demand for pork, the intensification of pig production, i.e., improved health management and animal nutrition as well as crossbreeding with imported breeds, has been strongly promoted in Burkina Faso [43]. Accordingly, scavenged feeding is apparently uncommon for pigs in OUA and almost all pig keepers used stall feeding. Similarly, peri-urban dairy production is promoted by the National Pilot Dairy Development Programme (PNPDL) of Burkina Faso [44]. Hamadou and Sanon [45] described two peri-urban dairy production systems around Bobo-Dioulasso and OUA, where the traditional dairy production by Fulani and other people is paralleled by modern peri-urban production systems run by new players such as retired people, civil servants and monasteries (e.g., the Monastery Koubri in the periphery of OUA). According to the same authors, traditional producers mostly rely on local Zebu cattle and still practice transhumance, whereas modern producers keep a variety of Bos indicus breeds including local Zebu, Azawak, Gudali, and crosses with high-yielding imported taurine cattle breeds [45]. In combination with improved management such as supplement feeding and vaccination, improved breeds ensure higher milk production in the modern system. In our sample, milk producing households of cluster OUA-3 correspond to the modern type, whereas households in cluster OUA-4 represent the traditional type; both clusters included new players such as civil servants and retired people. Contrary to [45], our study revealed that health, housing and breeding management did not differ between OUA-3 and OUA-4. Yet, Fulani cattle keepers in OUA-4 still practiced seasonal transhumance. Reported daily milk output per farm was lower in OUA-4 than in OUA-3 although cattle herds were larger in OUA-4. According to a qualitative study of [46] on Fulani herders in Cameroon, low milk yields of cows are explained by the milking practice of Fulani herders who do not always milk cows on a daily basis, and additionally only milk once a day, namely in the morning before cows leave for grazing. The same authors stated that only few cows remain for milking at the homestead during transhumance. Another explanation for the low reported daily milk yield per household in clusters OUA-4, TAM-1 and TAM-2 might be that cows are only partially milked, as has been reported for peri-urban milk producers in the Accra plains [8].
The predominantly extensive cattle management of most milk-producing household in OUA (cluster OUA-4) might also be explained by high milk imports into Burkina Faso. Nearly 60% of the per capita milk consumption in the country (26 kg/year) is covered by imported milk products and only 40% by local milk production [47]; this is due to high producer prices (especially for feed as frequently mentioned by the interviewed livestock keepers) that are not compensated by the returns from milk sales. In Ghana, the per capita milk consumption is even lower than in Burkina Faso (8.5 kg/year in 2011) [48]. Still, the domestic milk production is unable to cover this demand [49]. According to [48], the national consumption of milk amounted to 87.5 million tons in 2012, whereas the national production was 41 million tons. In our study, 42% of cattle-keeping households in TAM milked their cows, which is twice as high as the total national proportion of milked cows in the year 2000 of 20% [48]. The reported milk outputs per household in TAM were low, which can be explained by a low engagement of cattle keeping households in supplementing their animals with crop by-products and other feedstuffs.
Dairy production in both cities was mostly integrated with cropping and not considered as main income generating occupation by the livestock keepers. The type of land ownership strongly influenced the decision to integrate livestock activities with crop farming. In both cities, a high urbanization rate drastically changes land use by promoting the conversion of land that was formerly used for cropping and grazing activities into land used for residential and commercial activities [41]. In TAM, urban agricultural land has been decreasing in the last few years being now used for industrial activities [50]. Due to increasing land prices, the same trend is currently observed in peri-urban areas of the city [41]. This development makes land use rights insecure, and households that do not own the land must fear that land they use for livestock and cropping activities is allocated to people who invest in industrial or residential building activities.
A higher education level of the household head was positively related to the adoption of improved management strategies such as use of controlled mating and keeping animals in barns. This is in accordance with other studies including cattle farmers in northern Namibia [51] and livestock keepers in Nigeria [52], but contradicts results obtained for urban livestock producers in Bobo-Dioulasso (Burkina Faso), Kano (Nigeria) and Sikasso (Mali) showing no relationship between education and adoption of improved management technologies [5]. Our study also revealed that lower educated people more likely integrated livestock keeping with crop farming. Together with the observed diversification of livestock species, this clearly demonstrates the risk-minimizing strategy of low educated people who more strongly rely on livestock and crop farming for income and subsistence.
In TAM, a relatively larger proportion of poultry keepers sold their eggs if compared to OUA. According to [53], there is a great potential for poultry egg production in Ghana, particularly in peri-urban areas because of an increasing national demand for eggs and a minor competition on the market through imports as compared to poultry meat. In recent years, commercial layer egg production has been continuously increasing, mainly in the southern parts of the country [54]. In how far small-scale urban egg production with local poultry will be specializing, being able to compete with commercial layer egg production in the case that this will also develop around Tamale, remains to be seen in the future. Although market competition with imports and domestic commercial layer production is low and producer prices for eggs correspond to average world market prices in Burkina Faso [55], only a negligible part of the surveyed poultry keeping households in OUA sold eggs.

5. Conclusions

Specialization and intensification of livestock production take place both in urban (sheep) and peri-urban (dairy cattle, pigs) areas of West-African cities, but are not necessarily closely linked phenomena: Peri-urban market-oriented pig and dairy production is mostly integrated with crop production, whereas livestock producers located in urban areas do less frequently cultivate crops. In addition, their diversity of livestock species and the total number of animals kept is lower than in peri-urban households. Both might be explained by competitive uses of limited space in the cities. Intensity levels, both in terms of input use as well as in terms of produced outputs, are usually low. This points to a still noteworthy subsistence orientation of livestock production in urban and peri-urban areas. Initiatives that aim at supporting (peri-) urban livestock production towards specialization and intensification should advance their full integration into markets for animal products including manure, and strengthen the links between specialized livestock keepers and crop farmers in order to dispose of manure in an environmentally sound manner. This implies that strategies need to be identified which enable (specialized) livestock keepers to improve livestock productivity by increasing outputs such as milk, meat and eggs while at the same time enabling higher (quality) inputs into livestock production. Only in this way can an increased resource use efficiency be achieved, both on the input side (higher output per unit of input) and on the output side (recycling of organic matter and nutrients contained in excreta to crop fields). Yet, in order to compete with imported products, production costs, especially those of (supplement) feed that has to be purchased by the majority of urban and peri-urban livestock keepers, must be reasonable as compared to product prices.
The decision of urban and peri-urban livestock producers for specialization of their livestock unit or its integration with crop and vegetable farming, and for intensification or extensification is site-specific and depends on the city as well as on the farm location within city. This hampers a regional blueprint approach to sustainable development of urban livestock production, and calls for site-specific measures. Yet, as a higher education level of the household head favors specialization and intensification of livestock production, training measures and continued advisory support can be recommended across cities and farm clusters. Moreover, land ownership or long-term tenure needs to be secured to guarantee true sustainability of specialized pig and dairy production in peri-urban areas.

Supplementary Materials

The following are available online at www.mdpi.com/2071-1050/8/11/1199/s1, Table S1: Potential classification variables used for two-step cluster analysis (% for nominal, mean ± standard deviation for continuous variables), Table S2: Controlled mating in different livestock species by (peri-) urban households (HH) in Ouagadougou (OUA; n = 157) and Tamale (TAM; n = 172).

Acknowledgments

This study was financially supported by the German Ministry of Education and Research (BMBF) within the UrbanFoodPlus project (GlobE 031A242-A). The costs to publish in open access (article processing charges) are covered by Open Access Publication funds of the University of Kassel. We thank the University for Development Studies (UDS) in Tamale (Ghana), the Centre International de Recherche-Développement sur l’Elevage en Zone Subhumide (CIRDES) in Bobo-Dioulasso (Burkina Faso) and the Institut de l’Environnement et Recherches Agricoles (INERA) in Ouagadougou (Burkina Faso) for the personal, technical and administrative support of field work. Our special thanks go to Gabriel Ayum Teye, former Dean of the Faculty of Agricultural Sciences and current Vice-Chancellor of UDS, and George Nyarko, current Dean of the Faculty of Agricultural Sciences of UDS, Gordana Kranjac-Berisavljevic, Associate Professor at UDS, Mamadou Sangaré, senior scientist in the research group on animal production (URPAN) of CIRDES, Hadja Oumou Sanon, department of animal sciences of INERA, Alhassan Yacubu and Adam Abukari, field assistants in Tamale, as well as Bokoum Hassane, Sankara Ousmane and Hamidou Bagayan, field assistants in Ouagadougou. Last, but by no means least, we thank all livestock keepers for their willingness to participate in this study and patiently answer our questions.

Author Contributions

All authors substantially contributed to the study. Eva Schlecht is principal investigator of the livestock subproject (SP3) of project UrbanFoodPlus within which this research was realized. Together with Regina Roessler, she conceptualized and designed the study and developed the general methodological framework. Tichaona Muchemwa and Serge Eugène Mpouam collected the data in Tamale and Ouagadougou, respectively, and wrote the introduction and the material and methods (data collection) sections. They were also responsible for data management. Regina Roessler planned and conducted the statistical analyses, interpreted the data and wrote the sections on methods (statistical analysis), results, discussion/conclusions and abstract.

Conflicts of Interest

The authors declare no conflict of interest. The founding sponsors had no role in the design of the study; in the collection, analyses, or interpretation of data; in the writing of the manuscript, and in the decision to publish the results.

Appendix A: Key Areas Addressed in the Interviews (Questionnaire Outline)

1
General information: Location (GPS coordinates, district name, urban or peri-urban)
2
Respondent personal information and household composition
3
Occupation of household members
4
Livestock ownership
5
General livestock management: practice of transhumance, grazing/free range, source of drinking water, housing
6
Purpose of keeping livestock
7
Livestock intake: Purchases, gifts, births
8
Animal offtake and reason: Sales, consumption, deaths, thefts
9
Breeding management
10
Feeding management
11
Provision of animal health care and other services
12
Production and marketing
13
Manure use and storage
14
Cash and fodder crop production
15
Farm assets
16
General problems in livestock and solutions

References and Note

  1. Food and Agriculture Organization of the United Nations (FAO). The State of Food and Agriculture; Food and Agriculture Organization of the United Nations: Rome, Italy, 2013. [Google Scholar]
  2. Thornton, P.K. Livestock production: Recent trends, future prospects. Philos. Trans. R. Soc. B 2010, 365, 2853–2867. [Google Scholar] [CrossRef] [PubMed]
  3. Smith, J.; Sones, K.; Grace, D.; MacMillan, S.; Tarawali, S.; Herrero, M. Beyond milk, meat, and eggs: Role of livestock in food and nutrition security. Anim. Front. 2013, 3, 6–13. [Google Scholar] [CrossRef]
  4. Abdulkadir, A.; Dossa, L.H.; Lompo, D.J.-P.; Abdu, N.; van Keulen, H. Characterization of urban and peri-urban agroecosystems in three West African cities. Int. J. Agric. Sustain. 2012, 10, 289–314. [Google Scholar] [CrossRef]
  5. Amadou, H.; Dossa, L.H.; Lompo, D.J.-P.; Abdulkadir, A.; Schlecht, E. A comparison between urban livestock production strategies in Burkina Faso, Mali and Nigeria in West Africa. Trop. Anim. Health Prod. 2012, 44, 1631–1642. [Google Scholar] [CrossRef] [PubMed]
  6. Dossa, L.H.; Abdulkadir, A.; Amadou, H.; Sangare, M.; Schlecht, E. Exploring the diversity of urban and peri-urban agricultural systems in Sudano-Sahelian West Africa: An attempt towards a regional typology. Landsc. Urban Plan. 2011, 102, 197–206. [Google Scholar] [CrossRef]
  7. Okantah, S.; Oddoye, E.; Obese, F.; Gyawu, P.; Asante, Y. Characterization of peri-urban dairy production system in Ghana. 1. Social attributes and characteristics of the production environment. Ghana J. Agric. Sci. 1997, 30, 87–94. [Google Scholar]
  8. Okantah, S.; Oddoye, E.; Obese, F.; Gyawu, P.; Asante, Y. Characterization of peri-urban dairy production in Ghana. 2. Health and other Constraints in the production system. Ghana J. Agric. Sci. 1998, 31, 197–202. [Google Scholar] [CrossRef]
  9. Thys, E.; Oueadraogo, M.; Speybroeck, N.; Geerts, S. Socio-economic determinants of urban household livestock keeping in semi-arid Western Africa. J. Arid Environ. 2005, 63, 475–496. [Google Scholar] [CrossRef]
  10. Schiere, H.; van der Hoek, R. Livestock Keeping in Urban Areas: A Review of Traditional Technologies Based on Literature and Field Experiences; Food and Agriculture Organization of the United Nations: Rome, Italy, 2001. [Google Scholar]
  11. McClintock, N.; Pallana, E.; Wooten, H. Urban livestock ownership, management, and regulation in the United States: An exploratory survey and research agenda. Land Use Policy 2014, 38, 426–440. [Google Scholar] [CrossRef]
  12. Dossa, L.H.; Sangare, M.; Buerkert, A.; Schlecht, E. Intra-urban and peri-urban differences in cattle farming systems of Burkina Faso. Land Use Policy 2015, 48, 401–411. [Google Scholar] [CrossRef]
  13. Habib, G.; Hameed, A.; Akmal, M. Current feeding management of peri-urban dairy buffaloes and scope for improvement. Pak. Vet. J. 2007, 27, 35–41. [Google Scholar]
  14. Food and Agriculture Organization of the United Nations (FAO). Pollution from Industrialized Livestock Production; Livestock Policy Brief 02; Food and Agriculture Organization of the United Nations: Rome, Italy, 2006. [Google Scholar]
  15. Baltenweck, I.; Staal, S.; Ibrahim, M.N.M.; Herrero, M.; Holmann, F.; Jabbar, M.; Manyong, V.; Patil, B.R.; Thornton, P.; Williams, T.; et al. Crop-Livestock Intensification and Interactions across Three Continents; CGIAR System-Wide Livestock Programme; ILRI: Addis Ababa, Ethiopia, 2013. [Google Scholar]
  16. McIntire, J.; Bourzat, D.; Pingali, P. Crop–Livestock Interaction in Sub-Saharan Africa; The World Bank: Washington, DC, USA, 1992. [Google Scholar]
  17. Moriconi-Ebrard, F.; Harre, D.; Heinrigs, P. West African Studies Urbanisation Dynamics in West Africa 1950–2010; OECD Publishing: Paris, France, 2016. [Google Scholar]
  18. WorldClimate. Available online: http://www.worldclimate.com (accessed on 10 February 2016).
  19. Institut National de la Statistique et de la Démographie. Annuaire Statistique 2014; Ministère de la Santé, Direction Générale des Etudes et des Statistiques Sectorielles: Ouagadougou, Burkina Faso, 2015; Available online: http://cns.bf/IMG/pdf/annuaire_2014_du_ms.pdf (accessed on 10 February 2016).
  20. Ghana Statistical Service. 2010 Population and Housing Census; District Analytical Report Tamale Metropolis; Ghana Statistical Service: Accra, Ghana, 2014. Available online: http://www.statsghana.gov.gh/docfiles/2010_District_Report/Northern/Tamale%20Metropolitan.pdf (accessed on 10 February 2016).
  21. Bellwood-Howard, I.; Häring, V.; Karg, H.; Roessler, R.; Schlesinger, J.; Shakya, M. Characteristics of Urban and Peri-Urban Agriculture in West Africa: Results of an Exploratory Survey Conducted in Tamale (Ghana) and Ouagadougou (Burkina Faso); IWMI Working Paper 163; International Water Management Institute: Colombo, Sri Lanka, 2015; Available online: http://www.iwmi.cgiar.org/Publications/Working_Papers/working/wor163.pdf (accessed on 28 January 2016).
  22. Cohen, J. Statistical Power Analysis for the Behavioral Sciences, 2nd ed.; Lawrence Erlbaum Associates Inc.: Mahwah, NJ, USA, 1988. [Google Scholar]
  23. Stevens, J. Applied Multivariate Statistics for the Social Sciences, 2nd ed.; Lawrence Erlbaum Associates, Inc.: Mahwah, NJ, USA, 1992. [Google Scholar]
  24. IBM Corp. IBM SPSS Statistics for Windows. Version 20.0. 2011. [Google Scholar]
  25. Janssen, J.; Laatz, W. Statistische Datenanalyse Mit SPSS, 8th ed.; Springer Gabler: Berlin/Heidelberg, Germany, 2013. [Google Scholar]
  26. Tindano, K.; Moula, N.; Traoré, A.; Leroy, P.; Antoine-Moussiaux, N. Characteristics and typology of sheep herding systems in the suburban area of Ouagadougou (Burkina Faso). Arch. Tierz. 2015, 58, 415–423. [Google Scholar] [CrossRef]
  27. Lupindu, A.M.; Ngowi, H.A.; Dalsgaard, A.; Olsen, J.E.; Msoffe, P.L.M. Current manure management practices and hygiene aspects of urban and peri-urban livestock farming in Tanzania. Livest. Res. Rural Dev. 2012, 24, 167. [Google Scholar]
  28. Diogo, R.V.C.; Buerkert, A.; Schlecht, E. Horizontal nutrient fluxes and food safety in urban and peri-urban vegetable and millet cultivation of Niamey, Niger. Nutr. Cycl. Agroecosyst. 2010, 87, 81–102. [Google Scholar] [CrossRef]
  29. Makita, K.; Fèvre, E.M.; Waiswa, C.; Kaboyo, W.; Eisler, M.C.; Welburn, S.C. Evidence-based identification of the most important livestock related zoonotic diseases in Kampala, Uganda. J. Vet. Med. Sci. 2011, 73, 991–1000. [Google Scholar] [CrossRef] [PubMed]
  30. Kwao, P. Procurement Challenges in the Implementation of Fertilizer Subsidy Program in Ashanti Region. Master’s Thesis, Kwame Nkrumah University of Science and Technology, Kumasi, Ghana, 2014. [Google Scholar]
  31. Herrero, M.; Havlík, P.; Valin, H.; Notenbaert, A.; Rufino, M.C.; Thornton, P.K.; Blümmel, M.; Weiss, F.; Grace, D.; Obersteiner, M. Biomass use, production, feed efficiencies, and greenhouse gas emissions from global livestock systems. Proc. Natl. Acad. Sci. USA 2013, 110, 20888–20893. [Google Scholar] [CrossRef] [PubMed]
  32. Bouwman, A.F.; van Drecht, G.; van der Hoek, K.W. Global and regional surface nitrogen balances in intensive agricultural production systemsfor the period 1970–2030. Pedosphere 2005, 15, 137–155. [Google Scholar]
  33. Diogo, R.V.C.; Schlecht, E.; Buerkert, A.; Rufino, M.C.; van Wijk, M.T. Increasing nutrient use efficiency through improved feeding and manure management in urban and peri-urban livestock units of a West African city: A scenario analysis. Agric. Syst. 2013, 114, 64–72. [Google Scholar] [CrossRef]
  34. Rufino, M.C.; Tittonell, P.; van Wijk, M.T.; Castellanos-Navarrete, A.; Delve, R.J.; de Ridder, N.; Giller, K.E. Manure as a key resource within smallholder farming systems: Analysing farm-scale nutrient cycling efficiencies with the NUANCES framework. Livest. Sci. 2007, 112, 272–287. [Google Scholar] [CrossRef]
  35. Kelder, Y. The Ecology of Urbanization: The Case of Ouagadougou, Burkina Faso. Master’s Thesis, Roskilde University, Roskilde, Denmark, 2011. [Google Scholar]
  36. Tiffen, M. Population Pressure, Migration and Urbanisation: Impacts on Crop—Livestock Systems Development in West Africa; International Livestock Research Institute: Nairobi, Kenya, 2001. [Google Scholar]
  37. Braimoh, A.K. Random and systematic land-cover transitions in northern Ghana. Agric. Ecosyst. Environ. 2006, 113, 254–263. [Google Scholar] [CrossRef]
  38. Katongole, C.B.; Nambi-Kasozi, J.; Lumu, R.; Bareeba, F.; Presto, M.; Ivarsson, E.; Lindberg, J.E. Strategies for coping with feed scarcity among urban and peri-urban livestock farmers in Kampala, Uganda. J. Agric. Rural Dev. Trop. 2012, 113, 165–174. [Google Scholar]
  39. Beauchemin, K.A.; McAllister, T.A.; McGinn, S.M. Dietary mitigation of enteric methane from cattle. CAB Rev. Perspect. Agric. Vet. Sci. Nutr. Nat. Res. 2009, 4, 1–18. [Google Scholar] [CrossRef]
  40. Garnsworthy, P.C.; Craigon, J.; Hernandez-Medrano, J.H.; Saunders, N. Variation among individual dairy cows in methane measurements made on farm during milking. J. Dairy Sci. 2012, 95, 3181–3189. [Google Scholar] [CrossRef] [PubMed]
  41. Naab, F.Z.; Dinye, R.D.; Kasanga, R.K. Urbanisation and its impact on agricultural lands in growing cities in developing countries: A case study of Tamale in Ghana. Mod. Soc. Sci. J. 2013, 2, 256–287. [Google Scholar]
  42. Baah, J.; Tuah, A.K.; Addah, W.; Tait, R.M. Small ruminant production characteristics in urban households in Ghana. Livest. Res. Rural Dev. 2012, 24, 86. [Google Scholar]
  43. Porphyre, V. Enjeux et contraintes des filières porcines en Afrique de l’Ouest. Grain Sel 2009, 46–47, 26–27. [Google Scholar]
  44. Kamuanga, M.; Somda, J.; Sanon, Y.; Kagoné, H. Livestock and Regional Market in the Sahel and West Africa: Potentials and Challenges; Study Carried out within ECOWAS Commission and SWAC/OECD Partnership on the Future of Livestock in the Sahel and West Africa; Sahel and West Africa Club/OECD: Issy-les-Moulineaux, France, 2008; Available online: https://www.oecd.org/swac/publications/41848366.pdf (accessed on 2 February 2016).
  45. Hamadou, S.; Sanon, Y. Synthèse Bibliographique Sur Les Filières Laitières au Burkina-Faso. Document de Travail No. 03. ISRA-BAME, Réseau de Recherche et d’Echange sur les Politiques Laitières. 2006. Available online: http://docplayer.fr/5642841-Synthese-bibliographique-sur-les-filieres-laitieres-au-burkina-faso.html (accessed on 20 January 2016).
  46. Nbambi, O.A.; Tchouamo, I.; Bayemi, P.H.; Hemme, T. Milk production amongst Fulani grazers in the Western Highlands of Cameroon: Constraints and development perspectives. Livest. Res. Rural Dev. 2008, 20, 13. [Google Scholar]
  47. Ageco. Analyse de la Problématique de L’importation de la Poudre de lait au Burkina Faso et de Son Effet sur le Développement de la Filière Lait. Rapport de Mission; Groupe Agéco: Sainte Foy, QC, Canada, 2006; Available online: https://www.abcburkina.net/documents/lait_poudre.pdf (accessed on 2 April 2016).
  48. Food and Agriculture Organization of the United Nations (FAO). FAOSTAT Database Collections; Food and Agriculture Organization of the United Nations: Rome, Italy, 2012; Available online: http://faostat.fao.org/ (accessed on 2 April 2016).
  49. Food and Agriculture Organization of the United Nations (FAO). Livestock Sector Brief Ghana; Food and Agriculture Organization of the United Nations: Rome, Italy, 2005; Available online: http://www.fao.org/ag/againfo/resources/en/publications/sector_briefs/lsb_GHA.pdf (accessed on 2 April 2016).
  50. Nchanji, E.B.; Bellwood-Howard, I.; Schareika, N.; Glaser, R.; Drescher, A.W.; Chagomoka, T.; Schlesinger, J. Land use changes and its implications for food security and sustainability in northern Ghana. In Management of Land Use Systems for Enhanced Food Security: Conflicts, Controversies and Resolutions, Proceedings of Tropentag, Berlin, Germany, 16–18 September 2015; Tielkes, E., Ed.; Cuvillier Verlag: Goettingen, Germany, 2015. [Google Scholar]
  51. Musaba, E.C. Analysis of factors influencing adoption of cattle management technologies by communal farmers in Northern Namibia. Livest. Res. Rural Dev. 2010, 22, 104. [Google Scholar]
  52. Mafimisebi, T.E.; Onyeka, U.P.; Ayinde, I.A.; Ashaolu, O.F. Analysis of farmer-specific socio-economic determinants of adoption of modern livestock management technologies by farmers in Southwest Nigeria. J. Food Agric. Environ. 2006, 4, 183–186. [Google Scholar]
  53. Atuahene, C.C.; Attoh-Kotoku, V.; Mensah, J.J. Poultry production Ghana: Prospects and challenges. Ghana J. Anim. Sci. 2010, 4, 93–99. [Google Scholar]
  54. Food and Agriculture Organization of the United Nations (FAO). Livestock Country Reviews: Poultry Sector Ghana; Animal Production and Health Division; Food and Agriculture Organization of the United Nations: Rome, Italy, 2014; Available online: http://www.fao.org/docrep/019/i3663e/i3663e.pdf (accessed on 30 January 2016).
  55. Schneider, K.; Gugerty, M.K.; Plotnick, R. Poultry Market in West Africa: Burkina Faso; EPAR Brief No. 84; Evans School of Public Affairs, University of Washington: Seattle, WA, USA, 2010; Available online: https://evans.uw.edu/sites/default/files/public/Evans%20UW_Request%2082_Poultry%20Market%20Analysis%20Overview_7-16-2010.pdf (accessed on 30 January 2016).
Figure 1. Graphical characterization of livestock farm types in Ouagadougou (OUA, n = 157) using spider webs: (a) Cluster 1 (OUA-1); (b) Cluster 2 (OUA-2); (c) Cluster 3 (OUA-3); (d) Cluster 4 (OUA-4). Each dot in the spider web displays the relative importance of each variable for the respective cluster. The highest relative possible expression of a variable equals a score of 1, e.g., OUA-2 had the largest mean pig number per household, namely 28.8 pigs. Hence the relative score in the spider web is 1. The mean number of pigs in OUA-1 was 26.2 pigs, equivalent to a relative score of 0.91 in the spider web.
Sustainability 08 01199 g001
Figure 2. Graphical characterization of livestock farm types in Tamale (TAM, n = 172) using spider webs: (a) Cluster 1 (TAM-1); (b) Cluster 2 (TAM-2); (c) Cluster 3 (TAM-3); (d) Cluster 4 (TAM-4). Each dot in the spider web displays the relative importance of each variable for the respective cluster. The highest relative possible expression of a variable equals a score of 1, e.g., TAM-2 had the highest daily milk production, namely 8.5 kg per farm. Hence the relative score in the spider web is 1. The mean milk production in TAM-1 was 7.6 kg, equivalent to a relative score of 0.9 in the spider web.
Sustainability 08 01199 g002
Figure 3. Ways of manure use by (peri-) urban livestock keepers of different livestock farm types in (a) Ouagadougou (OUA; n = 157) and in (b) Tamale (n = 172). For cluster definition see footnote of Table 1 and text.
Sustainability 08 01199 g003
Figure 4. Breeding, health care and housing management of livestock of (peri-) urban livestock keepers of different livestock farm types in (a) Ouagadougou (OUA; n = 157) and in (b) Tamale (TAM; n = 172). For cluster definition see footnote of Table 1 and text.
Sustainability 08 01199 g004
Figure 5. Livestock production systems in Ouagadougou (OUA) and Tamale (TAM) as identified for eight clusters (four per city) based on a sample of 157 and 172 households, respectively. Framed clusters are predominantly located in urban areas of cities. For cluster definition see Table 1 and text. The size of dots reflects the occurrence in the sample.
Sustainability 08 01199 g005
Table 1. Livestock ownership of (peri-) urban households (HH) in Ouagadougou (OUA; n = 157) and Tamale (TAM; n = 172).
Cattle per HHGoats per HHSheep per HHPigs per HHPoultry per HH
Cluster 1n% of HHMean% of HHMean% of HHMean% of HHMean% of HHMean
OUA-1500.0NA40.013.236.018.274.026.258.029.7 a
OUA-217100.08.3 a76.59.876.511.9100.028.894.150.7 c
OUA-354100.015.9 a63.012.277.818.70.0NA81.533.0 b,c
OUA-436100.035.0 b66.715.580.620.30.0NA91.726.3 b
OUA15768.221.158.013.065.018.2 A34.427.077.732.7
SEM (OUA) 1.91 1.17 1.41 3.21 2.48
p-value (OUA) <0.01<0.001<0.050.476<0.010.358<0.010.711<0.01<0.05
TAM-15750.914.857.911.784.216.10.0NA50.935.3
TAM-23585.722.474.312.077.111.90.0NA60.031.9
TAM-33850.014.357.98.381.613.50.0NA68.439.0
TAM-44240.518.871.410.769.010.123.811.969.033.4
TAM17255.217.864.510.878.513.4 B5.811.961.035.0
SEM (TAM) 1.80 0.83 0.96 2.74 2.87
p-value (TAM) <0.0010.2960.2450.4430.3110.123<0.001NA0.2130.852
Both cities32961.419.561.411.872.015.419.524.669.033.8
SEM (cities) 1.32 0.70 0.83 2.82 1.88
p-value (cities) <0.050.2090.2570.128<0.01<0.01<0.0010.052<0.0010.546
1 OUA-1: No cattle, intensifying pig production; OUA-2: Mixed crop-cattle/pig production; OUA-3: Mixed crop-cattle production; OUA-4: Mixed crop-dairy production (Fulani keepers); TAM-1: Urban specializing ruminant production; TAM-2: Peri-urban mixed crop-dairy production, TAM-3: Urban mixed crop-livestock production, TAM-4: Peri-urban mixed crop-livestock production; p-value (TAM) and (OUA) for differences between clusters within cities, p-value (cities) for differences between cities, Fisher’s exact test for proportions and Kruskal-Wallis for interval-scaled data. Mean only calculated for those households with the respective livestock species. Small superscript letters for significant differences between clusters within cities. NA: Not applicable, SEM: Standard error of the mean.
Table 2. Feeding management of livestock owned by (peri-) urban households (HH) in Ouagadougou (OUA; n = 157) and Tamale (TAM; n = 172).
HH with RuminantsRuminant GrazingStall Feeding (Ruminants)HH with PigsScavenge (Pigs)Stall Feeding (Pigs)
Clustern% of HH% of HHn% of HH% of HH
OUA-127100.074.13724.3100.0
OUA-21794.188.21741.294.1
OUA-35492.6100.0---
OUA-436100.0100.0---
OUA13496.393.35429.698.1
p-value (OUA) 0.196<0.001 0.2210.315
TAM-15592.794.5---
TAM-23585.788.6---
TAM-33797.394.6---
TAM-43794.678.41070.080.0
TAM16492.789.61070.080.0
p-value (TAM) 0.2760.058 NANA
Both cities29894.391.36435.995.3
p-value (cities) 0.2170.307 <0.05<0.05
p-value (TAM) and (OUA) for differences between clusters within cities, p-value (cities) for differences between cities. Fisher’s exact test. NA: Not applicable. For cluster definition see footnote of Table 1 and text.
Table 3. Milk, egg and livestock offtake by (peri-) urban livestock keepers in Ouagadougou (OUA; n = 157) and Tamale (TAM; n = 172).
HH with CattleMilking CowsDaily Milk Production (kg/Household)Selling MilkMilk Sold Daily (kg/Household)Selling AnimalsTLU Sold in 2013Poultry KeepersSelling Eggs
Clustern% of HH with CattleMean% of HH with CattleMean% of Total HHMeann% of HH
OUA-10NANANANA78.03.7 a293.4
OUA-2170.0NA0.0NA88.24.3 b1625.0
OUA-35425.946.724.148.777.83.8 a446.8
OUA-436100.016.497.212.097.23.8 a336.1
OUA10746.724.944.921.983.43.8 A1228.2
SEM (OUA) 5.92 6.26 0.34
p-value (OUA) <0.0010.761<0.0010.2890.056<0.05 0.066
TAM-12934.57.610.34.382.52.2 a2931.0
TAM-230100.08.580.06.394.31.8 a2142.9
TAM-3190.0NA0.0NA84.21.0 b2638.5
TAM-4170.0NA0.0NA97.61.1 b2941.4
TAM9542.18.228.45.989.01.6 B10538.1
SEM (TAM) 0.66 0.72 0.18
p-value (TAM) <0.0010.468<0.050.1830.057<0.05 0.817
Both cities20244.616.537.115.386.32.622722.0
SEM (cities) 3.05 3.76 0.20
p-value (cities) 0.571<0.001<0.05<0.0010.152<0.001 <0.001
Total number of households: OUA-1 = 50, OUA-2 = 17, OUA-3 = 54, OUA-4 = 36, OUA = 157; TAM-1 = 57, TAM-2 = 35, TAM-3 = 38; TAM-4 = 42, TAM = 172; both cities = 329; p-value (TAM) and (OUA) for differences between clusters within cities; p-value (cities) for differences between cities. Fisher’s exact test for proportions and Kruskal-Wallis for interval-scaled data. Small superscript letters for significant differences between clusters within cities. HH: Household. NA: Not applicable. SEM: Standard error of the mean. For cluster definition see footnote of Table 1 and text.
Table 4. Main occupation (self-assessed) of household heads of (peri-) urban livestock-keeping households (HH) in Ouagadougou (OUA; n = 157) and Tamale (TAM; n = 172).
HHLivestock KeeperCrop-Livestock FarmerSelf-EmployedEmployedRetiredOther Occupation
Clustern%%%%%%
OUA-15014.030.026.010.04.016.0
OUA-2175.958.817.65.911.80.0
OUA-35411.137.022.216.75.67.4
OUA-43619.458.311.111.10.00.0
OUA15713.442.020.412.14.57.6
p-value (OUA) 0.574<0.050.3980.6690.229<0.05
TAM-15715.822.822.814.08.815.8
TAM-2355.765.78.68.60.011.4
TAM-3380.057.910.515.82.613.2
TAM-4424.869.011.911.90.02.4
TAM1727.650.60.23012.83.511.0
p-value (TAM) <0.05<0.001 0.8260.0630.150
Both cities32910.346.517.312.54.09.4
p-value (cities) 0.1030.1230.1900.8690.7790.347
p-value (TAM) and (OUA) for differences between clusters within cities; p-value (cities) for differences between cities. Fisher’s exact test. For cluster definition see footnote of Table 1 and text.
Table 5. Number of livestock species per household (HH) and livestock species used by specialized (peri-) urban livestock-keeping HH in Ouagadougou (OUA; n = 157) and Tamale (TAM; n = 172).
HHOne Livestock SpeciesType of Single Livestock SpeciesTwo Livestock SpeciesThree or More Livestock Species
Clustern%%%%
OUA-15026.0Pigs (100.0)48.026.0
OUA-2170.0-0.0100.0
OUA-3541.9Cattle (100.0)11.187.0
OUA-4365.6Cattle (100.0)5.688.9
OUA15710.2Pigs (81.2), cattle (18.8)20.469.4
p-value (OUA) <0.001 <0.001<0.001
TAM-15721.1Sheep (66.7), cattle (16.7), local poultry (16.7)31.647.4
TAM-2355.7Cattle (50.0), goats (50.0)17.177.1
TAM-33815.8Sheep (50.0), cattle, goats, local poultry (16.7 each)31.652.6
TAM-4429.5Pigs (75.0), local poultry (25.0)28.661.9
TAM17214.0Sheep (45.8), cattle (16.7), local poultry (16.7), pigs (12.5), goats (8.3)27.958.1
p-value (TAM) 0.173 0.438< 0.05
Both cities32912.2Pigs (40.0), sheep (27.5), cattle (17.5), local poultry (10.0), goats (5.0)24.363.5
p-value (cities) 0.316 0.124< 0.05
p-value (TAM) and (OUA) for differences between clusters within cities; p-value (cities) for differences between cities. Fisher’s exact test. For cluster definition see footnote of Table 1 and text.
Table 6. Logistic regression parameters for variables predicting integration of livestock keeping and cropping or specialization in milk production across households (n = 329) in Tamale (TAM) and Ouagadougou (OUA).
PredictorsßSE Wald’s χ2Dfp-ValueOdds Ratio
Integration of livestock and crops
Constant−0.7750.4512.95310.086NA
TAM1.9320.40721.01210.0006.902
Peri-urban location2.1830.42925.92010.0008.870
Education level 15.11430.002
Education level 1 (primary education)−0.4310.4650.85810.3540.650
Education level 2 (secondary education)−0.9740.3866.36710.0120.378
Education level 3 (tertiary education)−1.8440.50613.30210.0000.158
Land ownership 6.15020.046
Land ownership 1 (allocated land )0.6720.4552.18610.1391.959
Land ownership 2 (borrowed, leased)1.8140.8254.83110.0286.137
Total TLU owned (n)0.0240.0152.47510.1161.024
Available labor force (n)−0.0210.0450.22310.6370.979
Goodness-of-fit test (model χ2) 96.69890.000
Milk production
Constant−2.1790.48320.36210.000NA
TAM0.9240.3487.03610.0082.519
Peri-urban location−0.4090.3961.06910.3010.664
Education level 6.62030.085
Education level 1 (primary education)−1.2260.5984.19610.0410.294
Education level 2 (secondary education)0.3960.3561.24010.2651.486
Education level 3 (tertiary education)0.1040.5090.04210.8391.109
Land ownership 5.88620.053
Land ownership 1 (allocated land)0.7230.4173.00010.0832.060
Land ownership 2 (borrowed, leased)−0.9330.7051.74810.1860.394
Total TLU owned (n)0.1080.01742.64010.0001.114
Available labor force (n)−0.0730.0502.12910.1450.930
Goodness-of-fit test (model χ2) 106.2190.000
NA: Not applicable.
Table 7. Logistic regression parameters for variables predicting intensification of livestock management in terms of breeding, housing and health care across households (n = 329) in Tamale (TAM) and Ouagadougou (OUA).
PredictorsßSE Wald’s χ2Dfp-ValueOdds Ratio
Controlled mating
Constant−1.1790.4925.74610.017NA
TAM−2.8010.42743.10110.0000.061
Peri-urban location0.2930.4330.45610.4991.340
Education level 7.86830.049
Education level 1 (primary education)0.0230.4270.00310.9561.024
Education level 2 (secondary education)0.9920.4544.77210.0292.698
Education level 3 (tertiary education)1.3620.6624.22510.0403.903
Land ownership 6.87720.032
Land ownership 1 (allocated land)1.0980.4276.61610.0102.998
Land ownership 2 (borrowed, leased)0.8970.7011.63710.2012.451
Total TLU owned (n)0.0200.0113.30810.0691.020
Available labor force (n)−0.0340.0520.42110.5160.967
Goodness-of-fit test (model χ2) 135.75690.000
Animals kept in barns
Constant0.1130.3530.10310.749NA
TAM0.5090.2743.46110.0631.663
Peri-urban location0.1540.3130.24010.6241.166
Education level 17.52330.001
Education level 1 (primary education)0.3840.3501.20910.2721.469
Education level 2 (secondary education)0.8840.3277.33210.0072.422
Education level 3 (tertiary education)2.3830.66912.67210.00010.838
Land ownership 2.27930.320
Land ownership 1 (allocated land)0.0420.3340.01610.8991.043
Land ownership 2 (borrowed, leased)−0.7510.5252.04910.1520.472
Total TLU owned (n)−0.0240.0106.28910.0120.976
Available labor force (n)−0.0040.0350.01410.9050.996
Goodness-of-fit test (model χ2) 37.95190.000
Animal health care
Constant1.6490.45213.33210.000NA
TAM−1.2700.36112.35810.0000.281
Peri-urban location−0.0270.3610.00510.9410.974
Education level 5.69430.127
Education level 1 (primary education)−0.0990.4380.05110.8210.906
Education level 2 (secondary education)0.9270.4055.23810.0222.526
Education level 3 (tertiary education)0.2310.5360.18610.6661.260
Land ownership 1.68020.432
Land ownership 1 (allocated land)0.5400.4291.58410.2081.715
Land ownership 2 (borrowed, leased)−0.0220.5790.00110.9700.978
Total TLU owned (n)0.0150.0151.03810.3081.015
Available labor force (n)0.0050.0400.01310.9081.005
Goodness-of-fit test (model χ2) 32.34890.000
NA: Not applicable.
Table 8. Use of family labor and hired labor for livestock activities in Ouagadougou (OUA; n = 157) and Tamale (TAM; n = 172).
HHFamily LaborHired Labor
Clustern% of HH% of HH
OUA-15098.024.0
OUA-21788.252.9
OUA-35488.937.0
OUA-43688.952.8
OUA15791.738.2
p-value (OUA) 0.282<0.05
TAM-157100.017.5
TAM-23597.137.1
TAM-338100.028.9
TAM-442100.019.0
TAM17299.424.4
p-value (TAM) 0.2680.132
Both cities32995.731.0
p-value (cities) <0.001<0.01
p-value (TAM) and (OUA) for differences between clusters within cities; p-value (cities) for differences between cities. Fisher’s exact test. HH: Household. For definition of clusters see footnote of Table 1 and text.

