Article

Methodology for Monitoring Sustainable Development of Isolated Microgrids in Rural Communities

1
Department of Electrical Engineering, University of Chile, Santiago 8370451, Chile
2
Escuela de Ingeniería Química, Facultad de Ingeniería, Universidad de San Carlos de Guatemala, Ciudad Universitaria, 11 Av., Guatemala 01012, Guatemala
3
Energy and Resources Group and Goldman School of Public Policy, University of California, Berkeley, CA 94720-3050, USA
4
Goldman School of Public Policy, University of California, Berkeley, CA 94720, USA
*
Author to whom correspondence should be addressed.
Sustainability 2016, 8(11), 1163; https://doi.org/10.3390/su8111163
Submission received: 1 July 2016 / Revised: 30 October 2016 / Accepted: 31 October 2016 / Published: 10 November 2016

Abstract

:
Microgrids are a rapidly evolving and increasingly common form of local power generation used to serve the needs of both rural and urban communities. In this paper, we present a methodology to evaluate the evolution of the sustainability of stand-alone microgrids projects. The proposed methodology considers a composite sustainability index (CSI) that includes both positive and negative impacts of the operation of the microgrid in a given community. The CSI is constructed along environmental, social, economic and technical dimensions of the microgrid. The sub-indexes of each dimension are aggregated into the CSI via a set of adaptive weighting factors, which indicate the relative importance of the corresponding dimension in the sustainability goals. The proposed methodology aims to be a support instrument for policy makers especially when defining sound corrective measures to guarantee the sustainability of small, isolated microgrid projects. To validate the performance of the proposed methodology, a microgrid installed in the northern part of Chile (Huatacondo) has been used as a benchmarking project.

1. Introduction

Energy systems play a vital role in the social and economic development of communities and nations, and directly in the quality of life of individuals [1]. Electricity access has been documented to be a key factor in improving the welfare and living standards of human beings [2]. Despite the dramatic technological developments of recent years, around one-third of the world’s population still relies on the use of animal power and noncommercial fuels [2]. Indeed, roughly 1.2 billion people around the world still have no regular access to electricity [3]. Most of these people live in remote rural areas where electrification projects are difficult to implement due to high investment costs, low rates of return, and technical issues.
Microgrids projects have emerged as a promising solution to electrify remote rural and under-served urban areas [4]. A microgrid is a localized group of generation and storage devices working together to supply a local demand [5]. Generation can be based on photovoltaics, wind power, fossil-fueled distributed generation, or a combination of these and other technologies. Microgrids are able to operate connected to a main grid or in stand-alone (often called off-grid). Rural electrification projects usually refer to the implementation of stand-alone microgrids. Due in part to their versatility, microgrids have become a mainstream tool to electrify rural areas [6]. This also has been motivated by: (i) technological developments; and (ii) the decrease of the investment costs of both renewable energy technologies and storage devices.
Nevertheless, depending on the characteristics of the microgrid, its operation for electricity production can have positive economic and social impacts as well as potentially negative impacts on people and the environment. In the case of rural electrification, the positive effects include technological and economic development as well as the increase of the living standard of the community. For instance, one may expect a diversification of the economic activities of the community and an increase in the employment level of the community members [6]. The negative effects include, for instance, environmental problems due to the operation of fossil-fueled generation units often needed as backup generation when renewable energies are not available. One of the major environmental impacts is the release of greenhouse gases and other emissions that can that can lead to health problems. Moreover, negative effects on residents’ quality of life may also arise if the microgrid increases the level of noise or visually impact the landscape of the community [5].
Traditionally, negative impacts related to electricity production have been ignored or at least underestimated in many generation projects [7]. In the design phase of those projects, economic and technical aspects have been considered first priority since global resource depletion, climate change, and other social or environment issues were not of major concern. However, the negative impacts of any energy system cannot be further ignored during their design phase. In fact, rural electrification of remote communities must also be done considering sustainability criteria. This means that the design of microgrid projects must consider each relevant dimension in our system, i.e., the environmental, social, economic and technical. A unified/integral assessment of energy projects that considers all dimensions involved allows designers to achieve the global optimum for the society and therefore the best sustainability outcome for the project [7].
From a policy perspective, it is important to have support tools that allow the assessment of different alternatives when implementing a microgrid project. Based on such assessments, non-sustainable and sustainable configurations are identified so that the best alternative for a particular community is selected. Moreover, support instruments are required to monitor the temporal evolution/trend of each relevant dimension in existing microgrids. Monitoring results are important for long-term policy making especially when defining sound corrective measures to guarantee the sustainability of those projects.
This work presents a methodology to evaluate the evolution of the sustainability in isolated microgrids. The proposed methodology considers a composite sustainability index (CSI), which includes positive and negative impacts of a microgrid’s operation in a given community. The CSI is constructed considering a unified-sustainable perspective, which includes the environmental, technical, economic, and social dimension of sustainability. The sub-indexes of each dimension are aggregated into the CSI to gauge the overall performance of the microgrid from a sustainability perspective. The aggregation process is performed considering a set of weighting factors that indicate the relative importance of a particular dimension in the sustainability goals. Although other works have addressed the evaluation of the sustainability in energy projects, all of them included fixed weighting factors. Conversely, this work includes an adaptation procedure for the weighting factors. The objective of this process is accelerating the movement of the microgrid towards the set of predefined sustainability goals. The proposed methodology aims to be a support instrument for policy makers in defining sound corrective measures to guarantee the sustainability of isolated microgrids. To validate the performance of the proposed methodology, a microgrid installed in Huatacondo, located in the northern part of Chile, has been used as a benchmarking tool.
This paper is organized as follows: Section 2 presents the literature review. Section 3 presents the definition used in this work for a sustainable isolated microgrid. In Section 4, general aspects to be considered in the selection and definition of the sustainability indicators are presented. Section 5 introduces the indicators proposed and the algorithm to obtain the proposed CSI using these indicators. The proposed framework for monitoring the sustainable development of an existing microgrid is presented in Section 6. Section 7 summarizes the case study and the obtained results. Finally, Section 8 presents the conclusions of this work.

2. Related Works

The published literature about sustainable energy decision-making has several examples of multi-criteria decision analysis in sustainable energy scenarios [1,8,9], often considering social, technical, environmental and economic dimensions. The assessment is usually made through a set of indicators [10,11]. The main role of these indicators is to operationalize the concept in order to simplify the evaluation process and to enable an easier use of the obtained assessments by stakeholders, developers, policy makers, etc. [12]. In earlier studies, a design and planning method for the development of remote microgrids is presented using a sustainable perspective [4]. The method is based on a multi-objective optimization. Other authors present a framework to assess the sustainability and reliability of different power production scenarios in a regional system [5]. This framework calculated four sub-indexes (technical, environmental, economic and reliability sub-index) for the different scenarios. For each scenario, a composite index is calculated as a simple average of the four sub-indexes. In [10], a new sustainability index to assess the sustainability status of any energy system by a single criterion is presented. Other authors propose a methodology to analyze the sustainability of the expansion of electricity generation considering an integrated perspective including technical, socioeconomic, environmental and technological factors [11]. The methodology uses a multicriteria approach. Another group of authors present a multi-criteria approach to assess the sustainability of different scenarios concerning the Croatian co-generation sector’s future development [13]. To do this, environmental, social and economic sustainability indicators are defined and calculated. The sustainability assessment is based on the General Sustainability Index rating for different cases reflecting different criteria and their priority. Finally, in another relevant recent work, a methodology to select, define and apply a set of sustainability indicators for an energy system assessment is presented [6]. The proposed methodology considers resource, environment, social, and economic criteria as well as a general index for sustainability assessment based on the contribution of individual criteria.

3. Definition of Sustainable Isolated Microgrid

In this section, the concept of a sustainable isolated microgrid is discussed. Sustainability and sustainable development have been the subjects of wide discussions and debates around the world in recent years [1]. While sustainability denotes a system property referred to as a quality [14], sustainable development means “the way to meet the needs of the present without compromising the ability of future generations to meet their own established needs” [14,15]. However, this is a rather broad definition, which is difficult to translate into quantifiable criteria to be used in the practical assessment of microgrid projects. Thus, in the context of energy supply, sustainable development is defined as a system with the following features: (i) balance between energy production and consumption; (ii) minimal negative environmental impacts; and (iii) preservation of social and economic activities of the population [1]. Nonetheless, in energy projects, economic, social, environmental, and technical aspects change dynamically over time [16]. Their evolution is determined by several external factors that cannot be controlled directly (e.g., policies and climate changes). Therefore, the future evolution of microgrids projects is hard to predict.
Given the definition of sustainable development in an energy framework, in this paper a sustainable isolated microgrid is defined as an isolated microgrid that is able to maintain the balance between energy production and consumption with minimal environmental effects, and whose operation does not compromise the economic and social activities of the community where the project has been implemented. This definition implies that the microgrid project must satisfy the following four requirements [4].
  • Technical sustainability: The implementation of the microgrid project must be possible with current available technologies without compromising the operation of critical elements.
  • Economical sustainability: The microgrid project must be implemented so that the efficient use of the energy allows the community and the microgrid profitable functioning over time.
  • Social sustainability: The microgrid project must be accepted by the community and must promote its social development and engagement.
  • Environmental sustainability: The microgrid project must bring larger environmental benefits than the use of traditional electrification alternatives (e.g., only diesel-based electrification projects).
The aforementioned requirements allow including the assessment of the sustainability of a microgrid project during both the design and implementation phases. Furthermore, indicators and composited indexes could also be defined to continuously assess the evolution of the sustainability of the project, and then to establish measures/policies towards guaranteeing its sustainability. The next section puts forward the general aspects considered in this paper for the selection of sustainability indicators.

4. General Aspects for the Selection and Definition of the Indicators

4.1. Representation of Sustainability Dimensions

The proposed methodology for evaluating and monitoring the sustainable development of an existing microgrid is based on a CSI. The selection of the indicators to be included in the CSI was based on the representation of the sustainability dimensions shown in Figure 1 [17]. In Figure 1, inner and outer circles connect the dimensions of sustainability. As can be seen, economic and technological aspects are an integral part of the society (they are inside the society circle). Moreover, economy, technology, and society aspects determine how the environment evolves.
Exploiting the relationships depicted in Figure 1 requires an appropriate definition of the boundaries of each dimension. Such boundaries are determined by the thresholds set for each individual indicator included in the CSI. The thresholds must be set so as to ensure that the vulnerability to potential crises in each dimension is minimized [17]. However, identifying all potential crises is not an easy task. Thus, the use of absolute values may not entirely matter. Instead, a notion of what is acceptable is commonly used. Further details in this regard are given in Section 6.

4.2. Requirements on the Indicators

During recent years several works have published guidelines for the selection of sustainable indicators [18,19,20]. Although a single widely accepted methodology has still not been adopted [21], it is generally accepted that the set of indicators should reflect the sustainability concept as a whole and also should reflect the interactions among its dimensions (see Figure 1). To meet these goals, the selected indicators must fulfill the following requirements:
(1)
Be capable of being “measured” quantitatively and/or qualitatively [15,22].
(2)
Be understandable by the community including those who are not experts [22].
(3)
Be defined based on available data in the microgrid or information that can be gathered if necessary [22].
(4)
For each indicator, it must be possible to define a lower and upper threshold in order to perform a normalization process.
While the first and third requirements enable the monitoring process, the second requirement fosters community engagement. Finally, the fourth requirement enables the definition of the boundaries for each dimension shown in Figure 1. Further details on this regard are presented in the next section.
To exemplify how these requirements are applied, consider the emissions indicator. This indicator is broadly used to evaluate the environmental effects of a microgrid project. This indicator is measurable and quantifiable, and is easily understandable by both expert and non-experts in a community. In addition, it promotes the reduction of the use of fossil-fueled energy sources and fosters the engagement of the community through the achievement of a common goal: to minimize the emissions of the microgrid. Moreover, this indicator allows the definition of maximum and minimum thresholds, and enables the definition of the effects of the massive use of fossil-fueled energy sources. Thus, this indicator satisfies all the aforementioned requirements and thus it could be used as indicator to construct the CSI.

5. Indicators of Sustainable Development Applied to Isolated Microgrids

In this section, the set of indicators used to evaluate the economic, technical, environmental, and social dimensions of a microgrid project are presented. These indicators have been selected taking into account the requirements analyzed in Section 4.

5.1. Enviromental Dimension

Environmental sustainability means maintaining or improving the integrity of the life supporting systems of the earth [14]. This includes enabling current and future generations to achieve economic and social improvement while maintaining both the biological diversity and the biogeochemical integrity of the biosphere, by means of conservation and proper use of air, water, and land resources. Since diesel generators are often used to support the operation in isolated microgrid projects, this dimension is strongly related to monitoring the emissions associated with these energy sources. In this work, the indicators used to measure the environmental dimension focuses on the following areas: gases emission, noise and other contaminants (see Figure 2). Although indicators related to particulate matter emissions are usually considered in this dimension, they are not included in this work due to the inherent difficulty of measurement.
(a)
Greenhouse gas emission: Several gases are released into the atmosphere during the combustion process of fossil fuels due to the operation of diesel generators [1,7]. Depending on the technology used and on the fuel quality, these gases may have a direct impact on the health of the community and contribute to the greenhouse effect and global warming [1]. Thus, monitoring such emissions helps to formulate strategies to reduce the negative effects associated with the intensive use of these energy sources.
(b)
Noise and contamination: In addition to gas and particulate matter emissions, a microgrid project could involve the use of hazardous substances for the environment and human health (e.g., substances used in battery storage systems, biogas production, and the diesel itself) [7]. Furthermore, the noise produced by power converters and fossil-fueled generators might threaten the health of the environment surrounding an isolated microgrid. Hence, monitoring the use of hazardous substances, levels of noise and how wastes are managed is essential for the sustainability of a microgrid project.

5.2. Social Dimension

Social sustainability is defined as “the extent to which social values, social identities, social relationships and social institutions can continue into the future” [14]. Since microgrid projects have a direct impact on the community development, this dimension regards monitoring the evolution of the social progress of the community where the microgrid is implemented. Social development is monitored through four main areas, namely, equity and affordability, community development, health and risks, and community engagement. Figure 3 presents these areas and Appendix C summarizes the social indicators proposed in this paper. Below each area is described.
(a)
Equity and affordability: Equity and affordability in microgrid projects regards the coverage of electricity service in a community and the price the users must pay for such service. For a proper social development, coverage should be maximized while the price of the service must be kept at a fair level. Thus, a continuous monitoring of these variables is required as well as the definition of policies to guarantee that the aforementioned objectives are achieved [23].
(b)
Community development: Community development criteria express the social progress obtained by the implementation of a microgrid project. Given a baseline (the situation of the community before implementing a microgrid), monitoring the extent to which economical activities have grown, new economic activities have appeared, the relationship among the inhabitants has strengthened, and common objectives have been achieved, provides information about the impact of the microgrid project in the community and allows defining strategies to foster its sustainability [1].
(c)
Health and risks: health and risk in microgrid projects refer to the use of electricity for medical purposes. In particular, the extent to which health care has increased since the implementation of the microgrid. This includes available hours for attention, quality of service, quality of the medicines, coverage level, and the effects that these factors have in the members of the community [24].
(d)
Community engagement: The community engagement in a microgrid project involves the relationship between the members of the community and the developers of the microgrid project [6]. In particular, it concerns how the community has organized to monitor the state of the microgrid. The formation of committees in charge of the maintenance of the energy sources, of assessing the energy use, and of gathering the resources for equipment replacement are examples of community organization around a microgrid project.

5.3. Economic Dimension

Often, the implementation of isolated microgrid projects is motivated by social aspects such as equity in the supply of the electricity service. However, microgrid projects are costly and thus promoters are required. However, generally, promoters have economic rather than social motivations. Hence, advantages that justify the incurred costs (investment, operation and maintenance) must be analyzed [13]. In several cases, these advantages come from corporate social responsibility incentives. In this context, economic sustainability means the optimal use and management of resources to avoid compromising the incomes in the future [14]. This could be associated with inventive policies that foster the investment on these projects. Despite the motivation and the financial mechanism, this paper proposes to evaluate the economic dimension of isolated microgrid projects based on four areas: investment, operation and maintenance (O & M), fuel cost, and electricity cost (see Figure 4). Appendix B presents the economic indicators proposed in this paper.
(a)
Investment: The investment is one of the most common indicators to evaluate energy systems from an economic perspective [25]. From a sustainability viewpoint, monitoring the investment not only at the initial stage but also throughout the evolution of the project allows determining the economic viability of an isolated microgrid project. Often, the investment indicator includes expansion of the grid and increasing the capacity of the energy sources. However, the economic viability of the project should not only be evaluated in terms of economic profit. The improvement in the corporate image and other externalities that produce indirect incentives for the investment should be also included in the viability assessment.
(b)
Operation and maintenance costs: Operation and maintenance costs involve the normal operation of the microgrid and all activities done to keep the microgrid operative [25]. Examples of these activities are the cleaning of solar panels, the inspection of the distribution grid to identify possible sources of abnormal operation, and keeping the fuel at a level that guarantees the operation of diesel generators. The monitoring of operation and maintenance activities is part of the assessment of the economic viability of an isolated microgrid project, and allows for the definition of policies to foster its sustainability.
(c)
Fuel costs: Fuel cost refers to the costs spent for the provision of fuel necessary for the microgrid operation. This includes transportation, storage, and the cost of the fuel itself. The monitoring of the fuel costs allows predicting its availability in the future and formulating strategies of consumption and provisioning to avoid power outages, especially during the night hours.
(d)
Electricity costs: Electricity cost has been used as a criterion to evaluate the economic performance of energy systems from the viewpoint of consumers. In isolated microgrid projects, this value is associated with investment and operational costs. Although this value is easy to calculate, often in isolated microgrids the price paid by the customers for the electricity does not reflect its real cost. This situation arises because inhabitants of remote communities normally have little income and therefore the electricity must be subsidized. Thus, keeping a balance between investment, operation and maintenance, as well as electricity costs is necessary for the sustainability of the project.

5.4. Technical Dimension

Satisfying and responding to customer requirements is one of the key features of isolated microgrids [26]. The quality and reliability of electricity supply services are influenced by diverse factors, such as the performance of the distribution network, the types of distributed generation (DG) sources, the control systems, and the characteristics of the load. In this sense, an isolated microgrid is technically sustainable if current technologies are able to provide a proper quality of service to a community, when operating within their normal limits [26]. In this paper, the technical dimension is assessed from four perspectives: efficiency, primary energy use, reliability and power quality, and microgrid management (see Figure 5). Appendix D presents the indicators proposed in this paper to evaluate the technical dimension of microgrid projects.
(a)
Efficiency: Efficiency refers to how the energy produced by the sources in a microgrid is used. Compared with bulk power systems, in general in isolated microgrid projects load centers are placed nearer the energy sources. Consequently, distribution losses are reduced. However, in isolated microgrids the energy resources are limited. Hence, a proper use of the energy by the customers must be promoted. Thereby, the monitoring of the use of electricity through the behavior of the demand (e.g., peak values, tendency, and location of peak values) is essential to guarantee the sustainability of the project from a technical viewpoint, since demand side management strategies could be designed to foster a rational use of electricity.
(b)
Primary energy use: Primary energy is defined as a type of energy found in nature that has not been subjected to any conversion or transformation process. In isolated microgrid projects, solar radiation, wind speed, diesel, and chemical reactions are typically used as primary energies. Due to the environmental and economic costs associated with the use of diesel as primary energy source, monitoring the percentage of the demand supplied with diesel is required for sustainable development purposes. Indeed, reducing the use of diesel as primary energy source has a positive impact in economic and environmental dimensions and might foster the sustainability of the project.
(c)
Reliability and power quality: Reliability and power quality indicators measure the vulnerability of a microgrid from a technical viewpoint. As in large power systems, frequency and voltage deviations from their desired values (nominal values) as well as the number of power outages in a predefined period of study are used to measure this indicator. Since frequency and voltage deviations as well as power outages might affect the electrical equipment within a microgrid, monitoring these variables helps to take actions to reduce their number so that economic activities and domestic equipment are not severely affected. Consequently, a positive (complimentary) effect on economic and social dimensions is envisioned.
(d)
Microgrid management: Microgrid management regards the activities carried out by the community to keep the performance of a microgrid at a desired level. Often, the performance of a microgrid is measured by means of the quality of service provided to the customers. Therefore, fulfilling the electricity requirements of the community implies continuously monitoring the quality of service provided. From the sustainability perspective, microgrid management has a complimentary effect on social and economic dimensions. In this sense, microgrid management is an important aspect of the sustainability of the project.

5.5. Further Classification of Indicators

As we review in Section 5.1, Section 5.2, Section 5.3 and Section 5.4, there are several areas related to one another, and others that seems to evaluate similar aspects regarding the sustainability of an isolated microgrid project. To organize the process of sustainability assessment and to make the formulation of the proposed CSI easier, in this paper, a further classification of the indicators is introduced. Such a classification is based on their level of intervention. The level of intervention classifies the indicators according to the time span of their analysis (e.g., long, medium and short term), and according to their impact in the community (e.g., environment and community as a whole or just the community). For these purposes, three levels of intervention have been considered, namely, impact indicator (II), outcome indicator (OI), and process indicator (PI) [27]. Impact indicators measure both long- and medium-term effects of an isolated microgrid project on the community. Due to the time span of analysis, these indicators must consider the community and the environment as a whole; that is, how they relate with each other during the period of analysis. Outcome indicators measure the short-term effects of an isolated microgrid project in a community. In particular, they measure how the operation of a microgrid impacts the social and economic activities of the members of the community. In this case, environmental impacts are not considered since they have a low rate of change and therefore the effect only can be measured in the medium- and long-term time spans. Finally, process indicators measure technical and administrative aspects in the operation of an isolated microgrid. Often, these indicators are formulated to analyze short- and medium-term effects of a microgrid project. They measure the relationship between the community and the microgrid from a management viewpoint.
For a proper assessment of the sustainability of an isolated microgrid project, it is desirable that each of the four dimensions under consideration, environment, social, economic, and technical, has at least one indicator at each level of intervention (impact, outcome, and process).

5.6. Methodology to Obtain the CSI

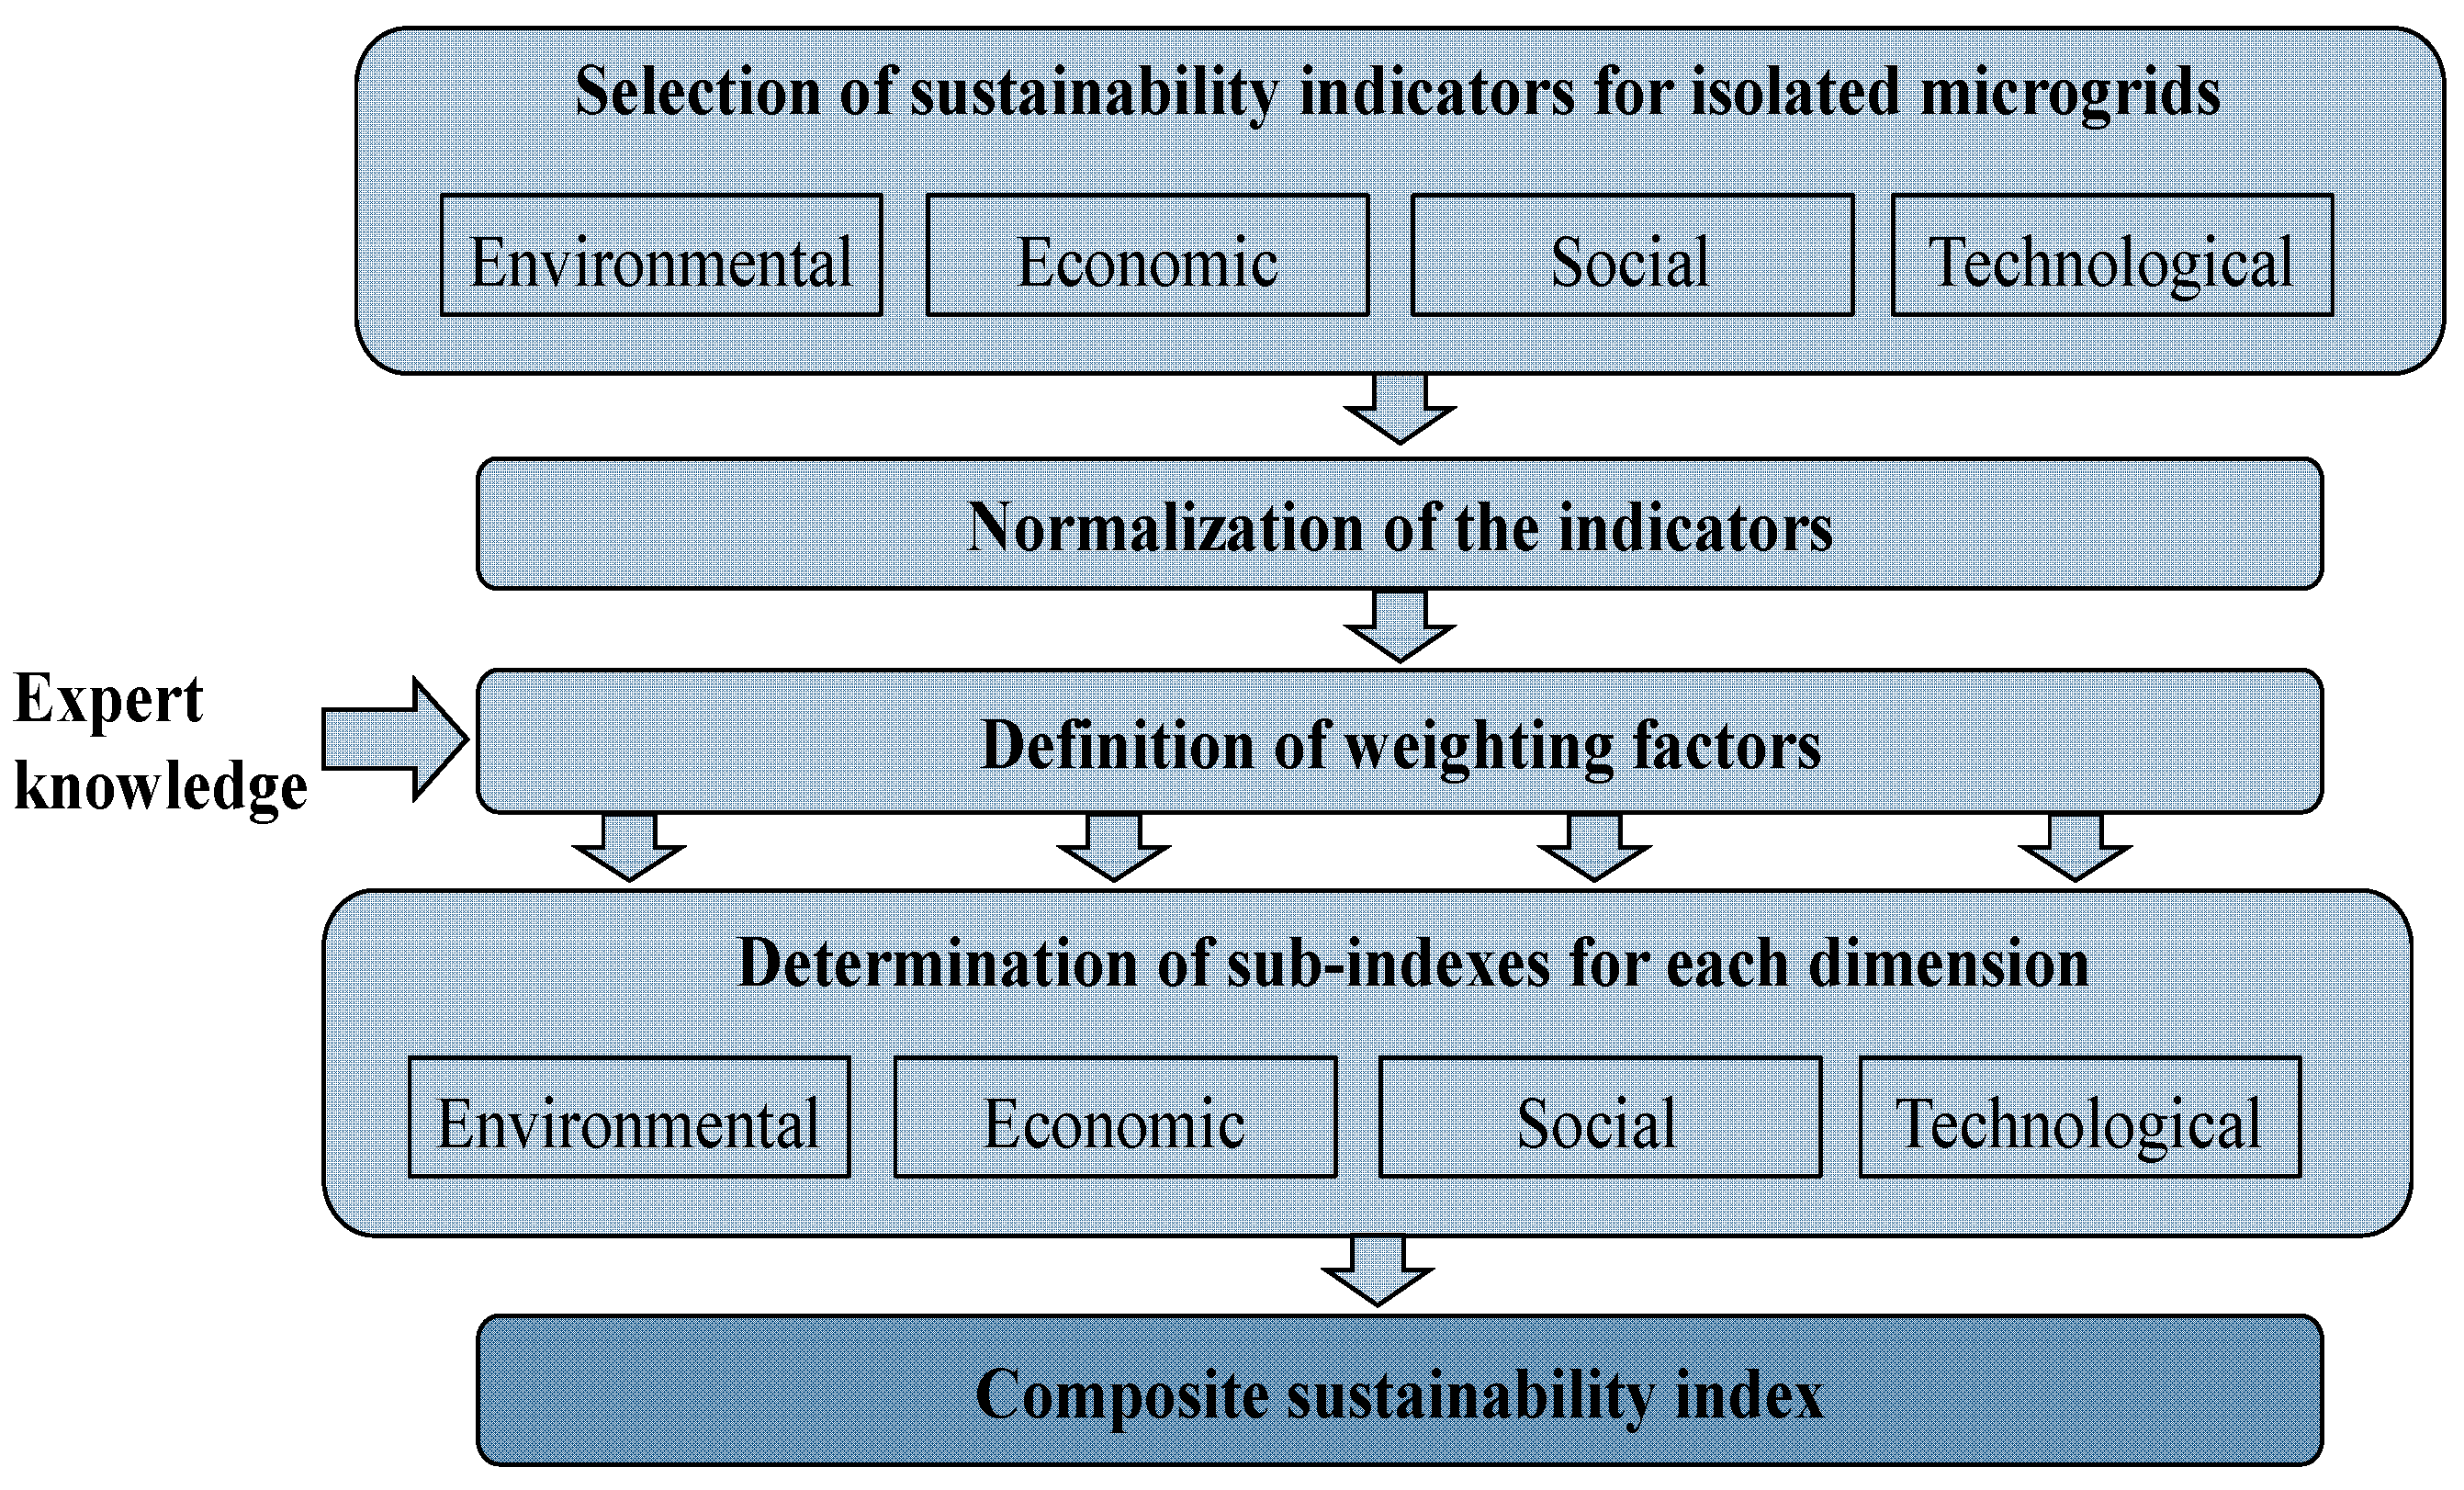
Although a large set of indicators offers a complete “picture” of the microgrid situation, their utilization by policy makers would be complex [21]. To facilitate the decision-making process, it is desirable to combine these indicators into a single composite index able to reflect—in a simplified way—the wholeness of the sustainability concept in the development of a microgrid. Figure 6 shows the algorithm to obtain the proposed composite sustainability index (CSI).
Once the set of indicators for each dimension is defined, the next step of the methodology is to normalize these indicators and then define the pertinent weighting factors. Based on the normalized indicators, those belonging to a particular dimension are grouped to form the pertinent sub-index (for each dimension), which are finally grouped to form the CSI.

5.6.1. Normalization of the Indicators

The selected indicators might be expressed in different units and thus they cannot be used in their initial form for the calculation of the sub-indexes or the CSI [28]. As a consequence, a normalization process for each indicator is performed based on linear functions considering lower and upper thresholds [5,24,29]. For those indicators for which a bigger value denotes a better situation from a sustainability perspective, the normalization is performed according to:
I ¯ i d = { 0   i f   I i d < l l i d I i d l l i d u l i d l l i d i f     l l i d < I i d < u l i d 1 i f   I i d > u l i d
Otherwise:
I ¯ i d = { 1   i f   I i d < l l i d u l i d I i d u l i d l l i d i f     l l i d < I i d < u l i d 0 i f   I i d > u l i d
where I i d is the indicator i of dimension d , I ¯ i d is its normalized value (non-dimensional), l l i d is the lower limit or threshold of I i d , and u l i d is its upper limit. With the proposed normalization process, whether an indicator moves towards 1 means that the sustainability has being increased, otherwise countermeasure actions must be undertaken to improve the sustainability of the project.
The boundary values of the indicators can be determined based on national or international standards, empirical judgment, environment background values, and/or the average global values [10,21]. The upper limit should be set according to the best value from a sustainability perspective and the lower limit considering the worst case. The boundary values for each indicator proposed in this work are included in the Annexes.

5.6.2. Definition of Weighting Factors

In order to calculate the sub-indexes for each category, the relative importance of each indicator within its pertinent dimension has to be specified. Since different weighting factors will lead to different results, it is necessary to obtain rationality and veracity criteria to select the weights [1]. However, the determination of the “true” individual importance of each indicator is not possible. Indeed, the relative importance of each indicator will vary among people with different backgrounds, cultural environments, social origins, education levels, life experiences, among others things [5,7]. Moreover, subjectivity of preferences among different decision groups may also lead to different sets of weighting factors even within the same cultures and/or education levels. To overcome this obstacle, one typical solution is to use the equal weights method [1,29]. In this method, the same weight is assigned to each individual indicator subject to the constraint that the sum of all weighting factors is one. This allows all of the indicators to be considered in an even way. Furthermore, the equal weights method requires minimal knowledge about the priorities of the decision makers and is simple to apply. The equal weights method is one of the most popular methods used in sustainable energy assessments [1]. For illustrative purposes, consider an isolated microgrid project where economic, environmental, social, and technical indicators are considered to assess the sustainability of the project (one indicator for each dimension). Thus, following the equal weighting method, each indicator has a weighting factor of 0.25. As the project evolves, some indicators might become more important than others. For instance, assume that the demand rises because the economic activities of the community have increased (e.g., due to the development of new activities or the industrialization of an existing economic activity), and consequently the microgrid starts to operate at its maximum capacity. As explained later in Section 6, in this scenario, technological issues will become the largest source of loss of sustainability. Since the microgrid is operating at its maximum capacity, there will be no range to take corrective actions and any disturbance might produce a blackout of the system with its economical and social consequences. Additionally, making a reinforcement of the microgrid might increase the cost of energy supplied to the customers, and might require the use of additional land, which might have a negative impact in the environmental and social indicators. Given these conditions, the weighting factor of the technical indicator should be increased while the weighting factors of the remaining indicators should be decreased. For example, the final weighting factor of the technical indicator may reach a value of 0.7 whereas the remaining indicators have a weighting factor of 0.1. The selection of these new values allows focusing on technical aspects without neglecting the impact of technical decisions in the environmental, social, and economic aspects of the project.
In this paper, a procedure for the adaptation of the weighting factors is proposed. The objective of this process is leading the microgrid project towards the set of predefined sustainable goals. As initial condition, the methodology assumes equal weighting factors. However, as the project evolves, the weighting factors may be accordingly changed depending on the sustainability objectives.

5.6.3. Definition of Sub-Indexes for Each Dimension

In order to get information that is more manageable for policy-making purposes, the normalized indicators contained in a particular dimension are then combined to form a sub-index.
The sub-index of dimension d , namely I d , is defined based on an aggregation function according to [24]:
I d = i = 1 n d I ¯ i d × w i d
where n d is the number of indicators within dimension d and w i d is the weighting factor of the normalized indicator i from dimension d ( I ¯ i d ) . The process to obtain these sub-indexes is subject to the following constraints:
1 = i = 1 n d w i d     w i d 0  

5.6.4. Composite Sustainability Index

Once the sub-indexes for each dimension are calculated, the results are aggregated into a unique CSI to gauge the overall performance of the microgrid:
C S I = d = 1 4 I d × w d
where w d is the weighting factor of dimension d . As before, each weighting factor must be greater than zero and their sum must be equal to one. The weighting factors used in this case give an indication of the importance of each dimension within the sustainability concept.
It is important to highlight that the sustainability of a project cannot be measured with a single value like the CSI since it depends on several factors. The CSI aims only to give an overview of the sustainability situation in the microgrid. However, possible corrective measures needed to guarantee the sustainability of these projects should be determined based on the CSI and on the analysis of the sub-indexes involved on its computation.

6. Proposed Framework for Monitoring the Sustainable Development of Microgrids

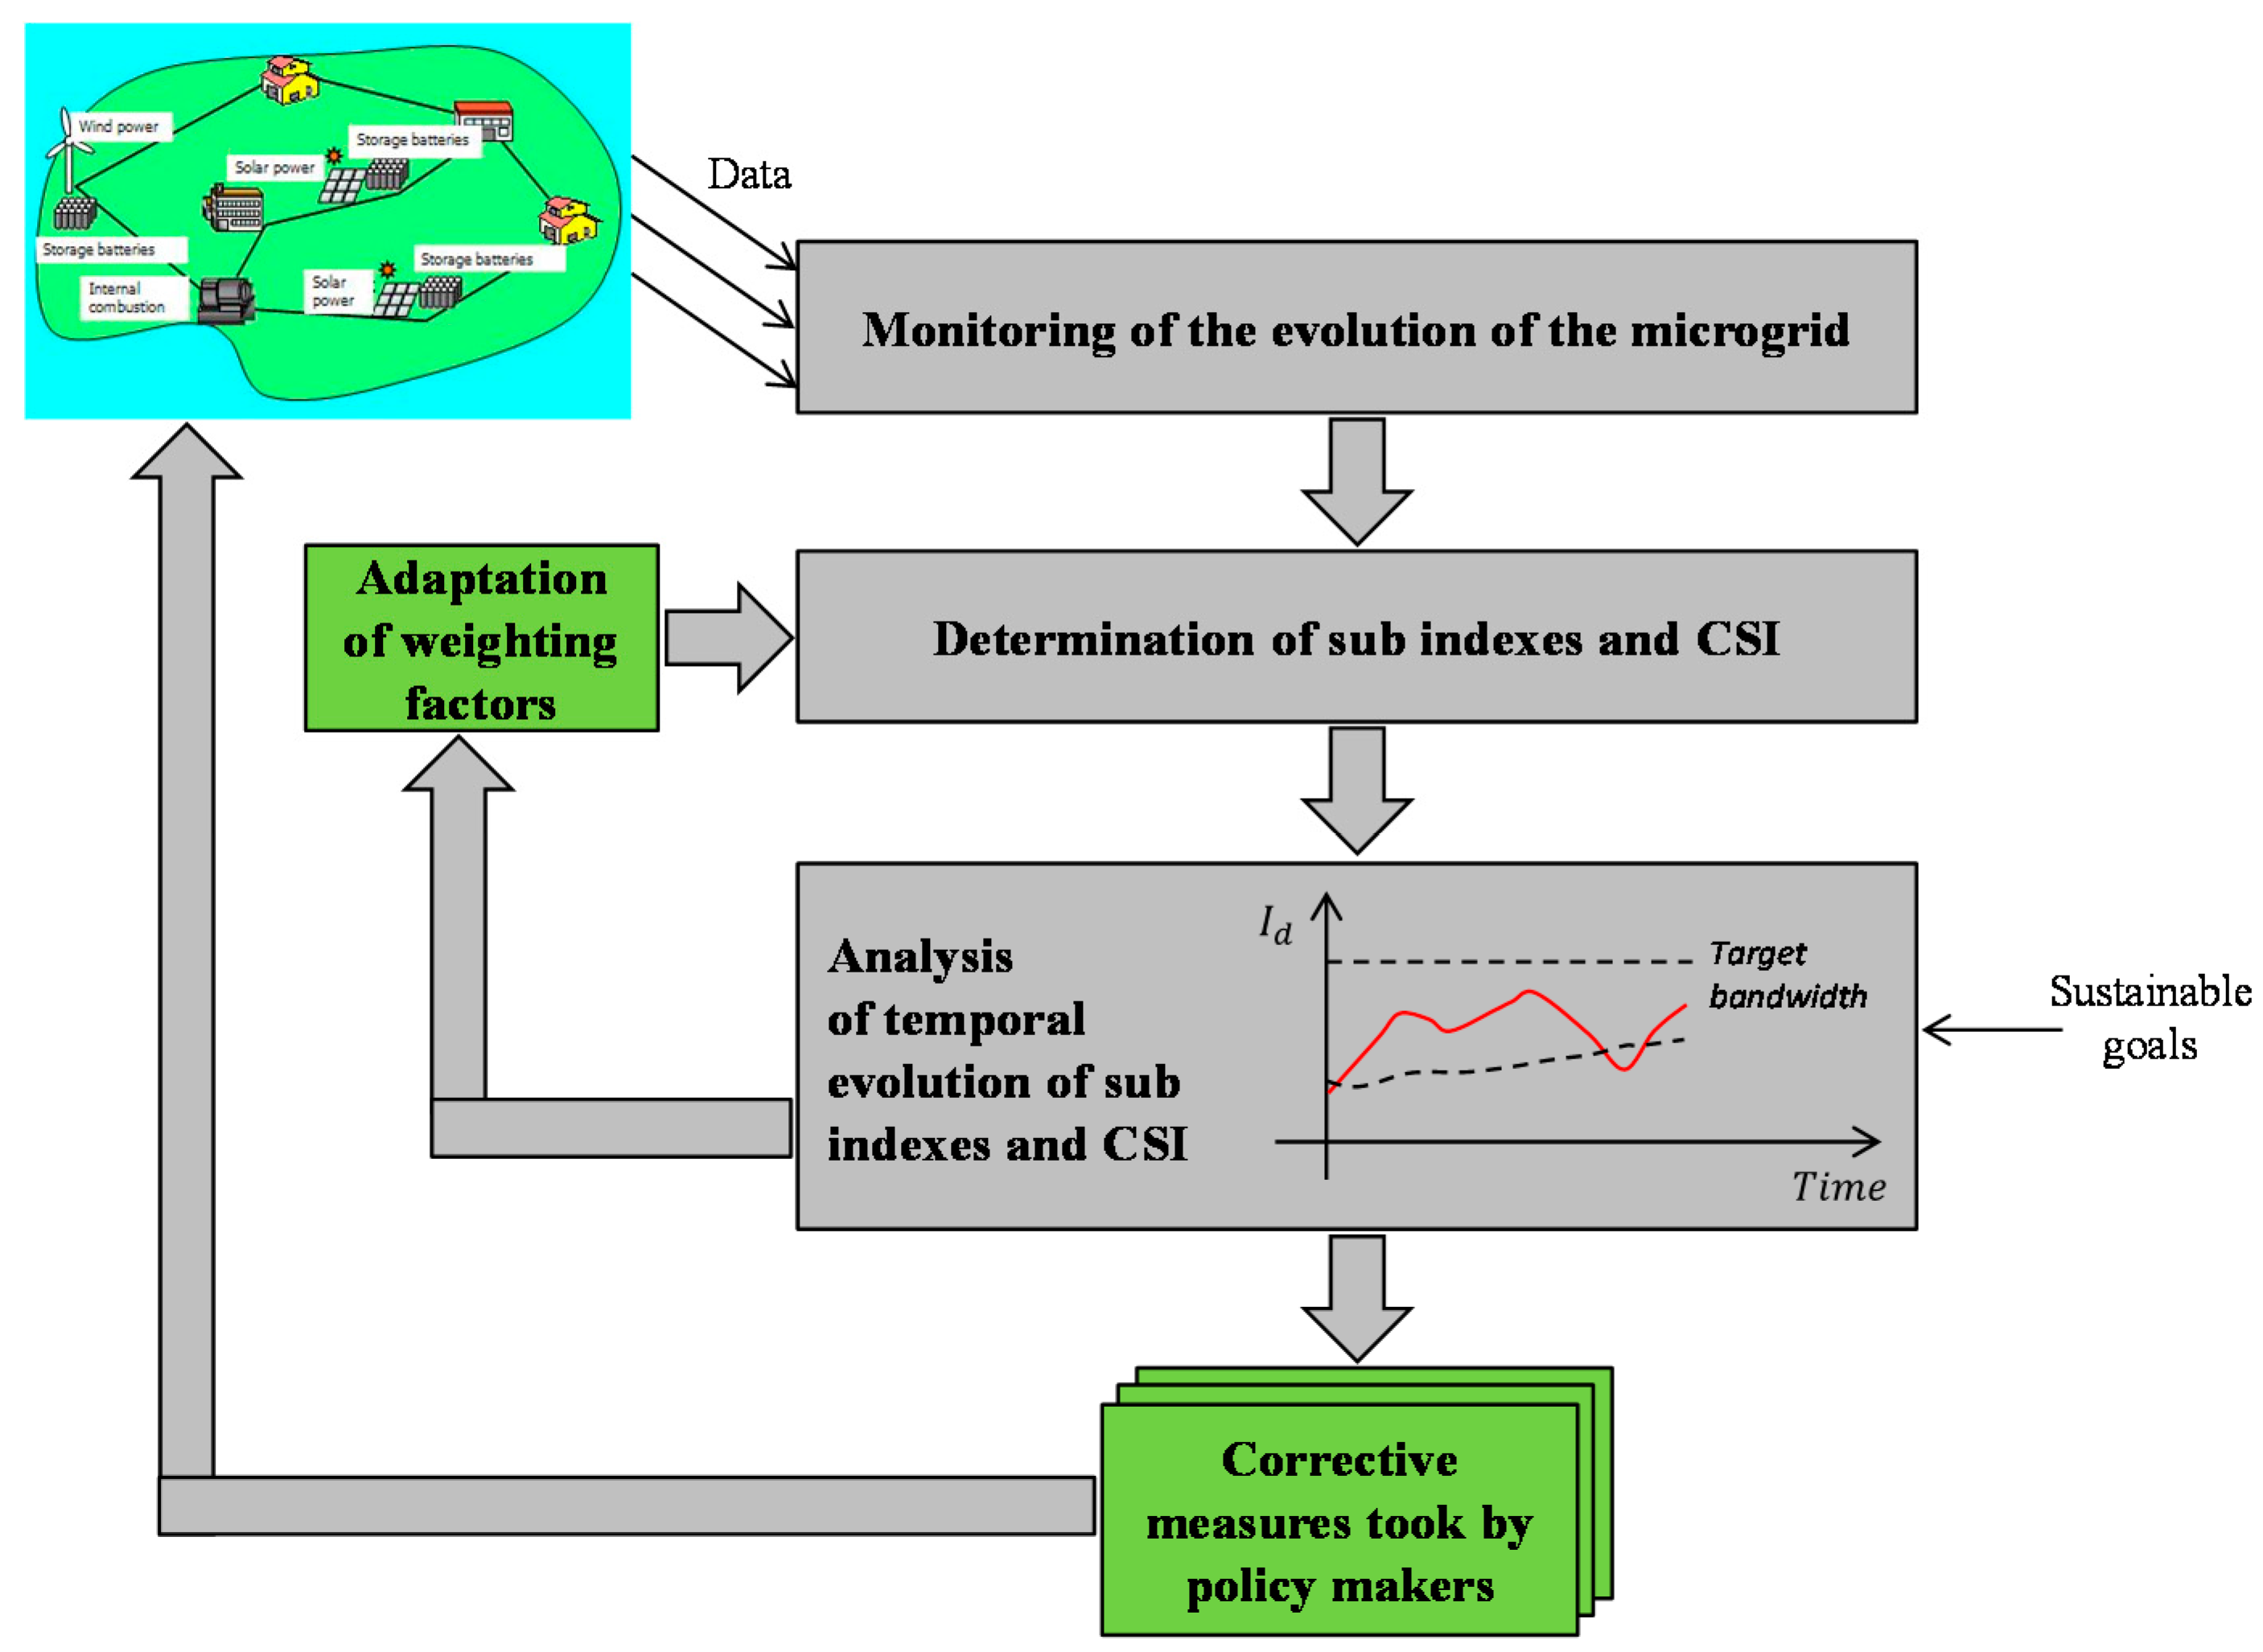
The proposed framework for monitoring the evolution of an existing microgrid from a sustainable development perspective is shown in Figure 7. In this figure, the microgrid is monitored based on available data. Such data come from periodical surveys (especially in the case of social indicators), direct measurements (e.g., voltage and frequency measures), and indirect measurements (emissions for instance). All data are concentrated and processed in a monitoring unit where, in addition to the data, key parameters of the microgrid are recorded. It is worth noting that periods for measuring social, environmental, economic, and technical indicators could differ from one to each other. Therefore, the monitoring unit must analyze the microgrid considering the previous values of those indicators with larger time frames.
The framework proposed for monitoring the evolution of a microgrid consists of four steps:
(1)
Determination of sub-indexes and CSI
(2)
Analysis of the temporal evolution of the sub-indexes and of the CSI
(3)
Adaptation of the weighting factors
(4)
Corrective measures (if needed)
In the first step, the monitoring unit uses the available information to compute all sub-indexes and the CSI by means of Equations (3) and (5). In the second step, the results obtained in the first step are used to analyze the temporal evolution of the sub-indexes and the CSI. In the third step, the results of the second step are used to determine if the weighting factors for each dimension must be changed or not. If the sub-indexes are evolving within the bandwidth defined by the sustainability goals, their values are kept constant. Otherwise, the values of the weighting factors are modified. Depending on the obtained results, a last step may be needed in which corrective actions are defined.
Note that Steps 2 and 3 require the definition of boundaries and adaptation of the weighting factors, respectively. In this work, a target bandwidth for each sub-index and the CSI (as shown illustratively in Figure 7) is considered. The lower boundary means a weak sustainability while the higher boundary represents a strong sustainability [21]. Based on the normalization process presented in Section 6, the higher boundary of the target bandwidth for each sub-index and the CSI is fixed, with a constant value of one (best case from a sustainability perspective). Thus, a microgrid is strongly sustainable when all its indicators are equal to one. On the other hand, a microgrid is weakly sustainable when all its indicators are at the minimum level that guarantees the sustainability of the project.
It is important to note that when talking about sustainable development, there is not a final fixed sustainable state [21]. This is due to the dynamic nature of our society, meaning that the new knowledge and experiences acquired by next generations will probably lead to different sustainability goals over time. By this way, sustainability goals are assumed to be dynamic, meaning that they may change depending on the evolution of the system (see Figure 7). The (initial) lower limit can be determined based on the baseline of the microgrid [14]. The time evolution of this boundary depends on the defined sustainability goals and time frames for their achievement.
The adaptation of the weighting factors is done based on a deeper analysis of the behavior of the sub-indexes and the CSI. Such analysis consists on determining the sources of loss of sustainability and then sorting them from the most to the less critical. In this paper, the distance from the current status to the maximum value of each sub-index (i.e., one) determines how critical the sub-index is. Then, the sub-index with the highest distance is the most critical, and the sub-index with the shortest distance is the less critical. Based on such classification, the weighting factors may be modified so that the most critical sub-index has the highest level of priority and the less critical sub-index has a lowest level of priority.
As previously mentioned, the methodology also considers corrective actions taken by the policy makers. The temporal evolution of the indexes allows policy makers to calculate the gap to the target at a given time and then take corrective actions directly on the microgrid to reduce this gap [22]. These actions are often related to the operation of the microgrid and could affect either the demand or the sources. However, these actions must be carefully implemented, since environmental, economic, social, and technical dimensions are interrelated (see Figure 1). Therefore, any action taken to enhance one dimension could have negative impacts in the remaining dimensions or in the CSI as a whole. The most critical dimension must be enhanced through corrective actions focused on its worst indicators. The corrective actions should be designed to sustain a sound balance among the four dimensions and considering past experiences as well as expert knowledge.
For illustrative purposes, consider again the case in which the demand of the microgrid rises until its maximum capacity is reached. In this situation, the CSI will indicate that the sustainability of the project is threatened due to technical issues. Accordingly, some corrective actions in the system are required. Such actions may imply increasing the capacity of the energy sources, implementing additional demand response actions, and/or implementing educational programs focused on a rational use of energy. Nevertheless, since technical aspects are critical for the sustainability of the microgrid, the first action to be taken is the enlargement of the generation capacity of the sources. Specifically, the capacity of the renewable resources considered in the project should be increased. In this way, a larger demand could be supplied while the environmental effects of an increasing demand are reduced.
Moreover, consider a situation, in which a stakeholder of the project decides to give up the project, i.e., it decides to not contribute in the future development of the microgrid. This is a large social disturbance that can cause social divisions in the community. This situation should be captured by the CSI that will indicate that the sustainability of the project is threatened. Particularly, some social indicators and the pertinent sub-index will exhibit a decreasing trend as the situation evolves. In accordance with the adaptation methodology, the weighting factor of both the social indicators and sub-indexes measuring the social cohesion should be increased thus indicating that social actions have to be taken in order to guarantee the sustainability of the project. Among the actions that may be undertaken are the development of community workshops focused on harmonizing the position of each member of the community, the implementation of economic policies to have additional incomes, and the implementation of promotional plans to get additional stakeholders. Note that introducing new economic policies and implementing promotional plans requires a unified position of the members of the community. Therefore, community workshops should be firstly implemented to overcome the issues arising from the resignation of the stakeholder.

7. Obtained Results

7.1. Case Study Huatacondo

The rural electrification system ESUSCON (acronym in Spanish of “Sustainable Electricity Condor”) is a microgrid located in Huatacondo, in the northern part of Chile, within the Atacama Desert. The microgrid was an initiative of the Energy Center of the Electrical Engineering Department of the University of Chile and supported by a mining company of the zone. The objective of ESUSCON was to develop an isolated microgrid to provide the community with continuous electricity and adequate levels of quality of service [6].
The population of Huatacondo is 75 people [6]. The main economic activities of the community are mining and agriculture. During the year, the community celebrates a series of religious festivals that attract an important amount of seasonal visitors. The maximum seasonal population is between 200 and 400 people (maximum for a week). During the festivities, the electricity consumption increases between 2 and 4 times, depending on the celebration [6].
Before the construction of ESUSCON, the power generation in Huatacondo was based on a diesel generator, with an average peak demand of 30 kW [30]. The load was characterized by residential consumption. At that time, the energy access was not continuous, instead it was provided only at some hours during the day [6].
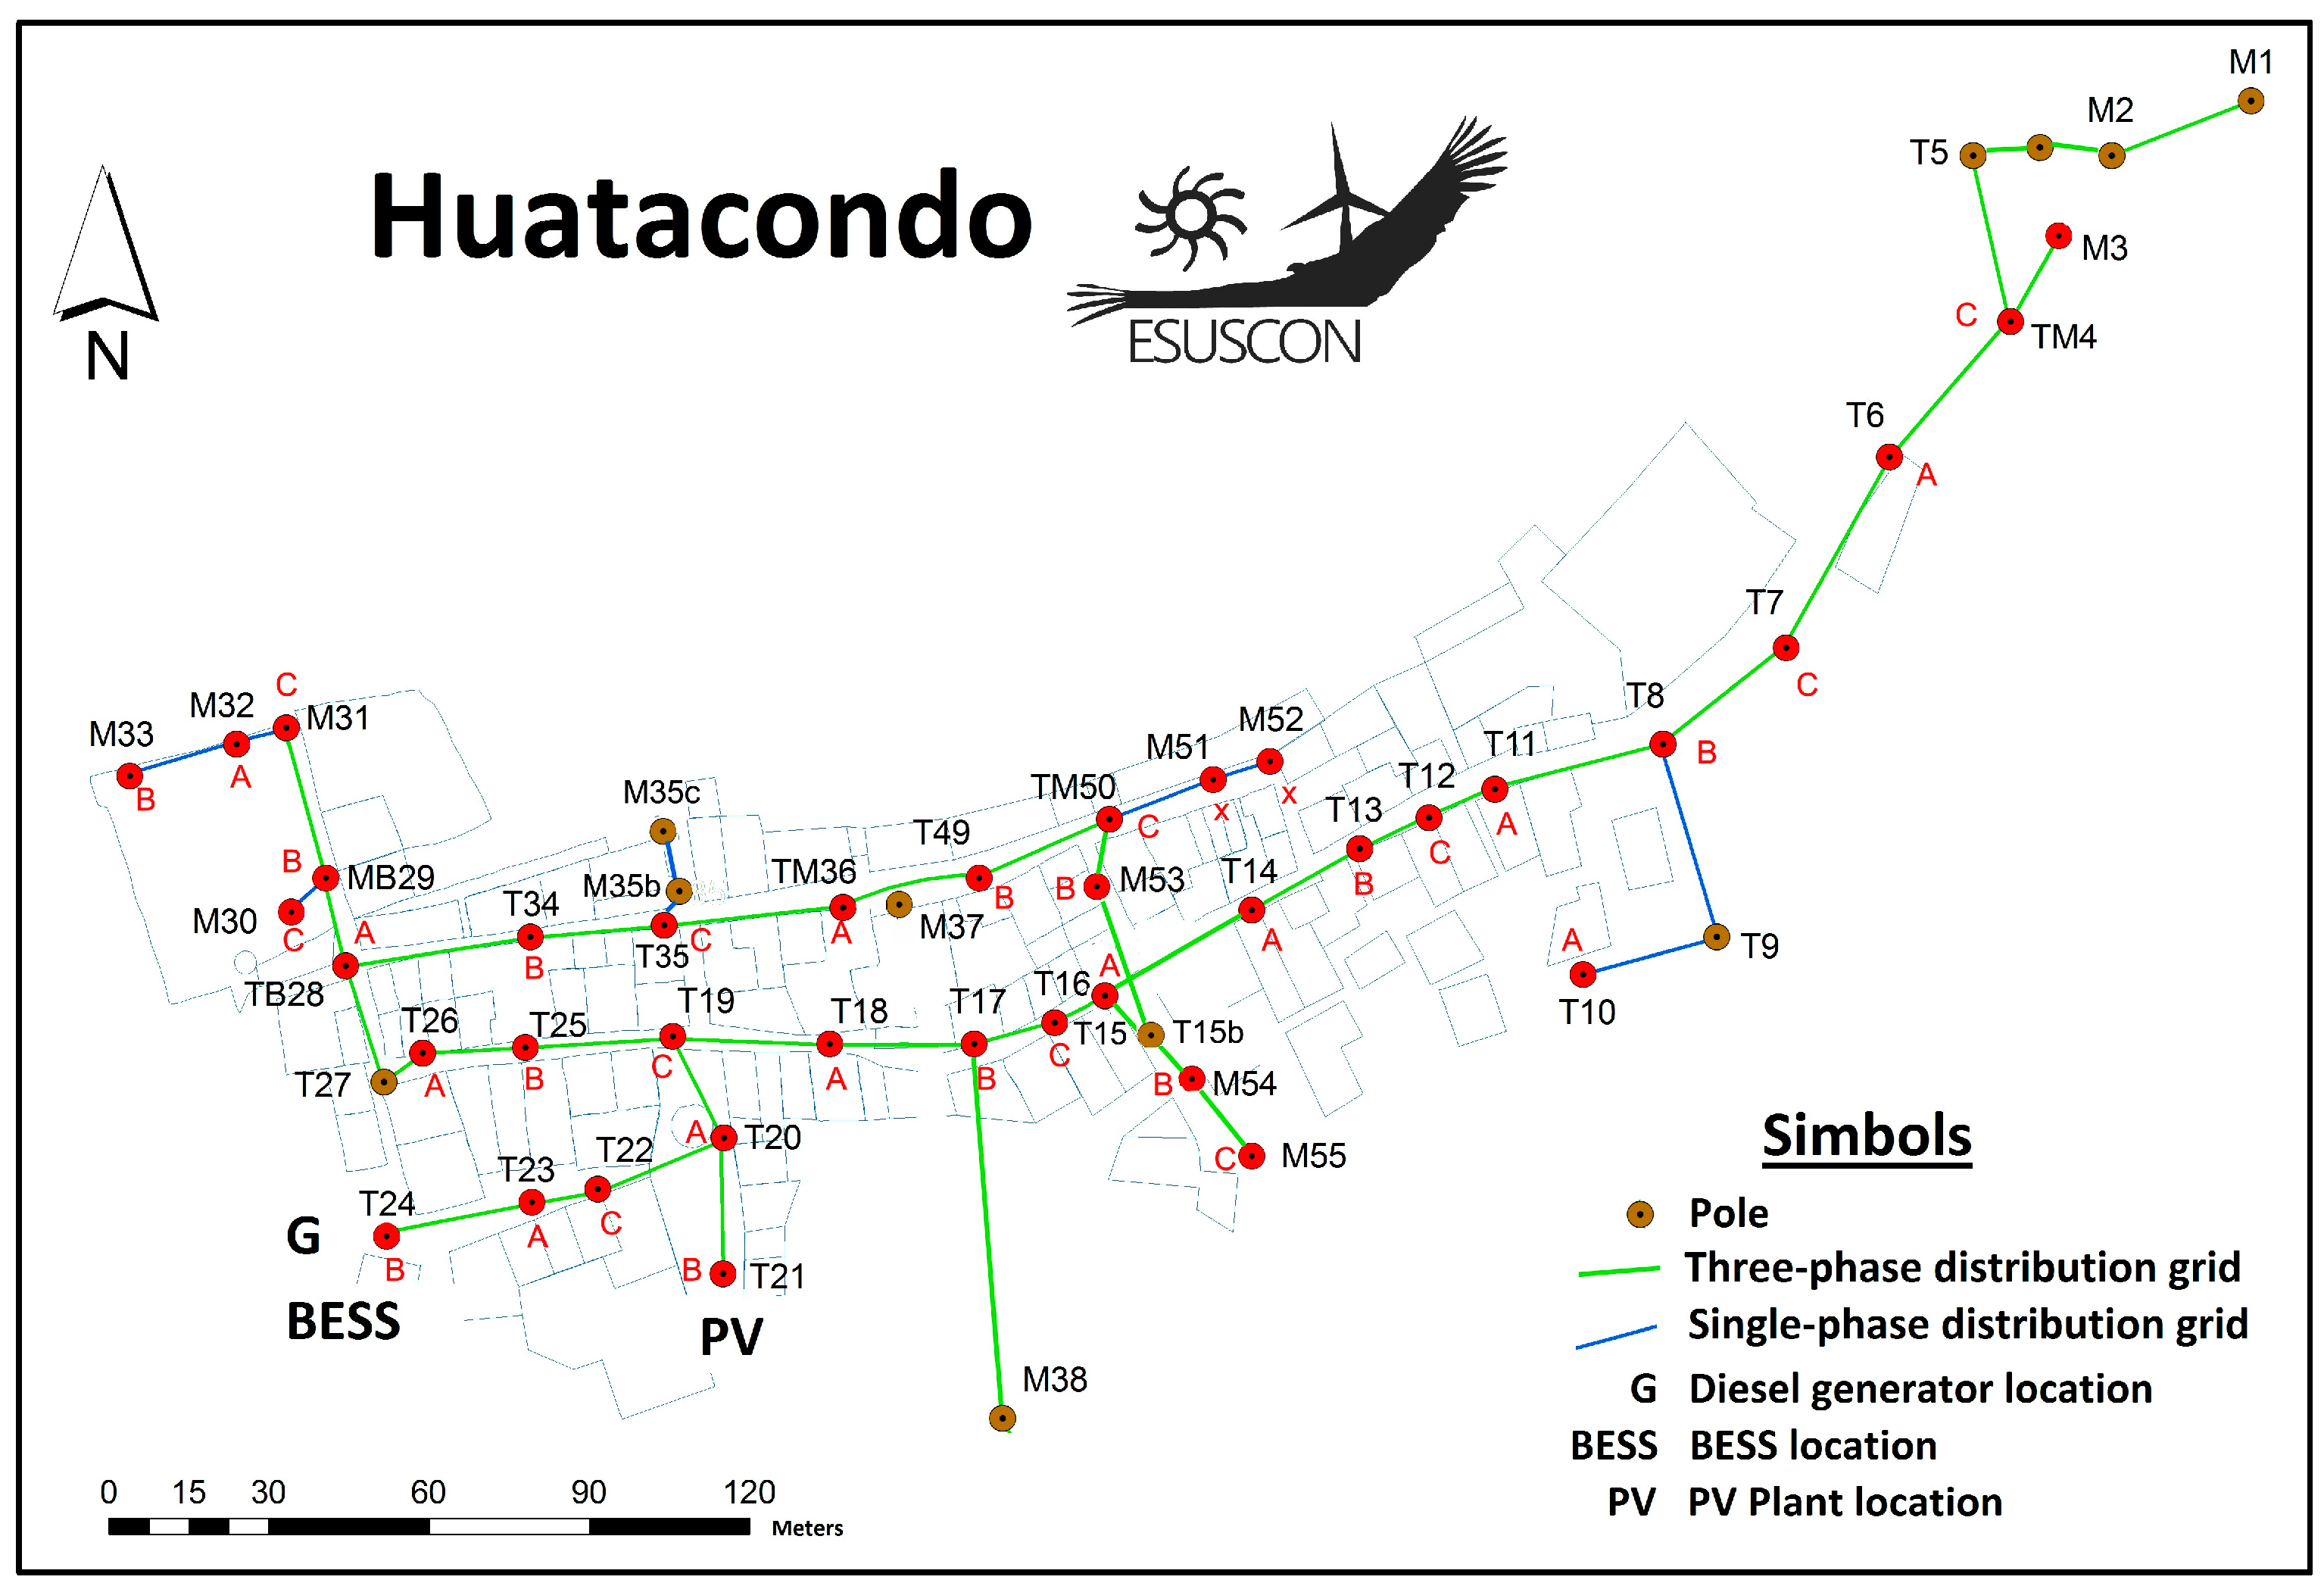
The microgrid ESUSCON has a voltage level of 380/220 V at 50 Hz. Figure 8 shows a distribution chart of the microgrid [6]. Its main technical characteristics are [30]:
(1)
Photovoltaic (PV) plant of 23 kW with inverters.
(2)
Diesel generator of 108 kW.
(3)
Lead-acid battery for energy storage of 27 kW/127 kWh, BESS (acronym of battery energy storage system).
(4)
SCADA (acronym of supervisory control and data acquisition) system for control and monitoring.
(5)
Energy management system for optimal operation.
(6)
Social SCADA. Computational tool located at the head office of the neighborhood council, developed to provide information in real-time to the community and stakeholders. Historical operation data of the microgrid are also available. The tool also incorporates key performance indicators to support the decision-making and management support maintenance [30].
The proposed methodology is applied using a database containing the operation of ESUSCON between the years 2011 and 2013. Based on this database, the indicators presented in Table 1 were obtained for each month of the study period.

7.2. Example of Application of the Methodology

In this section we present an example to illustrate—step by step—how to apply the methodology considering the indicators shown in Table 1. The example includes the computation of the sub-indexes and the CSI for January of 2011 as well as details of the normalization process.
Table 2 contains the values of the technical indicators in January of 2011 (without normalization) as well as their lower and upper limits to perform the normalization process. The references for the lower and upper limits shown in the table are presented in Appendix D. The normalized value of the indicators (shown in the last column of Table 3) is obtained using Equations (1) or (2) depending on the kind of indicator (“bigger value is better” or “smaller value is better”). For instance, the indicator “CO2 emissions” is categorized within the group “smaller value is better”, since a smaller value denotes a better situation from a sustainability perspective. In this case, the normalization is done based on Equation (2).
As indicated in Section 5.6, to calculate the sub-indexes for each category, the relative importance of each indicator within its dimension has to be specified. In this context, Table 3 shows the weighting factors of each indicator i within a dimension d ( w i d of Equation (3)) for January of 2011. The values assume equal weighting factors for each indicator. As a consequence, if only one indicator is considered in a particular dimension, its weighting factor is 1. Otherwise, the sum of the weighting factors of all indicators within a dimension is 1.
Considering the normalized value of the technical indicators (last column of Table 2) and the weighting factors presented in Table 3, the technical sub-index in January of 2011 can be calculated using Equation (3):
I t e c h n i c a l = i = 1 n d I ¯ i d × w i d = 1 6 × 0 + 1 6 × 0 + 1 6 × 0.25 + 1 6 × 0 + 1 6 × 0.0134 + 1 6 × 0.0135 = 0.04615
The other sub-indexes for January of 2011 are obtained using the same equations. The obtained results are:
I s o c i a l = 1.0
I e n v i r o m e n t a l = 0
I e c o n o m i c = 0.07
Considering the value each sub-index, the value of the CSI in January 2011 is obtained using Equation (5):
C S I J a n 11 = d = 1 4 I d × w d = 0.04515 × 0.25 + 1.0 × 0.25 + 0 × 0.25 + 0.07 × 0.25 = 0.279
The result above for the CSI is obtained assuming equal weighting factors for each sub-index.

7.3. Obtained Results Considering Real Data

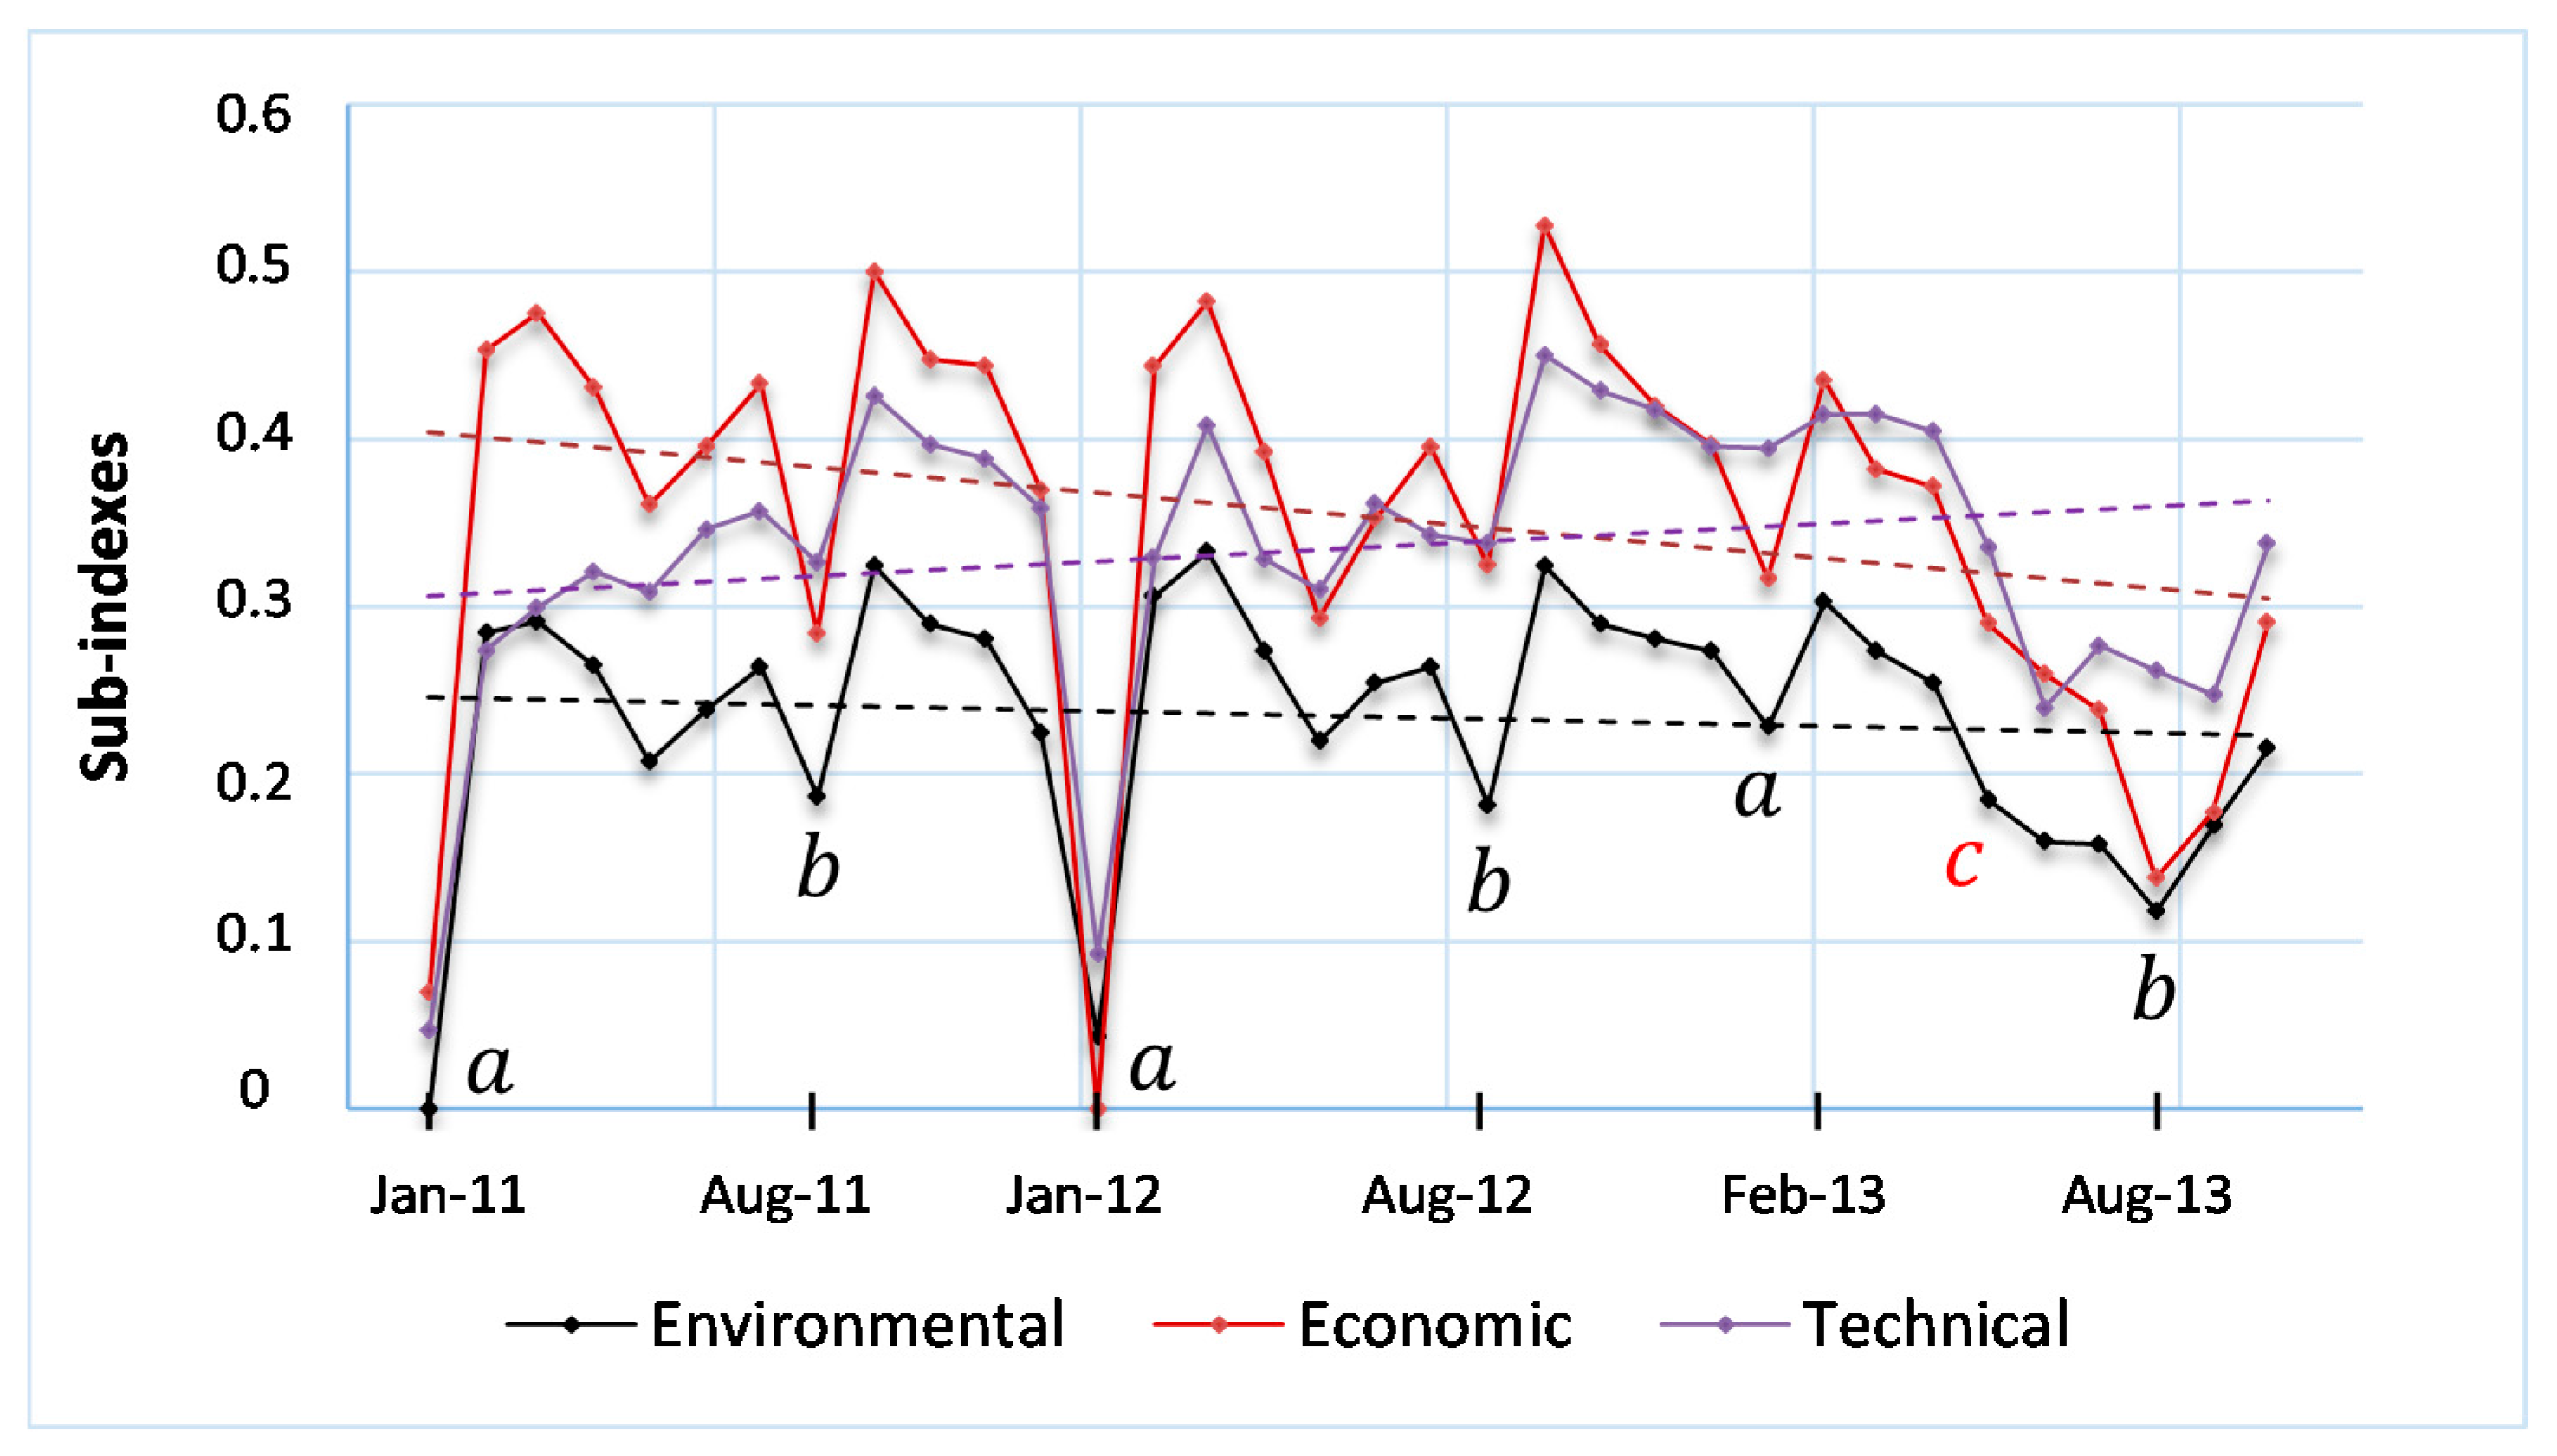
Figure 9 shows the sub-indexes obtained after applying the methodology presented in Section 6. The social sub-index is not shown since the electrification of Huatacondo is always higher than the lower limit (70%, see Appendix C). Thus its inclusion in the figure does not add additional information for the analysis of the temporal trend.
Figure 9 shows a decreasing trend of the economic and environmental sub-indexes. On the other hand, the technical sub-index has a slight upward trend.
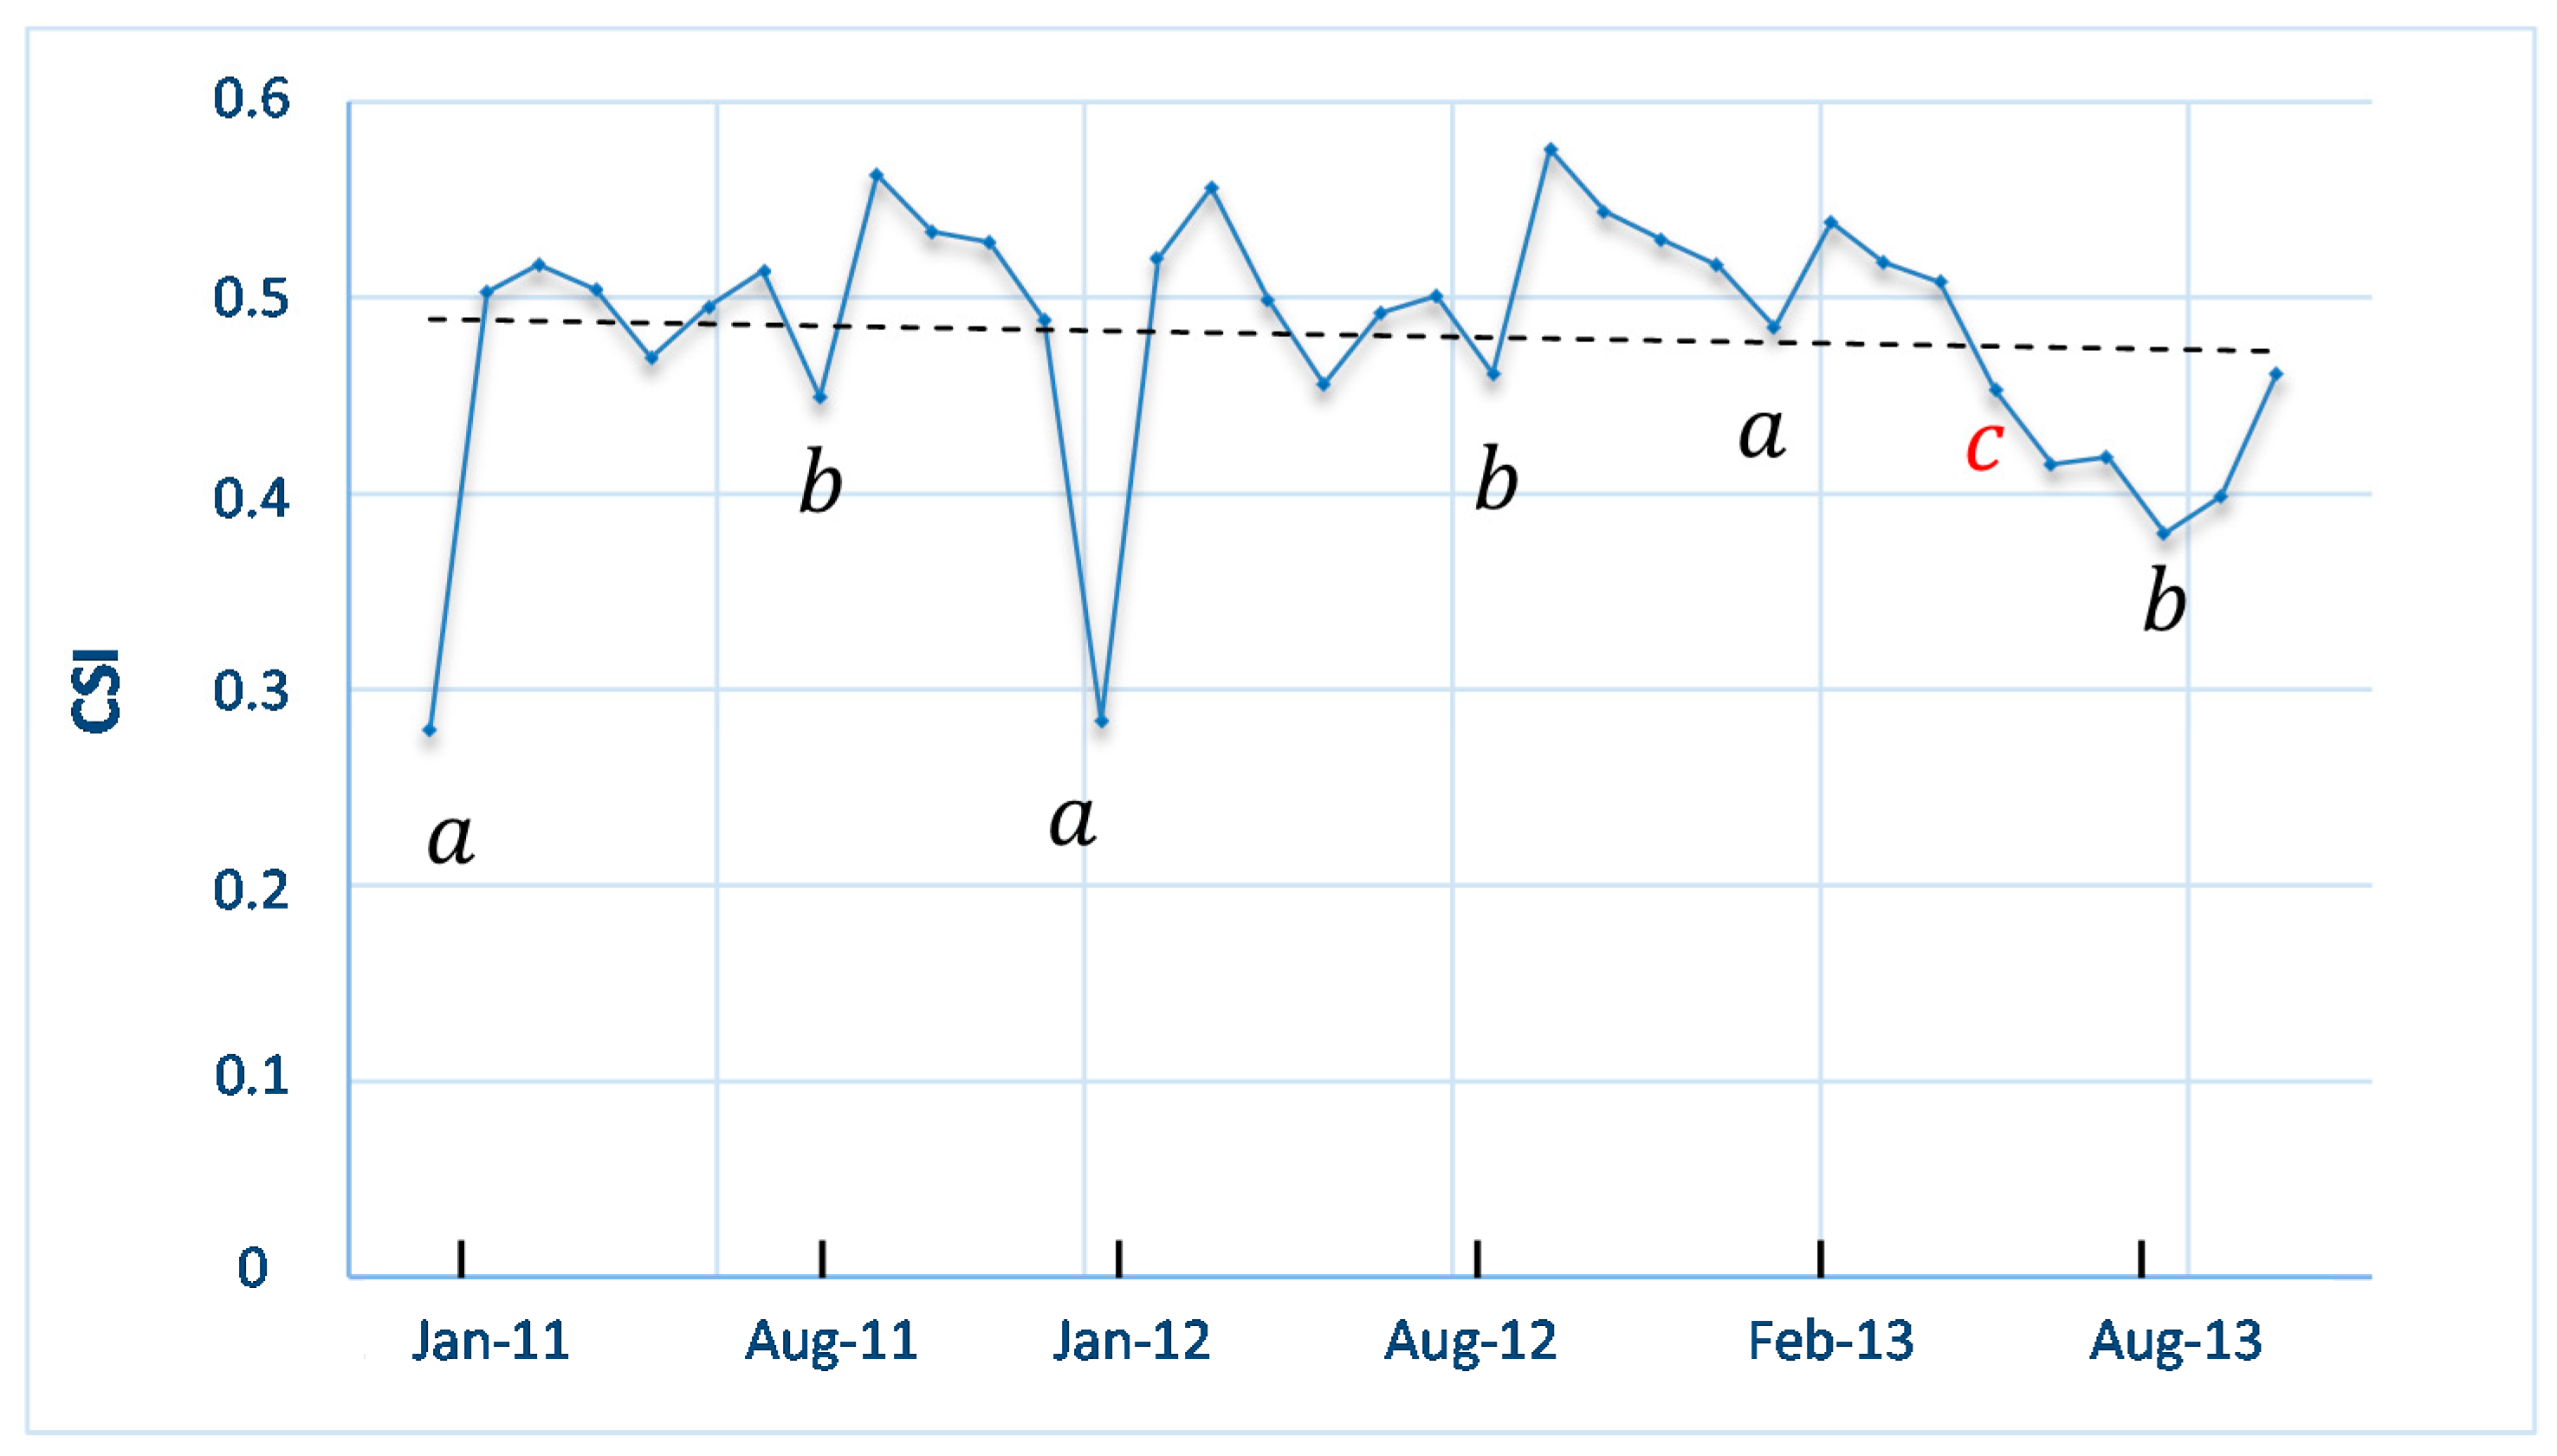
The sub-indexes are aggregated into CSI to gauge the overall performance of the microgrid. The evolution of the CSI considering constant weighting factors is shown in Figure 10. From the figure it can be seen that the CSI has shown a slight decreasing trend during the last years.
The characters a ,   b ,   c in the figure highlight key events that occurred during the control period:
(1)
The events indicated as “a” are known as the Bolivian winter. This natural phenomenon occurs each year in January, which is the month of the year with increased rainfall in the region.
(2)
The event “b” occurs every year in August. It corresponds to a Catholic Feast for the Virgin, which gathers about 400 people coming to Huatacondo during one week.
(3)
The event “c” corresponds to an atypical situation that occurred in May 2013. It was a fault in the tracking system in one of the six sections of the PV plant, thus decreasing the PV capacity to 83% of its nominal capacity during two months.
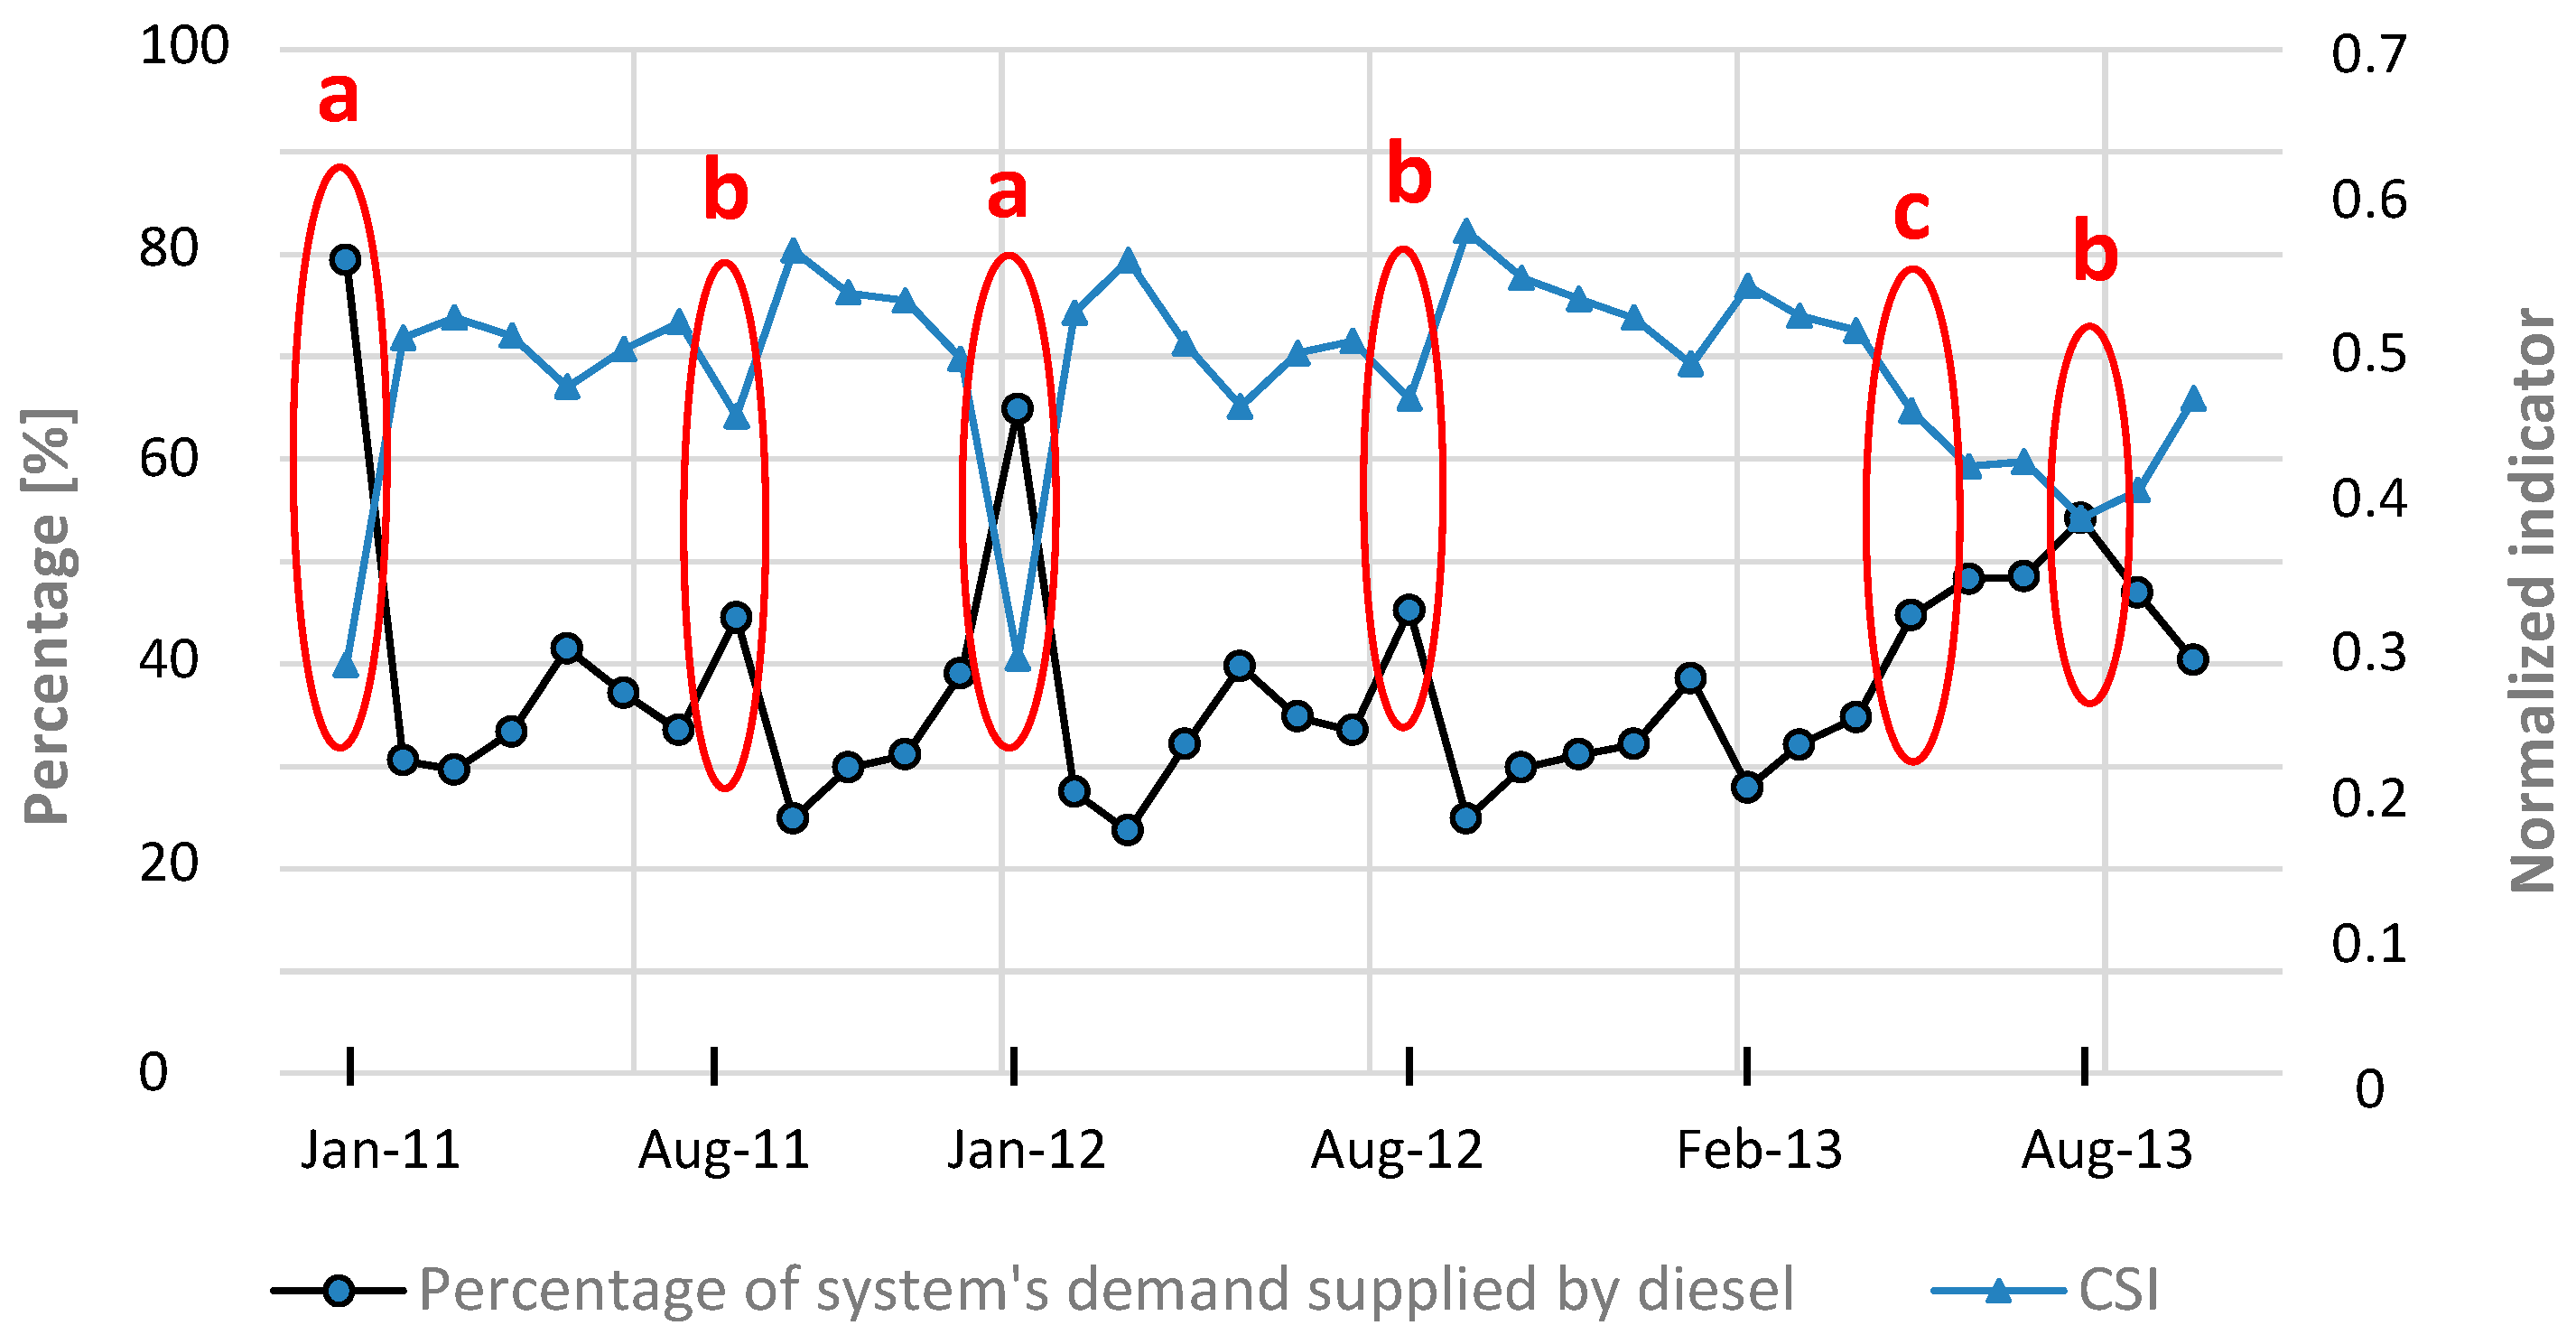
From Figure 10 it can be seen that the Bolivian winter leads to a reduction of the solar energy production, which implies a rise in the diesel generation. Thus, the CSI drops each January due to this phenomenon. A similar drop is observed during the Catholic Feast for the Virgin, and when the failure in the tracking system in the PV panels occurred. In both events, an increase in the diesel consumption was the final result with the expected decrease in environmental and economic sub-indexes. The aforementioned conclusions are illustrated in Figure 11.

7.4. Obtained Results Considering Corrective Measures

As stated in Section 6, the relative importance of each indicator as well as the weighting factors of each sub-index has to be identified. However, this is not an easy task since different experts could assign different relative importance to each indicator and sub-index. The proposed methodology assumes as initial condition the same weights for each indicator within a dimension, and also the same weight for each sub-index. As some of them become critical, the indicators are organized in decreasing level of criticality and the weights are adjusted accordingly.
From the results presented in Figure 9, Figure 10 and Figure 11 it can be concluded that the generation of the PV plant is critical for the sustainability of the Huatacondo microgrid. The variations of this indicator affect several technical, environmental, and economic indicators since more diesel generation is required to supply the demand. However, the system is also affected by technical, environmental, and social influences. For instance, the Bolivian winter and the religious festivities reduce the percentage of the total demand supplied by the PV plant. However, these events are uncontrollable. The analysis presented in this section also focused on the failure of the tracking system of the PV plant (see point c) in Figure 10.
As shown in Figure 9 and Figure 10, the long time it took to repair the tracking system (two months), significantly affected the CSI of the microgrid. Indeed, apart from the initial value and the Bolivian winter of 2011, this event produced the lowest value of the CSI for the microgrid during the control period. As mitigation action, a situation in which the replacement equipment is available in Huatacondo is considered for comparison purposes. Once the failure of the tracking system occurred, the production of the PV plant was reduced. Consequently, the indicators cost of energy produced, capacity factor of the PV plant, fuel consumed per kWh produced, and ratio between renewable generation and fossil fuel, became critical for the sustainability of the microgrid. Thus, in conjunction with the availability of the replacement for the tracking system, the weights of these indicators were modified, the capacity factor of the PV plant and the ratio between renewable and fossil fuel generation being the most critical indicators. The obtained results considering the adaptation of the weighting factors and the corrective measure “availability of replacement equipment in situ” are shown in Figure 12 and Figure 13.
In Figure 12, a comparison between the evolution of the sub-indexes with and without the corrective actions is presented. As it can be seen, if the corrective actions are not taken (Figure 12b), the failure of the tracking system produces a decreasing trend in all sub-indexes until the replacement process is completed (two months after the event). By contrast, if the proposed methodology is applied considering the corrective measures plus the adaptation of the weighting factors, the sub-indexes exhibit an increasing trend. As a consequence, the minimum value achieved by each sub-index is also reduced, which implies an enhancement of the sustainability of the microgrid.
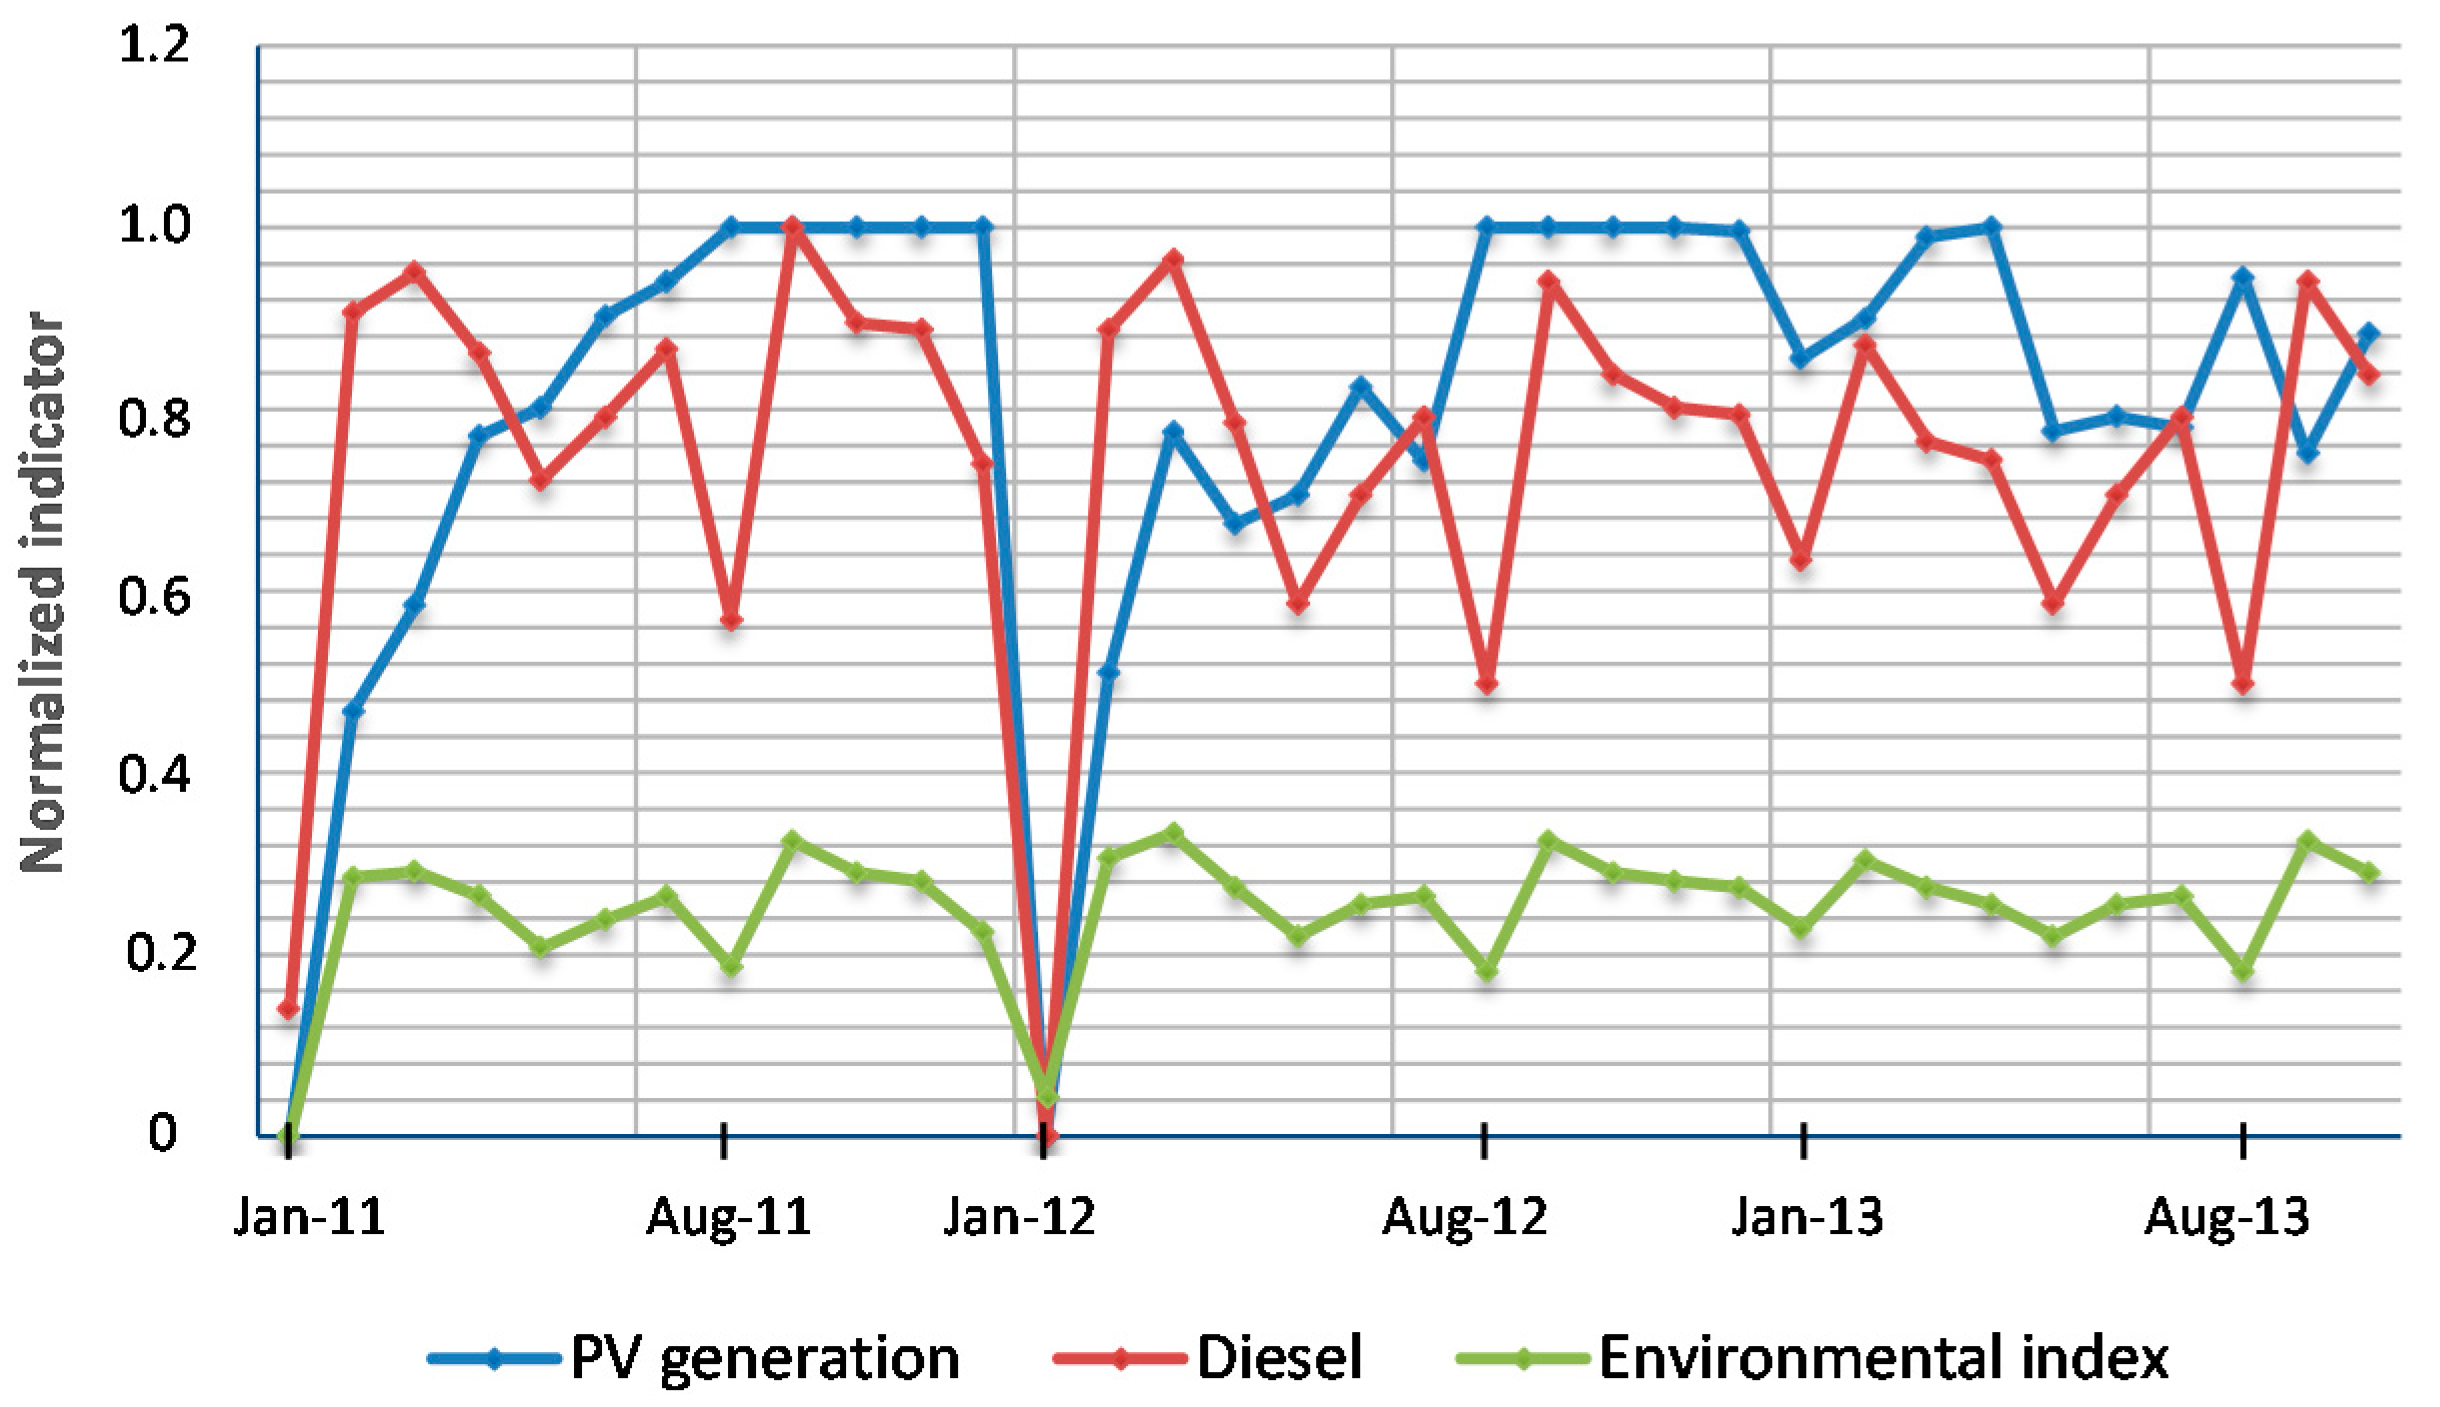
Figure 13 presents how corrective actions are taken in order to obtain the results presented in Figure 12. For illustrative purposes only two (normalized) indicators have been considered in the analysis, namely, PV production and diesel consumption. Furthermore, only the environmental sub-index was included. For comparison purposes, the conditions at the beginning of the project have been considered as baseline, that is, the values of both indicators and the sub-index shown in Figure 13. The selection of the initial condition as baseline was motivated by the fact that those values reflect the conditions of the community without the implementation of the project.
From Figure 13 it is possible to see that the implementation of the microgrid project involved diesel as well as other energy sources. Both the diesel and solar PV production indicator move together, with the former more closely correlated with the environmental sub-index. These perhaps counter-intuitive variations are explained by the change in the demand pattern in Huatacondo: once the microgrid project was implemented, demand started to rise (as expected).
Notwithstanding the improvement on the indicators and the sub-index, in January 2012, there was a major disturbance: the Bolivian winter. At this month, the PV production dramatically decreased enforcing an extensive use of diesel to supply the electric demand of Huatacondo. Accordingly, both indicators PV plant production and diesel consumption decreased towards zero, producing a similar trend in the environmental sub-index (see Figure 13). To overcome such situation, corrective measures were implemented to mitigate the negative effects of the Bolivian winter in the sustainability of the microgrid. These measures were focused on the environmental indicators, specifically in how to prevent their rapid decreasing towards zero during the Bolivian winter. As a result of the implementation of these corrective measures, during January 2013, the PV production did not decrease as much as in January 2012, and, therefore, the diesel consumption remained within acceptable levels. The enhancement in the operation of the microgrid reflects how the proposed methodology can be used to reduce the negative effects of external disturbances in microgrid projects, and therefore to improve its sustainability.
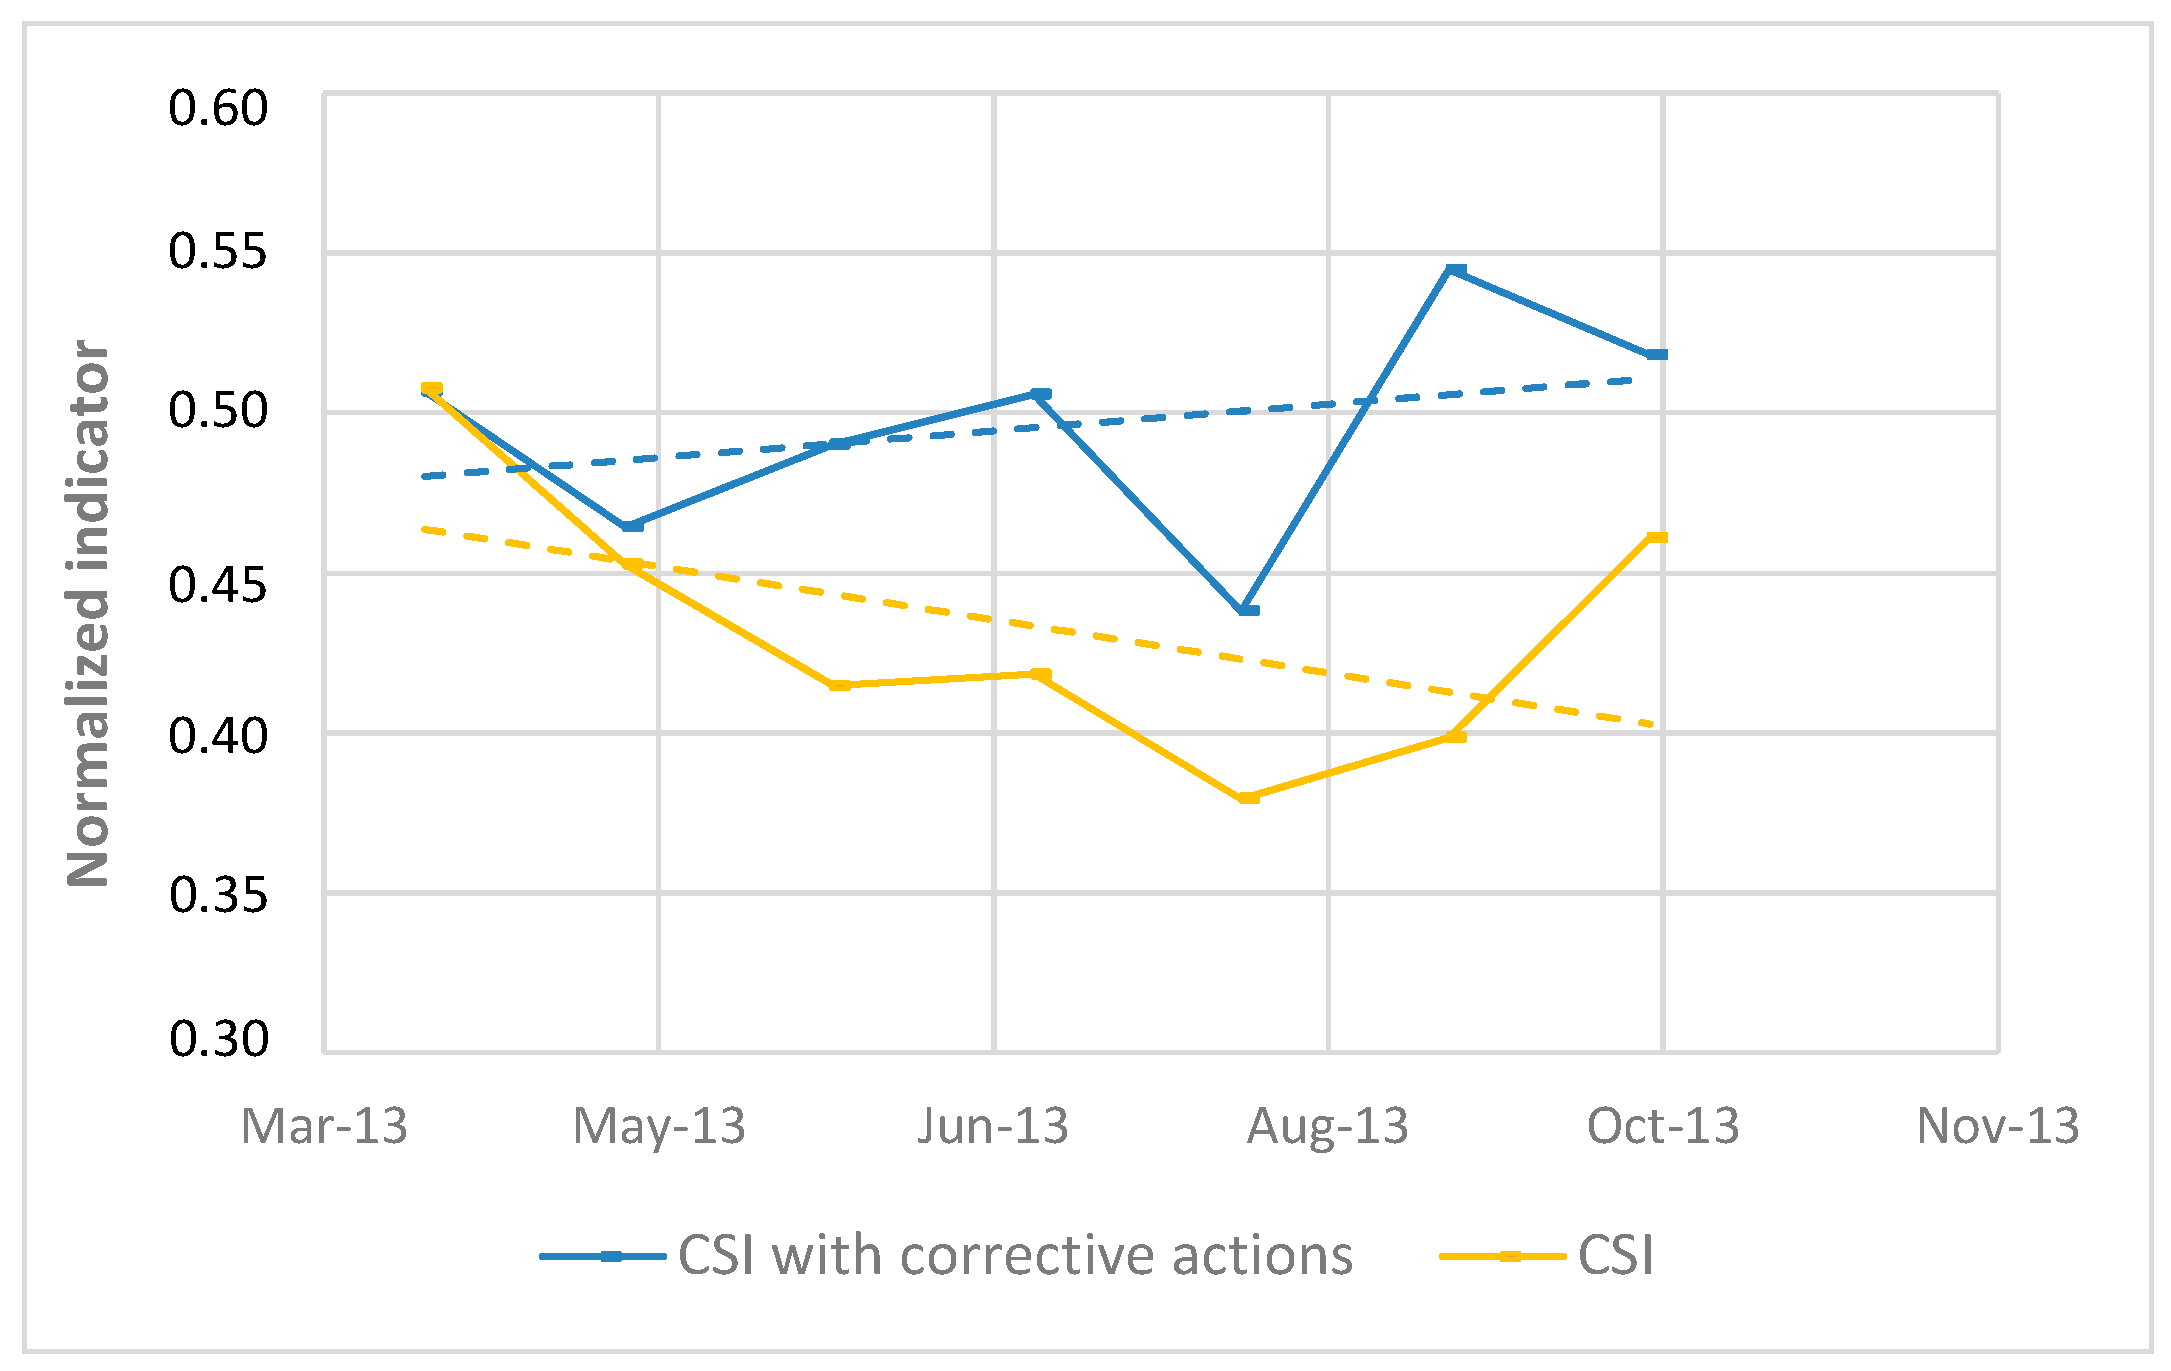
Figure 14 presents a comparison between the evolution of the CSI when the proposed methodology is applied with and without corrective measures. As expected, the failure in the tracking system of the PV plant produced a decreasing trend in the CSI when the corrective actions are not considered. Furthermore, such trend is sustained until the repair process is finished two months after the failure. Then, the CSI begins to rise again. By contrast, when corrective actions are taken into account, the trend of the CSI changes and continues rising despite the failure. These results verify the key role that the proposed methodology may play in guaranteeing the evolution of isolated microgrids towards sustainability goals.

8. Conclusions

In this work, a methodology to evaluate the evolution of the sustainability of an existing isolated microgrid was presented. The methodology considers a composite sustainability index (CSI) that was constructed along the environmental, social, economic and technical dimensions of the sustainability.
To validate the performance of the proposed methodology, a microgrid installed in the northern part of Chile (Huatacondo) was used as a test case. The obtained results have shown that the proposed methodology might play a key role in the assessment of the sustainability of isolated microgrid projects and in the definition of policies focused on moving the evolution of these projects towards sustainability objectives. The proposal has shown to be a workable support instrument for policy makers, especially when defining sound corrective measures to guarantee the sustainability of small isolated microgrid projects.
As a future work, the use of historical data to predict the expected behavior of the CSI in order to anticipate future contingencies and to formulate an adequate policy of microgrids planning is proposed. Furthermore, including comparisons with similar microgrid projects and data from other studies is also proposed for a future version of the proposed methodology.

Acknowledgments

The authors acknowledge the support of the Fulbright NEXUS Regional Scholar Program, the Chilean Council of Scientific and Technological Research, CONICYT/Fondap/15110019, and the Complex Engineering Systems Institute (ICM: P-05-004-F, CONICYT: FB0816), in the realization of this work.

Author Contributions

Claudia Rahmann and Felipe Valencia wrote the paper and conceived the proposed methodology for monitoring the evolution of sustainability in isolated microgrids. Oscar Núñez collected the data of the microgrid and performed the calculations to determine the indicators and the CSI. Susana Arrechea worked on the social, environmental, and economic indicators, and helped frame the project. Jalel Sager helped with the English grammar of the manuscript and with the economic indicators. Daniel Kammen advised and helped frame the project and revised the manuscript.

Conflicts of Interest

The authors declare no conflict of interest.

Appendix A. Environmental Indicators

Table A1. Environmental indicators.
AreaIndicatorDefinitionType 1Boundaries
Gas EmissionCO2 emissionCO2 emissionsOI(0–0.5) kg-CO2/kWh, data for Latin America [31]
Perception about emissionsCommunity perception about emissionsPI0%–100%
Noise and ContaminationNoise measurementNoise level measurementOI(0–70) dB [32]
Waste producedWaste generated due to electricity generation compared with previous systemII ( 0 ,   B m a x ) kg/kWh. Where B m a x is the existing level in the community before the microgrid.
Perception noise and contaminationCommunity perception about noise and contaminationPI0%–100%
Note: 1 impact indicator (II), outcome indicator (OI), and process indicator (PI).

Appendix B. Economic Indicators

Table B1. Economic indicators.
AreaIndicatorDefinitionTypeBoundaries
InvestmentInvestment Investment per generation technologyOI(500–6500) $/kW Biomass
(1.175–6.000) $/kW Hydropower
(2.150–7.000) $/kW Solar PV
(1.900–6.040) $/kW Wind [33]
Stakeholders perception about the “profits” gained through the microgrid Profits in rural microgrids projects may not necessary be monetary. An example of other kind of “profits” is the image improvement in case of mining projects affecting a rural communityII0%–100%
O & M CostO & M global costO & M global cost per kWh produced (all technologies) IIAccording to the O & M cost per technology and specific technologies using by the microgrid:
(106–112) $/kW Biomass
(21–22) $/kW Biomass cofiring
(136–144) $/kW Biomass combined heat and power (CHP) medium
(186–197) $/kW Biomass CHP small
(292–310) $/kW Biomass-waste incineration CHP
(64–68) $/kW Hydropower small scale
(34–36) $/kW Solar PV
(40–43) $/kW Wind [34]
(0.7) $/h Diesel, cost per hour of operation [35]
Fuel CostFuel cost Fuel cost per kWh producedOI(0.00–0.27) $/kWh [36]
Electricity CostElectricity cost comparison with the regionMicrogrid electricity cost compared with the costs of the regionOI(0.06–0.45) $/kWh [33]
Electricity cost comparison previous system (if apply)Comparison of microgrid electricity cost with the previous systemII ( 0 ,   B m a x ) $/kWh. Where B m a x is the existing electricity cost in the community before the microgrid

Appendix C. Social Indicators

Table C1. Social indicators.
AreaIndicatorDefinitionTypeBoundaries
Equity & AffordabilityElectricity expensesHousehold electricity expensesOI(0.07–0.49) $/kWh [37]
Electrification levelHousehold with electricity serviceII(70–90)% [37]
Perceived affordabilityPerceived affordability of electric servicePI0%–100%
Community DevelopmentNew jobsNew direct jobs due to the microgridII(0.25–6.21) jobs/MW; New jobs due to construction, manufacturing, and installation of the microgrid
(0.27–4.80) jobs/MW O & M and fuel management [38]
Development achieved perceptionCommunity perception about development achieved due to the microgridPI0%–100%
Health and RiskTraining in health risk Training sessions in health risk related to the electricityOI(0–30) h/year [39]
Improvements health perceptionPerception of improvements in health due to the microgridPI0%–100%
Community EngagementAttendance at meetingsAttendance at meetings for community training and engagement OI0%–100%
Community O & M tasksCommunity engagement in O & M tasksII0%–100%
Community perceptionCommunity satisfaction level about the microgrid operationPI0%–100%

Appendix D. Technical Indicators

Table D1. Technical indicators.
AreaIndicatorDefinitionTypeBoundaries
EfficiencyDistribution lossesDistribution network lossesOI5%–15% [33]
Consumption comparison Comparison between the household average consumption with the region averageII0%–100%
Capacity factorCapacity factor per technologyPI50%–90% Biomass
30%–60% Hydropower
10%–25% Solar PV
25%–40% Wind [33]
Primary Energy RatioRatio of generationRatio between renewable generation and fossil fuel PI(70–100)% [33]
Reliability and Power QualityVoltage deviationAverage deviation of the voltage from its nominal value during a period of time.OIIt depends on local grid codes for low distribution systems. In Chile is ± 10 % .
Frequency deviationAverage deviation of the frequency from its nominal value during a period of time.OIIt depends on local grid codes for low distribution systems. In Chile is ± 4 % .
Hours without energy (HWE)HWE within the community compared to the situation before the microgridII ( 0 ,   B m a x ) hours/month. Where B m a x are the hours per day that the community had no electricity before the microgrid (if apply)
Perception reliability and quality serviceCommunity perception about reliability and quality servicePI0%–100%
Microgrid ManagementCompliance maintenance planCompliance of the maintenance planII0%–100%
Mean time to repair (MTTR)Mean time to repairPI ( 0 ,   B m a x ) hours/event. Where B m a x depends on the particular conditions of the microgrid. For instance, in the case of Huatacondo, the technical support of the microgrid is located in Santiago. Then, if a critical event occurs, the MTTR is, at least, the time it takes the support team to flight to Huatacondo.

References

  1. Wang, J.-J.; Jing, Y.-Y.; Zhang, C.-F.; Zhao, J.-H. Review on multi-criteria decision analysis aid in sustainable energy decision-making. Renew. Sustain. Energy Rev. 2009, 13, 2263–2278. [Google Scholar] [CrossRef]
  2. Vera, I.; Langlois, L. Energy indicators for sustainable development. Energy 2007, 32, 875–882. [Google Scholar] [CrossRef]
  3. Word Bank. Energy Overview 2015. Available online: http://www.worldbank.org/en/topic/energy/overview (accessed on 30 October 2016).
  4. Martínez-Cid, R.; O’Neill-Carrillo, E. Sustainable microgrids for isolated systems. In Proceedings of the IEEE PES Transmission and Distribution Conference and Exposition, New Orleans, LA, USA, 19–22 April 2010.
  5. Prete, C.L.; Hobbs, B.F.; Norman, C.S.; Cano-Andrade, S.; Fuentes, A.; von Spakovsky, M.R.; Mili, L. Sustainability and reliability assessment of microgrids in a regional electricity market. Energy 2012, 41, 192–202. [Google Scholar] [CrossRef]
  6. Alvial-Palavicino, C.; Garrido-Echeverría, N.; Jiménez-Estévez, G.; Reyes, L.; Palma-Behnke, R. A methodology for community engagement in the introduction of renewable based smart microgrid. Energy Sustain. Dev. 2011, 15, 314–323. [Google Scholar] [CrossRef]
  7. Chatzimouratidis, A.I.; Pilavachi, P.A. Multicriteria evaluation of power plants impact on the living standard using the analytic hierarchy process. Energy Policy 2008, 36, 1074–1089. [Google Scholar] [CrossRef]
  8. Afgan, N.H.; Carvalho, M.G. Multi-criteria assessment of new and renewable energy power plants. Energy 2002, 27, 739–755. [Google Scholar] [CrossRef]
  9. Mamlook, R.; Akash, B.A.; Nijmeh, S. Fuzzy sets programming to perform evaluation of solar systems in Jordan. Energy Convers. Manag. 2001, 42, 1717–1726. [Google Scholar] [CrossRef]
  10. Meyar-naimi, H.; Vaez-zadeh, S. Sustainability Assessment of a Power Generation System Using DSR-HNS Framework. IEEE Trans. Energy Convers. 2013, 28, 327–334. [Google Scholar] [CrossRef]
  11. La Rovere, E.L.; Soares, J.B.; Oliveira, L.B.; Lauria, T. Sustainable expansion of electricity sector: Sustainability indicators as an instrument to support decision making. Renew. Sustain. Energy Rev. 2010, 14, 422–429. [Google Scholar] [CrossRef]
  12. Astier, M.; Masera, O.R.; Galván, Y. Evaluación de Sustentabilidad: Un Enfoque Dinámico y Multidimensional; Proyecto MESMIS: Valencia, España, 2008. [Google Scholar]
  13. Costa, P.M.; Matos, M.A. Economic Analysis of Microgrids Including Reliability Aspects. In Proceedings of the International Conference on Probabilistic Methods Applied to Power Systems, Stockholm, Sweden, 11–15 June 2006.
  14. Moldan, B.; Janoušková, S.; Hák, T. How to understand and measure environmental sustainability: Indicators and targets. Ecol. Indic. 2012, 17, 4–13. [Google Scholar] [CrossRef]
  15. United Nations. Chapter 2: Towards Sustainable Development. In Our Common Future; United Nations: Oslo, Norway, 1987. [Google Scholar]
  16. Lior, N. Sustainable energy development: The present situation and possible paths to the future. Energy 2008, 33, 842–857. [Google Scholar] [CrossRef]
  17. Nunes, B.; Alamino, R.C.; Shaw, D.; Bennett, D. Modelling sustainability performance to achieve absolute reductions in socio-ecological systems. J. Clean. Prod. 2015, 132, 32–44. [Google Scholar] [CrossRef]
  18. Office of Educator Preparation. OECD Environmental Indicators; Office of Educator Preparation: Paris, France, 2003. [Google Scholar]
  19. Global Reporting Iniative. Suatainability Reporting Guidelines; Global Reporting Iniative: Amsterdam, The Netherlands, 2013. [Google Scholar]
  20. United Nations Division for Sustainable Development. Indicators of Sustainable Development: Guidelines and Methodologies Indicators of Sustainable Development, 3rd ed.; United Nations: New York, NY, USA, 2007. [Google Scholar]
  21. Meyar-Naimi, H.; Vaez-Zadeh, S. Developing a DSR-HNS policy making framework for electric energy systems. Energy Policy 2012, 42, 616–627. [Google Scholar] [CrossRef]
  22. Feng, S.C.; Joung, C.B. An Overview of a Proposed Measurement Infrastructure for Sustainable Manufacturing. In Proceedings of the 7th Global Conference on Sustainable Manufacturing, Chennai, India, 2–4 December 2009.
  23. Kobayakawa, T.; Kandpal, T.C. Photovoltaic micro-grid in a remote village in India: Survey based identification of socio-economic and other characteristics affecting connectivity with micro-grid. Energy Sustain. Dev. 2014, 18, 28–35. [Google Scholar] [CrossRef]
  24. Liposcak, M.; Afgan, N.H.; Duic, N.; da Graca Carvalho, M. Sustainability assessment of cogeneration sector development in Croatia. Energy 2006, 31, 1940–1948. [Google Scholar] [CrossRef]
  25. Wang, J.J.; Jing, Y.Y.; Zhang, C.F.; Zhang, X.T.; Shi, G.H. Integrated evaluation of distributed triple-generation systems using improved grey incidence approach. Energy 2008, 33, 1427–1437. [Google Scholar] [CrossRef]
  26. Dialynas, E.; Member, S.; Hatziargyriou, N.D. Impact of Microgrids on Service Quality. In Proceedings of the Power Engineering Society General Meeting IEEE, Tampa, FL, USA, 24–28 June 2007.
  27. Parmenter, D. Key Performance Indicators, 2nd ed.; John Wiley and Sons: Hoboken, NJ, USA, 2010. [Google Scholar]
  28. Frangopoulos, C.; Keramioti, D. Multi-Criteria evaluation of energy systems with sustainability considerations. Entropy 2010, 12, 1006–1020. [Google Scholar] [CrossRef]
  29. Afgan, N.H.; da Graça Carvalho, M. Energy system assessment with sustainability indicators. Energy Policy 2000, 28, 603–612. [Google Scholar] [CrossRef]
  30. Palma-Behnke, R.; Ortiz, D.; Reyes, L.; Garrido, N. A Social SCADA Approach for a Renewable based Microgrid—The Huatacondo Project. In Proceedings of the IEEE PES Innovative Smart Grid Technologies, Washington, DC, USA, 16–18 January 2012.
  31. Mertz, B.; Kuijpers, L.; Solomon, S.; Andersen, S.O.; Davidson, O.; Pons, J.; de Jager, D.; Kestin, T.; Manning, M.; Meyer, L. Safeguarding the Ozone Layer and the Global Climate System: Issues Related to Hydrofluorocarbons and Perfluorocarbons; Cambridge University Press: Cambridge, UK, 2005. [Google Scholar]
  32. World Health Organization. 2012. Available online: http://www.who.int/docstore/peh/noise/Comnoise-4.pdf (accessed on 30 October 2016).
  33. Flavin, C.; Gonzalez, M.; Ochs, A.; da Rocha, M.; Tagwerker, P. Study on the Development of the Renewable Energy Market in Latin America and the Caribbean; Inter-American Development Bank: Washington, DC, USA, 2014. [Google Scholar]
  34. World Energy Outlook, IEA. 2015. Available online: http://www.worldenergyoutlook.org/weomodel/investmentcosts/ (accessed on 30 October 2016).
  35. Bartolini, M.; Gamberi, M.; Graziani, A.; Pilati, F. Economic and environmental bi-objective design of an off-grid photovoltaic–battery–diesel generator hybrid energy system. Energy Convers. Manag. Rev. 2015, 106, 1024–1038. [Google Scholar] [CrossRef]
  36. Yepez-Garcia, R.A.; Johnson, T.M.; Andrés, L.A. Meeting the Electricity Supply/Demand Balance in Latin America & the Caribbean; World Bank: Washington, DC, USA, 2010. [Google Scholar]
  37. Canese, M. La tarifa social de la energía América Latina y el Caribe; Organización Latinoamericana de Energía: Quito, Ecuador, 2013. [Google Scholar]
  38. Wei, M.; Patadia, S.; Kammen, D.M. Putting renewables and energy efficiency to work: How many jobs can the clean energy industry generate in the US? Energy Policy 2010, 38, 919–931. [Google Scholar] [CrossRef]
  39. OSHA Recommendations. Available online: https://www.osha.gov (accessed on 30 October 2016).
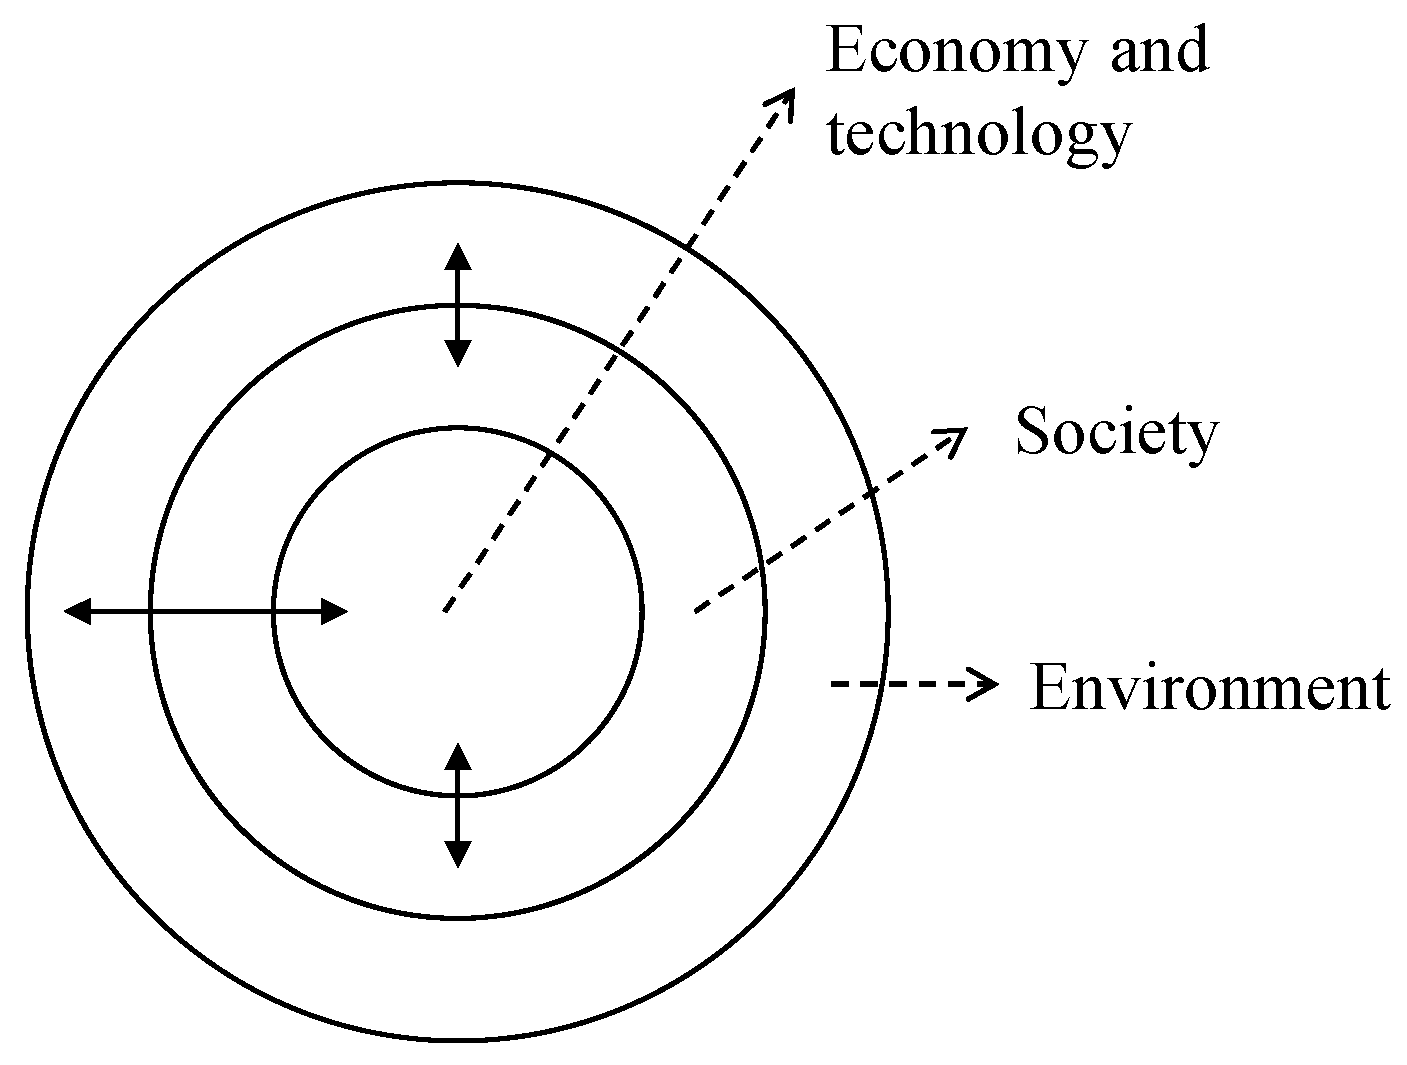
Figure 1. Approach to sustainability dimensions.
Sustainability 08 01163 g001
Figure 2. Areas of environmental indicators.
Sustainability 08 01163 g002
Figure 3. Areas of social indicators.
Sustainability 08 01163 g003
Figure 4. Areas of economic indicators.
Sustainability 08 01163 g004
Figure 5. Areas of technical indicators.
Sustainability 08 01163 g005
Figure 6. Calculation of the CSI.
Sustainability 08 01163 g006
Figure 7. Framework for monitoring the sustainable development of isolated microgrids.
Sustainability 08 01163 g007
Figure 8. Distribution chart of the Huatacondo.
Sustainability 08 01163 g008
Figure 9. Evolution of the sub-indexes.
Sustainability 08 01163 g009
Figure 10. Evolution of the CSI.
Sustainability 08 01163 g010
Figure 11. Comparison of CSI and diesel consumption.
Sustainability 08 01163 g011
Figure 12. Comparison of sub-indexes. (a) Without corrective measures and (b) With corrective measures.
Sustainability 08 01163 g012
Figure 13. Evolution of PV production, diesel consumption, and environmental sub-index throughout the study period.
Sustainability 08 01163 g013
Figure 14. Comparison of CSI with and without corrective measures.
Sustainability 08 01163 g014
Table 1. Considered indicators.
DimensionIndicatorDefinitionUnit
SocialElectrification levelHousehold with electricity service in Huatacondo%
TechnicalRatio of generation Ratio between renewable generation and fossil fuel generation%
Fuel consumed per energy producedTotal amount of fuel consumed divided by the total energy produced in the microgridL/kWh
Consumption comparisonComparison of the household average consumption with the region average%
Capacity factor of the photovoltaic (PV) panelsDefined as the ratio between the total amount of energy that the PV plant produced during a period of time and the amount of energy that the plant would have produced at full capacity over the same period of time%
Voltage deviationAverage deviation of the voltage from its nominal value during a period of timeV
Frequency deviationAverage deviation of the frequency from its nominal value during a period of timeHz
EnvironmentalCO2 emissionsCO2 total emissions per energy producedkg-CO2/kWh
EconomicFuel costFuel cost per energy produced$/kWh
Electricity cost comparison with the regionMicrogrid electricity cost compared with the costs of the region$/kWh
Table 2. Normalized value of the technical indicators.
Indicators of the Technical Dimension ( I i d ) Value in January 2011Lower Limit ( l l i d )Upper Limit ( u l i d )Normalized Value of the Indicator ( I ¯ i d ) (Non-Dimensional)
Ratio of generation [%]0.210.71.00, since I i d = 0.21 < l l i d = 0.7
Fuel consumed per energy produced [L/kWh]0.1910.050.180, since I i d = 0.191 > u l i d = 0.18
Consumption comparison [%]0.2501.0 0.25 0 1.0 0 = 0.25
Capacity factor of the photovoltaic panels [%]0.050.10.250, since I i d = 0.05 < l l i d = 0.1
Voltage deviation [V]0.0986600.1 0.1 0.09866 0.1 0 = 0.0134
Frequency deviation [Hz]0.0394600.04 0.04 0.09865 0.04 0 = 0.0135
Table 3. Considered indicators.
DimensionIndicatorWeighting Factor ( w i d ) of Indicator i from Dimension d
SocialElectrification level 1
TechnicalRatio of generation 1 6 = 0.167
Fuel consumed per energy produced 1 6 = 0.167
Consumption comparison 1 6 = 0.167
Capacity factor of the photovoltaic (PV) panels 1 6 = 0.167
Voltage deviation 1 6 = 0.167
Frequency deviation 1 6 = 0.167
EnvironmentalCO2 emissions 1
EconomicFuel cost 0.5
Electricity cost comparison with the region 0.5